Embed Size (px)
Citation preview

Examensarbete Civilingenjörsprogrammet i energisystem
Torrefaction of biomass – a comparative and kinetic study of thermal decomposition for Norway spruce stump, poplar and fuel tree chips Xun Luo
SLU, Institutionen för energi och teknik Examensarbete 2011:09 Swedish University of Agricultural Sciences ISSN 1654-9392 Department of Energy and Technology Uppsala 2011


SLU, Swedish University of Agricultural Sciences Faculty of Natural Resources and Agricultural Sciences Department of Energy and Technology Xun Luo Torrefaction of biomass – a comparative and kinetic study of thermal decomposition for Norway spruce stump, poplar and fuel tree chips Supervisor: Khanh-Quang Tran, Department of Energy and Technology, SLU Assistant examiner: Raida Jirjis, Department of Energy and Technology, SLU Examiner: Tord Johansson, Department of Energy and Technology, SLU EX0269, Degree project, 30 credits, Technology, Advanced E Master Programme in Energy Systems Engineering (Civilingenjörsprogrammet i energisystem) Examensarbete (Institutionen för energi och teknik, SLU) ISSN 1654-9392 2011:09 Uppsala 2011 Keywords: torrefaction, biomass, poplar, Fuel Tree Chips (FTC), stump, heating value, grindability, Kinetic study, activation energy, pre-exponential factor, reaction order, Scanning Electric Microscope(SEM) Online publication: http://stud.epsilon.slu.se Cover: Lab view of the experimental set-up for biomass torrefaction, photo by author.


Abstract
Stump biomass is energy rich and stump harvesting for use as fuel become more and more
interesting in Sweden. Swedish Forest Agency (2009) has estimated that stump harvesting in
Sweden would respond to an annual energy supply of 57 TWh/year. However, stump has not
been recognized as a bioenergy resource in Sweden. Suitable methods for pre-treatment of
stump are probably of great importance to make it accepted as fuel. It is therefore rewarding
to carry out an investigation in this area for stump.
This report represents results from a diploma project, which was aimed to develop a fixed bed
reactor for experimental study of biomass torrefaction, followed by TG analysis and kinetic
modelling employing Ozawa method and different kinetic models including one-step and
three-pseudo-component models. The focus was on Norway spruce stump. Two other types of
biomass, poplar and fuel tree chips were also included in the study for comparison.
The study has demonstrated that fuel properties, including heating values and grindability of
the investigated biomasses, were improved by torrefaction. The heating rate affects the
thermal decomposition process. In addition, SEM analysis indicated that the wood surface
structure was broken and destroyed by torrefaction process. Activation energy of untreated
and torrefied biomass were determined, being in good agreement with data in the literature.
Among the kinetic models tested, three-pseudo-components model with reaction order n ≠ 1
appears to be the best for simulating pyrolysis of untreated and torrefied biomass.


Sammanfattning
Biomassa, som är en förnyelsebar energikälla, är CO2-neutral. Till en viss del kan
fossila bränslen ersättas med denna energikälla och därmed minska CO2-utsläppen.
Bränslen från biomassa har dock, jämfört med fossila bränslen, lägre
bränslekvalitetsegenskaper såsom t.ex. högre fukthalt, lägre värmevärde och sämre
sönderdelningsbarhet. För att förbättra kvalitetsegenskaperna på rå biomassa kan
torrefiering användas som en förbehandlingsteknik. Torrefiering är en termisk
nedbrytningsprocess och kallas också för en mild pyrolysprocess, vilket innebär att
reaktionstemperaturen är relativt låg (från 200oC till 300oC) under den ca 30 minuter
långa reaktionstiden, som sker under inert atmosfär. Torrefieringsprocessen förbättrar
den råa biomassans kvalitet, minskar kostnaderna för transporter av biomassa samt gör
det enklare att lagra biomassa under längre tidsperioder.
Stubbar är energirika och intresset för att använda dessa som bränsle har ökat under
senare år. Skogsstyrelsen (2009) har uppskattat att stubbskörd skulle kunna ge en årlig
energitillförsel på 20,7 TWh då hänsyn även tas för gällande miljörestriktionen och
ekonomiska intressen. Tyvärr har stubbar ännu inte erkänts som en bioenergiresurs pga
att miljökonsekvenserna med storskalig stubbskörd inte är fastställda. Ur ett
bränslekvalitetsperspektiv är lämpliga metoder för förbehandling av stubbar av stor
betydelse för att öka acceptansen, då kvaliteten på detta sortiment är mycket varierande.
På grund av detta är det givande att genomföra en undersökning inom detta område för
stubbar.
I detta examensarbete presenteras resultat som syftar till utveckling av en
fastbäddsreaktor för experimentell studie av torrefiering av biomassa. Den torrefierade
biomassan har därefter även studerats genom, termogravimetrisk (TG) analys, kinetisk
modellering med Ozawa metod och olika kinetiska modeller såsom one-step och
three-pseudo-component modeller. Huvuddelen av biomassaproverna utgjordes av
granstubbar (Norway spruce), men även två andra typer av biomassa, stamved av
poppel och bränsle av träflis har studerats.

Studien har visat att bränslets egenskaper, inklusive värmevärde och
sönderdelningsbarhet, hos de undersökta biomassorna har förbättrats genom
torrefieringsprocessen. Det visades också att uppvärmningshastigeten påverkar den
termiska nedbrytningsprocessen. Dessutom visade SEM-analys att ytstrukturen på trä
bröts och förstördes av torrefieringsprocessen. Aktiveringsenergi av obehandlad och
torrefierad biomassa bestämdes vilken väl stämde överens med data från litteraturen.
Efter tester med olika kinetiska modeller, visade det sig att three-pesudo-components
modellen med reaktionsordning n≠1 ger bäst resultat för simulering av pyrolys av
obehandlad och torrefierad biomassa.

Nomenclature
P Poplar FTC Fuel Tree Chips
S spruce stump MC Moister content (%)
AC Ash content (%) HV Heating Value (MJ/kg)
Etorrefied the Energy of torrefied biomass Euntreated Energy of untreated biomass
mtorrefied the mass of torrefied biomass muntreated the initial mass of untreatedbiomass
Ed Energy desification
TGA Thermogravimetric analyzer SEM scanning electric microscope
TGA-curve: the thermogravimetric analysis which presents the change of conversion withtemperature
DTG-curve: the derivative thermogravimetic analysis which presents the decomposition rateduring pyrolysis
Ea activation energy (kJ/mol) A pre-exponential factor (s-1)
α conversion β heating rate(K/s)
Mi the initial mass M∞ the residual mass
Mt the mass of the sample at time t n reaction order
R gas constant (8.314 J/mol/K) T temperature (K or oC)
t time (s) C dimensionless factor


Contents
1 Introduction ............................................................................................................................. 7
2. Background ............................................................................................................................ 8
2.1 Biomass fuel ................................................................................................................. 8
2.2 Biomass torrefaction for energy application ................................................................ 8
2.3 Determination of activation energy (Ozawa method) ................................................ 13
2.4 Single reaction one step model................................................................................... 16
2.5 Model with independent parallel reactions (Three-pseudo-components model) ....... 17
3 Experimental ......................................................................................................................... 18
3.1 Equipment setup for biomass torrefaction ................................................................. 18
3.2. Torrefaction procedure .............................................................................................. 20
3.3 Instruments and analytical methods ........................................................................... 21
3.4 Material ...................................................................................................................... 21
3.5 Torrefaction conditions .............................................................................................. 22
4 Results ................................................................................................................................... 23
4.1 Torrefaction solid products ........................................................................................ 23
4.2 Mass and energy balance............................................................................................ 25
4.3 Grindability ................................................................................................................ 26
4.4 Non-isothermal decomposition of biomass in nitrogen ............................................. 28
4.4.1 TGA and DTG curves of untreated biomass ............................................................... 28
4.4.2 Influence of heating rate on the data collected from TGA.......................................... 31
4.4.3 Effect of torrefaction temperature............................................................................... 32
4.5 Kinetic parameters determination by Ozawa method ................................................ 35
4.6 Kinetic models for non-isothermal decomposition of biomass.................................. 37
4.6.1 One-step model ........................................................................................................... 37
4.6.2 Three-pseudo-components model................................................................................ 37
4.6.3 Comparison of simulation of thermal decomposition of different biomasses by
different models.................................................................................................................... 39
5 Concluding remarks .............................................................................................................. 42
6 Acknowledgement................................................................................................................. 44
7 References ............................................................................................................................. 45
8 Appendix ............................................................................................................................... 48
Appendix 1 ....................................................................................................................... 48

Appendix 2 ....................................................................................................................... 51
Appendix 3 ....................................................................................................................... 54
Appendix 4 ....................................................................................................................... 57
Appendix 5 ....................................................................................................................... 61
Appendix 6 ....................................................................................................................... 63
Appendix 7 ....................................................................................................................... 65
Appendix 8 ....................................................................................................................... 67
Appendix 9 ....................................................................................................................... 69
Appendix 10 ..................................................................................................................... 71
Appendix 11 ..................................................................................................................... 73

7
1 Introduction
The use of biomass for heat and power generation contribute is CO2-neutral, considering that
CO2 emission from combustion of biomass is just equal to that taken up by the plant during its
growing. However, biomass fuel has inferior fuel properties, including for example low bulk
density, high moisture content and low heating value compared to fossil fuels. These make
bioenergy alternative technically difficult and economically less competitive. It is therefore a
common practice to apply pre-treatment for biomass fuel.
According to the report made by Erik A. (2010) [8] the use of Norway spruce stump as fuel
resource become more and more interesting in Sweden. It was reported that stump is energy
rich and the Swedish Forest Agency (2009) has estimated that stump harvesting would
respond to an annual energy supply of 57 TWh/year in Sweden. However, stump has not been
recognized as a bioenergy resource. Suitable methods for pre-treatment of stump are probably
of great importance to make it accepted as fuel. It is therefore rewarding to carry out an
investigation in this area for stump.
This project was aimed to develop a fixed bed reactor for experimental study of biomass
torrefaction, followed by thermogravity analysis and kinetic modelling. The focus was on
Norway spruce stump. Two other types of biomass, poplar and Fuel Tree Chips (logging
residues) were also included in the study for comparison. Poplar sample was taken from
Helendala in southern Sweden [10]. Fuel Tree Chips (FTC) were received from Vattenfall AB
which collected from the local Swedish sawmill industry and paper industry. The FTC was
fresh and consisted of different types of clean chips with dimension of 20x40x3 (mm)
approximately. [11]

8
2. Background
2.1 Biomass fuel
Using renewable energy resources is increasingly necessary to solve the world energy demand
and reduce the greenhouse emission. Biomass as one of the renewable energy resources can
be utilized as fuel for energy production. Currently, the definition of biomass fuel is very
broad, but usually the major type of biomass fuel could consider as forest biomass, residues of
the forest industries, recycled wood, energy crops.
Hemicelluloses, celluloses and lignin are the main components of lignocellulosic plant
biomass. Hemicelluloses are formed by chain of mono-sugars, mainly xylose and comprise 25%
to 35% of the dry weight of plant biomass [8,12]. Cellulose is a polymer composed of glucose
chain and constitutes about 40% to 50% of woody plant mass [8,12]. Lignin is a
phenylpropane polymer that gives a very strong strength to hold together the cellulose and
hemicelluloses components of woody biomass. It makes up 15% to 25% of the weight of
wood biomass. [8,12]
Compared with coal, untreated biomass fuels have high moisture contents, relatively low
heating values, inhomogeneous and relatively low bulk density, and poor grindability. Due to
these inferior fuel properties, using raw woody biomass material as a fuel entails many
problems for combustion and gasification. During gasification for example hemicelluloses in
biomass produces tar which may consequently poison catalyst used for Fischer-Tropsch (FT)
synthesis of liquid fuel. In addition, the low bulk density of biomass makes it expensive to
transport and difficult to feed into utilisation system, considering the level of atomization of
the hydraulic feeding systems. For these reasons, pre-treatments are usually applied for
biomass in order to improve its fuel properties for combustion and co-firing with coal.
Torrefaction is one of emerging technology for this purpose, which is believed to have a high
level of feasibility, both technically and economically.[14-17]
2.2 Biomass torrefaction for energy application
Torrefaction is a thermochemical treatment of biomass and may be defined as a mild
pyrolysis process, which involves heating of the feedstock at moderate temperatures under an

9
inert atmosphere [2,3]. Figure 1 shows a typical torrefaction batch process. The total
torrefaction process consists of drying, torrefaction and cooling. At beginning of the process
the moisture in the biomass is released by drying. When the temperature of biomass ranges
between 200oC to 300oC, only in this temperature range, the torrefaction decomposition
reactions occur.
Three time temperature phases are recognised in torrefaction window. The reaction time of
torrefaction is defined as the sum of heating time from 200oC to desired temperature plus
reaction time /holding time at desired torrefaction temperature (ttor,h + ttor ) and the duration of
the torrefaction stage is around 30 minutes. After torrefaction, the last stage is cooling the
biomass from 200oC to the ambient temperature.
Figure 1: Heating stage of drying biomass during a typical torrefaction batch process.[2]Explanation: Ttor: Torrefaction temperature. th: heating time to drying. tdry: drying time. th.int: intermediate heating
time to torrefaction. ttor : Reaction time/holding time at desired torrefaction temperature (Ttor). ttor.h: Heating time
from 200oC to desired temperature Ttor. ttor.c: Cooling time from Ttor to 200oC. tc: cooling time to ambient
temperature.
Figure 2 shows a decomposition regime of biomass torrefaction [2,3]. During torrefaction of
lignocellulosic biomass, mainly hemicelluloses are decomposed, corresponding to the scarlet
colour and orange colour regions. Lignin and cellulose may also be partly decomposed at

10
relatively higher temperatures within the temperature range for biomass torrefaction, but to a
less degree as showed in Figure 2.
Figure 2: Decomposition regimes are based on Koukios et, Al. 1982 [4]. The Scarlet colour
region (E): carbonisation and extensive devolatilization. The orange colour region (D): limited devolatilization
and carbonisation. The yellow colour region(C): depolymerisation commences
Similar to pyrolysis, the chemical structure of plant biomass is changed during the
torrefaction. Biomass torrefaction results in products found in three phases: solid, liquid, and
gas. The solid is the main product of biomass torrefaction and also called torrefied biomass
which has very low moisture contents and high caloric values. By cooling the exhaust gas
from biomass torrefaction, liquid of yellowish colour is obtained from condensable gases.
Non-condensable gases leave the process in the gas phase, which include carbon monoxide,
carbon dioxide and little amount of methane.[2-4]
Figure 3 explains the concept of energy densification of biomass fuel by torrefaction. [2]
Typically, 70% of the feed mass is retained after torrefaction as solid products (torrefied
biomass) which contained 90% of initial energy. The rest of 30% of the feed mass is
converted to the gas products, but the energy contains only 10% of the initial energy. The
energy densification Ed could be used to prove the energy density of torrefied solid product is

11
increased by torrefaction; in this case the energy density of torrefied biomass increases by
factor 1.3.
Figure 3: Typical mass and energy balance of torrefaction process [2]
Energy densification could be expressed as Equation (1)
torr
torrd M
E (1)
whereηtorr: energy of the torrefied biomass in percentage of initial energy
Mtorr : mass of torrefied biomass in percentage of feed biomass
Energy of the torrefied biomass in percentage of initial energy could express as Equation (2)
untreated
torrifiedtorr E
E (2)
where Etorrefied is the energy of torrefied biomass and Euntreated is the energy of feed biomass
which could be calculated by Equations (3) and (4)
torrefiedtorrefiedtorrefied mHHVE * (3)
untreateduntreateduntreated mHHVE * (4)
where HHVuntreated is high heating value of untreated biomass and HHVtorrefied is high heating
value of torrefied biomass. Both are determined by bomb calorimeter 6300 Oxygen.
The mass of torrefied biomass in percentage of initial mass could express as Equation (5):

12
untreated
torrefiedtorr m
mM (5)

13
2.3 Determination of activation energy (Ozawa method)
Ozawa method is one of the several methods for extraction of the kinetic parameters from
TGA data. The advantage is that it is a very simple method to calculate the activation energy
without knowing the information about the reaction mechanism, but it can be only used for
one-step reaction. [31]
Basically, the function of the rate of decomposition during a reaction can be expressed as
following as equation (6), which depends on the temperature and conversion [31-34]: e.
= ( , ) (6)
where t is the time. T is absolute temperature and α is conversion.
The iso-conversional method [18-21,23,24] is used and assumed that the function in equation
(6) can be rewrite by two functions, which are independent of each other.
= ( ) ∗ ( ) (7)
where the first function ( ) is dependent on the absolute temperature and the second
function ( ) is dependent on the conversion α.
The first function ( ) in equation (7) can be expressed by Arrhenius equation:
( ) = (8)
where Ea is the activation energy. A is the pre-exponential factor. R stands for the gas
constant and T is the absolute temperature.
The second function ( ) in equation (7) can be expressed by various possibilities. For this
study the form in ( ) is used as following Equation (9)
( ) = (1 − ) (9)

14
where f (α) is conversion function and depends on the reaction mechanism, n is reaction
order and α is the conversion, define as
= ( )( ) (10)
Combining (7) and (8) gives
= ∗ ( ) (11)
Equation (11) can be rewritten as
( ) = ∗ (12)
Equation (12) can be solved by integrating its both sides
∫ ( ) = ∫ (− ) (13)
where α0 is the value of α at t = t0
If the heating rate β is constant, the relation between temperature and time could be written as
= + → = → = (14)
The change in α is given by equation (14)
∫ ( ) = ∫ − (15)
where T0 is the value of T at t=t0
The left side in equation (13) can be rewritten

15
( ) = ∫ ( ) = ∫ − (16)
The rate of reaction is very low at low temperature which means the lower limit of the
temperature may be ignored if T0 is well below the temperature at which the rate of reaction
becomes measurable. [31,35,36]
The right side in equation (13) can be rewritten as
∫ − = ∫ − (17)
The value of the right side in Equation (17) can be expressed by C. Dolye’s linear
approximations [36] as the following function (18)
= ∫ − (18)
So if the Ea/RT is bigger than 20[36], the can be approximated by the following
formulalog p ≅ −2,315 − 0,4567 (19)
Combining Equations (16) and (18) gives
( ) = ∫ ( ) = ∫ − = (20)
By the integral iso-conversional method and Dolye’s linear approximations Equation (20) can
be rewritten
log F( ) ≅ log − log −2,315 − 0,4567 (21)
The Ozawa proved if the value of α and single value of f(α) are given, the left side of equation
(21) which is F(α) will give a constant value which does not depend on the heating rate. [27]

16
Thus from Equation (16) gives
( ) = ∫ ( ) = ∫ − => ( ) = ∫ ( ) = ∫ − = 1log F( ) ≅ 0
Then Equation (21) can be rewritten to obtain Equation (22)
log β ≅ log −2,315 − 0,4567 (22)
It has been proved that for a constant degree of conversion α. Ea is related to the heating rate
β and the temperature by Equation (23): [31]
− log − 0,4567 = − log − 0,4567 (23)
According to Equation (23), a plot of log versus T −1 gives a straight line, whose slope and
intercept can be used to determine Ea at any given conversion α. Then it can calculate the pre-
exponential factor A from the equation (22).
2.4 Single reaction one step model
In order to calculate the reaction order n for one step model the rate of conversion can be
described by Equation (24) which is resulted from combination of Equation (7) (8) and (9).
= ∗ ( ) = ∗ (1 − ) (24)
If the activation energy Ea is determined using Ozawa method, the reaction order n and pre-
exponential factor A can be calculated by non-linear least square fitting. [19]

17
2.5 Model with independent parallel reactions (Three-pseudo-
components model)
Alternatively, three-pseudo-components models developed by Varhegyi and co-workers
[18,38,39], can be used to extract kinetic parameters from TGA data. This model may offer
better fit to the experimental data, considering that plant biomass is composed of three main
components. Hemicelluloses, lignin and cellulose, with different reactivity for pyrolysis and
thus more than one reaction may be involved. According this model the pyrolysis rate can be
determined by Equation (25).
)()exp(3
1
3
1i
i
i iii
i fRTEaAc
dtd
dtd
(25)
Depend on the reaction order n. the following kinetic equations can be used for each pseudo- -
-component
)27(1,1)exp(1*)exp(*
)1(*)exp(
)26(1,)exp(exp*)exp(*
)1(*)exp(
1
0
0
i
nn
T
Tiiii
ii
ni
iii
i
i
T
Tiii
ii
ni
iii
i
ndTRTEaAn
RTEaAC
RTEaAC
dtd
ndTRTEaA
RTEaAC
RTEaAC
dtd
i
i
i
i
The unknown parameters of the model such as activation energy Eai, pre-exponential factor Ai,
reaction order ni and dimensionless factor Ci are determined by the evaluation of the
experimental data by non-linear least square fitting.

18
3 Experimental
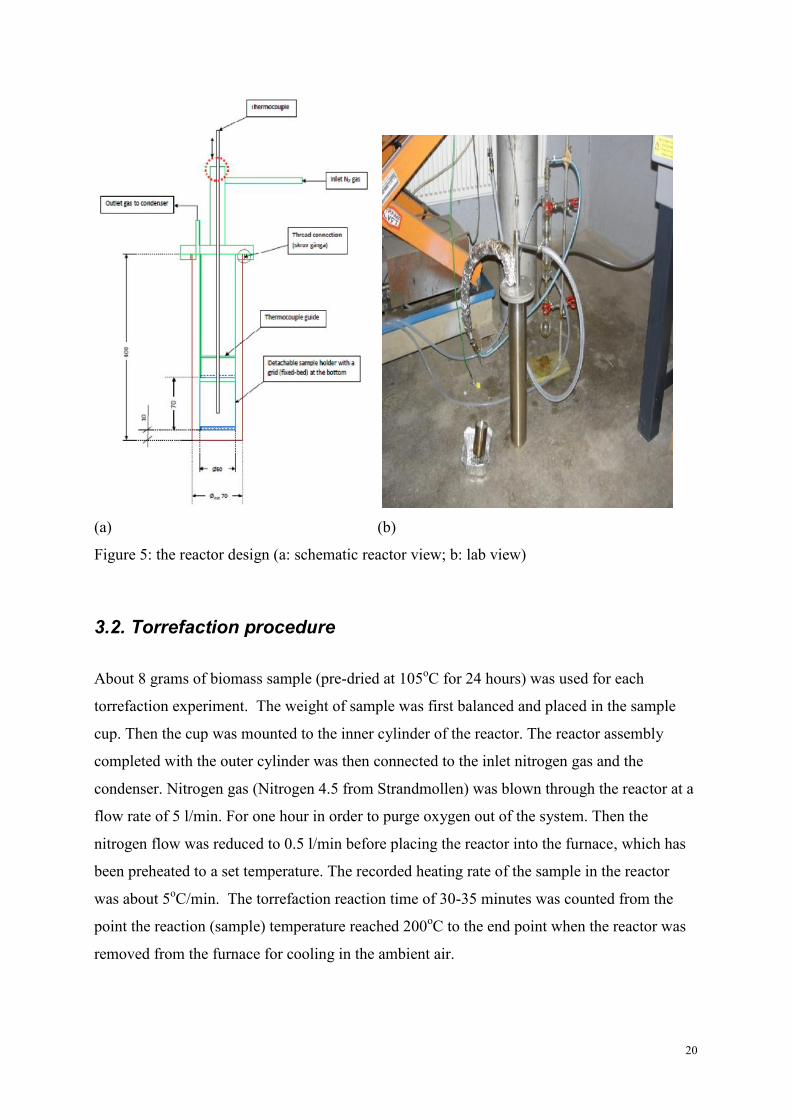
3.1 Equipment setup for biomass torrefactionFig 4 represents the experimental setup used for biomass torrefaction in this study, which
includes a tubular reactor placed in an electric muffle furnace, a nitrogen gas supply system
with a heating element for gas preheating, and a condenser connected to outlet of the reactor.
The reactor (figure 5) made of stainless steel has been designed to fit the existing furnace,
Nabertherm LH 30/12, which can be operated within a temperature range of 30-3000oC, the
main body of the reactor about 400mm long, consisting of two cylinders which are assembled
together by a sealed mechanism on the top end as shown in Fig. 5a. The diameter of outer
cylinder tube (red colour part with a closed end at the bottom) is 70mm and the inner cylinder
tube (Fig. 5a green colour part with an opened end at the bottom) diameter is 50mm. A
removable sample cup (Fig. 5a. blue colour part) with a fixed bed (stainless steel grind) at the
bottom is mounted to the lower end of the inner cylinder as can also be seen in Fig. 2b. A
thermocouple (Type K) equipped with a digital thermometer was used to monitor the samples
temperature during torrefaction process, which is controlled by the furnace temperature
through the control panel unit integrated to the furnace. The thermocouple is introduced into
the reactor from the top as shown in Figure 4 and Fig 5, and measures temperature in the
middle of the sample cup.

19
(a)
(b)
Figure 4: The experimental set-up for biomass torrefaction (a: schematic view; b: lab view)
Cooling waterin
Cooling waterout
Exhaustgas
K- Type Thermocoupleand Digital Thermometer
Control panel of thefurnace, Tf
Electric furnace
N2 gasbottle
20
(a) (b)
Figure 5: the reactor design (a: schematic reactor view; b: lab view)
3.2. Torrefaction procedure
About 8 grams of biomass sample (pre-dried at 105oC for 24 hours) was used for each
torrefaction experiment. The weight of sample was first balanced and placed in the sample
cup. Then the cup was mounted to the inner cylinder of the reactor. The reactor assembly
completed with the outer cylinder was then connected to the inlet nitrogen gas and the
condenser. Nitrogen gas (Nitrogen 4.5 from Strandmollen) was blown through the reactor at a
flow rate of 5 l/min. For one hour in order to purge oxygen out of the system. Then the
nitrogen flow was reduced to 0.5 l/min before placing the reactor into the furnace, which has
been preheated to a set temperature. The recorded heating rate of the sample in the reactor
was about 5oC/min. The torrefaction reaction time of 30-35 minutes was counted from the
point the reaction (sample) temperature reached 200oC to the end point when the reactor was
removed from the furnace for cooling in the ambient air.

21
During torrefaction process, volatile compounds were released from the samples, following
the stream and collected in the condenser system. Non-condensable gases were released into a
safe exhaust ventilation system. The solid product left in the sample cup after the torrefaction
was collected and saved in an excicator for further analyses.
3.3 Instruments and analytical methods
The moisture content and ash content were determined by Swedish standard methods [5-7].
The heating value of samples was obtained by a bomb calorimeter from Parr Instrument
model 6300 Oxygen, according to the Swedish standard method [8]
Untreated biomass samples was ground by a cutting-knife mill (Retsch SM 2000), integrated
with a mesh sieve allowing particles smaller than 25 µm through it.
A burr grinder machine Krup’s GVX2 was used for grindability analysis of torrefied biomass.
After grinding, the powder of samples was sieved by sieve shaker machine (Retch SV001)
with four size fraction: <0.8 mm, 0.8~1 mm, 1~1.4 mm and >1.4 mm.
A thermogravimetric analyzer (TGA) from Perkin Elmer (Pyris 1) was employed for studying
thermal decomposition of torrefied biomass in nitrogen. The function of TGA was to measure
and record the dynamics of samples weight loss with increasing temperature or time. The
volume flow of nitrogen was set up 40 ml/min for each running. The initial mass of sample
was used in a range of 6-8 mg and the temperature decomposition ranged in TGA from 25oC
to 600oC with the heating rate at 10 K/min. 20 K/min and 40 K/min.
3.4 Material
Three types of biomass were used as feedstock for torrefaction in this study. They were
Norway spruce stump (hereafter called stump – S), poplar (P) and Fuel Tree Chips (FTC)
from Vattenfall AB. Some fuel properties of the three samples are presented in Table 1, as
results of an approximate analysis using Swedish standard method [5-7]. The poplar sample
and stump had been dried in ambient air and stored indoor for 26 months. So the moisture

22
contents of these samples were very low compared with the fresh Fuel Tree Chips as can be
seen in Table 1.
Table 1: Approximate analysis of the material investigated
Sample Moisture content (%) Ash content (%) HHV(MJ/kg)
Poplar 8.91 1.10 19.25
Fuel Tree Chips 37.86 2.49 19.39
Spruce Stump 7.06 8.14 20.55
Method SS 187170 SS 187171 SS 187182
HHV= Higher heating value
3.5 Torrefaction conditions
Different torrefaction conditions were designed for the present study and presented in Table 2.
The reaction temperature was at 200oC. 250oC and 300oC and the holding time at each
reaction temperature were 5 and 10 minutes, giving two values (30 and 35 minutes.
respectively) of the total reaction time for each reaction temperature.
Nitrogen gas with a constant gas flow of 0.5 l/min was introduced and maintained in the
reactor during the experiments.
Table 2: Different treatments of the investigated biomass at different torrefaction conditions
Temprature(oC) 200 250 300
Holding time 5min 10min 5min 10min 5min 10min
Sample
Poplar P_A5 P_A10 P_B5 P_B10 P_C5 P_C10
Fuel Tree Chips FTC_C5 FTC_10
Stump S_A5 S_A10 S_B5 S_B10 S_C5 S_C10

23
4 Results
4.1 Torrefaction solid products
Figure 6 shows solid products collected from biomass torrefaction in different conditions
presented in Table 2. It is clear that torrefaction temperature had very strongly effect on the
colour of the solid products. The higher the temperature, the darker the product colour was.
However, the reaction time seemed to have less pronounced effect on the colour of the
products. The colour of biomass torrefied at 200oC was light brown. At 250oC the colour
became brown. At 300oC the colour was dark brown. In addition, the solid product collected
from biomass torrefaction at 300oC was every brittle.
(a) Torrefied poplar samples

24
(b) Torrefied FTC samples
(c) Torrefied stump samples
Figure 6: Solid products collected from torrefaction of biomass in different conditions
24
(b) Torrefied FTC samples
(c) Torrefied stump samples
Figure 6: Solid products collected from torrefaction of biomass in different conditions
24
(b) Torrefied FTC samples
(c) Torrefied stump samples
Figure 6: Solid products collected from torrefaction of biomass in different conditions

25
4.2 Mass and energy balance
Table 3 presents the mass of solid biomass before and after torrefaction process, and the
heating value of the solid products collected from the torrefaction processes. It was calculated
that the mass loss of the solid by torrefaction was about 34% for the torrefaction in conditions
of the highest temperature (300oC) and the longest reaction time (35 minutes. corresponding
to the holding time at this temperature of 10 minutes). In addition, the mass loss increased
with reaction temperature and/or time. At the same reaction temperatures longer holding times
resulted in more mass losses. For the same reaction time, higher reaction temperatures also
resulted in more mass losses.
Table 3: Collected data for mass and energy balance calculationTemprature(oC) 200 250 300
Reaction time 30min 35min 30min 35min 30min 35min
Mass of biomass sample before torrefaction (g)
Poplar 7.99 8.04 8.02 8.03 8.01 7.99Fuel Tree Chips 8.00 8.02
Stump 7.99 8.02 7.98 7.99 8.01 8.02Mass of biomass sample after torrefaction (g)
Poplar 7.57 7.45 7.04 6.95 4.99 4.56Fuel Tree Chips 5.65 5.11Stump 7.68 7.55 7.19 6.95 5.52 5.24
HHV(MJ/kg)
Poplar 19.05 19.10 19.72 19.82 21.65 22.12
Fuel Tree Chips 21.11 21.64
Stump 20.15 20.30 21.07 21.08 22.70 23.01
Diemnsionless energy densification factor
Poplar 0.98 0.99 1.02 1.03 1.12 1.15Fuel Tree Chips 1.09 1.12
Stump 0.98 0.99 1.025 1.026 1.10 1.12
As can be seen in Table 3, the heating values of torrefied biomass increased with increasing
reaction time and/or temperature. The solid collected from biomass samples torrefied at 300oC
for 10 minutes had the highest heating value and the heating value increases with 14% for
poplar and 12% for both Fuel Tree Chips and stump comparing with the untreated biomass.
The energy densification of the torrefaction processes was calculated and the results are
presented in Figure 7, which shows that the energy density of solid product (torrefied biomass)
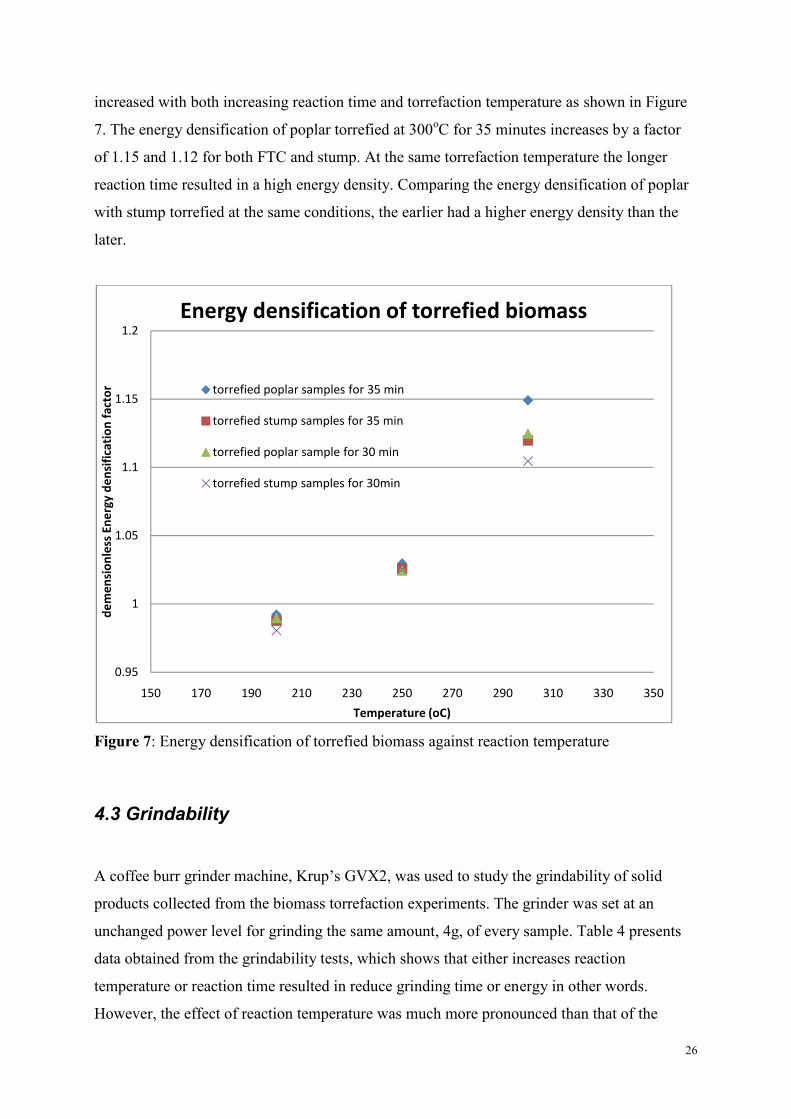
26
increased with both increasing reaction time and torrefaction temperature as shown in Figure
7. The energy densification of poplar torrefied at 300oC for 35 minutes increases by a factor
of 1.15 and 1.12 for both FTC and stump. At the same torrefaction temperature the longer
reaction time resulted in a high energy density. Comparing the energy densification of poplar
with stump torrefied at the same conditions, the earlier had a higher energy density than the
later.
Figure 7: Energy densification of torrefied biomass against reaction temperature
4.3 Grindability
A coffee burr grinder machine, Krup’s GVX2, was used to study the grindability of solid
products collected from the biomass torrefaction experiments. The grinder was set at an
unchanged power level for grinding the same amount, 4g, of every sample. Table 4 presents
data obtained from the grindability tests, which shows that either increases reaction
temperature or reaction time resulted in reduce grinding time or energy in other words.
However, the effect of reaction temperature was much more pronounced than that of the
0.95
1
1.05
1.1
1.15
1.2
150 170 190 210 230 250 270 290 310 330 350
dem
ensi
onle
ss E
nerg
y de
nsifi
cati
on fa
ctor
Temperature (oC)
Energy densification of torrefied biomass
torrefied poplar samples for 35 min
torrefied stump samples for 35 min
torrefied poplar sample for 30 min
torrefied stump samples for 30min

27
reaction time. In addition, among the three biomass types (torrefied at 300oC), the grinding
time of the stump was the longest, followed by poplar then the fuel tree chip. This observation
can be probably explained by the higher lignin content in the stump than in poplar and the fact
that the Fuel Tree Chips might contain softwood with relatively low lignin content.
Table 4: Time/energy saving during comminution of torrefied biomass
Sample ID Grinding time. S
P_B5 (250oC. 30min) 75
P_B10 (250oC. 35min) 72
P_C5 (300oC. 30min) 15
P_C10 (300oC. 35min) 12
FTC_C5 (300oC. 30min) 18
FTC_C10 (300oC. 35min) 15
S_B5 (250oC. 30min) 92
S_B10 (250oC. 35min) 90
S_C5 (300oC. 30min) 40S_C10 (300oC. 35min) 30
For further evaluation of the grindability for the solid products, the powder samples collected
from the grinding step were sieved and classified in four size fractions: <0.8 mm. 0.8~1 mm.
1~1.4 mm and >1.4 mm. Figure 8 shows the particle size distribution by mass fraction for the
tests.

28
Figure 8: Particle size distributions of torrefied biomass ground by a coffee grinder
From Figure 8 it can be seen that more than 70% of the mass for all biomasses torrefied at
300oC with different reaction time were gone through the 0.8 mm sieve. Less than 60% of the
stump torrefied at 250oC and 40% of the poplar torrefied at 250oC pass through the 0.8 mm
sieve. At the same reaction temperature, the longer the reaction time, the more improved
grindability of the torrefied biomass was.
4.4 Non-isothermal decomposition of biomass in nitrogen
4.4.1 TGA and DTG curves of untreated biomass
Non-isothermal decomposition of the three untreated biomass samples was investigated in
nitrogen of a mass flow rate of 40 ml/min and at three heating rates of 10, 20, and 40 K/min,
using the TGA described earlier. Data collected from this investigation is shown in Figure 9
in the form of weight loss plotted against temperature, TGA curves, from which the weight
loss rates can be extracted and presented as DTG (differential thermogravimetry) curves.
0
10
20
30
40
50
60
70
80
90
100
<0,8mm 0,8~1mm 1~1,4mm >1,4mm
mas
s fr
acti
on(%
)
Particle size (mm)
Particle Size DistributionP_B5
P_B10
P_C5
P_C10
FTC_C5
FTC_C10
S_B5
S_B10
S_C5
S_C10

29
0
0.1
0.2
0.3
0.4
0.5
0.6
0.7
0.8
0.9
1
0
0.1
0.2
0.3
0.4
0.5
0.6
0.7
0.8
0.9
1
300 400 500 600 700 800 900
dim
ensi
onle
ss c
onve
rsio
n 1-
α
temperature (K)(a)
Poplar
FTC
Stump
DTG
,mg/
s
0
0.2
0.4
0.6
0.8
1
1.2
1.4
1.6
1.8
2
0
0.1
0.2
0.3
0.4
0.5
0.6
0.7
0.8
0.9
1
300 400 500 600 700 800 900
DTG
(mg/
s)
Temperature (K)(b)
Poplar
FTC
Stump
Dim
ensi
onle
ssco
nver
sion
1-α

30
Figure 9: TGA and DTG curves of three different untreated biomasses at different heating ratewith nitrogen gas flow 40ml/min (a: 10K/min; b: 20K/min; c: 40K/min)
As can be seen in Figure 9, there are two peaks for each DTG curve. The first tiny peak
occurred at 400 K, corresponding to the drying step. The second peak, being the main weight
loss step, started at temperature of around 500 K, responsible for the thermal decomposition
of biomass. The shoulder at the lower temperature side of the main peak is believed to
represent the decomposition of hemicelluloses [27,28,29]. This shoulder seemed missing for
the stump, which indicates that stump biomass contained less hemicelluloses than the other
biomass fuel types under investigation.
At the heating rate of 10 K/min, Figure 9(a), the maximum decomposition rates was about
0.79 mg/s. 0.56 mg/s and 0.70 mg/s, which were observed to occur at 651 K, 661 K and 649
K for poplar, FTC and stump, respectively. Comparing the DTG curves of the three biomasses
one can see that poplar had relatively higher values of maximum pyrolysis rate and FTC had
relatively lower values of maximum pyrolysis rate.
When the heating rate increased to 40 K/min, Figure 9(c), the value of maximum pyrolysis
rate of all three samples increased to 2.61mg/s, 2.38 mg/s and 2.62 mg/s and the maximum
point rates of decomposition occurred at 675 K, 690 K and 685 K for poplar, FTC and stump
respectively. Again, comparing the DTG curves of the three biomasses at heating 40K/min
one can see that the FTC had relatively higher values of maximum pyrolysis rate and stump
0
0.5
1
1.5
2
2.5
3
0
0.1
0.2
0.3
0.4
0.5
0.6
0.7
0.8
0.9
1
300 400 500 600 700 800 900
Temperature (K) (c)
Poplar
FTC
Stump
Dim
ensi
onle
ssco
nver
sion
1-α
DTG
, mg/
s

31
has relatively lower values. The maximum pyrolysis rate of FTC increased significant by
increasing the heating rate.
4.4.2 Influence of heating rate on the data collected from TGA
The data presented in the previous section was rearranged, Figure 10, for an analysis of
effects of heating rate on the data collected from the TGA. As can be seen in Figure 10, TGA-
and DTG-curves of individual untreated biomass at different heating rates look quite similar
with some common features. In general, higher heating rates gave higher conversion or
weight loss rates. In addition, when the heating rate increases, the TGA-curves shifted toward
the right and the peaks of DTG curves are slightly shifted towards higher temperatures.
0
0.5
1
1.5
2
2.5
3
0
0.1
0.2
0.3
0.4
0.5
0.6
0.7
0.8
0.9
1
300 400 500 600 700 800 900
Dim
ensi
onle
ss c
onve
rsio
n 1-
α
Temperature,K(a)
10 K/min20 K/min40K/min
DTG
, mg/
s

32
Figure 10: TGA and DTG curves of different untreated biomasses at heating rates 10K/min,
20K/min and 40K/min with nitrogen gas flow 40ml/min (a: poplar; b: FTC; c: stump)
4.4.3 Effect of torrefaction temperature
TGA and DTG curves collected at the heating rate of 40 K/min. for untreated and torrefied
stump samples are showed in Figure 11. Clearly, untreated biomass was more reactive than its
torrefaction products. In addition, the TGA curves of torrefied samples shifted towards the
right with increasing torrefaction temperature, giving the DTG peaks shifting slightly away
0
0.5
1
1.5
2
2.5
3
0
0.1
0.2
0.3
0.4
0.5
0.6
0.7
0.8
0.9
1
300 400 500 600 700 800 900
DTG
(mg/
s)
Temperature(K) (b)
10K/min
20K/min
40K/min
Dim
ensi
onle
ssco
nver
sion
1-α
0
0.5
1
1.5
2
2.5
3
0
0.1
0.2
0.3
0.4
0.5
0.6
0.7
0.8
0.9
1
300 400 500 600 700 800 900Tmeperature (K)
(c)
10K/min
20K/min
40K/min
Dim
ensi
onle
ss c
onve
rsio
n 1-
α
DTG
, mg/
s

33
from the left to the right as well, but the peak height decreases with increasing torrefaction
temperature, except for the sample torrefied at 300 C.
Figure 11: TGA and DTG curves of untreated and torrefied stump samples at the heating rate
of 40 K/min in nitrogen of a gas flow rate of 40 ml/min
In order to have a better understanding of physical changes of biomass sample during
torrefaction samples of untreated stump and stump torrefied at different temperatures were
examined by means of a scanning electro-microscopy (SEM). Figure 12 presents SEM
pictures of untreated (a) and torrefied (b and c) stump samples. Increasing number of the
openings on the surface of the examined samples (Fig. 12a and 12b) can be attributed to the
way gas products released during torrefaction broke the biomass structure in order to escape
outward. In addition, the biomass structure was broken more severely with increasing
torrefaction temperature (Fig. 12b and 12c)
0
0.5
1
1.5
2
2.5
3
0
0.1
0.2
0.3
0.4
0.5
0.6
0.7
0.8
0.9
1
300 400 500 600 700 800 900
dim
ensi
onle
ss c
onve
rsio
n (1
-α)
temperature (K)
TGA and DTG curves of untreated and torrefied Stump at heating rate
40K/min
Untreated stump sample
torrefied stump 200oC
torrefied stump 250oC
torrefied stump 300oC
DTG
,mg/
S

34
(a)
(b)
(c)Figure 12. SEM pictures of untreated stump sample and torrefied stump samples (a:Untreated stump sample; b: Stump torrefied at 250oC for 10min; c: Stump torrefied at 300oCfor 10min)
34
(a)
(b)
(c)Figure 12. SEM pictures of untreated stump sample and torrefied stump samples (a:Untreated stump sample; b: Stump torrefied at 250oC for 10min; c: Stump torrefied at 300oCfor 10min)
34
(a)
(b)
(c)Figure 12. SEM pictures of untreated stump sample and torrefied stump samples (a:Untreated stump sample; b: Stump torrefied at 250oC for 10min; c: Stump torrefied at 300oCfor 10min)

35
4.5 Kinetic parameters determination by Ozawa method
Ozawa method allows determining kinetic parameters such as activation energy (Ea), utilizing
Arrhenius equation. By constructing plots of log versus T −1, which give straight lines,
whose slopes and intercepts can be used to calculate Ea at different conversion α. The
exponential factor A at different conversion α could also be calculated using Equation (7).
Figure 13 represents graphically the determination of activation energy and pre-exponential
factor by Ozawa method for untreated biomass samples under investigation. The same range
of the conversion α from 0.14 to 0.81 was used for all the samples.
For the poplar, the activation energy was found to be in between 127 and 167 kJ/mol, and pre-
exponential factor varied between 1.82E+11 and 1.45E+13. The average activation energy
and pre-exponential factor are 153kJ/mol and 6.06E+12.
For the FTC the activation energy was observed to be within the range between 154 and 173
kJ/mol, and the pre- exponential factor varies was from 3.07E+12 to 7.33E+13. The average
activation energy was 166kJ/mol and the average pre-exponential factor was 3.69E+13.
For the stump the activation energy varied from 125 to 133kJ/mol and the average value of
activation energy was 129kJ/mol. The pre-exponential factor was found in between 1.39E+10
and 2.39E+11 and the average value was 6.59E+10.
0.8
0.9
1
1.1
1.2
1.3
1.4
1.5
1.6
1.7
0.0014 0.0015 0.0016 0.0017 0.0018
logβ
(K/m
in)
1/T ,(1/K) (a)
α=0,81
α=0,72
α=0,64
α=0,56
α=0,47
α=0,39
α=0,31
α=0,22
α=0,14

36
Figure 13: Determination of activation energy by Ozawa method for untreated biomass
samples (a: poplar; b: FTC; c: stump)
Results from the determination of activation energy and pre-exponential factors by Ozawa
method are numerically summarized in Table 5. From this table, one can see that the FTC had
relative higher values of activation energy and pre-exponential factor than the others. Among
the three types of biomass, stump had lowest values of activation energy and pre-exponential
factor.
0.9
1
1.1
1.2
1.3
1.4
1.5
1.6
1.7
0.0014 0.0015 0.0016 0.0017 0.0018
logβ
(K/m
in)
1/T,(1/K) (b)
α=0,14
α=0,22
α=0,31
α=0,39
α=0,47
α=0,56
α=0,64
α=0,72
α=0,81
0.9
1
1.1
1.2
1.3
1.4
1.5
1.6
1.7
0.0014 0.0015 0.0016 0.0017 0.0018
logβ
(K/m
in)
1/T (1/K) (c)
α=0,14
α=0,22
α=0,31
α=0,39
α=0,47
α=0,56
α=0,64
α=0,72
α=0,81

37
Table 5: Numerical summary of activation energy and pre-exponential factor - Ozawa
method
Poplar FTC Stump
α Ea A Ea A Ea A
0.14 127 1.82E+11 154 4.80E+13 125 2.39E+110.22 138 7.71E+11 158 3.51E+13 128 1.48E+110.31 147 2.39E+12 167 6.79E+13 128 7.02E+100.39 154 4.67E+12 171 7.33E+13 128 4.24E+100.47 157 5.05E+12 173 6.48E+13 128 2.67E+100.56 163 1.05E+13 171 2.73E+13 129 2.10E+100.64 166 1.45E+13 168 1.08E+13 129 1.56E+100.72 167 1.24E+13 166 5.50E+12 130 1.39E+100.81 163 3.99E+12 166 3.07E+12 133 1.47E+10
4.6 Kinetic models for non-isothermal decomposition of biomass
4.6.1 One-step model
At the fist instance, one-step model was employed for simulation of non-isothermal
decomposition of biomass, from which the reaction order n and pre-exponential factor A were
determined by searching for the best fit between the experimental data and simulated results
using non-linear regression analysis. Table 6 represents results from this simulation study,
including the value of σ2 (least square).
Table 6: Results from one-step modellingPoplar
heating rate K/min Ea(KJ/mol) A(1/s) one single step (n≠1) σ^2
10 153 3.19E+12 2.61 4.39E-0420 153 3.20E+12 2.55 1.69E-0340 153 5.21E+12 3.33 7.01E-03
Stump
heating rate K/min Ea(KJ/mol) A(1/s) one single step (n≠1) σ^2
10 129 3.01E+10 2.93 3.28E-0420 129 5.56E+10 3.34 1.55E-0340 129 3.64E+10 3.27 3.22E-03
4.6.2 Three-pseudo-components model
Three-pseudo-components model with reaction order n=1 and n≠1 was also used to for the
simulation study in the present work and the graphical presentation of the fitting between the

38
simulated results and the experimental data is given in Appendix 7.8.9.10. Tables 7 and 8
represent a numerical summary of the kinetic data (A in s-1, Ea in kJ/mol-1) extracted from the
simulation for poplar and stump, respectively. The dimensionless fitting value C is also
calculated by least square fitting method.
Table 7: Kinetic parameters extracted from three-pseudo-component modelling for poplar (A
in s-1. Ea in kJ/mol-1)Heating rate 10K/min
n=1 Ea A C n≠1 Ea A C n
hemicelluloses 107 1.98E+09 0.14 hemicelluloses 114 1.74E+09 0.73 8.78cellulose 199 8.27E+15 0.35 cellulose 198 8.27E+15 0.36 1.21
lignin 51 1.17E+04 0.02 lignin 85 2.01E+07 0.07 2.68Heating rate 20K/min
n=1 Ea A C n≠1 Ea A C n
hemicelluloses 107 2.49E+09 0.15 hemicelluloses 112 1.71E+09 0.61 6.61cellulose 185 5.49E+14 0.34 cellulose 171 5.09E+13 0.34 1.08
lignin 48 9.91E+03 0.02 lignin 82 2.15E+07 0.09 2.30Heating rate 40K/min
n=1 Ea A C n≠1 Ea A C n
hemicelluloses 108 9.32E+08 0.56 hemicelluloses 105 1.01E+09 0.30 2.85cellulose 181 3.17E+14 0.33 cellulose 176 1.28E+14 0.33 1.00
lignin 52 3.69E+04 0.02 lignin 80 2.86E+07 0.06 3.62Table 8: the Kinetic parameters extracted from three-pseudo-component modelling for stump
(A in s-1. Ea in kJ/mol-1)Heating rate 10K/min
n=1 Ea A C n≠1 Ea A C n
hemicelluloses 77 1.23E+06 0.26 hemicelluloses 77 1.27E+06 0.26 1.04cellulose 181 2.86E+14 0.27 cellulose 185 5.59E+14 0.27 1.02
lignin 50 6.67E+03 0.02 lignin 83 1.82E+07 0.08 3.97Heating rate 20K/min
n=1 Ea A C n≠1 Ea A C n
hemicelluloses 84 6.38E+06 0.27 hemicelluloses 81 4.04E+06 0.28 1.01cellulose 170 5.38E+13 0.27 cellulose 173 8.91E+13 0.27 1.02
lignin 42 2.18E+03 0.02 lignin 84 1.65E+07 0.12 8.07Heating rate 40K/min
n=1 Ea A C n≠1 Ea A C n
hemicelluloses 78 2.31E+06 0.27 hemicelluloses 77 1.98E+06 0.27 1.01cellulose 172 5.38E+13 0.25 cellulose 180 1.98E+14 0.27 1.19
lignin 50 2.03E+04 0.03 lignin 84 2.78E+07 0.08 2.61
39
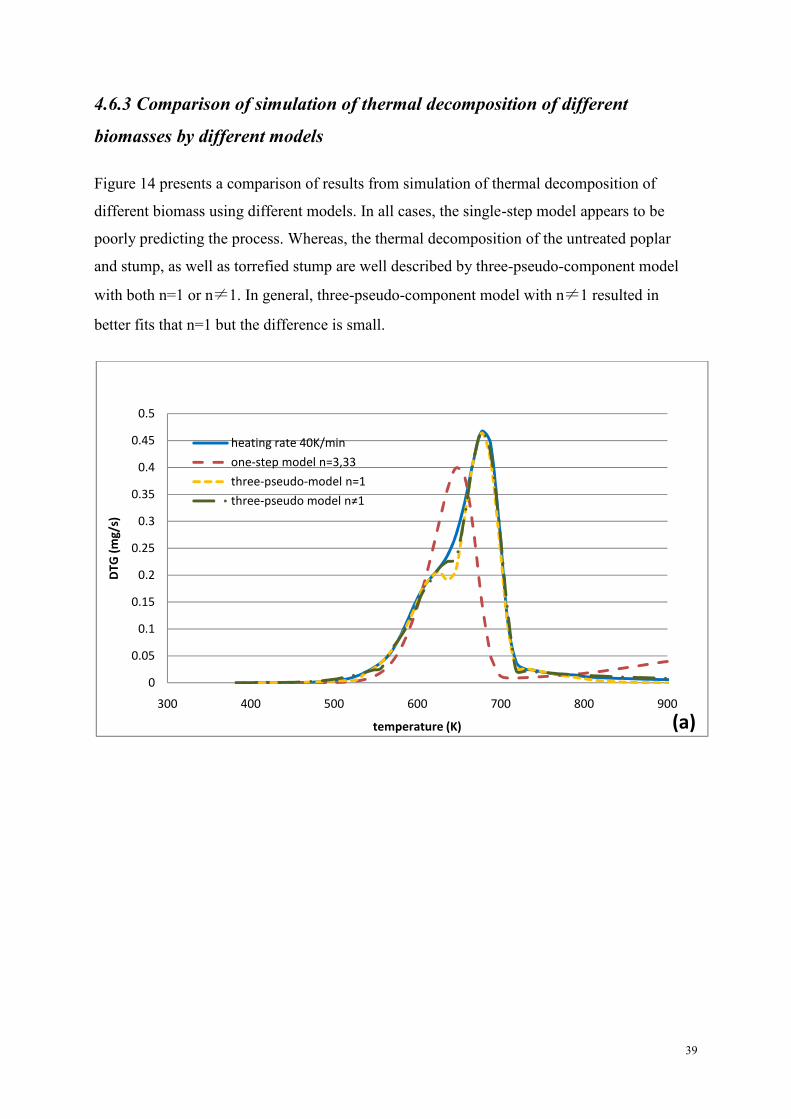
4.6.3 Comparison of simulation of thermal decomposition of different
biomasses by different models
Figure 14 presents a comparison of results from simulation of thermal decomposition of
different biomass using different models. In all cases, the single-step model appears to be
poorly predicting the process. Whereas, the thermal decomposition of the untreated poplar
and stump, as well as torrefied stump are well described by three-pseudo-component model
with both n=1 or n≠1. In general, three-pseudo-component model with n≠1 resulted in
better fits that n=1 but the difference is small.
0
0.05
0.1
0.15
0.2
0.25
0.3
0.35
0.4
0.45
0.5
300 400 500 600 700 800 900
DTG
(mg/
s)
temperature (K) (a)
heating rate 40K/min
one-step model n=3,33
three-pseudo-model n=1
three-pseudo model n≠1

40
Figure 14: comparison of simulation of pyrolysis of untreated and torrefied biomass bydifferent models at heating rate 40K/min (a: untreated poplar; b: untreated stump; c: 300oCtorrefied stump)
0
0.05
0.1
0.15
0.2
0.25
0.3
0.35
0.4
400 500 600 700 800 900
DTG
(mg/
s)
temperature (K) (b)
heating rate 40K/min
one-step model n=3.27
three-pseudo-model n=1
three-pseudo-model n≠1
0
0.1
0.2
0.3
0.4
0.5
0.6
0.7
400 500 600 700 800 900
DTG
,(mg/
s)
Temperature K (c)
torrefied stump at 300oC
one-step-model n=3.6
three-pseudo-model n=1
three-pseudo-model n≠1

41
Table 9 summarizes results of best fitting value for unknown model parameters by non least
square fitting method. The result of σ2 also presents the one-step model is not appropriate to
simulate the biomass thermal decomposition, even if for torrefied biomass. The three-pseudo-
components model with n≠1 gives the better simulated curve than n=1.
Table 9: Kinetic data obtained by different modelsPoplar at heating rate 40K/min Stump at heating rate 40K/min 300oC torrefied Stump at heating rate
40K/min
one-step model one-step model one-step model
Ea A n σ^2 Ea A n σ^2 Ea A n σ^2153 5.21E+12 3.33 7.01E-03 129 3.64E+10 3.27 3.22E-03 136 8.32E+10 3.6 1.00E-02three-pseudo-model n=1 three-pseudo-model n=1 three-pseudo-model n=1
Ea A C σ^2 Ea A C σ^2 Ea A C σ^2108 9.32E+08 0.56 2.27E-05 78 2.31E+06 0.27 5.74E-06 199 5.80E+15 0.38 1.85E-04181 3.17E+14 0.33 172 5.38E+13 0.25 58 7.94E+04 0.0652 3.69E+04 0.02 50 2.03E+04 0.03three-pseudo-model n≠1 three-pseudo-model n≠1 three-pseudo-model n≠1
Ea A C n σ^2 Ea A C n σ^2 Ea A C n σ^2105 1.01E+09 0.30 2.85 1.49E-05 77 1.98E+06 0.27 1.01 3.90E-06 205 1.56E+16 0.40 1.01 1.59E-04176 1.28E+14 0.33 1.00 180 1.98E+14 0.27 1.19 184 6.77E+14 0.21 3.980 2.86E+07 0.06 3.62 84 2.78E+07 0.08 2.61

42
5 Concluding remarks
A reactor has been developed to use with the existing muffle furnace for studying the process
of biomass torrefaction for fuel upgrading. It has been demonstrated that the reactor can be
used for torrefying of biomass in nitrogen. The produced solid torrefied biomass, collected
from the torrefaction of stump, poplar and Fuel tree chips have been characterized to
investigate improvements in energy density, grindability, and thermal reactivity.
The result showed that the biomass torrefied at 300oC for 35 minutes gave the highest heating
value. The heating value of poplar torrefied at this condition increases with 14% compared
with untreated poplar. For both stump and FTC the heating values increase was 12%.
Both torrefaction temperature and reaction time had strong effects on the torrefaction process.
At the same torrefaction temperature, the longer reaction time, the better fuel quality the solid
product had. Temperature had stronger effect in the same trend, giving higher fuel quality of
the solid product at higher temperatures for the same reaction time. However, too long
reaction time and/or too higher torrefaction temperature would decrease the amount of solid
products, which is the main product of the torrefaction process.
TG analyses of the three biomass types have been performed in nitrogen. The results showed
that the DTG curves of stump have a less pronounced shoulder compared with the other two
samples, which indicates that stump has less hemicelluloses than the two other biomass types.
Ozawa method was employed to determine activation energy of thermal decomposition of the
three biomasses in nitrogen. The results showed the FTC has a relatively higher average
activation energy (166kJ/mol) and pre-exponential factor (3.69E+13). The average activation
energy for stump and poplar were 129kJ/mol and 153kJ/mol and the average pre-exponential
factor were 6.59E+10 for stump and 6.06E+12 for poplar. The activation energy and pre-
exponential factor varies at different conversions.
Different kinetic models, including one step and three-pseudo-component models, were tested
for the thermal decomposition of the biomasses. The first mentioned appears to be unsuitable
to simulate the pyrolysis of both untreated and torrefied biomass, considering the poor fittings
from the regression analysis and the resulted unrealistically high reaction order. The three-

43
pseudo-component model (n=1 or n≠1) appears to be suitable for simulating the behaviour of
biomass during thermal decomposition. The best fittings were observed for the model with n
≠1.
This is a preliminary study of torrefaction of stump for use as fuel. Further research and
developments are needed to improve the operation of the reactor. Better gas flow controllers,
higher heating rates, possibilities to monitor oxygen concentration in the reactor and chemical
compositions of gas products released from process are recommended.

44
6 Acknowledgement
This work was carried out at the Bioenergy, Department of Energy and Technology, Swedish
University of Agriculture Sciences, under supervision of Dr. Khanh-Quang Tran, whose
academic supports and scientific guidance are gratefully acknowledged. Whenever I hade
technical and theoretical problems during this project, my supervisor always encouraged me,
actively gave me good advices, and discussed with me to solve the problems.
I would like to thank Professor Tord Johansson for approving my research proposal and
allowing me to carry out the work at the Bioenergy lab.
I would also like to thank Dr. Gulaim Seisenbaeva for her kind collaboration and supports in
performing TG and SEM analyses and data collection.
Special thanks are due to Dr. Raida Jirjis, Dr. Almir Karacic, Erik Anerud and Anders
Eriksson for providing with biomass samples and making the facilities available.
I thank all the administrative and technical staff at Energy and Technology, SLU, who helped
me during the project. Special thanks are due to Sven Smårs and Dick Gustafsson for practical
supports.
45
7 References[1] Energiläget i siffror 2010 Energy in Sweden– facts and figures 2010. 2010
[2] Bergman P.C.A., Boersma A.R., Kiel J.H.A., Prins.M.J., Ptasinski K.J., Janssen F.J.J.G.,2005. ECN Torrefaction for entrained-flow gasification of biomass. ECN-C--05-067
[3] Drift A.van der, Boerrigter H., Coda B., Cieplik M.K., Hemmes K., 2004. ENTRAINEDFLOW GASIFICATION OF BIOMASS--Ash behaviour, feeding issues, and system analyses.ECN-C--04-039
[4] Koukious, E.G., Mavrokoukoulakis, J. and Abatzoglou, N., 1982. Energy densification ofbiomass, Proc. 1st. National Conf. On Soft Energy Forms, Thessaloniki
[5] SS 18 71 70. SIS 1997, Swedish Standard. Biofuels-Determination of moisture content
[6] SS 18 71 71. SIS 1984, Swedish Standard. Biofuels-Determination of ash content
[7] SS 18 71 82. SIS 1990, Swedish Standard. Solid material fuels-Determination of the grossor calorific heating value by bomb calorimetric method, and calculation of the net or effectiveheating value
[8] Anerud E. 2010. Stump as a fuel- the influence of harvesting technique and storagemethod on fuel quality of Norway spruce. Licentiate thesis SLU ISSN 1654-9406
[9] Strömberg B., 2005, .Bränslehandboken- handbok av fuel. VÄRMEFORSK Service AB,ISSN 0282-3772
[10] Karacic A., post doctor, Swedish University of Agricultural Sciences.Department of Energy and Technology
[11] Eriksson A, Civilingenjör, Swedish University of Agricultural Sciences. Department ofEnergy and Technology
[12] Phanphanich M. Mani S. 2010. Impact of torrefaction on the grindability and fuelcharacteristics of forest biomass. Bioresour. Technol.doi:10.1016/j.biortech 2010.08.028
[13] Uslu A. Faaj A.P.C.. Bergman P.C.A.. 2008. Pre-treatment technologies. and their effecton international bioenergy supply chain logistics. Techno-economic evaluation of torrefaction.fast pyrolysis and pelletisation Elsevier ltd. All rights reserved doi:10.1016/j.energy.2008.03.007
[14] Prins M.J..Ptasinski K.J.. Janssen F.J.J.G.. 2006. More efficient biomass gasification viatorrefaction. Elsevier Ltd. Doi:10.1016/j.energy.2006.03.008
[15] Evan E. David A. 1998. Biomass cofiring: status. prospects 1996. Fuel processingtechnology 54 (1-3)
[16] David.A. 2000. Biomass cofiring: the technology. the experience. the combustionconsequences. Biomass and bioenergy 19(6) 365-384

46
[17]Bergman PCA. Combined torrefaction and pelletisation: the top process. Petten. theNetherlands: ECN 2005
[18] J. Deng. G-J Wang. J-h Kuang. Y-l Zhang. Y-h Luo. pretreatment og agriculturalresidues for co-gasification via torrefaction. J.Anal. Appl. Pyrolysis 86(2009) 331-337
[19] Song Hu. Andreas Jess. Minhou Xu. Kinetic study of Chinese biomass slow pyrolysis:comparison of different Kinetic models
[20] Wei-Hsin C. Po-Chih K. 2010. A study on torrefaction of various biomass materials andits impact on lignocellulosic structure simulated by a thermogravimetry. Energy 35 2580-2586
[21]Lukas G. Zuzana K. L’uduovit. Tatranske M. 2009 May 25-29. Kinetic study of woodchips decomposition by TGA. Slovakia.
[22] Karacic A. 2005. Production and Ecological Aspects of Short Rotation Poplars inSweden Acta Universitatis Agriculturae Sueciae: 13
[23] Simon P. 2004. Isoconversional methods: fundamentals. meaning and application.Journal of Thermal Analysis and calroimetry. Vol 76 123-132.
[24] Vlaev* L.T.. Markosvska I.G.. Lyubchev L.A.. 2003. Non-Isothermal Kinetics ofpyrolysis of rice husk. Thermochimica Acta 406 1-7.222
[25] Arias B. Pevida C. Fermoso J. Plaza M.G.. Rubiera F. Pis J.J. 2008. Influence oftorrefaction on the grindability and reactivity of woody biomass Elsevier doi:10.1016
[26] Bridge T.G.. Jones J.M.. Williams A.. Waldron D.J.. 2010. An investigation of thegrindability of two torrefied energy crops. Elsevier 3911-3918.
[27] Müller-hagedor M. Bockhorn H. Krebs L. Müller U. 2003. A comparative kinetic studyon the pyrolysis of three different wood species. J. Anal. Pyrol. p. 231-249
[28] Fisher T. Hajaligol M. Waymack B. Kellogg D. 2003. Pyrolysis behavior and kinetics ofbiomass derived material. J. Anal Appl. Pyrol. 62 p. 331-349
[29] Wang G. Li W. Li B. Chen H. 2008. TG study on pyrolysis of biomass and its threecomponents under syngas. Fuel 87 p. 552-558
[30]Vamvuka. D. Kakaras.E. Kastanaki.E. 2003. Pyrolysis characteristics and kinetics ofbiomass residual mixture with lignite. Fuel 82. 1949-1960.
[31] Ozawa T. 1965. Bull.chem.Soc Jpn. 38 1881.
[32]Ozawa T. 1970. J. Therm.Anal. 2. 301.
[33]Ozawa T. 1975. J. Therm.Anal. 7. 601

47
[34]Ozawa T. 1976. J. Therm.Anal. 9. 217.
[35] Flynn J.H. 1982. The isoconversional method for determination of energy of activation atconstant heating rates—corrections for the Dolye approximation. J. Thermal Anal. 17.
[36] Doyle. C. D. 1962. Estimating isothermal life from thermogravimetric data. Journal ofApplied Polymer Science. 6: 639–642. doi: 10.1002/app.070062406
[37]Blasi D. 2008. Modeling chemical and physical processes of wood and biomass pyrolysis.Progress in energy and Combustion Science. 23(1):p. 47-90
[38] Mészáros E. Várhegyi G. and Jakab E. 2004. Thermoagravimetric and reaction KineticAnalysis of Biomass samples from an energy plantation. Energy & Fueks 18 p. 497-507
[39] Várhegyi G. Bobály B. Jakab E. 2011. Thermogravimetric study of biomass PyrolysisKinetics. A distributed Activation energy model with predication tests. Energy & Fuel 25. p.24-32

48
8 Appendix
Appendix 1Weight loss curves of poplar samples at heating rate 10K/min from TGA

49
Weight loss curves of poplar samples at heating rate 20K/min from TGA

50
Weight loss curves of poplar samples at heating rate 40K/min from TGA

51
Appendix 2Weight loss curves of FTC samples at heating rate 10K/min from TGA

52
Weight loss curves of FTC samples at heating rate 20K/min from TGA

53
Weight loss curves of FTC samples at heating rate 40K/min from TGA

54
Appendix 3Weight loss curves of stump samples at heating rate 10K/min from TGA

55
Weight loss curves of stump samples at heating rate 20K/min from TGA

56
Weight loss curves of stump samples at heating rate 40K/min from TGA
57
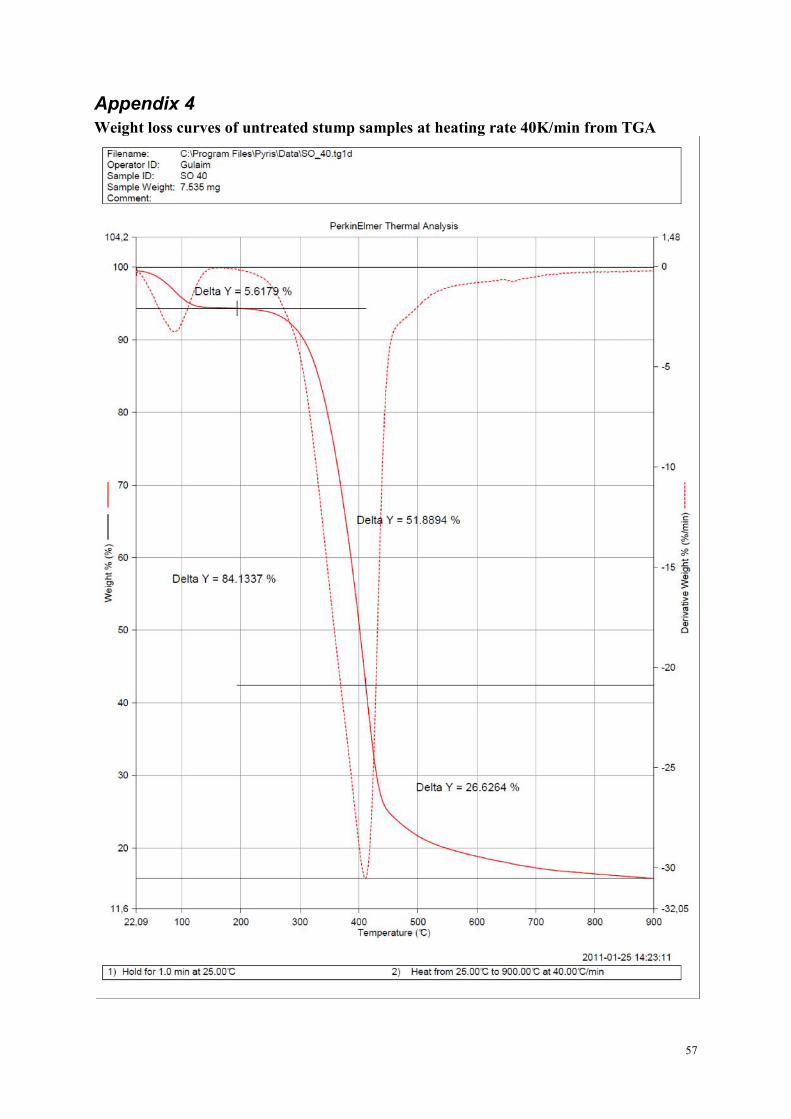
Appendix 4Weight loss curves of untreated stump samples at heating rate 40K/min from TGA

58
Weight loss curves of torrefied stump samples at 200oC for 10min with heating rate40K/min from TGA

59
Weight loss curves of torrefied stump samples at 250oC for 10min with heating rate40K/min from TGA

60
Weight loss curves of torrefied stump samples at 300oC for 10min with heating rate40K/min from TGA

61
Appendix 5Single reaction one step model for untreated poplar sample at heating rate 10K/min.20K/min and 40K/min
0
0.02
0.04
0.06
0.08
0.1
0.12
0.14
300 400 500 600 700 800 900
DTG
,(mg/
s)
Temperature K (a)
heating rate10K/min
n=2.61
0
0.05
0.1
0.15
0.2
0.25
0.3
300 400 500 600 700 800 900
DTG
(mg/
s)
temperature (K) (b)
heating rate20K/min
n=2.55

62
Figure 15: DTG simulation results by a one-step model of poplar pyrolysis at different heatingrate (a: 10K/min; b: 20K/min; c: 40K/min)
0
0.05
0.1
0.15
0.2
0.25
0.3
0.35
0.4
0.45
0.5
300 400 500 600 700 800 900
DTG
(mg/
s)
temperature (K) (c)
heatingrate40K/min
n=3,33

63
Appendix 6Single reaction one step model for untreated stump sample at heating rate 10K/min.20K/min and 40K/min
0
0.02
0.04
0.06
0.08
0.1
0.12
400 500 600 700 800 900
DTG
,(mg/
s)
Temperature K (a)
heating rate 10K/min
n=2,93 for one-step model
0
0.05
0.1
0.15
0.2
0.25
400 500 600 700 800 900
DTG
(mg/
s)
temperature (K)
(b)
heating rate20K/min
n=3.34

64
Figure 16: DTG simulation results by a one-step model of stump pyrolysis at different heatingrate (a:10K/min; b: 20K/min; c: 40K/min)
0
0.05
0.1
0.15
0.2
0.25
0.3
0.35
0.4
400 500 600 700 800 900
DTG
(mg/
s)
temperature (K) (c)
heatingrate40K/min
n=3.27

65
Appendix 7Three-pseudo-components model (n=1) for untreated poplar sample at heating rate 10K/min.20K/min and 40K/min
0
0.02
0.04
0.06
0.08
0.1
0.12
0.14
400 500 600 700 800 900
DTG
,(mg/
s)
Temperature K (a)
heating rate 10K/min
hemicellulose
cellulose
lignin
simulated data
0
0.05
0.1
0.15
0.2
0.25
0.3
400 450 500 550 600 650 700 750 800 850 900
DTG
,(mg/
s)
Temperature K (b)
heating rate 20K/mincellulosehemicelluloseligninsimulated data

66
Figure 17: DTG simulation results by three-pseudo-component (n=1) of poplar pyrolysis atdifferent heating rate (a: 10K/min; b: 20K/min; c: 40K/min)
0
0.05
0.1
0.15
0.2
0.25
0.3
0.35
0.4
0.45
0.5
400 450 500 550 600 650 700 750 800 850 900
DTG
,(mg/
s)
Temperature K (c)
heating rate 40K/minhemicellulosecelluloseligninsilumated data
67
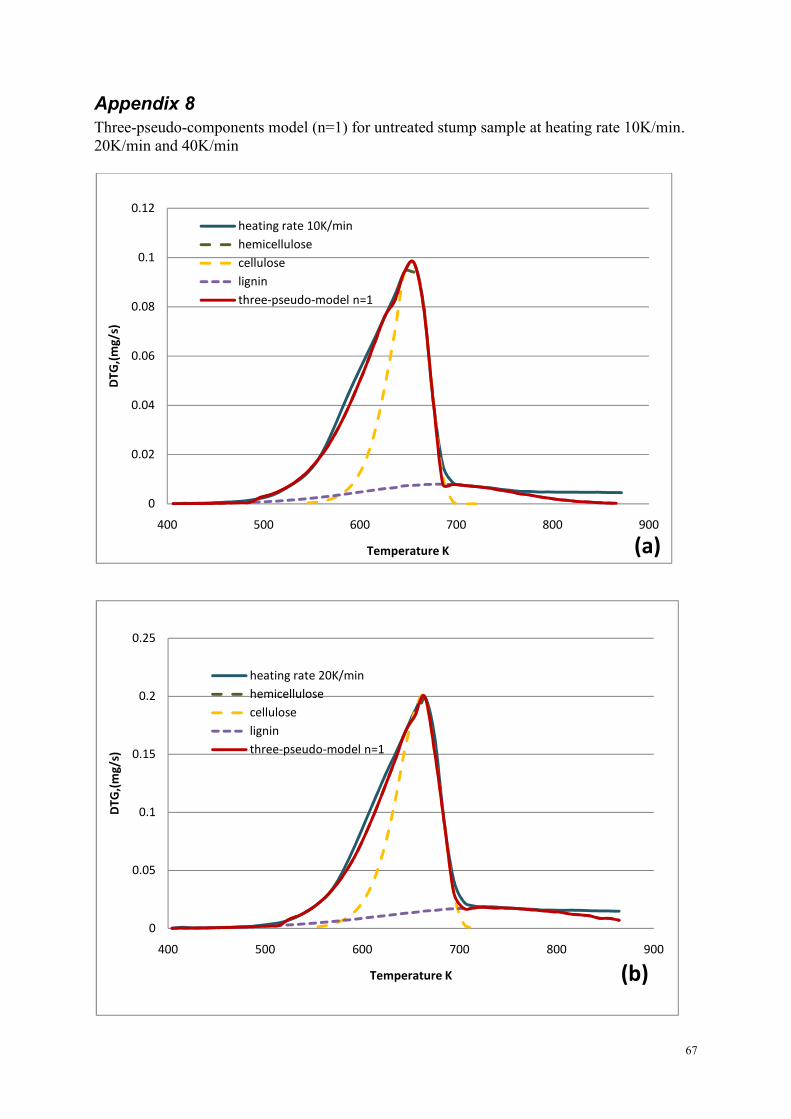
Appendix 8Three-pseudo-components model (n=1) for untreated stump sample at heating rate 10K/min.20K/min and 40K/min
0
0.02
0.04
0.06
0.08
0.1
0.12
400 500 600 700 800 900
DTG
,(mg/
s)
Temperature K (a)
heating rate 10K/minhemicellulosecelluloseligninthree-pseudo-model n=1
0
0.05
0.1
0.15
0.2
0.25
400 500 600 700 800 900
DTG
,(mg/
s)
Temperature K (b)
heating rate 20K/minhemicellulosecelluloseligninthree-pseudo-model n=1

68
Figure 18: DTG simulation results by three-pseudo-component (n=1) of stump pyrolysis atdifferent heating rate (a: 10K/min; b: 20K/min; c: 40K/min)
0
0.05
0.1
0.15
0.2
0.25
0.3
0.35
0.4
400 500 600 700 800 900
DTG
,(mg/
s)
Temperature K (c)
heating rate 40K/minhemicellulosecelluloseligninthree-pseudo-model n=1

69
Appendix 9Three-pseudo-components model (n≠1) for untreated poplar sample at heating rate 10K/min.20K/min and 40K/min
(a)
0
0.02
0.04
0.06
0.08
0.1
0.12
0.14
400 500 600 700 800 900
DTG
,(mg/
s)
Temperature K (a)
heating rate 10K/min
hemicellulose
cellulose
lignin
simulated data
0
0.05
0.1
0.15
0.2
0.25
0.3
400 500 600 700 800 900
DTG
,(mg/
s)
Temperature K (b)
heating rate20K/min
hemicellulose
cellulose
lignin
simulated data

70
Figure 19: DTG simulation results by three-pseudo-component (n≠1) of poplar pyrolysis atdifferent heating rate (a: 10K/min; b: 20K/min; c: 40K/min)
0
0.05
0.1
0.15
0.2
0.25
0.3
0.35
0.4
0.45
0.5
400 450 500 550 600 650 700 750 800 850 900
DTG
,(mg/
s)
Temperature K (c)
heating rate 40K/minhemicellulosecelluloseligninsimulated data

71
Appendix 10Three-pseudo-components model (n≠1) for untreated stump sample at heating rate 10K/min.20K/min and 40K/min
(a)
0
0.02
0.04
0.06
0.08
0.1
0.12
400 500 600 700 800 900
DTG
,(mg/
s)
Temperature K (a)
heating rate 10K/min
hemicellulose
cellulose
lignin
three-pseudo-model n≠1
0
0.05
0.1
0.15
0.2
0.25
400 500 600 700 800 900
DTG
,(mg/
s)
Temperature K (b)
heating rate 20K/min
hemicellulose
cellulose
lignin
three-pseudo-model n≠1

72
Figure 20: DTG simulation results by three-pseudo-component (n≠1) of stump pyrolysis atdifferent heating rate (a:10K/min; b: 20K/min; c: 40K/min)
0
0.05
0.1
0.15
0.2
0.25
0.3
0.35
0.4
400 500 600 700 800 900
DTG
,(mg/
s)
Temperature K (c)
heating rate 40K/min
hemicellulose
cellulose
lignin
three-pseudo-model n≠1

73
Appendix 11Single reaction one step model for torrefied stump samples at 300oC at heating rate40K/min
(a)
(b)
0
0.1
0.2
0.3
0.4
0.5
0.6
0.7
400 500 600 700 800 900
DTG
(mg/
s)
temperature (K)
300oC torrefied stump at heating rate40K/min
torrefied stump at 300oC
one-step-model n=3.6
0
0.1
0.2
0.3
0.4
0.5
0.6
0.7
400 500 600 700 800 900
DTG
,(mg/
s)
Temperature K
300oC torrefied stump at heating rate40K/min
300oC torrefied stump
cellulose
lignin
three-pseudo-model n=1

74
(c)
Figure 21:(a) DTG simulation results by a one-step model of 300oC torrefied stump pyrolysis at heating
rate 40K/min(b) DTG simulation results by three-pseudo-component (n=1) of 300oC torrefied stump
pyrolysis at heating rate 40K/min(c) DTG simulation results by three-pseudo-component (n≠1) of 300oC torrefied stump
pyrolysis at heating rate 40K/min
0
0.1
0.2
0.3
0.4
0.5
0.6
0.7
400 500 600 700 800 900
DTG
,(mg/
s)
Temperature K
300oC torrefied stump at heating rate40K/min
heating rate 40K/min
cellulose
lignin
three-pseudo-model n≠1


SLU Institutionen för energi och teknik Box 7032 750 07 UPPSALA Tel. 018-67 10 00 pdf.fil: www.slu.se/energiochteknik
SLU Department of Energy and Technology P. O. Box 7032 SE-750 07 UPPSALA SWEDEN Phone +46 18 671000