Embed Size (px)
Citation preview

National Grid
Claim for Income Adjusting Event associated with the impacts Traffic Management Act
June 2013

Claim for Income Adjusting Event associated with the impacts Traffic Management Act
echarris.com 1
Copyright © 2013 EC Harris. All rights reserved
An ARCADIS company.
EC Harris LLP is a limited liability partnership, registered in England, registered number OC368843. Registered office, ECHQ, 34 York Way, London, N1 9AB. A list of the members' names is available for inspection at the above office. Part of the ARCADIS Group of Companies, along with other entities in the UK, including EC Harris (UK) Limited. Regulated by RICS.
Contacts
James Redmayne
Partner
EC Harris LLP
ECHQ, 34 York Way
London N1 9AB
United Kingdom

Claim for Income Adjusting Event associated with the impacts Traffic Management Act
echarris.com 2
Copyright © 2013 EC Harris. All rights reserved
Version control
Issue Revision No.
Date Issued Description of Revision: Page No.
Description of Revision: Comment
Reviewed by:
1 V1 16/04/2013
2 V2 03/06/2013
Updated in line with National Grids recommendations
JR
3 V3 06/06/2013
Internal review
Amended conclusion
TH
4 V3A 12/06/2013 Added NG amendments. Produced values
TH
5 V4 16/06/2013 Final review, added in financial figures
JR
FINAL V4a 27/09/13 Amend figure 12 &17
JR
Redacted version
V5 27/09/13 Commercial information removed
TN

Claim for Income Adjusting Event associated with the impacts Traffic Management Act
echarris.com 3
Copyright © 2013 EC Harris. All rights reserved
Contents
1 Executive Summary ................................................................................................................................... 4
2 Background ................................................................................................................................................ 5
2.1 The Acts (NRSWA) 1991 and TMA 2004 ........................................................................................ 5
2.2 Entitlement to recover Cost Implications arising from the Adoption of the TMA 2004 under
‘Income Adjustment Events’ ............................................................................................................. 5
2.3 Reason for this Submission ............................................................................................................. 6
3 Breakdown of the Basis of the claim .......................................................................................................... 7
3.1 Basis of the Claim ............................................................................................................................ 7
3.2 Entitlement under the IAE Mechanism ............................................................................................. 9
4 Supporting Evidence for Each Claim Head .............................................................................................. 10
4.1 The National Grid Network ............................................................................................................. 10
4.2 Permit, Fixed Penalty Notices, Section 74 & Administration Costs ............................................... 12
4.3 Other costs which Ofgem directs should be treated as TMA costs ............................................... 12
4.4 The Process Adopted to Evidence each Claim Head .................................................................... 13
5 TMA Cost Capture Process ...................................................................................................................... 14
5.1 Gather cost data on projects .......................................................................................................... 14
5.2 Separate Fixed costs ..................................................................................................................... 17
5.3 Review productivity ........................................................................................................................ 18
5.4 Refer back to data as evidence ..................................................................................................... 18
6 Contemporary Evidence ........................................................................................................................... 19
6.1 Primary Consideration .................................................................................................................... 19
6.2 Target cost production ................................................................................................................... 20
6.3 Cost collection ................................................................................................................................ 21
6.4 The payment process ..................................................................................................................... 21
7 Financial Consideration ............................................................................................................................ 22
7.1 Generally ........................................................................................................................................ 22
7.2 Impact analysis .............................................................................................................................. 23
7.3 Productivity cost impact ................................................................................................................. 28
7.4 Effect of productivity reduction ....................................................................................................... 31
8 Conclusion ................................................................................................................................................ 34
9 Mitigating the Impact of Permits ............................................................................................................... 35
Appendices ...................................................................................................................................................... 36
Appendix A ............................................................................................................................................... 36
Appendix B ............................................................................................................................................... 37
Appendix C ............................................................................................................................................... 38
Claim for Income Adjusting Event associated with the impacts Traffic Management Act
echarris.com 4
Copyright © 2013 EC Harris. All rights reserved
1 Executive Summary
This report was produced as part of National Grid’s submission of an Income Adjusting Event to
the Office of Gas and Electricity Markets relating to the implementation Traffic Management
Permit Scheme Regulations 2007 by Highway Authorities, under the New Roads and Street
Works Act 1991 as amended by the Traffic Management Act 2004.
The report reviews the impacts of the implementation of traffic permit systems by Highway
Authorities on the performance of the Alliance and Coalition delivery partners of National Grid in
National Grid’s North London, East of England and North West regions, including identification of
the additional fixed and variable costs incurred by delivery partners.
The key findings of the report are:
• Highway Authorities have introduced the traffic management permit schemes, under the
Traffic Management Act 2004, throughout the GDPCR1 period and not all Highway
Authorities have adopted a traffic management permit scheme.
• The interpretation and application of the Legislation is not uniform leading to a myriad of
application of the schemes causing a different approach from individual Highway
Authorities leading to the development of different ways of working for all works promoters
including National Grid.
• The cost capture methodology and requirements under the Alliance and Coalition
contracts, awarded in 2005 and 2009 respectively, mean that significant further detailed
analysis is required to identify additional costs incurred due to the traffic permit system.
• Where Highway Authorities have adopted and implemented the traffic management
permit schemes, the costs of National Grid’s delivery partners have increased as a direct
result of the legislation.
The conclusions of the report are:
• Because different Highway Authorities apply the traffic management permit schemes, it is
not possible for National Grid, or their delivery partners, to adopt a single process which
meets the requirements of all Highway Authorities.
• National Grid’s delivery partners have to develop and retain understanding of the nuances
of each individual Highway Authorities requirements for traffic permits, both for application
and for execution, and the effects these requirements have for submissions in addition to
schedule and cost.
• The additional cost incurred by National Grid as a result of the traffic management permit
schemes is £5,079,270, which equates to £37.87 per linear metre abandoned based on
2009 prices.
• The additional cost incurred by National Grid per linear metre abandoned is £19.87
greater than the initial findings of the Office of Gas and Electricity Markets to National
Grid’s Income Adjusting Event submission of June 2011, based on 2009 prices.

Claim for Income Adjusting Event associated with the impacts Traffic Management Act
echarris.com 5
Copyright © 2013 EC Harris. All rights reserved
2 Background
2.1 The Acts (NRSWA) 1991 and TMA 2004
2.1.1 Under the New Roads & Street Works Act (NRSWA) 1991, National Grid had a statutory
right to occupy the highway in order to work on assets located on or under the highway
as long as the Highway Authority (HA) was notified. The Traffic Management Act (TMA)
2004 is a piece of legislation that complements NRSWA 1991, e.g. the TMA does not
supersede NRSWA, but changes some key aspects of the law. The TMA places a
primary duty on HAs to actively manage their road network and allows the HAs to do this
through the introduction of permit schemes.
2.1.2 Under the TMA, National Grid’s automatic right to occupy the highway is superseded by
the HA’s requirement to manage the highway; National Grid must gain the permission of
the HA to undertake work rather than notifying the HA of the work. Planning, managing
and delivering streetworks under this more restrictive regime adds significant additional
costs, particularly in terms of administration, productivity and other costs to National
Grid. To obtain permission to work, National Grid must agree to and implement project
specific work conditions required by the HA which are documented in the permit. These
permit conditions, detailed within the Codes of Practice for Permits (March 2008) and
enforced by the HAs can be on any aspect of the work including, but not limited to;
� Identifying when the project can commence.
� Limiting the total duration allowed to undertake the project.
� Limiting the space available to undertake the works.
� Requiring the highway to be reopened for certain days or times of the day, e.g.
rush hour.
� Requiring specific traffic management activities to be undertaken such as;
creating detailed traffic management plans for every scheme and phase of the
works; increased use of one way routes; parking bay and bus stop suspensions;
manned traffic control and removal of traffic islands and street furniture.
� Requiring work to be undertaken outside of normal working hours.
2.2 Entitlement to recover Cost Implications arising from the Adoption of
the TMA 2004 under ‘Income Adjustment Events’
2.2.1 The Office of Gas and Electricity Markets (Ofgem) has acknowledged that the costs due
to the enactment of the TMA are significant and are allowing the Gas Distribution
Networks (GDNs) to recover the cost differential between legislative requirements of the
NRSWA and the TMA requirements. To recover these costs, National Grid must
demonstrate that these additional costs were incurred during efficiently executed works
and are directly attributable to the TMA. The costs are recovered through submitting an
Income Adjustment Event (IAE) to Ofgem.

Claim for Income Adjusting Event associated with the impacts Traffic Management Act
echarris.com 6
Copyright © 2013 EC Harris. All rights reserved
2.3 Reason for this Submission
2.3.1 For National Grid’s first IAE submitted for additional costs incurred due to the TMA in
June 2011, a holistic approach was adopted to document productivity costs. The costs
were demonstrated by comparing neighbouring parts of London where the main
difference was the adoption of the London Permit Scheme. Ofgem rejected this
methodology.
2.3.2 Due to the uncertainty around productivity costs and Section 74 charges, Ofgem
permitted the re-opening of the IAE, submitted June 2011. In addition Ofgem requested
that National Grid include any proven costs due to the TMA incurred up to and including
31st March 2013, so addressing the full GDPCR1 period within the IAE submission.
2.3.3 National Grid is required to submit this revised IAE to Ofgem by 28thJune 2013. The IAE
submission must meet Ofgem’s requirements, specifically;
1. The data must demonstrate that National Grid operated efficiently and any
additional incurred costs are directly attributable to TMA legislation.
2. The productivity cost data must be captured at a project level.
3. There must be a minimum of 6 months of actual cost data.
2.3.4 This report provides the information to meet the requirements above.

Claim for Income Adjusting Event associated with the impacts Traffic Management Act
echarris.com 7
Copyright © 2013 EC Harris. All rights reserved
3 Breakdown of the Basis of the claim
3.1 Basis of the Claim
National Grid has identified the following operational interfaces and factors that drive the
significant cost increases to the delivery of its operations that are a direct consequence of the
application of the TMA legislation;
3.1.1 General Observations
� Permit schemes and their associated conditions have added significant complexity to
the street works regime increasing both planning, design and delivery costs and
durations.
� The inconsistent application and format of permit schemes between HAs has limited
National Grid’s, (and their delivery partner’s) ability to optimise processes, which has
an additional negative impact on productivity.
� The stages of compliance and noticing requirements for different types of works
impact performance, delivery and costs. For example for planned major works the
noticing process typically starts at least ninety days prior to undertaking works, with
six notices required in total.
� The fact that different HAs have developed varying schemes, or may interpret the
TMA permit scheme in different ways and with different levels of rigour leaves
National Grid unable to define one "best-practice" approach to manage the permit
process nationally, thus creating inefficiencies across the entire work planning and
delivery process as each HA permit system requires detailed local knowledge.
� The negative impact on site productivity has been evident from the analysis of the
impact of the London Permit Scheme (LOPS) on essential mains replacement
programme activity. Due to conditions imposed, projects are taking longer to
complete and costing more.
� Differences between and within permit schemes also necessitates a multitude of
different administrative processes to be undertaken by those applying for permits in
more than one geographic area. For example the three current schemes in operation
or preparation covering areas where National Grid undertakes work (London,
Northampton and Manchester) are being implemented in different ways in terms of
both interpretation and application. See Section 8 for details of some if the initiatives
that National Grid has implemented to mitigate the impacts of the enactment of the
TMA.
3.1.2 TMA Specific Observations
� NRSWA placed duty on HA’s to co-ordinate works, hence noticing system.
� Part 2 TMA imposed a principal network management duty (NMD) on HA’s to secure
expeditious flow of traffic.
� Part 3 TMA enabled HA’s to introduce chargeable permit schemes to support the
NMD role (the London Permit Scheme started 11thJanuary 2010).
� Part 4 TMA enabled all HA’s to apply fixed penalties as an easier alternative to taking
court action (from May 2008).

Claim for Income Adjusting Event associated with the impacts Traffic Management Act
echarris.com 8
Copyright © 2013 EC Harris. All rights reserved
� Regulations under NRSWA S74A implemented March 2012 to enable Lane Rental
schemes (Transport for London Scheme started 11thJune 2012).
� DfT changes to the S74 Regulations to impose significant increases to S74 overstay
charges from October2012.
� Under NRSWA National Grid have a statutory right to occupy the highway to
undertake their works. National Grid can avoid penalties and overruns if their noticing
and works duration is right first time.
� Under TMA permit schemes, working without a permit is a criminal offence. In order
to obtain grant of permit, National Grid must comply with permit conditions imposed
by the HA.
� The above significantly increases the planning, resource management and work
delivery management input, in addition increased restrictions from permit conditions
impact on productivity, especially on long-cycle works such as mains replacement.
� Permit conditions also used to impose other HA charges which would have previously
been negotiable including; traffic orders, parking suspensions, specialist traffic
management, use of variable message signs and multiple iterations of traffic
management plans.
3.1.3 The above identified operational interfaces and factors lead to significant cost increases
in the delivery of National Grid’s operations as a direct consequence of the application of
the TMA legislation and are in the opinion of EC Harris, matters that fall properly within
the scope of the IAE under the Licence.
3.1.4 Matters which fall properly within the scope of the IAE under Part C of Special Condition
E7 of the Gas Transporter License are categorised as follows:
a. TMA Permit fees,
b. Fixed Penalties,
c. On-going administration,
d. Other costs which Ofgem directs should be treated as TMA costs.
3.1.5 As part of the 2011 London IAE submission and public consultation process. Productivity
costs, Lane rental and Overstay charges were recognised by Ofgem as relevant costs
for the purposes of sub-section (d) of the TMA IAE.

Claim for Income Adjusting Event associated with the impacts Traffic Management Act
echarris.com 9
Copyright © 2013 EC Harris. All rights reserved
3.2 Entitlement under the IAE Mechanism
3.2.1 The IAE mechanism is triggered when the cumulative additional cost over the relevant
period exceeds 1% of core allowed revenue.
3.2.2 Any IAE submission requires at least 6 months of actual costs, plus a projection to 31st
March 2013 (end of GDPCR1), or 6 months of actual costs in the case of submissions in
respect of the 2012/13 formula year.
3.2.3 To date Ofgem has allowed £18 per metre of mains abandoned within London permit
scheme areas to remunerate additional productivity costs.

Claim for Income Adjusting Event associated with the impacts Traffic Management Act
echarris.com 10
Copyright © 2013 EC Harris. All rights reserved
4 Supporting Evidence for Each Claim Head
4.1 The National Grid Network
The National Grid networks where TMA permit schemes have been introduced to date are London, the East of England and the North West.
Figure 1 – National Grid Delivery
Partners by Network
Each delivery partner and region, shown in Figure 1,has been reviewed separately and our reports for each are included in Appendices A and B. Through this process the following high level position was derived:
4.1.1 North London Gas Alliance
North London Gas Alliance (NLGA) has operated under permit schemes affecting its mains replacement workload for Inner Metropolitan since 2009. For the Outer Metropolitan and other parts of East of England Network permits were introduced during September 2012. In order to minimise the effect of the September 2012 introduction of permit schemes, National Grid’s delivery partners planned and delivered the majority of the workload in affected areas before December 2012.
Due to the NLGA having this collective mix of areas with and without permits plus the effect of high population density has proved, through data collection, to have encountered the most impact due to the TMA. The availability of options to minimise the impact of the introduction through scheduling of works has been limited due to the number of different authorities and coverage. Please see figure 2.
North London
Gas Alliance Skanska
Coalition Morrison Utility Services (MUS)
East of England
M1 Corridor Gas Alliance
AMEC
Coalition Morrison Utility Services (MUS)
East Anglia Alliance
Skanska
North West Gas Alliance Balfour Beatty Utility Solutions (BBUS)
Coalition Enterprise Managed Services (EMS)

Claim for Income Adjusting Event associated with the impacts Traffic Management Act
echarris.com 11
Copyright © 2013 EC Harris. All rights reserved
Boroughs with Permits
Boroughs without Permits
Barnet Haringey Redbridge
Havering
Brent Harrow Richmond
Tower Hamlets
Camden Hounslow Southwalk
City of London Islington TfL
Enfield Kensington &
Chelsea
Waltham Forest
Hackney Lambeth Wandsworth
Hammersmith &
Fulham Newham Westminster
Figure 2: North London Highway Authorities implementation of permit schemes
4.1.2 North London Coalition
Further to extensive discussions and review of data it is clear that Morrison Utility Services (MUS) due to the nature of the works undertaken have been able to better manage the impact of the TMA. This is due to the Works being predominately short sections with shorter duration and thus the impact on productivity is less. The precise additional cost is not able to be defined at the time of this report. Areas which may have an affect over time are the drawings and specialist traffic management requirements. A regular review will need to be carried out, in order to provide robust data to assist any further extra cost impacts. It has been concluded therefore, that with the type of work undertaken, productivity issues have been managed through strong supply chain management therefore the IAE trigger has not been reached for MUS.
4.1.3 East of England
In the East of England (EoE) area, nine HAs are operating a TMA Permit Scheme:
• Sheffield City Council
• Barnsley Metropolitan Borough Council
• Doncaster Metropolitan Borough Council
• Rotherham Metropolitan Borough Council
• Northampton County Council
• Bedford Borough Council
• Hertfordshire County Council
• Luton Borough Council
• Southend-on-Sea Borough Council
Permit schemes were introduced during 2012 and therefore the IAE trigger has not been reached within the GDPCR1 period, however over the coming months the impact and associated costs will affect the financial position and should be taken into account in Year 2013-14.
The Alliance partner in the East Midlands region of the East of England is AMEC operating the M1 Corridor Gas Alliance (M1CGA), and the Alliance partner for the East Anglia region is SkanskaMcNicholas. Morrison Utility Services (MUS) are the Coalition partner for the whole of the East of England.
� MUS have completed four projects under permits to December 2012 totalling £49,000, the projects can be found in Appendix A.
� AMEC have completed six projects under TMA Permit Schemes from the 1st October 2012 to December 2012 totalling £755,000, the projects can be found in Appendix B.
� Skanska’s data has been included within the commentary under Section 5.1.1.

Claim for Income Adjusting Event associated with the impacts Traffic Management Act
echarris.com 12
Copyright © 2013 EC Harris. All rights reserved
4.1.4 North West
In the North West area only one Highway Authority, St Helens, is operating a TMA Permit Scheme. The Merseyside Authorities Permit Scheme (MAPS) came into force in April 2011.
The IAE trigger for North West has not been reached for the GDPCR1 period and therefore information for the North West region has been recorded but not submitted as part of this report.
4.2 Permit, Fixed Penalty Notices, Section 74 & Administration Costs
Permit, Fixed Penalty Notices (FPNs) and S74 cost impacts are compiled centrally and the
supporting performance narrative can be found in the main National Grid report. The TMA
administration costs quantification method is set out in Figure 3 below;
Stage 1 Identify all resources involved in TMA-specific activities by team, title, role
description and pay grade
Stage 2 Quantify specific percentage Full Time Equivalent involvement in TMA by
short-term timesheet exercise or by detailed management assessment
Stage 3 Calculate total TMA hours by resource
Stage 4 Apply standard pay rates + uplifts
Figure 3 – Administration cost process
The above process has been detailed in previous correspondence.
4.3 Other costs which Ofgem directs should be treated as TMA costs
Ofgem provided a cost capture sheet to highlight its understanding of the requirements to be
captured under ‘Other Costs’. These are the following:
� PAA Rejections/Repeat PAA's
� Change of Working Technique
� Fixed Penalty Notice
� Parking Bay Suspensions
� Bus Stop Suspensions
� Traffic Management Drawings
� Specialist Traffic Management
� Temporary Traffic Restriction Orders
� Removal/reinstatement of traffic islands and pedestrian crossings
� Removal/reinstatement of street furniture

Claim for Income Adjusting Event associated with the impacts Traffic Management Act
echarris.com 13
Copyright © 2013 EC Harris. All rights reserved
� Restricted Working Length - Programme Delay
� Restricted Working Length - Additional Connections
� Extended / Restricted Working Hours
� Reinstatement
� Material Delivery Restrictions
� Delay / Additional Works
� Issues with spoil disposal
� License for Spoil and Welfare Units
4.3.1 Fixed & Variable Costs
The ‘Other costs’ listed in 4.3 can be categorised into Fixed cost impacts and Variable cost
impacts or as described from hereafter Productivity cost impacts.
� Fixed cost impacts are not related to price per metre and cover items such as the Permit
costs, FPNs, NRSWA Section 74 and administration costs. It is in the opinion of EC Harris
that the above list of ‘Other costs’ should be part of fixed costs and thus incorporated into
the same reimbursement process as actual cost. The reasoning for this is that these costs
represent a high single financial element dependent on the specific location of the works.
This could develop an average which creates and unreasonable cost upper and lower
delta.
� Productivity cost impacts are directly related to location, pipe diameter and time frame
these are variable costs which directly affect the price per metre laid / abandoned and
need to be included as part of the averaged IAE. The terminology used to define these
variable costs has been Productivity cost impacts.
4.4 The Process Adopted to Evidence each Claim Head
Having identified the heads of claim against which the IAE will be formulated, it is important to
demonstrate appropriate levels of supporting evidence for each claim head.
EC Harris set out in the next section a structure and its approach.

echarris.com
Copyright © 2013 EC Harris. All rights reserved
5 TMA Cost Capture Process
EC Harris developed the following process shown in Figure 4 to capture and utilise the cost data
per project.
Figure 4 – Data capture process
5.1 Gather cost data on projects
In order to understand the impact of TMA it was considered by National Grid and Ofgem to
collect costs directly from the Alliance and Coalition partners over a 6 month period. This
process involved working from the offices of National Grid’s partners and h
all cost data, in addition to individuals involved in the day to day project delivery as required.
5.1.1 North London Gas Alliance
The NLGA have introduced a zone system to distinguish their boundaries.below shows the zones for London
Refer back to data as evidence
Gather cost data on projects
Claim for Income Adjusting Event associated with the impacts Traffic Management Act
EC Harris. All rights reserved
TMA Cost Capture Process
EC Harris developed the following process shown in Figure 4 to capture and utilise the cost data
Gather cost data on projects
In order to understand the impact of TMA it was considered by National Grid and Ofgem to
collect costs directly from the Alliance and Coalition partners over a 6 month period. This
process involved working from the offices of National Grid’s partners and h
all cost data, in addition to individuals involved in the day to day project delivery as required.
North London Gas Alliance
The NLGA have introduced a zone system to distinguish their boundaries. The map in figure below shows the zones for London
Refer back to data as evidence
see 5.4
Review productivitysee 5.3
Separate fixed costssee 5.2
Gather cost data on projectssee 5.1
ing Event associated with the impacts Traffic Management Act
14
EC Harris developed the following process shown in Figure 4 to capture and utilise the cost data
In order to understand the impact of TMA it was considered by National Grid and Ofgem to
collect costs directly from the Alliance and Coalition partners over a 6 month period. This
process involved working from the offices of National Grid’s partners and having open access to
all cost data, in addition to individuals involved in the day to day project delivery as required.
The map in figure 5

Claim for Income Adjusting Event associated with the impacts Traffic Management Act
echarris.com 15
Copyright © 2013 EC Harris. All rights reserved
Figure 5 – Zones in relation to Outer & Inner Metropolitan areas
� Data has been collected over a 9 month period from projects dating back to April 2012. � Data capture sheets have been completed on 120 projects. Please see Appendix C � 376 projects during 2012 /13 were closed between 1st April 2012 and 31st December
2012. � EC Harris has reviewed 31% of the projects started in the above time period. This
percentage collected was considered by EC Harris to provide a high sample number and
reflected a broad range of the total number of projects delivered.

Claim for Income Adjusting Event associated with the impacts Traffic Management Act
echarris.com 16
Copyright © 2013 EC Harris. All rights reserved
Figure 6 – Number of NLGA projects per zone assessed by EC Harris
Figure 7 – Number of NLGA projects per diameter abandoned assessed by EC Harris
In figure 6 the location of the projects is depicted and clearly shows that the sample of projects
collated provides a representative spread of the zones. In figure 7 the types of project per
diameter pipe size collected highlights the predominance of 4 – 5” abandoned which is
representative of the projects completed.
0 5 10 15 20 25 30 35
Zone 6
Zone 5
Zone 4
Zone 3
Zone 2
Zone 1
Number of Projects
0 5 10 15 20 25 30 35 40 45
<=3"
4 - 5"
6 - 7"
8 - 9"
10 - 12"
>12 - 18"
>18 - 24"
>24"
Number of Projects
Dia
me
ter
Ab
an
do
ne
d

Claim for Income Adjusting Event associated with the impacts Traffic Management Act
echarris.com 17
Copyright © 2013 EC Harris. All rights reserved
5.1.2 North London Coalition
Within the North London Gas Network there are 40 Local Authorities including Transport for London. Of these, 38 apply the legislation under the TMA relating to permit schemes. The two boroughs that operate a noticing scheme are Havering and Tower Hamlets and these are due to operate permits from April 2013.
Within London, there were approximately 170 policy jobs (Replacement, reinforcement, conditioning) to be carried out in financial year 2012/13 under contract 2162. Approximately 130 of these jobs fall under TMA permit conditions, with 40 under NRSWA noticing. Of these 170 jobs, 11 are scheduled to have either three way, or priority lighting and 17 were scheduled to have road or lane closure.
Having reviewed several completed projects and spoken to MUS and National Grid employees, EC Harris’ view is that due to the type of projects delivered, short lengths, the majority of extra costs experienced are due to administration and the Lane Rental costs.
5.1.3 East of England
AMEC completed six projects under a TMA Permit scheme between 1st October and 31st December 2012.
AMEC have actively managed to counter some of the effects of the restrictions imposed by the timing of TMA Permit approvals through planning the majority of their works in areas which were subject to less stringent restrictions by HA’s. This was a short term strategy to avoid the financial consequences and impact of the permit schemes, which meant the IAE trigger was not reached for the GDPCR1 period. However it is EC Harris’ opinion that the possibility to vary the location of works will be reduced in the forthcoming RIIO GD1 period.
5.2 Separate Fixed costs
Fixed costs including items such as Permit, FPNs, Section 74 and Administration Costs are
removed from the project data and assessed by National Grid. However the following are further
fixed costs which have an impact on the implementation of Permit conditions.
Increased number of inspections
Higher frequency of inspections & charges (excluding defect repair costs).
Additional traffic management plans, which occur especially where projects involve
side road junctions and / or subject to working length restrictions, but can be multiple
iterations to satisfy HA’s.
Additional parking bay / bus stop suspensions.
Pre-permits these could often be avoided by agreement or by works configuration.
Under permits HA’s can impose their requirements.
Temporary Traffic Restriction Orders.

Claim for Income Adjusting Event associated with the impacts Traffic Management Act
echarris.com 18
Copyright © 2013 EC Harris. All rights reserved
5.3 Review productivity
Productivity levels vary depending on location. It is important to understand the effects on
productivity of the conditions below.
Restricted working length in highway.
Additional excavations; jointing; materials & logistics; reinstatement; team mobilisation
/ demobilisation; increased delays (also TM plans, etc.)
Restricted permit duration for project phase
Increased resourcing & other costs to meet shorter duration.
Out of hours working
Higher unit costs and lower work rates where overnight + additional plant &
equipment. Delays due to EHO interventions, etc.
Restricted working hours
Shorter working (e.g. avoiding peak hours) = longer total duration and increased
unproductive time.
Restrictions on materials delivery and/or storage.
Restrictions (typically in urban centres) can impact work rate and increase logistics
costs, if need for off-site storage / parking for materials / plant.
Delays / additional / abortive works imposed.
HA’s typically requiring on-site meetings to agree permit conditions, or stopping works
where unforeseen obstacles require works footprint variation, etc.
Re-phasing of Traffic Signals.
Traffic separators / mobile signals.
HA’s in urban centres can insist on 24-hour manning of signals.
Additional publicity.
HA’s may impose more onerous requirements for advance public engagement and
liaison with stakeholders, esp. in urban centres.
The above are not itemised individually in the cost breakdown, but are an example of the impact being managed by National Grid and provide weight of evidence to the requirement of extra financial recompense.
5.4 Refer back to data as evidence
Please refer to our data capture sheets included within Appendix C.
Claim for Income Adjusting Event associated with the impacts Traffic Management Act
echarris.com 19
Copyright © 2013 EC Harris. All rights reserved
6 Contemporary Evidence
6.1 Primary Consideration
6.1.1 Having undertaken a review of all National Grid’s delivery partners it is apparent that the records in the format requested by Ofgem are not routinely collected by the delivery partners. Investigation into why this is the case illustrated that neither National Grid, nor Ofgem had considered this a requirement at the time of contract formation as the operation of TMA had not been developed or agreed by HA’s. As a consequence the collection, assimilation and presentation of such information is not a contractual requirement under the executed contracts provided to the delivery partners. Therefore isolated costs for productivity issues related to the TMA have not been recorded. Through the management accounting process, costs are tracked month on month. Therefore the networks and contractors will understand their performance at a cost per metre basis and are required to highlight the differences. This could be a range of issues such as mains abandon length variance or a more complex engineering solution being required, but the cost process deployed by NLGA does not allow for cost capture on this level and therefore it is not available. Such issues were not contemplated when the contractual framework was designed and it appears that Ofgem only specified its requirements in response to the 2011 IAE submission provided by National Grid.
6.1.2 EC Harris have examined the information that has been assimilated and provided and it is evident from the process reviewed that the list of all conditions provided within the issued Cost Capture sheet as identified in appendix C, which in principle effect the productivity and the cost of delivery, has been undertaken as a desk top exercise and it is not recognisable on a project to project basis.
6.1.3 Any deviation to the contractual requirements in terms of amending the record keeping requirements to the delivery partner’s normal contractual process would result in the need to instigate change control. At the time of instigation of the TMA permits all items listed in the heads of term for productivity cost impact would have had to be individually assessed and recorded at the time of effect. This would produce, as part of that change control a considerable on-cost which, commercially operating organisations could not at the time of impact justify. It must be remembered that the requirement is to evidence costs for Streetworks which have or are likely to exceed 1% of allowed revenues. At a project by project basis and to the extent of the cost capture sheet, was at time of impact not anticipated.
6.1.4 At this time the following is evident:
i. A target price is derived from previous year outturn costs.
ii. Change control is used for major changes to works such as engineering revisions or delays.
iii. Only on few occasions has change control been used to capture a productivity issue. This is due to engineering teams not appreciating the wider impact of TMA costs on a project by project basis, as their focus is on the physical mains replacement. Actual cost is paid based on invoicing coded to each individual project and not reflected in the same format as the target cost.
iv. It is only after all costs are captured that a review of a new target cost based on actual length is possible – this process effectively reduces the pain, but also does not fully capture the gain.
v. At the end of each year a review is completed between actual and revised target prices to ascertain the final settlement.

Claim for Income Adjusting Event associated with the impacts Traffic Management Act
echarris.com 20
Copyright © 2013 EC Harris. All rights reserved
6.1.5 EC Harris is confident from the examination of the matter that a cost breakdown into the specific productivity cost impact heads of claim is not possible, nor would it mean anything if it could be undertaken. This is because on individual projects there would always be an element of challenge which would cause considerable time and expense to collate, present and analyse.
6.1.6 At this point EC Harris can confirm that after reviewing a significant sample of projects, the cost data assessed provides comprehensive evidence that there is TMA impact on productivity. The difficulty with the information is how it is currently presented and used. The methodology used by National Grid when originally contracting with their partners was for cost data to be used in the production of target estimates and for cost capture for actual cost payments. The impact of productivity implications was not fully understood at the time of setting up the GDPCR1 partner contracts, therefore the facility to capture these specific costs was neither developed nor implemented.
6.1.7 There are a number of further considerations to examine, it has to be understood that to change these contractual conditions would have been cost prohibitive due to requiring considerable training in recording TMA onsite requirements, in addition to change control and management time and any such form of change would not have been possible without significant delivery and financial impact to National Grid, without knowing at the time whether the introduction of the TMA would actually become an IAE.
6.2 Target cost production
6.2.1 From a detailed examination of the target costs EC Harris can confirm that since 2009/10 target costs an increase has been added to adjust for the known changes in costs. This variance has been included as a one off percentage variance to cover all productivity outputs amendments from the previous year and amended depending on the HA. These amendments are considerable, ranging from a benefit of 15% saving in the Outer Metropolitan HAs where the majority of works undertaken were in areas where the permit scheme had not been introduced, to an increase of 50% in certain Inner Metropolitan HAs where the majority of HA’s have implemented permit schemes.
6.2.2 As this factor amends the total target cost per authority rather than reviewing each individual project, its impacts is not possible to either track or test against any actual costs on site. This has been used as a pragmatic process to produce a commercially acceptable target price decision by averaging and does not give a project by project cost base to track problems.
6.2.3 6.2.2 confirms a significant point, because if each project was properly assessed and priced then there would be a significant increase in the estimating and project controls resources required and hence overhead attached to each project to cover this additional resource. It is fundamentally through this process that the partners cannot track the impact, and the reason why National Grid cannot provide the evidence Ofgem have requested in the form it requires.
6.2.4 The target estimates are produced on two fundamental principles, the size of the team and the length of laid pipe plus ancillaries. The programme does not affect the target cost directly as it is based on the length abandoned. Therefore any increase in duration due to productivity constraints is not reimbursed through the target price process.
6.2.5 Therefore the critical factor with TMA permit introduction becomes the size and productivity of the gangs as the rates are based on productivity outputs from the previous year.
6.2.6 In principle a three man gang is used up to 180mm and a five man gang over 180mm. Any non-productive hours incurred due to the TMA permits will affect a 5 man gang more than a three man gang, which will result in the additional cost per metre being

Claim for Income Adjusting Event associated with the impacts Traffic Management Act
echarris.com 21
Copyright © 2013 EC Harris. All rights reserved
greater. Figure 8 shows how the pipe mains replacement increased 5 gang delivery with more <180mm and a decrease in work to >180mm, from 2007 till 2011. This results in a potential higher cost effect over this time frame due to the TMA.
Zone by Year
Zone Size 2007/08 2008/09 2009/10 2010/11 2011/12 2012/13
1 >180 44831m 28036m 11170m 11311m 15286m 11866m
<180 12720m 27448m 17098m 14394m 12357m 9674m
2 >180 84238m 74166m 65397m 54002m 54824m 47399m
<180 18978m 27384m 33180m 33492m 25608m 20620m
3 >180 83650m 89540m 73491m 62565m 63911m 44838m
<180 15354m 22387m 51036m 51617m 47384m 36234m
4 >180 91878m 104355m 96074m 109406m 63924m 42550m
<180 34031m 39041m 40510m 30846m 25365m 14952m
5 >180 0m 0m 33513m 37625m 54783m 37104m
<180 0m 0m 25783m 37424m 23987m 19144m
6 >180 0m 0m 0m 0m 58395m 43796m
<180 0m 0m 0m 0m 9890m 10011m Figure 8: Abandonment by Diameter and Zone per Year
Please note: 2012/13 lengths are to the end of December 2012
6.3 Cost collection
The projects collected all have a unique reference number and it is this number that project
costs are charged to. Due to the way actual costs are recorded it is only possible to undertake a
high level total actual project cost comparison against the target price.
The expectation that if data is captured is on a project basis, then the TMA productivity issues
can be analysed is not reasonable for the following reasons:
� Every scheme is different, however the target costs do not allow for the complexities of sites. Thus averages and norms are utilised to come to an average cost.
� Due to the usage of averages and norms it is impossible to advise whether a differing methodology or a change in timescales would cause a defined extra over cost directly attributable to the TMA, therefore it is not possible for cost collection to correctly flag up the right cost drivers.
6.4 The payment process
The payment process compounds the problems with detailing costs, as through reimbursement
of actual cost the clarity of cost expenditure against output reduces.
This is then further compounded with the revising of the target cost estimates by taking into
account the actual lengths laid and abandoned.
Finally it is at the end of each financial year that the totals of projects delivered in terms of
volume are validated and the pain gain assessed. By this time more than 300 projects covering
over a thousand roads and multiple HAs will have been completed. To go back and revisit these
projects to assess ‘missed’ TMA permit productivity issues would neither be sensible nor
reasonable and therefore assessments have to be made.

Claim for Income Adjusting Event associated with the impacts Traffic Management Act
echarris.com 22
Copyright © 2013 EC Harris. All rights reserved
7 Financial Consideration
7.1 Generally
7.1.1 Within the North London Gas Alliance (NLGA), the TMA permit scheme was introduced in 2008/09.
Region Percentage
Permit
East Anglia 6%
Outer Metropolitan 16%
Inner Metropolitan 78% Figure 9: Percentage increase in costs due to implementation of the TMA, by Area
7.1.2 Figure 9 shows that TMA permits affect Inner Metropolitan region considerably more than the other regions, this is supported by EC Harris’ data capture where higher cost increases of productivity have been seen in this region.
7.1.3 The graph in figure 10 below represents the average actual cost of abandoned pipe delivered by the NLGA over a 5 year period.
7.1.4 Prior to TMA permit scheme introduction in 2009 the cost per metre abandoned excluding pipes and fittings was ____, dropping to ____ per metre in 2008/09 showing efficiencies were being made. In year 2009/10, this cost rose sharply to ____ per metre and since year 2010/11 where maximum cost of _______ per metre was delivered, this has dropped in year 2011/12 & 2012/13 indicating National Grid’s better understanding and management of the TMA permit process; see Section 8 for further details of this.
Figure 10: Average Actual Cost of Abandoned Pipe for the NLGA
2007/08 2008/09 2009/10 2010/11 2011/12 2012/13
Series1
£-
£/m Aba ndone d
Year
£/m Abandoned
echarris.com
Copyright © 2013 EC Harris. All rights reserved
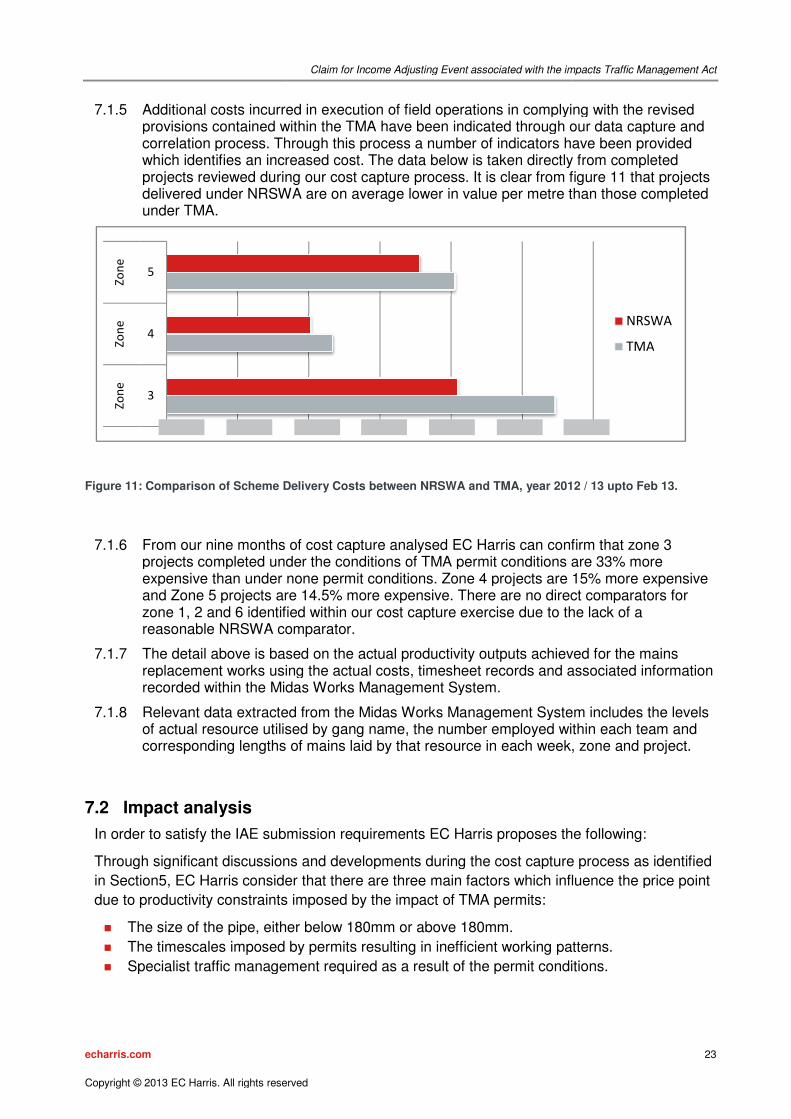
7.1.5 Additional costs incurred in execution of field operations in complying with the revised provisions contained within the TMA have correlation process. Through this process a number of indicators have been provided which identifies an increased cost. The data below is taken directly from completed projects reviewed during our cost capture prdelivered under NRSWA are on average lower in value per metre than those completed under TMA.
Figure 11: Comparison of Scheme Delivery Costs between NRSWA and TMA
7.1.6 From our nine months of cost capture analysed EC Harris can confirm that zone 3 projects completed under the conditions of TMA permit conditions are 33% more expensive than under none permit conditions. Zone 4 projects are 15% more eand Zone 5 projects are 14.5% more expensive. There are no direct comparators for zone 1, 2 and 6 identified within our cost capture exercise due to the lack of a reasonable NRSWA comparator.
7.1.7 The detail above is based on the actual productivity oureplacement works using the actual costs, timesheet records and associated information recorded within the Midas Works Management System.
7.1.8 Relevant data extracted from the Midas Works Management System includes the levels of actual resource utilised by gang name, the number employed within each team and corresponding lengths of mains laid by that resource in each week, zone and project.
7.2 Impact analysis
In order to satisfy the IAE submission requirements EC Harris proposes the fo
Through significant discussions and developments
in Section5, EC Harris consider that there are three main factors which influence the price
due to productivity constraints imposed by
� The size of the pipe, either below 180mm or above 180mm.
� The timescales imposed by permits resulting in inefficient working patterns.
� Specialist traffic management required as a result of the permit conditions.
3
4
5
Zo
ne
Zo
ne
Zo
ne
Claim for Income Adjusting Event associated with the impacts Traffic Management Act
EC Harris. All rights reserved
Additional costs incurred in execution of field operations in complying with the revised provisions contained within the TMA have been indicated through our data capture and correlation process. Through this process a number of indicators have been provided which identifies an increased cost. The data below is taken directly from completed projects reviewed during our cost capture process. It is clear from figure 1delivered under NRSWA are on average lower in value per metre than those completed
: Comparison of Scheme Delivery Costs between NRSWA and TMA, year 2012 / 13 upto Feb 13.
months of cost capture analysed EC Harris can confirm that zone 3 projects completed under the conditions of TMA permit conditions are 33% more expensive than under none permit conditions. Zone 4 projects are 15% more eand Zone 5 projects are 14.5% more expensive. There are no direct comparators for zone 1, 2 and 6 identified within our cost capture exercise due to the lack of a reasonable NRSWA comparator.
The detail above is based on the actual productivity outputs achieved for the mains replacement works using the actual costs, timesheet records and associated information recorded within the Midas Works Management System.
Relevant data extracted from the Midas Works Management System includes the levels ual resource utilised by gang name, the number employed within each team and
corresponding lengths of mains laid by that resource in each week, zone and project.
In order to satisfy the IAE submission requirements EC Harris proposes the fo
Through significant discussions and developments during the cost capture process as identified
EC Harris consider that there are three main factors which influence the price
productivity constraints imposed by the impact of TMA permits:
The size of the pipe, either below 180mm or above 180mm.
The timescales imposed by permits resulting in inefficient working patterns.
Specialist traffic management required as a result of the permit conditions.
ing Event associated with the impacts Traffic Management Act
23
Additional costs incurred in execution of field operations in complying with the revised been indicated through our data capture and
correlation process. Through this process a number of indicators have been provided which identifies an increased cost. The data below is taken directly from completed
ocess. It is clear from figure 11 that projects delivered under NRSWA are on average lower in value per metre than those completed
2012 / 13 upto Feb 13.
months of cost capture analysed EC Harris can confirm that zone 3 projects completed under the conditions of TMA permit conditions are 33% more expensive than under none permit conditions. Zone 4 projects are 15% more expensive and Zone 5 projects are 14.5% more expensive. There are no direct comparators for zone 1, 2 and 6 identified within our cost capture exercise due to the lack of a
tputs achieved for the mains replacement works using the actual costs, timesheet records and associated information
Relevant data extracted from the Midas Works Management System includes the levels ual resource utilised by gang name, the number employed within each team and
corresponding lengths of mains laid by that resource in each week, zone and project.
In order to satisfy the IAE submission requirements EC Harris proposes the following:
during the cost capture process as identified
EC Harris consider that there are three main factors which influence the price point
The timescales imposed by permits resulting in inefficient working patterns.
Specialist traffic management required as a result of the permit conditions.
NRSWA
TMA

Claim for Income Adjusting Event associated with the impacts Traffic Management Act
echarris.com 24
Copyright © 2013 EC Harris. All rights reserved
Despite many others items listed in Section 4.3 the results presented through data capture are
that pipe size and timescale create the most financial impact from the TMA, with specialist traffic
management being a direct consequence of working conditions.
7.2.1 The size of pipes
In the table below in Figure 12 represents the importance of the split, as any averaging could
significantly influence the results. For example, due to the high proportion of the quantity of
pipes being less than 180mm any change in cost has a significant impact. The fact that the
percentage of delivery has moved from low diameter to higher diameter at the time of TMA
introduction is significant and will affect data when averaged.
Figure 12: Work mix for NLGA per year
In our review we have assessed 52% of the total length for 2012/13 and the split we have
measured results in 73% of the pipes not exceeding 180mm, this is measured against the
yearly split of 81%. Therefore we can confirm that on this basis our results have a high level of
sample capture and represent a strong representation of the delivered projects.
In Figure 13 the table confirms the location, size and number of projects studied.
Zone Number
of Projects Total Laid <180mm
Total cost <180mm
£/m <180mm
Total Laid >180mm
Total cost >180mm
£/m >180mm
Zone 1 18 21,929 redacted redacted 4,794 redacted redacted
Zone 2 16 32,522 redacted redacted 4,524 redacted redacted
Zone 3 27 25,788 redacted redacted 17,914 redacted redacted
Zone 4 18 27,854 redacted redacted 6,562 redacted redacted
Zone 5 16 17,260 redacted redacted 12,879 redacted redacted
Zone 6 1 1,326 redacted redacted 0 redacted redacted
TOTAL 96 126,679 redacted redacted 46,673 redacted redacted
Figure 13: Projects by Zone, Cost and Diameter
2008/09 2009/10 2010/11 2011/12 2012/13
Length laid m M m m m
below 180mm 324,014 83% 325,930 77% 344,974 79% 357,907 81% 265,346 81%
above 180mm 64,559 17% 97,226 22% 89,471 21% 85,326 19% 60,338 19%
Total length
laid
388,573 423,156 434,445 443,233 325,684
Total Length
abandoned
413,585 443,193 443,861 450,944 334,154

Claim for Income Adjusting Event associated with the impacts Traffic Management Act
echarris.com 25
Copyright © 2013 EC Harris. All rights reserved
The effect of the differing pipe size is considerable, see Figure 13. Laying pipe with a diameter
of less than 180mm is resulting in a range from ___ to ____ per metre, averaging ______ a
metre. Over 180mm is resulting in a range from ____ to ____ per metre, averaging ____ per
metre.
This is important for on-going discussions of TMA permit conditions, as it is considered sensible
for discussions to separate these two bandings in order to obtain the suitable recompense per
size. Otherwise one size may be impacted more than another forcing a commercially minded
delivery partner to adopt different selection criteria for work delivery.
In the chart identified in Figure 14, this difference is represented diagrammatically and highlights
that any increase based on a percentage mark up or a single rate could have adverse effects
when reviewed proportionately.
Figure 14: Cost of Abandonment by Zone and Diameter
When assessed over the last 5 years, as seen in the charts in Figure 15, it is clear that the
NLGA delivery partner has moved away from planning and executing works within the high
impact areas in zone 1 and concentrated on working within lower impact zones. This change of
delivery patterns particularly between years 2008 and 2010 could have been due to the effects
of the TMA impacting Zone 1 harder rather than on other zones.
1 2 3 4 5 6
Zone
£/m
<180mm
£/m
>180mm

echarris.com
Copyright © 2013 EC Harris. All rights reserved
Figure 15: Work by Zone by Year
7.2.2 The effect of defined timescales
The introduction of the TMA permit process has effected project durations. The
methods deployed by the contractors prior to permit requirements allowed contractors to
manage and deploy labour more
another where issues occur, or to ensure roads carrying high
resource, potentially leaving other sites to take longer in duration if not man hours.
This methodology of working was the norm for all non
processes, cost capture process and site managemen
The effect of the introduction of the TMA permit scheme was defined through discussions with
National Grid, Alliance and Coalition Partners is as follows:
� Greater level of upfront work around planning/programming theup to 6 months ahead whereas under NRSWA a 3 month look ahead was the norm.
� Greater and more time consumingagreed prior to commencement on site.
Claim for Income Adjusting Event associated with the impacts Traffic Management Act
EC Harris. All rights reserved
The effect of defined timescales
The introduction of the TMA permit process has effected project durations. The
methods deployed by the contractors prior to permit requirements allowed contractors to
more effectively and efficiently by moving labour from one project to
another where issues occur, or to ensure roads carrying high on-costs have the focused
resource, potentially leaving other sites to take longer in duration if not man hours.
This methodology of working was the norm for all non-permitting boroughs and all target cost
processes, cost capture process and site management processes aligned to this methodology.
The effect of the introduction of the TMA permit scheme was defined through discussions with
Coalition Partners is as follows:
Greater level of upfront work around planning/programming the works. Typically planning up to 6 months ahead whereas under NRSWA a 3 month look ahead was the norm.Greater and more time consuming liaison with the HA’s to ensure permit conditions are agreed prior to commencement on site.
ing Event associated with the impacts Traffic Management Act
26
The introduction of the TMA permit process has effected project durations. The working
methods deployed by the contractors prior to permit requirements allowed contractors to
effectively and efficiently by moving labour from one project to
costs have the focused
resource, potentially leaving other sites to take longer in duration if not man hours.
permitting boroughs and all target cost
t processes aligned to this methodology.
The effect of the introduction of the TMA permit scheme was defined through discussions with
works. Typically planning up to 6 months ahead whereas under NRSWA a 3 month look ahead was the norm.
liaison with the HA’s to ensure permit conditions are
Claim for Income Adjusting Event associated with the impacts Traffic Management Act
echarris.com 27
Copyright © 2013 EC Harris. All rights reserved
� The planning and design process now requires a site survey to be undertaken which may involve a planner and TM specialist.
� A walk through of the site is likely to be required with the HA’s especially on more complex works or where works are required in traffic sensitive location.
Project types NRSWA Permits
Standard Discussion Drawings
Complex Site Visit More site visits & drawings
Figure 16– Difference between NRSWA & TMA Permit Scheme Requirements
� A greater amount of time and effort is required in producing TMA drawings by the in-house team.
� Greater amount of time spent in populating in-house databases such as Ops database, GNFO and EToN.
� Site gangs required to be up-skilled to meet the demands/constraints of the Permit scheme to ensure compliance with the legislation and avoid FPNs.
� Site supervisors spending more time liaising with the HA’s as changing circumstances dictate.
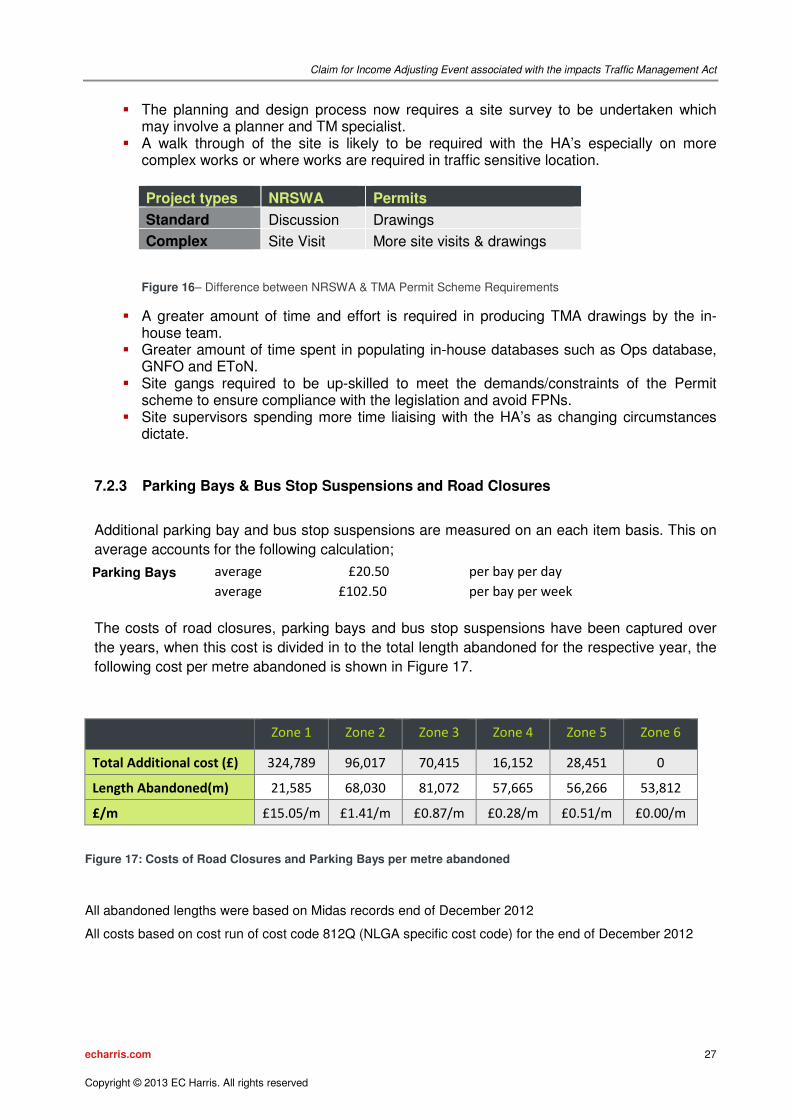
7.2.3 Parking Bays & Bus Stop Suspensions and Road Closures
Additional parking bay and bus stop suspensions are measured on an each item basis. This on
average accounts for the following calculation;
Parking Bays average £20.50 per bay per day
average £102.50 per bay per week
The costs of road closures, parking bays and bus stop suspensions have been captured over
the years, when this cost is divided in to the total length abandoned for the respective year, the
following cost per metre abandoned is shown in Figure 17.
Zone 1 Zone 2 Zone 3 Zone 4 Zone 5 Zone 6
Total Additional cost (£) 324,789 96,017 70,415 16,152 28,451 0
Length Abandoned(m) 21,585 68,030 81,072 57,665 56,266 53,812
£/m £15.05/m £1.41/m £0.87/m £0.28/m £0.51/m £0.00/m
Figure 17: Costs of Road Closures and Parking Bays per metre abandoned
All abandoned lengths were based on Midas records end of December 2012
All costs based on cost run of cost code 812Q (NLGA specific cost code) for the end of December 2012

Claim for Income Adjusting Event associated with the impacts Traffic Management Act
echarris.com 28
Copyright © 2013 EC Harris. All rights reserved
7.3 Productivity cost impact
7.3.1 Productivity rates for pre TMA permit schemes
In order to understand the lower productivity through the London zones, productivity levels need
to be ascertained prior to the implementation of the TMA permit process. The differences
between each zone require to be maintained throughout each year and the rate factored
accordingly to eliminate the densely populated driver.
Throughout all the pricing packages NLGA have utilised a base cost for productivity levels.
These were assessed at the original contract cost pricing in years 2007 to 2013 as being the
pre-permit average. Since year 4 these have been factored to take into account certain
boroughs complexities and inefficiencies. Once these have been removed and it is assumed
that below 180mm utilise a 3 man gang and over 180mm use a 5 man gang then the following
length per week per man were envisaged for works before permit introduction.
Figure 18: Original assumed productivity of pipe laid
metres per week
year size 3 man gang 5 man gang m per man
2012/13 >180mm 82.81 28
<180mm 94.45 19
2011/12 >180mm 82.34 27
<180mm 94.67 19
2010/11 >180mm 81.18 27
<180mm 87.76 18
2009/10 >180mm 80.39 27
<180mm 87.27 17
2008/09 >180mm 80.79 27
<180mm 95.53 19
2007/08 >180mm 79.62 27
<180mm 95.90 19

Claim for Income Adjusting Event associated with the impacts Traffic Management Act
echarris.com 29
Copyright © 2013 EC Harris. All rights reserved
7.3.2 Actual Productivity rates
When assessing the productivity rates there is a direct causation with the cost per metre
abandoned rates, see Figure 19, which represents the cost per metre abandoned for all
networks. It is due to this higher cost per metre abandoned that provides further evidence that
TMA permit schemes are raising the cost per metre abandoned, in the figure below at time of
the report it was only NLGA Outer & inner Met which were working under permit conditions and
thus extra over cost to the rest of the networks is more than just location.
Therefore we propose to provide the original pre TMA permit scheme productivity rate and
compare it to current, this difference is strongly considered to be the productivity element of the
introduction of TMA permit schemes.
Figure 19– Output cost per metre abandoned 2012/131
a. The complexities of working in London
When viewed with the productivity rates in figure 20 the zones as identified in section5.1.1 are directly related to the difficulties faced by the location of the works sites, with Zone 1 delivering on average only 13 metres per man per week, up to Zone 6 delivering 29 metres per man per week. This level of productivity has been benchmarked against the other Alliance partners and it is zone 6 works which have the closest correlation.
b. Efficiency gains
It can be seen between target and actual both M1CGA and NWGA have proven to deliver efficiencies through improved productivity rates in year 2012/13 from target to actual. This has been in part due to focusing delivery in areas which have not applied the TMA permit scheme in addition to improved working processes.
1* Excludes services
** Excludes prelims, Alliance office overhead site supervision and management
NLGA Inner Met
NLGA Outer Met
NLGA East Anglia
BBUSL**
M1 Corridor Gas Alliance*
£/m Abandoned

Claim for Income Adjusting Event associated with the impacts Traffic Management Act
echarris.com 30
Copyright © 2013 EC Harris. All rights reserved
Figures 20, 21and 22, below,shows the productivity of the organisations identified, for year
2012/13 of the GDPCR1.
Weeks Size
Inner Met Outer Met
Zone 1 Zone 2 Zone 3 Zone 4 Zone 5 Zone 6
Average metres per man per week <180mm 16 23 25 25 29 35
Average metres per man per week >180mm 11 16 17 17 20 24
average 13 20 21 21 25 29
Figure 20 - Productivity rates for NLGA year 2012/13
Weeks Target Actual
Average metres per man per week 28 31
Figure 21 - Productivity rates for M1CGA year 2012/13
Weeks Target Actual
Average metres per man per week 32 Not available
Figure 22 - Productivity rates for NWGA year 2012/13
The above Figures will provide the data to enable a productivity calculation to be made to
provide the value for the IAE. Through discussions with National Grid and their delivery
partner’s, the productivity rates identify the following conclusions:
From the above Figures 20 through 22, and from the detailed review undertaken, all alliance
partners assessed made improvements to their productivity levels over the years assessed.
The NLGA’s productivity in East Anglia is similar to that of the other Alliance partners and
therefore we can extrapolate that the work in East Anglia is similar that in other Networks. Inner
Metropolitan London HA’s are operating the same processes therefore the lower productivity is
partly due to operating in a densely populated area and partly due to the impact caused by the
TMA permit process.

echarris.com
Copyright © 2013 EC Harris. All rights reserved
7.4 Effect of productivity reduction
The following table in figure 23 represents the cost per metre abandoned based on the actual cost of the projects reviewed by EC Harris. All at real prices.
Figure 23 – Price per metre abandoned per year & pipe size
This base data is not able to be divided by zone therefore the average is used.
7.4.1 National Grid completed the required lengths but permit requirements, more reso
Equation used:
Abandoned -Abandonedx actual productivity
Original productivity
Figure 24–Shortfall of lengths due to productivity constraints
7.4.2 The shortfall is multiplied by the average cost of the installation for the respective year as provided from figure 2
All Zones
<180mm £/m abandoned
>180mm £/m abandoned
Claim for Income Adjusting Event associated with the impacts Traffic Management Act
EC Harris. All rights reserved
Effect of productivity reduction
The following table in figure 23 represents the cost per metre abandoned based on the actual cost of the projects reviewed by EC Harris. All at real prices.
Price per metre abandoned per year & pipe size
able to be divided by zone therefore the average is used.
National Grid completed the required lengths but because of the shortfall due to the TMA more resources were expended to deliver this shortfall.
actual productivity= Shortfall
of lengths due to productivity constraints
The shortfall is multiplied by the average cost of the installation for the respective year igure 23.
2009/10 2010/11 2011/12
£/m abandoned redacted redacted redacted
£/m abandoned redacted redacted redacted
ing Event associated with the impacts Traffic Management Act
31
The following table in figure 23 represents the cost per metre abandoned based on the actual cost of the projects reviewed by EC Harris. All at real prices.
able to be divided by zone therefore the average is used.
because of the shortfall due to the TMA urces were expended to deliver this shortfall.
The shortfall is multiplied by the average cost of the installation for the respective year
2011/12 2012/13
redacted redacted
redacted redacted

Claim for Income Adjusting Event associated with the impacts Traffic Management Act
echarris.com 32
Copyright © 2013 EC Harris. All rights reserved
7.4.3 Please refer to figure 25 below.
7.4.4 The result is an extra over cost for delivering the shortfall at real prices. Once divided by the total abandoned length an extra over rate per metre of the total abandoned is provided.
7.4.5 The parking bay & suspended bus stops allowance is added based on 2012 prices.
7.4.6 The extra over rate is indexed for inflation to ensure it is at 2009 prices, after which the original £18 per metre can be deducted.
7.4.7 This final rate per metre abandoned is then applied the total length abandoned per size and zone to produce a productive cost figure. Please note the length abandoned in 2012/13 is up to end December 2012

echarris.com
Copyright © 2013 EC Harris. All rights reserved
Figure 25: Additional Cost of the TMA by zone
Claim for Income Adjusting Event associated with the impacts Traffic Management Act
EC Harris. All rights reserved
: Additional Cost of the TMA by zone
ing Event associated with the impacts Traffic Management Act
33

Claim for Income Adjusting Event associated with the impacts Traffic Management Act
echarris.com 34
Copyright © 2013 EC Harris. All rights reserved
8 Conclusion
Taking the above sections in to consideration EC Harris can conclude the following:
a. There is overwhelming evidence from all National Grid’s delivery partners that the implementation of the TMA permit scheme is requiring more time upfront to plan, organise and administer the work stack. This additional input is exacerbated by the subtle differences in implementation of the TMA between different HAs.
b. There is overwhelming evidence from all National Grid’s delivery partners that the implementation of the TMA permit scheme requires a change in sequencing and methodology, which creates a strain on the efficient resource allocation.
c. The current contractual relationships and reporting requirements between National Grid and its delivery partners do not enable these differences of productivity to be readily identified in the format requested by Ofgem. In addition the increased overhead cost of implementing a revised reporting regime would be prohibitive against the potential extra cost recovered.
d. The TMA conditions will become more stringent over the coming years with specific requirements of lane rental, spoil management and programme constraints, which will consequently add additional costs to National Grid’s programme of works due to the TMA permit conditions.
From analysing all data available, EC Harris can categorically confirm from both the productivity
exercise and from the data collected which highlight the differences in length abandoned between
networks that the areas where the TMA permit schemes have been introduced carry a cost
premium for undertaking works.
It can be clearly seen from our review, there is not a single standard project which can be used
as a basis for assessing all projects. Thus there cannot be a project by project review utilising
individual costs as this would not provide any meaningful information or results.
The differences in the application and requirements between HAs who have implemented permit
schemes has shown that it has not been possible for either National Grid or their delivery
partners to implement a single streamlined process to be utilised across all authorities and
networks. In addition this has resulted in each delivery partner having to develop and retain
specific knowledge for the nuances of each HA within their region, which compounds the
requirements for additional up front resources to plan, organise and administer the work stack.
Further, this has demonstrated that each new HA implements a permit scheme, National Grid
and their delivery partners will continue to go through a learning and development process, rather
than utilising a single streamlined process, thus further complexity will be added to the planning
process.
EC Harris concludes that on a balance of probabilities the TMA permit scheme requirement has
affected National Grid’s cost base. The cost analysis from Section 7 as presented in Figure
25depicts the total cost requested for productivity issues.
Therefore EC Harris find that the additional cost incurred by National Grid as a result of
the TMA permit system is £5,079,270, which equates to £37.87 per linear metre abandoned,
which is £19.87 above Ofgem’s award from National Grid’s IAE in June 2011, based on
2009 prices.

Claim for Income Adjusting Event associated with the impacts Traffic Management Act
echarris.com 35
Copyright © 2013 EC Harris. All rights reserved
9 Mitigating the Impact of Permits
National Grid has undertaken a number of initiatives to mitigate and reduce the impact of the
enactment of the TMA, including:
• National Code of Conduct – National Grid is fully supportive and a founder member of the Codes of Conduct developed in London and now being rolled out nationally to enable safer, efficient and effective working to meet the aspirations of the legislative framework in place by reducing congestion by working to minimal standards set within the code.
• NJUG Awards – National Grid is a full member of NJUG and is committed to reducing its impact on congestion and this can quite clearly seen nominations in the prestigious NJUG awards in which we were finalists in 4 of the 6 categories and winning 3 categories in collaboration with HAs particularly in London where permits operate.
• Permit Forum – National Grid was a founder member of the National Permit Forum run via HAUC (Highways and Utilities Committee) convened to identify and reduce the impacts and anomalies introduced via permit schemes sand their interpretation, National Grid have worked with the HAs in producing advice notes to drive understanding and consistency for permit schemes, best practice in circumventing the legislative administration burden on both the Highway and Utility sides especially concerning the imposition of conditions especially as stipulated under Section 10 of the regulations. Key Performance measures are currently being designed to assist the management and effectiveness of permit schemes for all works promoters and enhance and share best practice. The learning from all these issues is now being shared to other up and coming schemes within the UK footprint.
• Permit Working Group – National Grid is involved with both a selected number of HAs, Utilities and the DfT in generating a generic template for the implementation of future permit schemes and cost benefit analysis framework in preparation for the deregulation of permit schemes in 2015 again to reduce the burden of more individual schemes.
• Innovation – National Grid has and is still developing innovative techniques to drive improved performance to reduce the impact of permit schemes and all types of legislation and this includes undertaking 75% pipe replacement by minimal dig techniques, development of algorithms to identify when the best time to work on a street, core and vac being rolled out as a quick and effective way of working and flexing our workforce to be available longer hours throughout the day by implementing shift working to accommodate a 14 hour ‘working’ day and riving communication to raise our performance in collaborative works

Claim for Income Adjusting Event associated with the impacts Traffic Management Act
echarris.com 36
Copyright © 2013 EC Harris. All rights reserved
Appendices
Appendix A
Morrison Utility Services Project Analysis
Coalition
MUS have completed four projects within EoE under the TMA Permit Scheme from the 1st October 2012 to date. Details of which are set out in the table below.
Project No
Name Target Actuals
(to date)
EMC12038 Carlton Road, Barnsley ______ ______
EAC12114 Bedford Road, Kempston ______ ______
130000216 Inkerman Terrace, St Albans ______ ______
130000259 Dunastable Road, Luton ______ ______
MUS have a further 6nr projects that are currently live or will commence prior to the 31st March 2013.
The target setting process is based on the use of an agreed schedule of rates. Some target costs for the current year included for a small element of TMA working conditions based on previous experiences with TMA projects. The inclusion of TMA is normally undertaken by the person responsible for surveying the route of the works to be undertaken.

Claim for Income Adjusting Event associated with the impacts Traffic Management Act
echarris.com 37
Copyright © 2013 EC Harris. All rights reserved
Appendix B
AMEC Alliance (EM)
AMEC have completed six projects under the TMA Permit Scheme from the 1st October 2012 to date. Details of which are set out in the table below.
Project No.
Name Target Actuals
(to date)
EM4291 Warminster Road ______ Not received
EM4294 East Bank Road ______ Not received
EM4297 Park Grange Road ______ Not received
EM4298 Eastern Avenue ______ Not received
EM4344 Wilton Gardens ______ Not received
EM4352 Alhambra Roundabout ______ Not received
AMEC have a further 13nr projects that are currently live or will commence prior to the 31st March 2013.
Some of the target costs for AMEC for the current year also included for a small element of TMA working conditions based on previous experiences with TMA projects.
Having spoken to Mike Perry (Finance Manager) of AMEC, during the introductory period of TMA, costs did increase, albeit they still didn’t reach the 1% trigger level within the Alliance. As AMEC grew more used to the systems and procedures they have to follow under TMA, the initial increase in cost has been decreasing since.

Claim for Income Adjusting Event associated with the impacts Traffic Management Act
echarris.com 38
Copyright © 2013 EC Harris. All rights reserved
Appendix C
Data Capture Sheets are available directly from National Grid. Attached is an example of a project

echarris.com
Copyright © 2013 EC Harris. All rights reservedEC Harris. All rights reserved
Claim for Income Adjust
Claim for Income Adjusting Event associated with the impacts Traffic Management Acting Event associated with the impacts Traffic Management Act
39