Embed Size (px)
Citation preview

Claiming Common Ground
State Policymaking for Improving College Readiness and Success
By Patrick M. Callan
Joni E. FinneyMichael W. Kirst
Michael D. UsdanAndrea Venezia
March 2006
The Institute for Educational LeadershipThe National Center for Public Policy and Higher Education
The Stanford Institute for Higher Education Research
National Center Report #06-1
©2006 by The National Center for Public Policy and Higher Education. Material may be duplicated with full attribution.
iii
Contents
Foreword . . . . . . . . . . . . . . . . . . . . . . . . . . . . . . . . . . . . . . . . . . . . . . . . . . . . . .iv
Introduction . . . . . . . . . . . . . . . . . . . . . . . . . . . . . . . . . . . . . . . . . . . . . . . . . . .1Context and Findings . . . . . . . . . . . . . . . . . . . . . . . . . . . . . . . . . . . . . . . . . . .3
Leaks in the Pipeline . . . . . . . . . . . . . . . . . . . . . . . . . . . . . . . . . . . . . . . .4Standards for College Readiness Are Confusing . . . . . . . . . . . . . . .5Few Reforms Address College Readiness . . . . . . . . . . . . . . . . . . . . .6
Recommendations . . . . . . . . . . . . . . . . . . . . . . . . . . . . . . . . . . . . . . . . . . . . .7Alignment of Coursework and Assessments . . . . . . . . . . . . . . . . . .7State Finance . . . . . . . . . . . . . . . . . . . . . . . . . . . . . . . . . . . . . . . . . . . . . .11 Statewide Data Systems . . . . . . . . . . . . . . . . . . . . . . . . . . . . . . . . . . . .15Accountability . . . . . . . . . . . . . . . . . . . . . . . . . . . . . . . . . . . . . . . . . . . .18The Challenges Ahead . . . . . . . . . . . . . . . . . . . . . . . . . . . . . . . . . . . . .20
Conclusion . . . . . . . . . . . . . . . . . . . . . . . . . . . . . . . . . . . . . . . . . . . . . . . . . . . .21
Appendix: A Sample Unified Performance-Based Budget for Preschool to Grade 20 . . . . . . . . . . . . . . . . . . . . . . . . . . . . . . . . . . . . . .23
Endnotes . . . . . . . . . . . . . . . . . . . . . . . . . . . . . . . . . . . . . . . . . . . . . . . . . . . . . .26About the Authors . . . . . . . . . . . . . . . . . . . . . . . . . . . . . . . . . . . . . . . . . . . . .29About the Institute for Educational Leadership . . . . . . . . . . . . . . . . . . . .31About the Stanford Institute for Higher Education Research . . . . . . . .31About the National Center for Public Policy and Higher Education . .32
Claiming Common Ground
Foreword
There is widespread agreement among policymakers, the business community, and educational leaders that the United States needs to raise the educational achievement of its young population. Many states have sought to meet this challenge by developing policies to advance and support student achievement in K–12 schools, including standards-based reforms, state assessments, and high school redesigns. Some states have also sought to expand access to postsecondary education in order to increase the numbers of students completing education or training beyond high school. Yet the reforms of K–12 schools have not improved the college readiness of high school graduates, as measured by the percentage of college students who take remedial education, or by college completion rates. Likewise, state policies to expand access to higher education, which have been limited by setbacks in the affordability of college, have not led to higher percentages of the young population obtaining a college degree. Reforming K–12 schools and broadening access to college are
iv
State Policy Dimensions for K–16 Reform
Wingspread Conference Center September 12–13, 2005
Participants
Linda Beene Director Arkansas Department of Higher
Education
Julie Davis Bell Program Director, Education
Program National Conference of State
Legislatures
Patrick M. Callan President National Center for Public Policy
and Higher Education
Sally Clausen President University of Louisiana System
Michael Cohen President Achieve, Inc.
Richard Lee Colvin Director Hechinger Institute on Education
and the Media
Ronald Cowell President Education Policy and Leadership
Center
Ann Daley Executive Director Washington Learns
Virginia Edwards Editor and Publisher Education Week
Peter T. Ewell Vice President National Center for Higher
Education Management Systems
Joni E. Finney Vice President National Center for Public Policy
and Higher Education
Marlene Garcia Principal Consultant Senate Office of Research California Legislature
Boyd H. Gibbons IIIPresident The Johnson Foundation
Susan Heegaard Director Minnesota Office of Higher
Education
Carole Johnson Program Officer for Education The Johnson Foundation
Christine Johnson President Community College of Denver
Claiming Common Ground
necessary but not sufficient conditions for advancing educational opportunity.
In earlier times, when only a small proportion of high school students attended college, it made sense for states to develop and maintain educational policies and governance structures that divided K–12 and postsecondary education into separate entities. Today, however, when the vast majority of high school students aspire to attend college, states need policies that require K–12 and postsecondary education to collaborate to improve the college readiness of all high school students. This report identifies four state policy dimensions for improving college readiness and success: the alignment of coursework and assessments; state finance; statewide data systems; and accountability.
The recommendations in this report build from previous collaborative work among the National Center for Public Policy and Higher Education, the Institute for Educational Leadership, and the Stanford Institute for Higher Education Research.1 The research began in 2003 with Partnerships for Student Success, a project funded by the Ewing Marion Kauffman Foundation. For Partnerships for Student Success, researchers analyzed state-level policies, programs, and governance structures that connect K–12 and postsecondary education in Florida, Georgia, New York, and Oregon. The National Center
v
Participants, con’t.Stanley Jones Commissioner Indiana Commission for Higher
Education
Jan Kettlewell Associate Vice Chancellor for P–16
Initiatives Board of Regents of the University
System of Georgia
Michael W. KirstProfessor of Education Stanford University
Dewayne Matthews Senior Research Director Lumina Foundation for Education
Peter McWalters Commissioner Department of Elementary and
Secondary Education State of Rhode Island
Jennifer Muskovin Wingspread Fellow Student Benedictine University
Margo Quiriconi Director of Research and Policy,
Education Ewing Marion Kauffman Foundation
Rogéair Purnell Program Officer, Youth The James Irvine Foundation
Piedad Robertson President Education Commission of the
States
Drew Scheberle Vice President for Education and
Workforce Development Greater Austin Chamber of
Commerce
Janis Somerville Senior Associate National Association of System
Heads
David Spence President Southern Regional Education Board
Michael D. Usdan Senior Fellow Institute for Educational Leadership
Joel Vargas Senior Project Manager Jobs for the Future
Andrea Venezia Senior Policy Analyst National Center for Public Policy
and Higher Education
Duncan Wyse President Oregon Business Council
Claiming Common Ground
published the final report of that project, The Governance Divide: A Report on a Four-State Study on Improving College Readiness and Success, in September 2005.
In completing the governance study, we learned a great deal about the range of policy options available to states to connect K–12 and postsecondary education, and we learned that changes in governance structures alone cannot significantly improve the percentage of students who prepare for, enroll in, and succeed in postsecondary education or training. After we completed that project, we broadened our understanding of these issues by examining information about related policy changes in other states. As part of this process, we convened policy and education leaders from across the United States to participate in “State Policy Dimensions for K–16 Reform,” a two-day conference held in September 2005 at The Johnson Foundation’s Wingspread Conference Center in Racine, Wisconsin (see list of participants). The suggestions of this group helped us clarify our thoughts and expand our understanding of state policy directions. The quotations in the margins of this report represent only a fraction of the insights we gained at the conference.
We are grateful to Achieve, Inc., The James B. Hunt, Jr. Institute for Educational Leadership and Policy, and The Johnson Foundation for partnering with us at Wingspread, and to the Ewing Marion Kauffman Foundation for its financial support of the meeting and the research. In addition, we would like to thank Boyd H. Gibbons III, President of The Johnson Foundation, and his staff, particularly Carole M. Johnson, Program Officer for Education, Theresa Oland, Director of Communications, and Wendy S. Butler, Program Assistant.
As always, responsibility for errors and misinterpretations remains with the authors. We welcome the responses of readers.
Patrick M. CallanJoni E. Finney
Michael W. KirstMichael D. Usdan
Andrea Venezia
vi
Claiming Common Ground
1
“The kids who are driving the kind of global competitiveness of China and India are getting so much more than even the most advanced kids in this country.”
—Richard Colvin
Introduction
Major demographic shifts in the population of the United States, combined with persistent gaps in educational achievement by ethnic group, could decrease the portion of the workforce with college-level skills over the next 15 years, with a consequent decline in per capita personal income in the United States.2 Meanwhile, the competitive edge of the U.S. workforce is slipping; several other developed countries now surpass the United States in the percentage of their young working-age population enrolling in college and attaining a bachelor’s degree.3 At a time when the knowledge-based, global economy requires more Americans with education and training beyond high school, the nation confronts the prospect of a sustained drop in the average educational levels of the U.S. workforce.4 This challenge places the United States at a crossroads: we can improve college readiness and completion rates and thereby prepare the workforce for the economic and civic challenges of the next generation, or we can allow gaps in educational achievement to undermine our competitive edge and our communities’ economic prosperity.
Leaders from throughout the country—in public and private schools, charter schools, foundations, educational and policy organizations, businesses, states, and the federal government—have taken up this challenge. For example, reforming high schools has become a major focus in an overall drive to raise student achievement. Many of these efforts to improve our secondary schools have targeted student readiness for both college and work as a single key objective: the skills and knowledge required for middle-income jobs closely mirror those required for college success. As research has documented, reforms that focus either on K–12 schools or on colleges and universities are likely to perpetuate some of the key barriers to improving educational achievement for students.5 Yet the focus of most state educational reforms has been limited to K–12 school systems. Some of the most robust challenges in raising student achievement can be found at the juncture—or more accurately the disjuncture—between our K–12 systems and our colleges and universities.
In the United States, secondary and postsecondary education have developed divergent histories, governance structures, policies, and institutional boundaries. As a result, there are few widespread practices or traditions for these two systems of education to communicate with each other, much less

Claiming Common Ground
to collaborate to improve student achievement across institutions. Advocacy organizations are working on behalf of K–12 schools on the one hand or colleges and universities on the other, but there are no lobbying groups in state capitals seeking to improve college readiness by bridging the divide between K–12 and higher education. There are few accountability systems that track college readiness from secondary to postsecondary education. And no one is held responsible for the students who drop between the cracks of the two systems.
Gaining admission to college is not the most daunting challenge facing high school graduates—although many students think that it is and most college preparation efforts focus on admissions. The more difficult challenge for students is becoming prepared academically for college coursework. Once students enter college, about half of them learn that they are not prepared for college-level courses. Forty percent of students at four-year institutions and 63% at two-year colleges take remedial education.6 According to Measuring Up 2004, the state-by-state report card on higher education, the timely completion of certificates and degrees remains one of the weakest aspects of performance in higher education.7
This report identifies four state policy dimensions for improving college-readiness opportunities for all high school students:
• Alignment of coursework and assessments: States should require K–12 and postsecondary education to align their courses and assessments. Currently, the K–12 standards movement and efforts to improve access and success in higher education are not connected.
• State finance: States should develop financial incentives and support to stimulate K–12 and postsecondary education to collaborate to improve college readiness and success. Most existing state finance systems perpetuate the divide between K–12 and postsecondary education.
• Statewide data systems: States should develop the capacity to track students across educational institutions statewide. Currently, most states do not collect adequate data to address the effectiveness of K–12 reforms in improving student readiness for college.
• Accountability: States should publicly report on student progress and success from high school through postsecondary education. Schools, colleges, and universities should be held accountable for improving student performance from high school to college completion.
Through these policy levers, states can create the conditions for claiming common ground between our systems of K–12 and postsecondary education.
2
“I think that the structure in K–12 and higher ed … are doing exactly
what they were designed to
do… The system … was set up to get about 30% of the kids ready; to actually get that other 70% ready is totally beyond
the current capacity.”
—Peter McWalters

Claiming Common Ground
Context and Findings
Many forces are converging to create a pressing need for state policies to improve college readiness and success. For example, the fastest growing job sectors in our economy require workers to have at least some education or training beyond high school.8 Yet completion rates for associate’s and bachelor’s degree programs have stalled over the past decade, and wide gaps remain in college completion by ethnic and income group.9 Whereas the United States was once the world leader in offering college opportunity to its residents, several countries have now overtaken the U.S. in this area. The educational attainment of the young workforce in the United States (ages 24 to 34) currently ranks fifth among industrialized nations.10
Unless the educational achievement of the young population improves, the competitiveness of the U.S. workforce is projected to decline over the next decades. Economists Anthony Carnevale and Donna Desrochers have estimated that by 2020 the United States could face a shortfall of 14 million workers who have the knowledge and skills needed to compete for middle-income jobs in a global economy.11 In addition, recent population studies have found that unless states can improve the education of all students, the percentage of the U.S. workforce with a bachelor’s degree will decrease over the next 15 years, with a corresponding drop in personal income per capita. Minority groups with the lowest average levels of education will grow rapidly, while the baby boomers—the most highly educated generation in U.S. history, are expected to retire in record numbers. From 1980 to 2020, the minority portion of the workforce is projected to double from 18% to 37%, and the Hispanic/Latino portion will almost triple, from 6% to 17%. During the same period, the white working-age population is projected to decline from 82% to 63%.12
Educators and policymakers have known since the 1980s that this country would need a more highly educated workforce. For the past several decades, they have broadcast a consistent message urging high school students to attend college—and students have responded. Today’s high school students have higher academic aspirations than ever before; almost 90% of high school students of all racial and ethnic groups aspire to attend college. Almost 60% of high school graduates enroll in college right after high school,13 and many additional students enroll in college within a few years of high school graduation. But educators and policymakers have not fulfilled their side of the bargain; they have
3
Claiming Common Ground
not developed coherent state systems of education that adequately prepare high school students for the academic expectations of college. High school students who seek to enroll in college must navigate a maze of disconnected curricula and assessments that are reinforced by state policies that are themselves unconnected and often at cross purposes with each other.14 These fractured and fragmented systems waste taxpayer money on duplicated and inefficient uses of resources, they create barriers for high school students who seek to prepare for college, and they undermine efforts to improve college completion rates. The K–12 and postsecondary education systems in the United States should be working together to improve college readiness and success, yet our nation’s educational systems remain sharply divided.
Leaks in the Pipeline
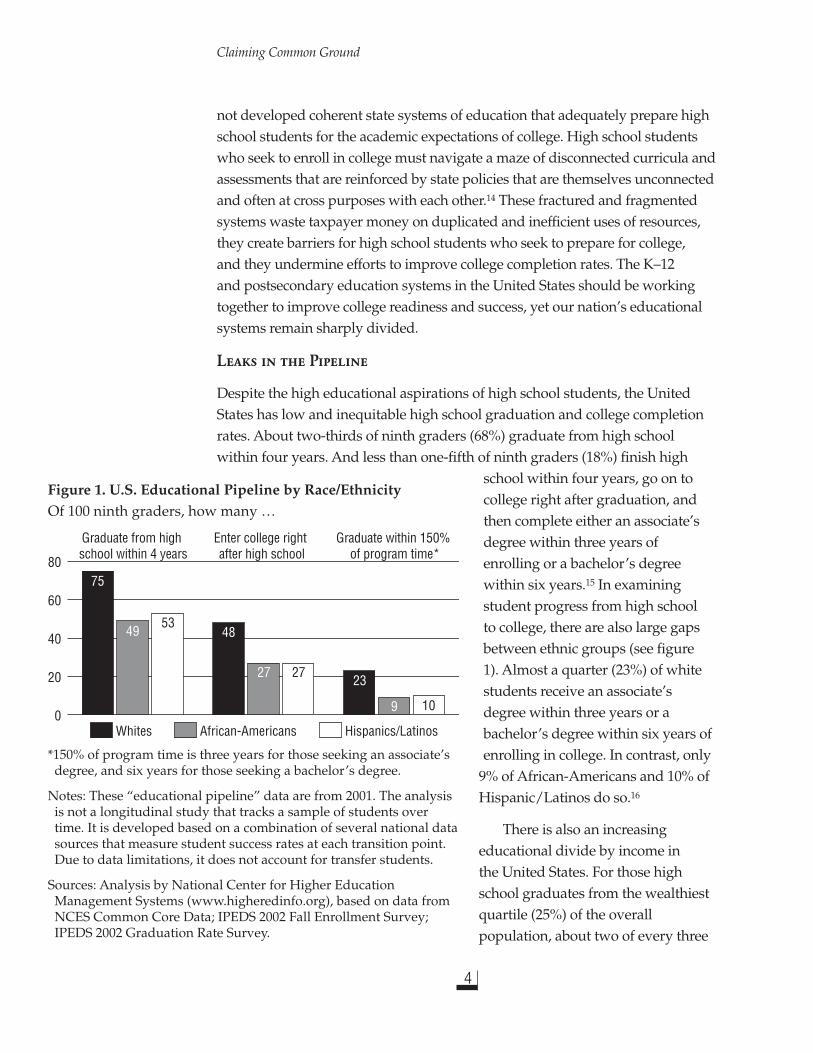
Despite the high educational aspirations of high school students, the United States has low and inequitable high school graduation and college completion rates. About two-thirds of ninth graders (68%) graduate from high school within four years. And less than one-fifth of ninth graders (18%) finish high
school within four years, go on to college right after graduation, and then complete either an associate’s degree within three years of enrolling or a bachelor’s degree within six years.15 In examining student progress from high school to college, there are also large gaps between ethnic groups (see figure 1). Almost a quarter (23%) of white students receive an associate’s degree within three years or a bachelor’s degree within six years of enrolling in college. In contrast, only
9% of African-Americans and 10% of Hispanic/Latinos do so.16
There is also an increasing educational divide by income in the United States. For those high school graduates from the wealthiest quartile (25%) of the overall population, about two of every three
4
0
20
40
60
80
Hispanics/LatinosAfrican-AmericansWhites
Graduate within 150% of program time*
Enter college right after high school
Graduate from high school within 4 years
75
4953
48
27 27 23
9 10
*150% of program time is three years for those seeking an associate’s degree, and six years for those seeking a bachelor’s degree.
Notes: These “educational pipeline” data are from 2001. The analysis is not a longitudinal study that tracks a sample of students over time. It is developed based on a combination of several national data sources that measure student success rates at each transition point. Due to data limitations, it does not account for transfer students.
Sources: Analysis by National Center for Higher Education Management Systems (www.higheredinfo.org), based on data from NCES Common Core Data; IPEDS 2002 Fall Enrollment Survey; IPEDS 2002 Graduation Rate Survey.
Figure 1. U.S. Educational Pipeline by Race/EthnicityOf 100 ninth graders, how many …
Claiming Common Ground
enroll in a four-year college or university. In contrast, only about one in five from the lowest socioeconomic quartile enrolls in a four-year institution. At the nation’s most selective colleges and universities, about three-quarters of the student body are from the top socioeconomic quartile and only three percent are from the poorest quartile.17
Standards for College Readiness Are Confusing
From the students’ perspective, the divide between high school and college is very real, even for those who plan to attend a community college. Community colleges, which enroll about 44% of undergraduate students,18 have multiple missions and most admit any student over age 18 who applies and who can benefit from instruction. Since these and other broad-access institutions do not have stringent admission requirements, many high school students assume that they do not need rigorous academic preparation. They do not understand that, as with four-year colleges and universities, community colleges have academic standards for taking college-level courses and completing a certificate or degree program.19 After students enroll in college, they learn that they must take placement exams to determine if they qualify for college-level work or if they must take remedial courses first. About half the college students in the United States are required to enroll in remedial education.20 This percentage could be reduced dramatically if high schools and colleges were to connect their standards, assessments, policies, and coursework.
The disjunctures between high schools and postsecondary education manifest themselves in many ways. For example, high school assessments often emphasize different knowledge and skills than do college entrance and placement requirements. College placement tests for math often include Algebra II, while the assessments required for admission rarely exceed Algebra I.21 In addition, much of the coursework in high school does not build toward college readiness. For example, a recent ACT study found that high school teachers consider grammar and usage skills to be the least important writing skills, and only 69% of high school teachers reported that they teach grammar and usage.22 In contrast, the study also found that college instructors consider these skills to be the most important writing skills for incoming students. Given the need to improve student achievement in high school and college, it would make sense for college and university systems to communicate extensively with high schools about what students need to know and be able to do to succeed in college. But the vast majority of high school teachers receive no information from colleges about their admissions and placement standards and policies.23
5
“It was naïve thinking that if you got the right players around the table, you’d get the right things done. An informed agenda would help.”
—Stanley Jones
Claiming Common Ground
Few Reforms Address College Readiness
Traditionally, states have viewed high schools as performing two primary tasks: preparing some students for postsecondary education and preparing most students for work. Although that division may have been appropriate decades ago, it is no longer relevant today, primarily because of the increasing technological and educational demands of the contemporary workplace. The knowledge and skills that students need to succeed in postsecondary education are equivalent to the ones they need in the workforce. As a result, some high schools are aiming for a new primary goal: to create an educational environment that provides all students with the knowledge and skills they need to succeed in education and training beyond high school.
Improving student readiness for college does not mean that every student will want or need to complete four years of a traditional liberal arts education. Some will become employed or join the military directly after high school, and many will qualify, based on their skills, for training on the job. Many high school graduates will enroll in and complete certificate or other training programs. And many will finish several years of postsecondary education, completing an associate’s or bachelor’s degree. No matter which career paths students choose, the completion of a high school diploma should prepare them for existing opportunities for education and training beyond high school. The diploma should also provide their prospective employers and college admissions officers with the assurance that students have attained college-ready knowledge and skills. This can only occur if public policies for K–12 and postsecondary education converge upon a common set of goals.
Since the 1980s, states have concentrated substantial resources on the reform of K–12 schools. Many of these reforms have focused on the development of statewide standards and the assessment of student achievement based on those standards. Yet most standards-setting activities—such as high school exit exams—end at the 10th grade level, which does not represent adequate preparation for college. For example, states that have a high school graduation assessment based on minimum standards may be undermining their college-readiness efforts by sending mixed signals to students about what it takes to graduate from high school and succeed in college.
Recently, several national reforms focusing on college readiness have been underway, including the American Diploma Project and initiatives springing from the policy discussions at the 2005 National Education Summit sponsored by the National Governors Association and Achieve. A consensus is emerging around a central goal: to prepare all high school graduates to engage successfully in college-level academic work.
6
“If we went back 20 to 25 years,
I would hope that we would
have started this whole
K–12 reform differently. We
would have led with higher
education.”
—David Spence
“It is possible to change the
rewards system. Presidents know what to do if you
give them the right incentives.
They are the CEOs, and they’re smart and they’re
capable… We can reform higher
education.”
—Sally Clausen

Claiming Common Ground
7
Recommendations
The federal government, local school districts, and colleges and universities have important roles to serve in developing educational policy and practice. College-readiness reform, however, is primarily a state-level policy responsibility. As the entities that perform the major funding and policy-setting functions for public K–12 and higher education, states are in a unique position to create and adopt policies that require the systems of education to collaborate to improve college readiness and success. Currently, most collaborations between schools and colleges can be described as voluntary, localized efforts that are dependent upon ad hoc leadership commitments. States that are seeking to improve college readiness and success must move their educational systems beyond localized collaborations by taking action in four key areas of statewide policy: alignment of coursework and assessments, state finance, statewide data systems, and accountability. If states are not using their policy levers in at least these four areas to align K–12 and postsecondary education, they cannot expect significant improvements in college readiness and success.
Alignment of Coursework and Assessments
States should require K–12 and postsecondary education to align their
coursework and assessments.
Requiring K–12 and postsecondary education to work together to align their coursework and assessments is a key step to improving college readiness.
Currently, the K–12 standards movement and efforts to improve access and success in higher education are operating on different tracks. For example, a widespread K–12 reform strategy has been to increase enrollments in college preparatory courses. Yet despite some successes in this area, remediation rates in college remain high and college completion rates remain low. As a nation, we are learning that the number of courses that high school students take, and the units and names assigned to them, are often inadequate proxies for whether or not high school graduates are prepared to succeed in college-level work. The quality and level of the coursework and instruction, and their level of alignment with postsecondary expectations, are the key elements of reform. Making improvements in these areas requires that colleges and universities participate in the new wave of high school reforms, so that new standards and curricula in high
“What would interventions look like that would connect these policies better?”
—Joel Vargas
“The levers are the heart of where policy action has to be in order to have better transitions from secondary to postsecondary.”
—Michael Cohen
Claiming Common Ground
8
school are linked to what students need to know and be able to do in college.
High school assessments provide another example of the multiple ways students receive mixed messages about the skills they need to develop for college. High school graduation tests in most states are benchmarked at the 8th, 9th, or 10th grade levels. There are few standards developed for the 11th or 12th grades or connected to the academic expectations of college. Recently, the Boston Globe reported that in Massachusetts “37% of incoming freshmen from public high schools had to take a remedial course in reading, writing, or math last year, down only two percentage points from 2002, the year before the MCAS English and math tests [the statewide 10th grade assessments] became a graduation requirement.”24
High school students should receive diagnostic information through assessments at key intervals in high school—well before entering college—concerning their preparation for college-level academic work, so that they can change their course-taking patterns and improve their college readiness. In order for this to take place, states must require K–12 and postsecondary education to align their assessments—for example, by aligning high school assessments with college placement tests. By taking courses and assessments that build toward college-level academic work, high school students can become better informed about and better prepared for the requirements of college.
The Early Assessment Program at California State University
As an example of promising collaborative work between K–12 and postsecondary systems, California State University (CSU) has partnered with the State Board of Education and the California Department of Education to develop the Early Assessment Program. The program was established by CSU to provide high school juniors with opportunities to measure their readiness for college-level math and English, and to help them improve their knowledge and skills during their senior year. The program’s goal is to ensure that high school graduates who attend CSU are prepared to enroll and succeed in college-level courses.
The impetus for the program was the high remediation rate within CSU. To be admitted to CSU, all high school students must complete a college preparatory curriculum and earn a grade point average of B or higher. Yet even with these requirements, about half of first-time freshmen at CSU must take remedial education in English, math, or both.25 Based on this and other information, it became clear to CSU that the college preparatory curriculum and grade-point-average requirements were not effective in developing college readiness.
“We now know that taking the
courses with the right names is necessary, but not sufficient.”
—David Spence
“The discussion about aligning
expectations is not merely
design-tinkering. Aligning the
expectations for more high school
students to go on to college
demands more rigor of the
system.
—Michael Cohen

Claiming Common Ground
The Early Assessment Program includes three components: an 11th grade testing program, preparation opportunities for high school students, and professional development for high school teachers. The 11th grade assessment is part of the state’s testing and accountability system, is criterion-referenced, and includes items associated with 12th grade standards.26 School teachers worked with university faculty to augment the California Standards Tests (which are end-of-course exams all students must take) with math and English items that measure college-readiness knowledge and skills. In math, the items assess student knowledge of advanced algebra and geometry. Similarly, the English proficiency standards are aligned with the state standards in English-language arts, yet require additional demonstration of advanced reading and writing skills. For example, there is a 45-minute essay requirement.
High school students volunteer in the spring of their junior year to take the augmented sections of the California Standards Tests. The scoring of college readiness involves a combination of performance on selected items from the core tests and on the augmented items. High schools and students receive scores by early August, prior to the students’ senior year. Students who meet the readiness standards are exempt from additional placement testing after they are admitted to CSU. Students who do not meet the standards are guided to further instructional and diagnostic assistance in the 12th grade. For example, the diagnostic assistance includes courses and online tutorials; students can access the CSU Diagnostic Writing service online and use materials from the Mathematics Diagnostic Testing Project.27 In addition, K–12 and postsecondary educators have developed a 12th grade expository reading and writing course that high schools may pilot and adopt to help students advance their skills in English. The course is aligned with California’s content standards; it is geared toward preparing students for college-level English; and it focuses on analytical, expository, and argumentative reading and writing.28
9
Early Assessment Program Key Principles
There is a shared view of college-readiness standards across higher education.
There is a substantial core of K–12 standards and assessments that can be aligned with collegiate readiness standards.
Postsecondary education should lead in connecting its readiness standards to K–12 standards.
K–12 standards and postsecondary education readiness standards need to be aligned.
There needs to be direct assessment of college-readiness standards.
Additional tests and testing time should be minimized.
The timing of tests should be early enough to help students improve their preparation for college.
The work should be cost-effective.
Source: David Spence, “Early Assessment Academic Preparation Initiative,” presentation at “State Policy Dimensions for K–16 Reform,” Wingspread Conference Center, September 12, 2005.
“I don’t think the high schools can go any further without higher education being clear about their college-readiness standards. It’s time for higher education to really step up to the plate and be absolutely clear what it means, across a whole state, to be college-ready.
—David Spence
Claiming Common Ground
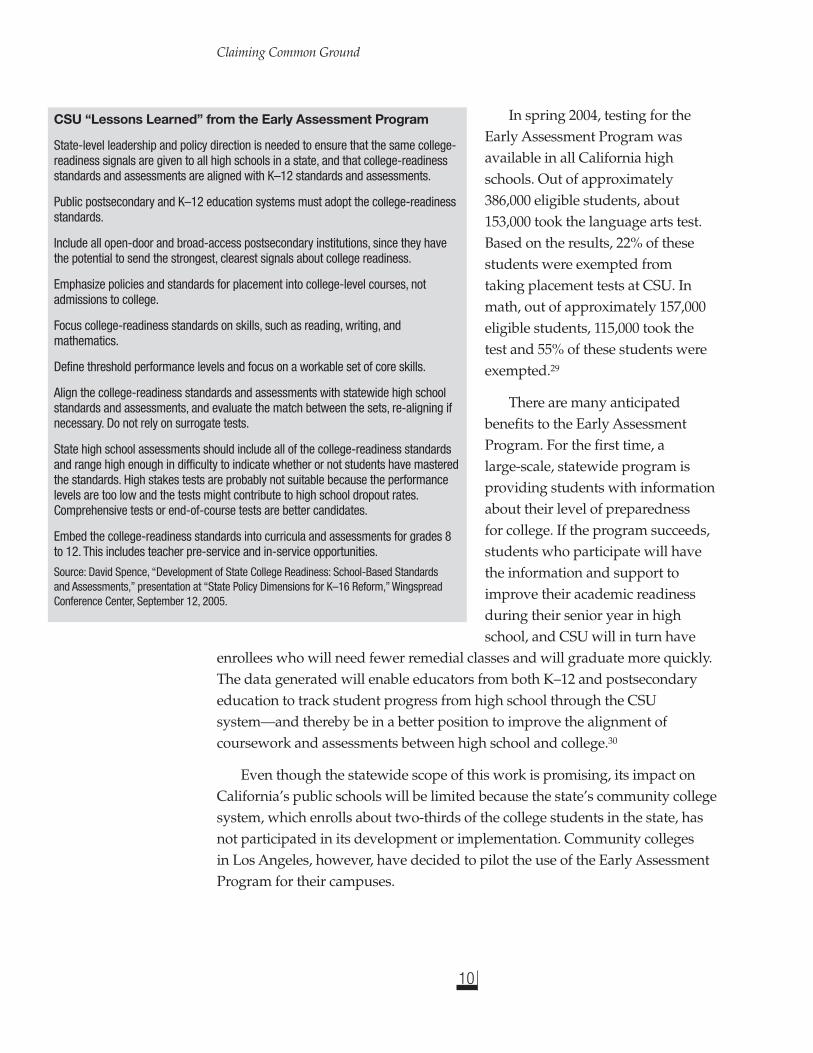
In spring 2004, testing for the Early Assessment Program was available in all California high schools. Out of approximately 386,000 eligible students, about 153,000 took the language arts test. Based on the results, 22% of these students were exempted from taking placement tests at CSU. In math, out of approximately 157,000 eligible students, 115,000 took the test and 55% of these students were exempted.29
There are many anticipated benefits to the Early Assessment Program. For the first time, a large-scale, statewide program is providing students with information about their level of preparedness for college. If the program succeeds, students who participate will have the information and support to improve their academic readiness during their senior year in high school, and CSU will in turn have
enrollees who will need fewer remedial classes and will graduate more quickly. The data generated will enable educators from both K–12 and postsecondary education to track student progress from high school through the CSU system—and thereby be in a better position to improve the alignment of coursework and assessments between high school and college.30
Even though the statewide scope of this work is promising, its impact on California’s public schools will be limited because the state’s community college system, which enrolls about two-thirds of the college students in the state, has not participated in its development or implementation. Community colleges in Los Angeles, however, have decided to pilot the use of the Early Assessment Program for their campuses.
10
CSU “Lessons Learned” from the Early Assessment Program
State-level leadership and policy direction is needed to ensure that the same college-readiness signals are given to all high schools in a state, and that college-readiness standards and assessments are aligned with K–12 standards and assessments.
Public postsecondary and K–12 education systems must adopt the college-readiness standards.
Include all open-door and broad-access postsecondary institutions, since they have the potential to send the strongest, clearest signals about college readiness.
Emphasize policies and standards for placement into college-level courses, not admissions to college.
Focus college-readiness standards on skills, such as reading, writing, and mathematics.
Define threshold performance levels and focus on a workable set of core skills.
Align the college-readiness standards and assessments with statewide high school standards and assessments, and evaluate the match between the sets, re-aligning if necessary. Do not rely on surrogate tests.
State high school assessments should include all of the college-readiness standards and range high enough in difficulty to indicate whether or not students have mastered the standards. High stakes tests are probably not suitable because the performance levels are too low and the tests might contribute to high school dropout rates. Comprehensive tests or end-of-course tests are better candidates.
Embed the college-readiness standards into curricula and assessments for grades 8 to 12. This includes teacher pre-service and in-service opportunities.
Source: David Spence, “Development of State College Readiness: School-Based Standards and Assessments,” presentation at “State Policy Dimensions for K–16 Reform,” Wingspread Conference Center, September 12, 2005.

Claiming Common Ground
State Finance
States should develop financial incentives and support to stimulate K–12 and
postsecondary education to collaborate to improve college readiness and success.
As well as requiring public educational systems to align their assessments and coursework, states need to create budget and finance incentives that can stimulate increased collaboration between K–12 and postsecondary education to improve student achievement across the systems. Creating such incentives will require state legislative committees that oversee the budget processes for K–12 and higher education to work more closely together to find common goals in advancing college readiness and success. Currently, most states maintain separate legislative committee structures governing K–12 and postsecondary education. To the extent that these legislative oversight functions remain isolated from each other, they can and often do perpetuate the divide between schools and college systems.
No state has fully aligned state budget, financial aid, and other policies to provide incentives for K–12 and postsecondary education to support college readiness. However, several states have taken steps to provide such incentives in some areas, ranging from redesigning state budget processes for public education systems to, on a much smaller scale, providing incentives for dual enrollment. Two promising, ambitious examples are summarized below: Oregon is exploring the development of an integrated K–20 finance model; Indiana is using a financial aid program to increase and broaden access to college preparatory classes.
Oregon’s K–20 Finance Model
In Oregon, the state political leadership has established expectations for improvement in how K–12 and postsecondary education collaborate to advance student success. For example, the governor has set concrete goals in the areas of high school graduation, college completion, and system delivery. In addition, the Joint Boards—comprised of members from the State Board of Education and the State Board of Higher Education—has recommended the following three infrastructure redesigns:
• a unified education delivery system with curriculum aligned so that exit standards from one sector equal entrance standards to the next;
• a unified data system that can track students across the continuum and by institution; and
• a unified, transparent budget that connects all education sectors.31
11
“What’s missing are the very complicated, difficult issues of: Who gets access to money, under what conditions? How do you distribute it? Should you distribute money that currently goes to high schools to community colleges and the state system? How do we think about competition and delivery? What do we imagine the system looking like? Who delivers the services under what conditions?”
—Duncan Wyse
Claiming Common Ground
The Oregon Business Council has taken the lead in developing an integrated statewide budget and finance model that would span from preschool to graduate school. According to Duncan Wyse, president of the Oregon Business Council, the state’s public education system, as in most states, “is composed of distinct sectors, budgeted and governed separately. There are no consistent [high school] exit and [postsecondary] entrance standards for students. Student movement through the system is organized by time rather than by achievement.”32
In developing the model, the Business Council analyzed the 2002–03 expenditures by K–12 and postsecondary education as though they derived from one budget. The council found that the level of state investment per student varied by grade and degree, with community colleges receiving the least state funding and special education in K–12 schools receiving the most.33 In addition, since the 1990 passage of Oregon’s ballot measure establishing limits on property taxes, state investment in pre-K programs, middle school education, K–12 special education, and community college developmental education has increased. State investment in all other educational areas—elementary and high school education, community college lower-division education and professional training, and Oregon University System lower-division, upper-division, graduate, and professional education—decreased.34
The Business Council consequently recommended that Oregon adopt a reform plan to coordinate governance, budgeting, and management of education from preschool to graduate school. The council proposed that budgets would be based on per-student costs per service; outcomes would be established for every educational level and service; school spending would be more transparent; and aggregate student performance for every program and at every institution would be publicly reported. The governor, the Legislature, and the Joint Boards would set performance expectations and priorities for the budget, create teams to work on efficiencies and delivery improvements in high-impact areas, and set forth a two- or three-biennium plan to accomplish the work. Through the Joint Boards, the governor would lead policy discussions and assign teams to address improvements in areas such as high school redesign, high school and lower-division alignment, policies for tuition and need-based aid for public and private institutions, K–12 transportation, special education, and English as a second language.35
The Oregon Business Council has acknowledged that there are many hurdles to overcome in implementing this reform plan. For example, the state’s budget and accounting systems are not adequate to collect and report
12
“How [can] the finance
system itself be redirected to
accommodate growth at a lower
cost? That has little to do with
average costs in the system and a lot to do with marginal costs
in the system and creating
incentives for people to go after
those marginal costs.”
—Dewayne Matthews
Claiming Common Ground
13
comparable per-student costs by service across institutions, and developing this capacity would require significant legislative and public support. In addition, these transformations would take longer than any single governor’s term; sustaining reforms across administrations is difficult. Finally, since some stakeholders are likely to perceive the changes as threatening, there could be political setbacks along the way as people resist the reforms.36
According to the Business Council, if Oregon succeeds in implementing this model (for example, see appendix), the state should be able to reduce financial inefficiencies, target resources more strategically, improve student achievement across every educational level, and provide a more transparent and unified system of financing. The council has suggested that the benefits would also include more informed decisions for policy and educational leaders; transparency of tax dollar use; the creation of opportunities for broad redesign and reinvention; and increases in program effectiveness by focusing on service quality and continuous improvement.37
Indiana’s Twenty-first Century Scholars Program
State financial aid, a traditional means for broadening access to college, can also be used to leverage college-readiness reforms. Indiana’s Twenty-first Century Scholars Program is a national model in both broadening access to college and improving college readiness. Initiated in 1990, the program was the first state financial aid program to promise the future payment of college tuition for middle school students who qualify for the federal free and reduced lunch program. The Scholar’s Program targets low-income students in the eighth grade and requires each participating student to complete a pledge to finish high school, maintain at least a C grade point average, remain drug- and alcohol-free, apply for college and financial aid, and enroll in an Indiana postsecondary institution within two years of completing high school. In return, Indiana (1) encourages the Scholars to pursue a college preparatory curriculum; (2) provides support services to them and for those who fulfill the pledge (3) pays their tuition and fees (after other financial aid awards) at a public institution in Indiana (or contributes a similar portion for tuition at an independent college).38 The program pays for 80% of the approved tuition and fees for students completing a regular high school diploma; 90% of tuition and fees for students completing a more rigorous high school diploma, called a core 40 diploma; and 100% of tuition and fees for students completing the most rigorous diploma, the academic honors diploma. Through these incentives, the program sends clear signals to students regarding academic preparation for college.39
Claiming Common Ground
Since the Scholars Program targets low-income students, the majority of students who receive the awards already qualify for some level of state financial aid. As a result, the program’s award amounts are relatively modest.40 In contrast, the Georgia HOPE Scholarship provides financial aid to students who earn a B or better in the college preparatory track, regardless of financial need. As with Indiana’s Scholars Program, the HOPE Scholarship provides clear signals to students about the importance of college readiness. Because HOPE is not tied to financial need, however, it is expensive for the state and has been criticized for its failure to target low-income students.
The Scholars Program is increasing enrollment in rigorous preparatory curricula in high school and enrollment in colleges and universities. The percentage of traditionally underserved students taking college preparatory curricula in high school has increased, as has the percentage of all students taking such courses. In 1993–94, 12% of Indiana’s high school graduates earned an academic honors diploma, 87% earned a regular diploma, and 1% were in the “other” category. In 2003–04, 29% earned an academic honors diploma, 36% earned a core 40 diploma, and 35% earned a regular diploma. Although gaps in educational attainment by race and ethnicity persist, they are narrowing, and the performance of each racial and ethnic group is improving. For example, in 1998, 23% of African-American, 29% of Hispanic, 45% of white, and 36% of multi-racial high school graduates earned a core 40 diploma. In 2004, those percentages increased to 47%, 51%, 67%, and 66%, respectively.41
In addition, the percentage of students enrolling in postsecondary education has risen. From 1994 to 2002, the percentage of Indiana’s high school graduates who enrolled in college right after high school increased from 50% to 62%, raising the state’s rank on this measure from 34th to 10th in the nation. In terms of raw numbers, in 1988 Indiana had 69,004 high school graduates and 30,905 college freshmen. In 2002, it had 60,943 high school graduates and 38,023 college freshmen.42
A report from the Lumina Foundation found that the Scholars Program is encouraging more low-income students to enroll in postsecondary education. The report also found that the program is improving persistence and completion rates for students earning two-year college degrees. The Lumina report concludes that “state policy can affect the curricula that students actually complete, which, in turn, can influence their college success.”43
As states seek to develop their own budget or financial incentives to improve college readiness and success, they need to be mindful of unintended effects of
14
Claiming Common Ground
such efforts. For example, many state legislators, concerned about the high costs of college, may be interested in creating incentives to improve certificate- or degree-completion rates at state colleges or universities. Some states, for example, have provided postsecondary institutions with additional funds for each student who graduates. Such incentives do not always succeed, however, because many institutions can improve their graduation rates by raising their admission requirements in ways that have the effect of reducing access to college statewide. States might consider developing programs similar to Indiana’s Scholars Program, which addresses financial need and college readiness, thereby broadening access to college while also improving students’ abilities to perform at higher levels.
Statewide Data Systems
States should develop the capacity to track students across educational
institutions statewide.
A third important element in college-readiness reform is the development of statewide databases that can track student progress across educational institutions. A robust statewide data system is needed to determine the effectiveness of programs and reforms in improving student achievement.
Currently, the data derived from state information systems are generally more useful for supporting budget allocations to institutions than for examining student progress across multiple institutions. At the K–12 level, most state databases cannot track students who leave one school district and enroll in another. Many cannot accurately determine the percentage of students graduating from high school each year. State databases are even more deficient in examining student transitions from high school to college; most states have data systems that stop at grade 12 and others that begin anew at grade 13, with little or no connection between them. As a consequence, these states do not have adequate information to address the effectiveness of K–12 reforms in improving student performance in college.
As states seek to align and expand their information systems across K–12 and postsecondary education, they need to better understand the relationship between student readiness in high school and student success in college. Currently, 18 states do not even collect data on the courses taken by high school students. In most states, it is not currently possible to identify and analyze completion rates for students who enter college from the workforce, for students who attend part-time, and for students who attend multiple institutions. In short, without databases that connect educational institutions, it is difficult—if
15
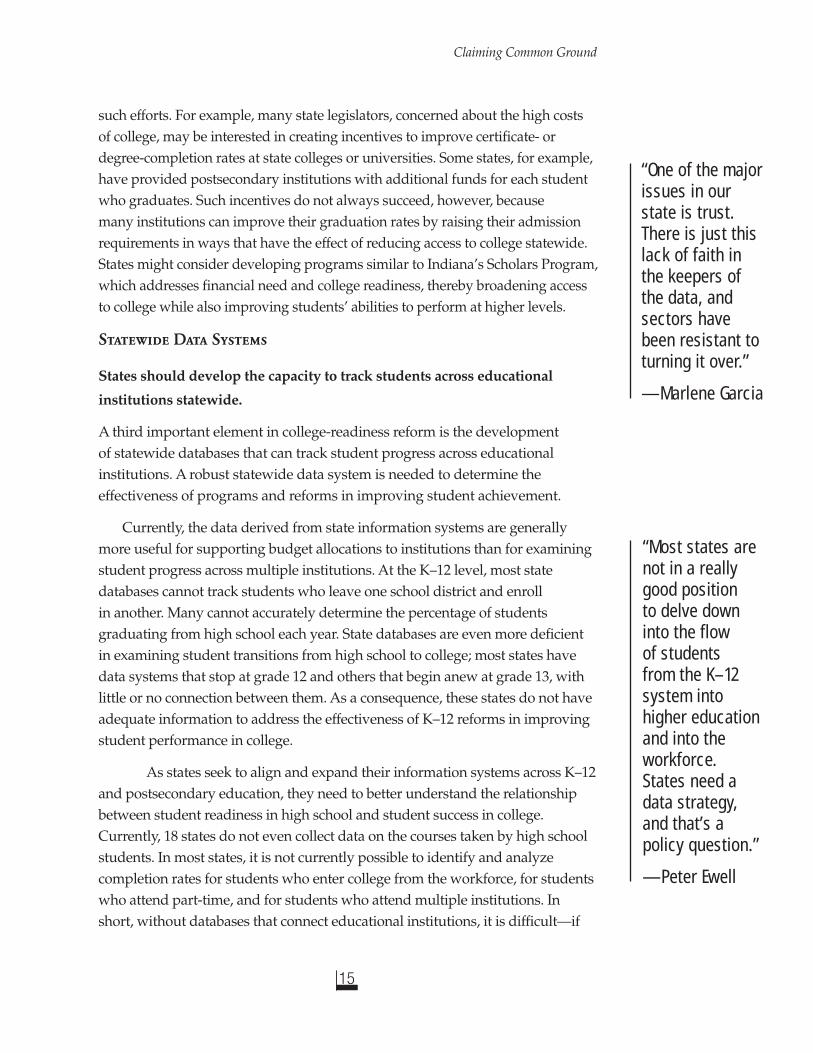
“One of the major issues in our state is trust. There is just this lack of faith in the keepers of the data, and sectors have been resistant to turning it over.”
—Marlene Garcia
“Most states are not in a really good position to delve down into the flow of students from the K–12 system into higher education and into the workforce. States need a data strategy, and that’s a policy question.”
—Peter Ewell

Claiming Common Ground
not impossible—to assess needs accurately, identify where the most substantial problems are, and design appropriate interventions.
In tracking student progress across educational institutions and systems, state information systems need to standardize and report data on high school academic courses and assessments; high school graduation; college and work readiness; transitions between high school and college; transfers between colleges; student progress while in college; and completion of postsecondary education and training programs. For example, the databases should be designed to answer questions related to college readiness:
• How do students who take college preparatory courses in high school perform in postsecondary education?
• How do students who pass (or earn a proficient score on) state assessments perform in college?
• Considering those students who require remediation in college, what percentage took a college preparatory curriculum in high school?
• Given their students’ performance in college, how can high schools strengthen their curricula and instruction to improve student readiness for college?
Most states have been developing better ways to track student achievement, and a few have been working to connect their information systems for K–12 and postsecondary education. Florida’s linked data systems represent one of the more ambitious efforts to connect the two education systems through better data gathering.
Florida’s Linked Data Systems
Florida has linked two data collection systems in order to track student progress through the state’s education systems, their participation in other public systems, and their later status in the workforce: the Data Warehouse and the Florida Education and Training Placement Information Program. In integrating the data systems, Florida is developing common standards, procedures, and quality assurance; eliminating duplicated functions and services; providing for improved accountability and public reporting; and establishing longitudinal reporting about the status and performance of students and other public program participants.
The Data Warehouse combines longitudinal student data from public schools, community colleges and technical centers, and the university system. Florida has had a history of gathering data across educational institutions on an
16
Claiming Common Ground
17
ad hoc basis, but over the past several years the State Department of Education has worked to formally connect all public databases using common student identifiers. The Data Warehouse is managed by the Information and Accountability Division of the Office of K–20 Education. The warehouse includes data on K–12 students; adult, vocational, and associate’s programs in community and technical colleges; public university, baccalaureate, master’s, doctorate, and professional programs in four-year in-state universities; assessment systems, financial aid, teacher certification, and facilities across the K–20 spectrum; and employment and continuing education outcomes. The warehouse includes the following data categories: individual students (demographics, enrollment, courses, test scores, financial aid, awards, and employment); educational curricula; staff information; program costs; and workforce information.44
The Florida Education and Training Placement Information Program follows students when they leave any level of schooling (at the high school level or above), whether they continue their education, participate in a training program (for example, vocational rehabilitation), receive public assistance, enter a correctional facility, or earn an occupational licensure. The program also contains data about whether a former student is employed or unemployed. The program integrates data from a variety of state and federal agencies, including Florida’s Agency for Workforce Innovation, Department of Children and Families, Department of Corrections, and Department of Education; and the federal government’s Department of Defense, Office of Personnel Management, and United States Postal Service.45
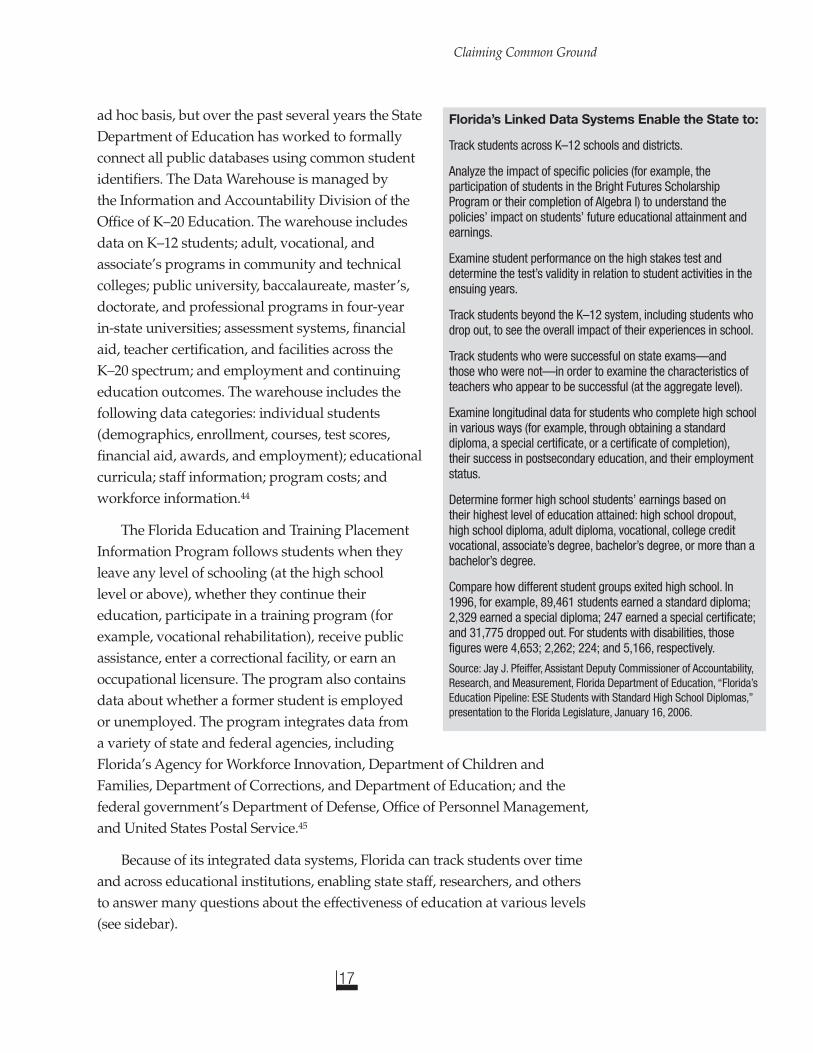
Because of its integrated data systems, Florida can track students over time and across educational institutions, enabling state staff, researchers, and others to answer many questions about the effectiveness of education at various levels (see sidebar).
Florida’s Linked Data Systems Enable the State to:
Track students across K–12 schools and districts.
Analyze the impact of specific policies (for example, the participation of students in the Bright Futures Scholarship Program or their completion of Algebra I) to understand the policies’ impact on students’ future educational attainment and earnings.
Examine student performance on the high stakes test and determine the test’s validity in relation to student activities in the ensuing years.
Track students beyond the K–12 system, including students who drop out, to see the overall impact of their experiences in school.
Track students who were successful on state exams—and those who were not—in order to examine the characteristics of teachers who appear to be successful (at the aggregate level).
Examine longitudinal data for students who complete high school in various ways (for example, through obtaining a standard diploma, a special certificate, or a certificate of completion), their success in postsecondary education, and their employment status.
Determine former high school students’ earnings based on their highest level of education attained: high school dropout, high school diploma, adult diploma, vocational, college credit vocational, associate’s degree, bachelor’s degree, or more than a bachelor’s degree.
Compare how different student groups exited high school. In 1996, for example, 89,461 students earned a standard diploma; 2,329 earned a special diploma; 247 earned a special certificate; and 31,775 dropped out. For students with disabilities, those figures were 4,653; 2,262; 224; and 5,166, respectively.
Source: Jay J. Pfeiffer, Assistant Deputy Commissioner of Accountability, Research, and Measurement, Florida Department of Education, “Florida’s Education Pipeline: ESE Students with Standard High School Diplomas,” presentation to the Florida Legislature, January 16, 2006.
Claiming Common Ground
Accountability
States should publicly report on student progress and success from high
school through postsecondary education.
To be effective in improving college readiness, states should establish student achievement objectives that require the educational systems to collaborate to achieve them. Schools, colleges, and universities should be held accountable for improving student performance from high school to college completion.
The public reporting of student progress and achievement across educational levels is crucial to the development of collaborative efforts to advance student-readiness reforms. Requiring educational institutions to report data to state departments of education, however, will not suffice in making the systems more accountable for student achievement. States need to work with educational leaders to develop clear student achievement targets that will require K–12 and postsecondary systems to achieve them jointly. Ultimately, the primary outcomes for state accountability systems should become the percentage of the young population completing high school prepared for college (college readiness); the percentage enrolling in college (participation and access); the percentage staying in college (persistence), and the percentage graduating (completion). In addition, key indicators at various stages can include, for example, high school graduation and transfers from community colleges to four-year institutions.
Although no state has instituted a comprehensive accountability system focused on improving college readiness and success, several states have
18
“Once you have data on how
well the schools spend their money
against specific performance
measures, then you have the
basis for a good conversation about
accountability.”
—Duncan Wyse
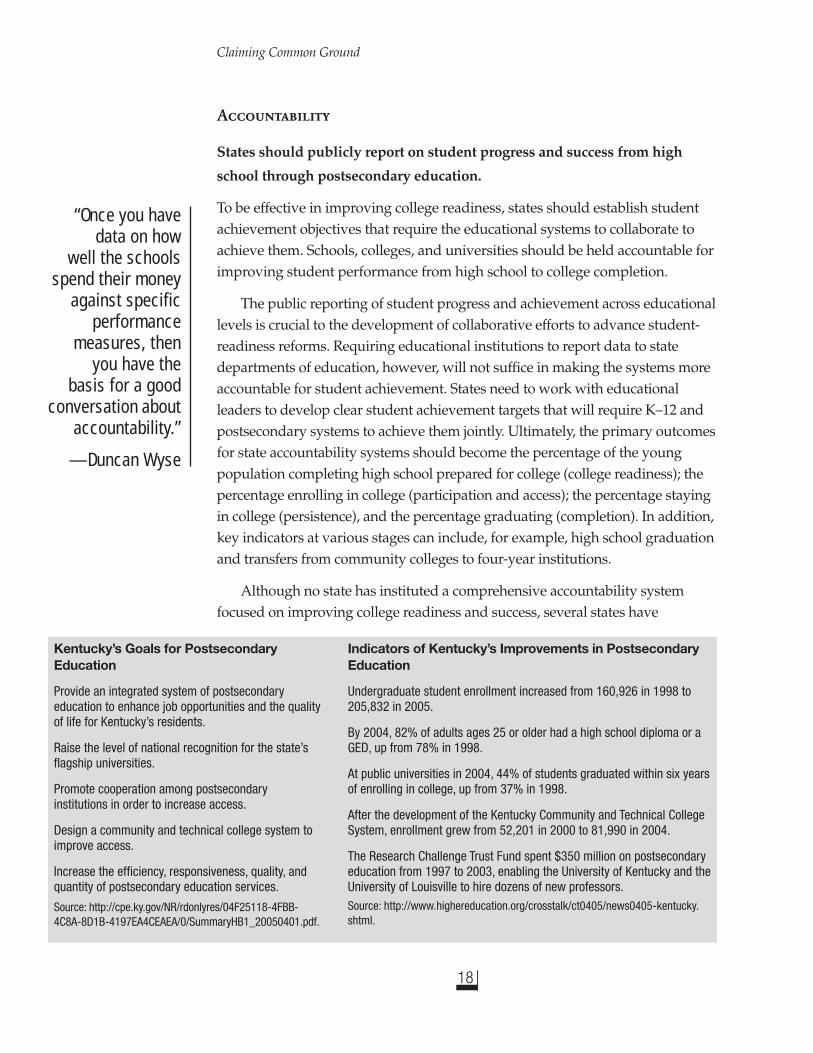
Kentucky’s Goals for Postsecondary Education
Provide an integrated system of postsecondary education to enhance job opportunities and the quality of life for Kentucky’s residents.
Raise the level of national recognition for the state’s flagship universities.
Promote cooperation among postsecondary institutions in order to increase access.
Design a community and technical college system to improve access.
Increase the efficiency, responsiveness, quality, and quantity of postsecondary education services.
Source: http://cpe.ky.gov/NR/rdonlyres/04F25118-4FBB-4C8A-8D1B-4197EA4CEAEA/0/SummaryHB1_20050401.pdf.
Indicators of Kentucky’s Improvements in Postsecondary Education
Undergraduate student enrollment increased from 160,926 in 1998 to 205,832 in 2005.
By 2004, 82% of adults ages 25 or older had a high school diploma or a GED, up from 78% in 1998.
At public universities in 2004, 44% of students graduated within six years of enrolling in college, up from 37% in 1998.
After the development of the Kentucky Community and Technical College System, enrollment grew from 52,201 in 2000 to 81,990 in 2004.
The Research Challenge Trust Fund spent $350 million on postsecondary education from 1997 to 2003, enabling the University of Kentucky and the University of Louisville to hire dozens of new professors. Source: http://www.highereducation.org/crosstalk/ct0405/news0405-kentucky.shtml.

Claiming Common Ground
developed accountability elements linking K–12 and higher education. Kentucky’s accountability system for postsecondary education offers a promising example.
Kentucky’s Accountability System for Postsecondary Education
In 1997, the Kentucky Legislature passed the Postsecondary Education Improvement Act of 1997 (House Bill 1). In addition to establishing goals for the state’s system of postsecondary education (see sidebar), the legislation charged the Council on Postsecondary Education with developing an accountability system to “ensure institutions’ compliance with the strategic plan and to measure educational quality and student progress in the postsecondary education system; research and service opportunities; and use of resources by institutions.”46 To address this charge, the council developed a public agenda focusing on accountability, degree completion, and affordability of postsecondary and adult education through 2010.
The state’s accountability system was developed around the following key questions:
• Are more Kentuckians ready for postsecondary education?
• Is Kentucky postsecondary education affordable to its citizens?
• Do more Kentuckians have certificates and degrees?
• Are college graduates prepared for life and work in Kentucky?
• Are Kentucky’s people, communities, and economy benefiting?47
The council developed state-level indicators for each question and outlined related benefits. For example, to answer the first question regarding college readiness, the council has required that the following data be collected:
• K–12 student achievement (average ACT);
• the percentage of high school students scoring a three or higher on Advanced Placement exams;
• the percentage of incoming Kentucky high school graduates not requiring remediation in math and English; and
• the number of Kentuckians earning general equivalency diplomas (GEDs).48
By including indicators for college readiness in its accountability system for postsecondary education, Kentucky has set high expectations for collaborative work between K–12 schools and colleges and universities to improve student
19
“When you look at accountability systems, on the K–12 side you have accountability for high school graduation. You probably don’t yet have accountability for college and work readiness. And then on the college side, to the extent that we have accountability systems, they look at things like student progression and success. Nobody’s looking after the college transition.”
—Jan Kettlewell

Claiming Common Ground
20
achievement. There is evidence that the reform efforts may be improving student success in college (see sidebar).
The Challenges Ahead
The policies recommended in this report do not exhaust the range of steps that states may need to consider. For example, K–16 governance commissions can assist in initiating and maintaining state action in the four policy areas. Creating these entities, however, is not sufficient in itself. In some cases, statewide K–16 bodies have become little more than discussion forums—deflecting energy from policy changes and sometimes even exacerbating tensions between K–12 and postsecondary leaders. To be effective, K–16 commissions should be charged with substantive responsibilities in such areas as alignment and coordinating the development of data and accountability systems; they should be provided the requisite resources; they should have sufficient influence and authority to make real change; and they should be held accountable for their own performance.
Improving collaboration among state agencies and among state legislative committees can also be important in developing effective state policies for K–16, particularly since most states have created regulatory and governing frameworks that perpetuate the divide between K–12 and postsecondary education. In addition, adopting legislation that outlines elements of K–16 reform appears to be useful in creating the conditions for change, but is not sufficient in itself.*
Engaging in reforms suggested by this report necessarily involves political as well as educational challenges. States may struggle with how to involve the governor or the appropriate legislative committees, and how to sustain the reforms after leaders leave office. Each state’s responses to these challenges will be unique, tempered by historical context, political culture, and the educational and other resources that are available. Nonetheless, no state’s political or educational context creates insurmountable hurdles to this agenda. Challenges await, but the appropriate policy levers are available to each state, and each state must determine how best to implement them.
*For example, Georgia passed legislation mandating that a statewide P–16 council meet on a regular basis. The council made progress under former Governor Roy Barnes, but has not met under Governor Sonny Perdue.
“Each one of these levers is powerful unto itself, but it’s
the connection among them that really allows you
to get momentum.”
—Jan Kettlewell
“What would be really helpful is
to create this sort of roadmap … so whether you’re a policymaker, … in higher ed, … in the business
community, [or] … in K–12, you can
see the steps laid out of what the
levers are, what the strategies are,
and what some of the tactics are that you could do or that you could promote in your
community.
—Margo Quiriconi
Claiming Common Ground
21
Conclusion
In many ways, the United States produces the college outcomes that its systems of education were designed to produce. Its K–12 system was developed to provide education to everyone; its college and university system was developed when only a few were expected to attend college. Today, the vast majority of high school students aspire to attend college, but only about half of the students who enroll in college are prepared for college-level academic work. And less than 40% of the young workforce (ages 25 to 34) has a postsecondary degree.49 The era of providing postsecondary education for only a small group of students is over; yet our state educational policies remain locked in a former era.
As the entities that perform the major funding and policy-setting functions for education, states are in the unique position to claim common ground between K–12 and postsecondary education. This report identifies four state policy dimensions to advance college readiness and success: the alignment of coursework and assessments; state finance; statewide data systems; and accountability. By developing and coordinating their policies in each of these areas, states can require and assist schools, colleges, and universities in working together toward a common goal—to significantly increase the number of students graduating from high school and completing college-level education and training—and thereby advance the educational achievement of millions of young Americans.
“I think what this conversation has helped me to keep an eye on is, what are the short-term policy changes … that we can jump on right away? At the same time, keep your eye on the kind of long-term policy changes that we need to make.”
—Rogéair Purnell
“I’m optimistic that these things can be done, largely because it’s imperative that they be done.”
—Ronald Cowell

22
Claiming Common Ground
Appendix
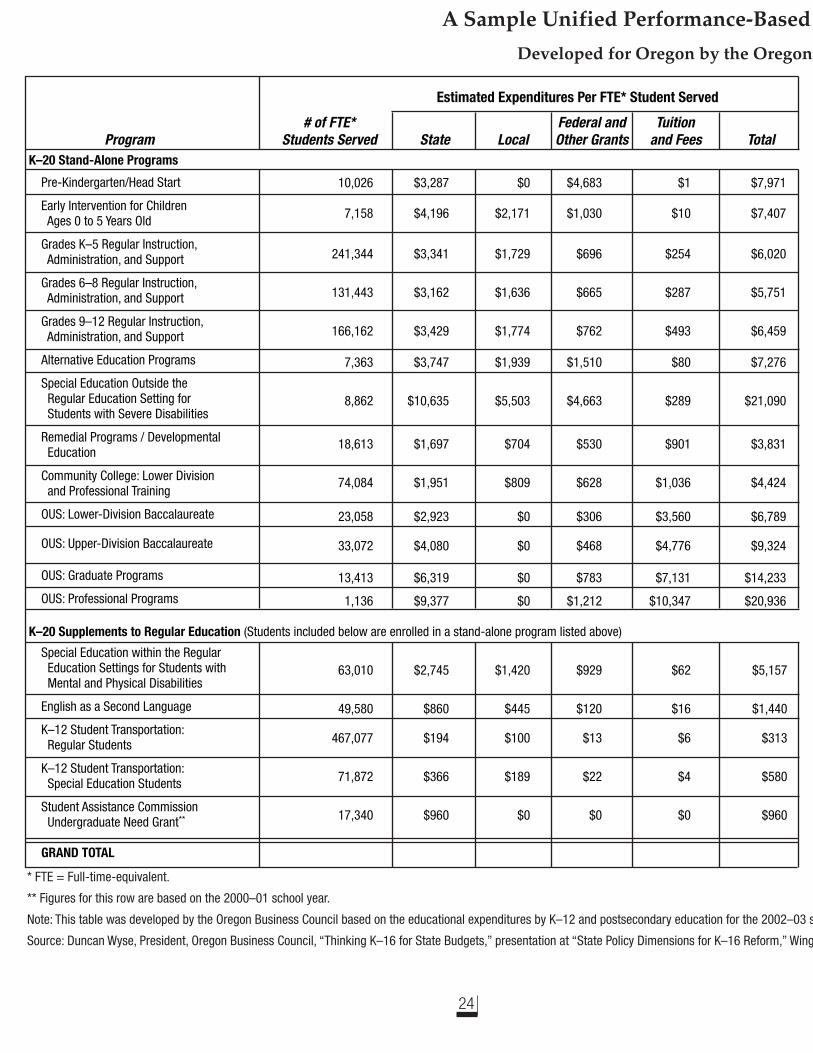
A Sample Unified Performance-Based Budget for Preschool to Grade 20
Developed for Oregon by the Oregon Business Council Based on the 2002–03 School Year
23
24
Estimated Expenditures Per FTE* Student Served
# of FTE* Federal and Tuition Program Students Served State Local Other Grants and Fees TotalK–20 Stand-Alone Programs
Pre-Kindergarten/Head Start 10,026 $3,287 $0 $4,683 $1 $7,971
Early Intervention for Children 7,158 $4,196 $2,171 $1,030 $10 $7,407 Ages 0 to 5 Years Old
Grades K–5 Regular Instruction, 241,344 $3,341 $1,729 $696 $254 $6,020 Administration, and Support
Grades 6–8 Regular Instruction, 131,443 $3,162 $1,636 $665 $287 $5,751 Administration, and Support
Grades 9–12 Regular Instruction, 166,162 $3,429 $1,774 $762 $493 $6,459 Administration, and SupportAlternative Education Programs 7,363 $3,747 $1,939 $1,510 $80 $7,276
Special Education Outside the Regular Education Setting for 8,862 $10,635 $5,503 $4,663 $289 $21,090 Students with Severe Disabilities
Remedial Programs / Developmental 18,613 $1,697 $704 $530 $901 $3,831 Education
Community College: Lower Division 74,084 $1,951 $809 $628 $1,036 $4,424 and Professional Training OUS: Lower-Division Baccalaureate 23,058 $2,923 $0 $306 $3,560 $6,789
OUS: Upper-Division Baccalaureate 33,072 $4,080 $0 $468 $4,776 $9,324
OUS: Graduate Programs 13,413 $6,319 $0 $783 $7,131 $14,233
OUS: Professional Programs 1,136 $9,377 $0 $1,212 $10,347 $20,936
K–20 Supplements to Regular Education (Students included below are enrolled in a stand-alone program listed above)
Special Education within the Regular Education Settings for Students with 63,010 $2,745 $1,420 $929 $62 $5,157 Mental and Physical Disabilities
English as a Second Language 49,580 $860 $445 $120 $16 $1,440
K–12 Student Transportation: 467,077 $194 $100 $13 $6 $313 Regular Students
K–12 Student Transportation: 71,872 $366 $189 $22 $4 $580 Special Education Students
Student Assistance Commission 17,340 $960 $0 $0 $0 $960 Undergraduate Need Grant**
GRAND TOTAL
Pre-Kindergarten/Head Start
Early Intervention for Children Ages 0 to 5 Years Old
Grades K–5 Regular Instruction, Administration, and Support
Grades 6–8 Regular Instruction, Administration, and Support
Grades 9–12 Regular Instruction, Administration, and Support
Alternative Education Programs
Special Education Outside the Regular Education Setting for Students with Severe Disabilities
Remedial Programs / Developmental Education
Community College: Lower Division and Professional Training
OUS: Lower-Division Baccalaureate
OUS: Upper-Division Baccalaureate
OUS: Graduate Programs
OUS: Professional Programs
Special Education within the Regular Education Settings for Students with Mental and Physical Disabilities
English as a Second Language
K–12 Student Transportation: Regular Students
K–12 Student Transportation: Special Education Students
Student Assistance Commission Undergraduate Need Grant**
GRAND TOTAL
A Sample Unified Performance-Based
Developed for Oregon by the Oregon
* FTE = Full-time-equivalent.
** Figures for this row are based on the 2000–01 school year.
Note: This table was developed by the Oregon Business Council based on the educational expenditures by K–12 and postsecondary education for the 2002–03 s
Source: Duncan Wyse, President, Oregon Business Council, “Thinking K–16 for State Budgets,” presentation at “State Policy Dimensions for K–16 Reform,” Wing
25
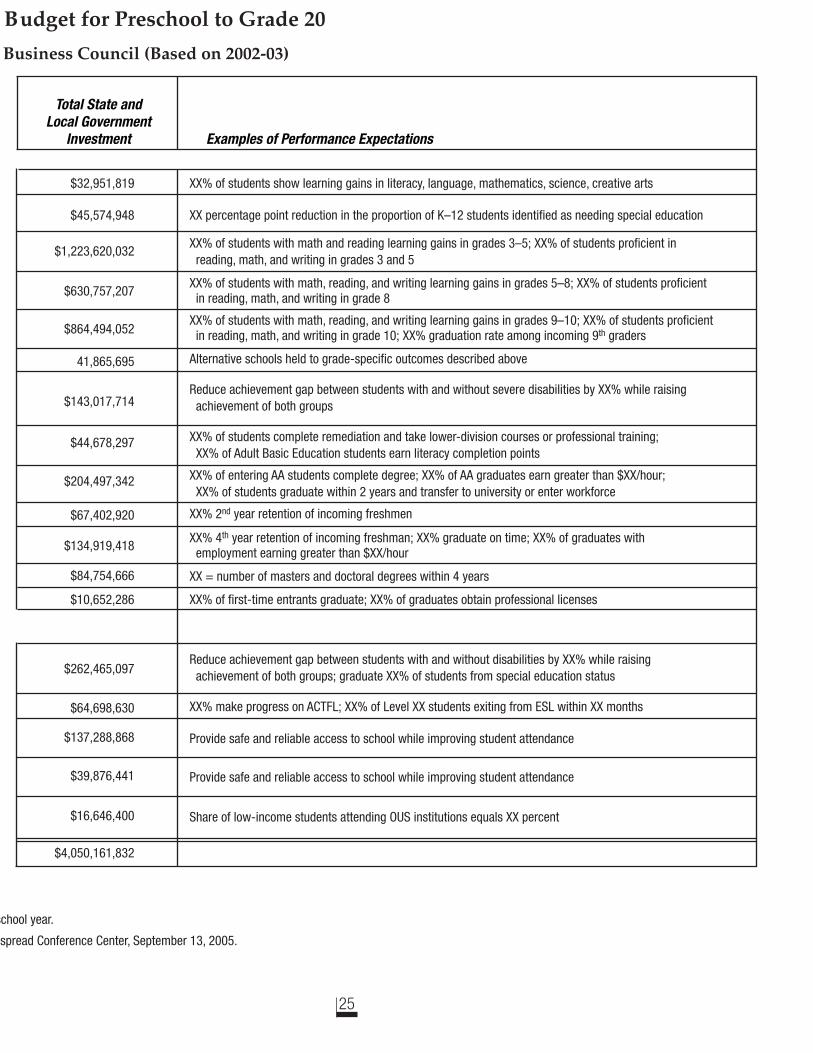
XX% of students show learning gains in literacy, language, mathematics, science, creative arts
XX percentage point reduction in the proportion of K–12 students identified as needing special education
XX% of students with math and reading learning gains in grades 3–5; XX% of students proficient in reading, math, and writing in grades 3 and 5
XX% of students with math, reading, and writing learning gains in grades 5–8; XX% of students proficient in reading, math, and writing in grade 8
XX% of students with math, reading, and writing learning gains in grades 9–10; XX% of students proficient in reading, math, and writing in grade 10; XX% graduation rate among incoming 9th graders
Alternative schools held to grade-specific outcomes described above
Reduce achievement gap between students with and without severe disabilities by XX% while raising achievement of both groups
XX% of students complete remediation and take lower-division courses or professional training; XX% of Adult Basic Education students earn literacy completion points
XX% of entering AA students complete degree; XX% of AA graduates earn greater than $XX/hour; XX% of students graduate within 2 years and transfer to university or enter workforce
XX% 2nd year retention of incoming freshmen
XX% 4th year retention of incoming freshman; XX% graduate on time; XX% of graduates with employment earning greater than $XX/hour
XX = number of masters and doctoral degrees within 4 years
XX% of first-time entrants graduate; XX% of graduates obtain professional licenses
Reduce achievement gap between students with and without disabilities by XX% while raising achievement of both groups; graduate XX% of students from special education status
XX% make progress on ACTFL; XX% of Level XX students exiting from ESL within XX months
Provide safe and reliable access to school while improving student attendance
Provide safe and reliable access to school while improving student attendance
Share of low-income students attending OUS institutions equals XX percent
Total State and Local Government Investment Examples of Performance Expectations
$32,951,819
$45,574,948
$1,223,620,032
$630,757,207
$864,494,052 41,865,695
$143,017,714
$44,678,297
$204,497,342 $67,402,920
$134,919,418 $84,754,666
$10,652,286
$262,465,097
$64,698,630
$137,288,868
$39,876,441
$16,646,400
$4,050,161,832
Budget for Preschool to Grade 20
Business Council (Based on 2002-03)
school year.
spread Conference Center, September 13, 2005.

Claiming Common Ground
Endnotes
1 Additional joint publications include The Learning Connection: New Partnerships Between Schools and Colleges (2001); Gathering Momentum: Building the Learning Connection Between Schools and Colleges (2002); Betraying the College Dream: How Disconnected Systems Undermine Student Aspirations (2003); and From High School to College: Improving Opportunities for Success in Postsecondary Education (2004). 2 National Center for Public Policy and Higher Education, “Income of U.S. Workforce Projected to Decline if Education Doesn’t Improve,” in Policy Alert (San Jose, CA: Nov. 2005).3 Organisation for Economic Co-operation and Development (OECD), Education at a Glance (Paris, France: 2004). 4 Patrick Kelly, As America Becomes More Diverse: The Impact of State Higher Education Inequality (Boulder, CO: National Center for Higher Education Management Systems, 2005).5 Andrea Venezia, Michael Kirst, and Anthony Antonio, Betraying the College Dream: How Disconnected K–12 and Postsecondary Education Systems Undermine Student Aspirations (Stanford, CA: Bridge Project, Stanford Institute for Higher Education Research, 2003). 6 National Center for Education Statistics, The Condition of Education (Washington, D.C.: U.S. Department of Education, 2001), p. 148.7 National Center for Public Policy and Higher Education, Measuring Up 2004 (San Jose, CA: 2004), www.highereducation.org. 8 Anthony Carnevale and Donna Desrochers, Standards for What? The Economic Roots of K–16 Reform (Princeton, NJ: Educational Testing Service, 2003), http://www.ets.org/research/dload/standards_for_what.pdf. 9 National Center for Public Policy and Higher Education, Measuring Up 2000, Measuring Up 2002, and Measuring Up 2004 (San Jose, CA: 2000, 2002, 2004), www.highereducation.org.10 OECD, Education at a Glance. 11 Carnevale and Desrochers, Standards for What? 12 National Center for Public Policy and Higher Education, “Income of U.S. Workforce Projected to Decline.” 13 Tom Mortenson, “Postsecondary Education Opportunity,” Nov. 2004, No. 149, p. 10.14 Michael Kirst and Andrea Venezia (eds.), From High School to College: Improving Opportunities for Success in Postsecondary Education (San Francisco: Jossey Bass, 2004).15 National Center for Public Policy and Higher Education, “The Educational Pipeline: Big Investment, Big Returns,” in Policy Alert (San Jose, CA: April 2004). 16 National Center for Education Statistics, Common Core Data, “IPEDS 2002 Fall Enrollment Survey” and “IPEDS 2002 Graduation Rate Survey,” Early Release Data (Washington, D.C.: U.S. Department of Education, 2002).
26
Claiming Common Ground
17 R. D. Kahlenberg, America’s Untapped Resource: Low Income Students in Higher Education (New York: Twentieth Century Fund, 2004). 18 National Center for Education Statistics, “Enrollment in Postsecondary Institutions” and “Financial Statistics Fiscal Year 2002” (Washington, D.C.: U.S. Department of Education, Fall 2002). 19 Kirst and Venezia (eds.), From High School to College. 20 National Center for Education Statistics, The Condition of Education, p. 148. 21 The Education Trust, “Ticket to Nowhere. The Gap Between Leaving High School and Entering College and High Performance Jobs,” in Thinking K–16, Vol. 3, Issue 2 (Washington, D.C.: Fall 1999). 22 http://www.act.org/news/releases/2003/pdf/english.pdf. 23 Venezia, Kirst, and Antonio, Betraying the College Dream.24 Maria Sacchetti, “Colleges Question MCAS Success: Many in State Schools Still Need Remedial Help,” Boston Globe, June 26, 2005. 25 http://www.calstate.edu/eap/.26 David Spence, Executive Vice Chancellor Emeritus, California State University, “Early Assessment Academic Preparation Initiative,” presentation at “State Policy Dimensions for K–16 Reform,” Wingspread Conference Center, September 12, 2005. 27 Ibid. 28 http://www.calstate.edu/eap/. 29 Spence, “Early Assessment Academic Preparation Initiative.” 30 Ibid. 31 Duncan Wyse, President, Oregon Business Council, “Oregon Public Education: A ‘System’ in Need of Direction (And Why the Budget is the Key Tool),” presentation at “State Policy Dimensions for K–16 Reform,” Wingspread Conference Center, September 13, 2005. 32 Duncan Wyse, President, Oregon Business Council, “Governing the Enterprise Pre-K–20: Oregon Is Poised to Adopt a New Vision and a New Structure to Meet 21st Century Demands for More and Better Education,” presentation to the Oregon Business Council, Portland, Oregon, 2005. 33 Ibid. 34 Wyse, “Oregon Public Education: A ‘System’ in Need of Direction.” 35 Ibid. 36 Ibid. 37 Ibid. 38 Edward St. John, Jacob Gross, Glenda Musoba, and Anna Chung, A Step Toward College Success: Assessing Attainment among Indiana’s Twenty-first Century Scholars (Indianapolis: Lumina Foundation for Education, 2005), http://www.luminafoundation.org/publications/CollegeSuccess.pdf. 39 Phone conversation with Dennis Obergfell, State Student Assistance Commission, Aug. 2, 2005. 40 St. John, Gross, Musoba, and Chung, A Step Toward College Success.
27
Claiming Common Ground
41 Stanley Jones, Commissioner of Higher Education, State of Indiana, “Access to Higher Education in Indiana,” presentation at “State Policy Dimensions for K–16 Reform,” Wingspread Conference Center, September 12, 2005. 42 Ibid. 43 St. John, Gross, Musoba, and Chung, A Step Toward College Success. 44 http://edwapp.doe.state.fl.us/doe/EDW_Facts.htm. 45 Phone conversation with Jay J. Pfeiffer, Assistant Deputy Commissioner of Accountability, Research, and Measurement, Florida Department of Education, January 27, 2006. 46 http://cpe.ky.gov/NR/rdonlyres/04F25118-4FBB-4C8A-8D1B-4197EA4CEAEA/0/SummaryHB1_20050401.pdf.47http://cpe.ky.gov/planning/5Qs/default.htm.48 http://cpe.ky.gov/NR/rdonlyres/E88C6729-09CA-4DF4-BB34-CD6C34CBDD37/0/StateKI_Summary.pdf. 49 Kelly, As America Becomes More Diverse.
28
Claiming Common Ground
About the Authors
Patrick M. Callan is president of the National Center for Public Policy and Higher Education. He has previously served as executive director of the California Higher Education Policy Center, the California Postsecondary Education Commission, the Washington State Council for Postsecondary Education, and the Montana Commission on Postsecondary Education, and as vice president of the Education Commission of the States (ECS).
Joni E. Finney is vice president of the National Center for Public Policy and Higher Education. Finney oversees the research, communication, and administration of the National Center. She directs research studies related to higher education finance, governance, and performance, including developing the nation’s first state-by-state report card for higher education, Measuring Up. Prior to her position at the National Center, Finney held senior policy positions with the California Higher Education Policy Center, the Education Commission of the States (ECS), the Pennsylvania State University, and the University of Southern Colorado.
Michael W. Kirst is professor of education at Stanford University and former president of the California State Board of Education. He is a faculty affiliate with the Department of Political Science, and has a courtesy appointment with the Graduate School of Business. Before joining the Stanford University faculty, Kirst held several positions with the federal government, including staff director of the U.S. Senate Subcommittee on Manpower, Employment, and Poverty, and director of program planning and evaluation for the Bureau of Elementary and Secondary Education in the former U.S. Office of Education. He was the principal investigator for Stanford University’s Bridge Project and is co-author of Betraying the College Dream and From High School to College.
Michael D. Usdan is senior fellow at the Institute for Educational Leadership (IEL). He was president of IEL for 20 years. Before joining IEL, he was Connecticut’s commissioner of higher education, he served as president of the Merrill-Palmer Institute in Detroit, and he taught at Columbia University, the City University of New York, Northwestern University, and Fordham University, as well as in schools in New York City and White Plains, New York.
Andrea Venezia is senior policy analyst and project director at the National Center for Public Policy and Higher Education. Her work examines education policy, particularly as related to equity and the transition from K–12 to postsecondary education. Prior to joining the National Center, she directed Stanford University’s Bridge Project and co-authored Betraying the College Dream
29

Claiming Common Ground
30
and From High School to College. She has worked for a variety of state, federal, and not-for-profit entities, including the Stanford Institute for Higher Education Research, the Texas Higher Education Coordinating Board, and the National Education Goals Panel.
Claiming Common Ground
31
The Institute for Educational Leadership
The Institute for Educational Leadership (IEL) is a nonprofit, nonpartisan organization based in Washington, D.C. For more than 40 years, IEL’s mission has been to build the capacity of individuals and organizations in education and related fields to work together—across policies, programs, and sectors. The Institute provides services in the following three program areas: Developing and Supporting Leaders, Strengthening School-Family-Community Connections, and Connecting and Improving Policies and Systems that Serve Children and Youth. IEL brings together diverse constituencies, such as federal, state, and local government agencies and nonprofit organizations, and focuses on empowering leaders with knowledge and applicable ideas. The Institute facilitates dialogue across boundaries of all sorts, building alliances and partnerships for change. Its publications translate research and experience into practical recommendations about what works to improve American education.
The Stanford Institute for Higher Education Research
The Stanford Institute for Higher Education Research (SIHER) is home to sponsored research projects that examine contemporary higher education planning and policy issues from a wide range of analytical perspectives, including those of social scientists and policy audiences in the United States and abroad. Since its establishment in 1989, SIHER has sought to understand the dynamics of systemic change, productivity, management, and effectiveness of higher education organizations, as well as to offer suggestions for their improvement.
Claiming Common Ground
The National Center for Public Policy and Higher EducationThe National Center for Public Policy and Higher Education promotes public policies that enhance Americans’ opportunities to pursue and achieve high-quality education and training beyond high school. As an independent, nonprofit, nonpartisan organization, the National Center prepares action-oriented analyses of pressing policy issues facing the states and the nation regarding opportunity and achievement in higher education—including two- and four-year, public and private, for-profit and nonprofit institutions. The National Center communicates performance results and key findings to the public, to civic, business, and higher education leaders, and to state and federal leaders who are in positions to improve higher education policy.
Established in 1998, the National Center is not affiliated with any institution of higher education, with any political party, or with any government agency; it receives continuing, core financial support from a consortium of national foundations that includes The Pew Charitable Trusts, The Atlantic Philanthropies, and The Ford Foundation.
152 North Third Street, Suite 705, San Jose, California 95112Telephone: 408-271-2699 • FAX: 408-271-2697
www.highereducation.org
National Center PublicationsThe National Center publishes:
◆ Reports and analyses commissioned by the National Center, ◆ Reports and analyses written by National Center staff, ◆ National Center Policy Reports that are approved by the National
Center’s Board of Directors, and ◆ National CrossTalk, a quarterly publication.
The following National Center publications—as well as a host of other information and links—are available at www.highereducation.org. Single copies of most of these reports are also available from the National Center. Please FAX requests to 408-271-2697 and ask for the report by publication number.
32
Claiming Common Ground
Claiming Common Ground: State Policymaking for Improving College Readiness and Success, by Patrick M. Callan, Joni E. Finney, Michael W. Kirst, Michael D. Usdan, and Andrea Venezia (March 2006, #06-1). To improve college readiness and success, states can develop policies that better connect their K–12 and postsecondary education systems. However, state action in each of the following policy areas is needed to create college-readiness reform: alignment of coursework and assessments; state finance; statewide data systems; and accountability.
Measuring Up on College-Level Learning, by Margaret A. Miller and Peter T. Ewell (October 2005, #05-8). In this report, the National Forum on College-Level Learning proposes a model for evaluating and comparing college-level learning on a state-by-state basis, including assessing educational capital. As well as releasing the results for five participating states, the authors also explore the implications of their findings in terms of performance gaps by race/ethnicity and educating future teachers.
The Governance Divide: A Report on a Four-State Study on Improving College Readiness and Success, by Andrea Venezia, Patrick M. Callan, Joni E. Finney, Michael W. Kirst, and Michael D. Usdan (September 2005, #05-3). This report, supported by case studies in Florida, Georgia, New York, and Oregon, identifies and examines policy options available to states that are interested in creating sustained K–16 reform.
The Governance Divide: The Case Study for Florida, by Andrea Venezia and Joni E. Finney (2006, #05-4).
The Governance Divide: The Case Study for Georgia, by Andrea Venezia, Patrick M. Callan, Michael W. Kirst, and Michael D. Usdan (2006, #05-5).
The Governance Divide: The Case Study for New York, by Andrea Venezia, Michael W. Kirst, and Michael D. Usdan (2006, #05-6).
The Governance Divide: The Case Study for Oregon, by Andrea Venezia and Michael W. Kirst (2006, #05-7).
Borrowers Who Drop Out: A Neglected Aspect of the College Student Loan Trend, by Lawrence Gladieux and Laura Perna (May 2005, #05-2). This report examines the experiences of students who borrow to finance their educations, but do not complete their postsecondary programs. Using the latest comprehensive data, this report compares borrowers who drop out with other groups of students, and provides recommendations on policies and programs that would better prepare, support, and guide students—especially low-income students—in completing their degrees.
Case Study of Utah Higher Education, by Kathy Reeves Bracco and Mario Martinez (April 2005, #05-1). This report examines state policies and performance in the areas of enrollment and affordability. Compared with other states, Utah has been able to maintain a system of higher education that is more affordable for students, while enrollments have almost doubled over the past 20 years.
Measuring Up 2004: The National Report Card on Higher Education (September 2004). Measuring Up 2004 consists of a national report card for higher education
33
Claiming Common Ground
34
(report #04-5) and 50 state report cards (#04-4). The purpose of Measuring Up 2004 is to provide the public and policymakers with information to assess and improve postsecondary education in each state. For the first time, this edition of Measuring Up provides information about each state’s improvement over the past decade. Visit www.highereducation.org to download Measuring Up 2004 or to make your own comparisons of state performance in higher education.
Technical Guide Documenting Methodology, Indicators, and Data Sources for Measuring Up 2004 (November 2004, #04-6).
Ensuring Access with Quality to California’s Community Colleges, by Gerald C. Hayward, Dennis P. Jones, Aims C. McGuinness, Jr., and Allene Timar, with a postscript by Nancy Shulock (May 2004, #04-3). This report finds that enrollment growth pressures, fee increases, and recent budget cuts in the California Community Colleges are having significant detrimental effects on student access and program quality. The report also provides recommendations for creating improvements that build from the state policy context and from existing promising practices within the community colleges.
Public Attitudes on Higher Education: A Trend Analysis, 1993 to 2003, by John Immerwahr (February 2004, #04-2). This public opinion survey, prepared by Public Agenda for the National Center, reveals that public attitudes about the importance of higher education have remained stable during the recent economic downturn. The survey also finds that there are some growing public concerns about the costs of higher education, especially for those groups most affected, including parents of high school students, African-Americans, and Hispanics.
Responding to the Crisis in College Opportunity (January 2004, #04-1). This policy statement, developed by education policy experts at Lansdowne, Virginia, proposes short-term emergency measures and long-term priorities for governors and legislators to consider for funding higher education during the current lean budget years. Responding to the Crisis suggests that in 2004 the highest priority for state higher education budgets should be to protect college access and affordability for students and families.
With Diploma in Hand: Hispanic High School Seniors Talk About Their Future, by John Immerwahr (June 2003, #03-2). This report by Public Agenda explores some of the primary obstacles that many Hispanic students face in seeking higher education—barriers that suggest opportunities for creative public policy to improve college attendance and completion rates among Hispanics.
Purposes, Policies, Performance: Higher Education and the Fulfi llment of a State’s Public Agenda (February 2003, #03-1). This essay is drawn from discussions of higher education leaders and policy offi cials at a roundtable convened in June 2002 at New Jersey City University on the relationship between public purposes, policies, and performance of American higher education.
Measuring Up 2002: The State-by-State Report Card for Higher Education (October
Claiming Common Ground
35
2002, #02-7). This report card, which updates the inaugural edition released in 2000, grades each state on its performance in fi ve key areas of higher education. Measuring Up 2002 also evaluates each state’s progress in relation to its own results from 2000.
Technical Guide Documenting Methodology, Indicators, and Data Sources for Measuring Up 2002 (October 2002, #02-8).
State Policy and Community College–Baccalaureate Transfer, by Jane V. Wellman (July 2002, #02-6). This report recommends state policies to energize and improve higher education performance regarding transfers from community colleges to four-year institutions.
Fund for the Improvement of Postsecondary Education: The Early Years (June 2002, #02-5). The Fund for the Improvement of Postsecondary Education (FIPSE) attained remarkable success in funding innovative and enduring projects during its early years. This report, prepared by FIPSE’s early program offi cers, describes how those results were achieved.
Losing Ground: A National Status Report on the Affordability of American Higher Education (May 2002, #02-3). This national status report documents the declining affordability of higher education for American families, and highlights public policies that support affordable higher education. It provides state-by-state summaries as well as national fi ndings.
The Affordability of Higher Education: A Review of Recent Survey Research, by John Immerwahr (May 2002, #02-4). This review of recent surveys by Public Agenda confi rms that Americans feel that rising college costs threaten to make higher education inaccessible for many people.
Coping with Recession: Public Policy, Economic Downturns, and Higher Education, by Patrick M. Callan (February 2002, #02-2). This report outlines the major policy considerations that states and institutions of higher education face during economic downturns.
Competition and Collaboration in California Higher Education, by Kathy Reeves Bracco and Patrick M. Callan (January 2002, #02-1). This report argues that the structure of California’s state higher education system limits the system’s capacity for collaboration.
Measuring Up 2000: The State-by-State Report Card for Higher Education (November 2000, #00-3). This fi rst-of-its-kind report card grades each state on its performance in higher education. The report card also provides comprehensive profi les of each state and brief states-at-a-glance comparisons.
Beneath the Surface: A Statistical Analysis of the Major Variables Associated with State Grades in Measuring Up 2000, by Alisa F. Cunningham and Jane V. Wellman (November 2001, #01-4). Using statistical analysis, this report explores the “drivers” that predict overall performance in Measuring Up 2000.
Claiming Common Ground
36
Supplementary Analysis for Measuring Up 2000: An Exploratory Report, by Mario Martinez (November 2001, #01-3). This supplement explores the relationships within and among the performance categories in Measuring Up 2000.
Some Next Steps for States: A Follow-up to Measuring Up 2000, by Dennis Jones and Karen Paulson (June 2001, #01-2). This report suggests a range of actions that states can take to bridge the gap between state performance identifi ed in Measuring Up 2000 and the formulation of effective policy to improve performance in higher education.
A Review of Tests Performed on the Data in Measuring Up 2000, by Peter Ewell (June 2001, #01-1). This review describes the statistical testing performed on the data in Measuring Up 2000 by the National Center for Higher Education Management Systems.
Recent State Policy Initiatives in Education: A Supplement to Measuring Up 2000, by Aims McGuinness, Jr. (December 2000, #00-6). This supplement highlights education initiatives that states have adopted since 1997–98.
Assessing Student Learning Outcomes: A Supplement to Measuring Up 2000, by Peter Ewell and Paula Ries (December 2000, #00-5). This report is a national survey of state efforts to assess student learning outcomes in higher education.
Technical Guide Documenting Methodology, Indicators and Data Sources for Measuring Up 2000 (November 2000, #00-4).
A State-by-State Report Card on Higher Education: Prospectus (March 2000, #00-1). This document summarizes the goals of the National Center’s report-card project.
Great Expectations: How the Public and Parents—White, African-American, and Hispanic—View Higher Education, by John Immerwahr with Tony Foleno (May 2000, #00-2). This report by Public Agenda fi nds that Americans overwhelmingly see higher education as essential for success. Survey results are also available for the following states:
Great Expectations: How Pennsylvanians View Higher Education (May 2000, #00-2b).Great Expectations: How Floridians View Higher Education (August 2000, #00-2c).Great Expectations: How Coloradans View Higher Education (August 2000, #00-2d).Great Expectations: How Californians View Higher Education (August 2000, #00-2e).Great Expectations: How New Yorkers View Higher Education (October 2000, #00-2f).Great Expectations: How Illinois Residents View Higher Education (October 2000, #00-2h).
State Spending for Higher Education in the Next Decade: The Battle to Sustain Current Support, by Harold A. Hovey (July 1999, #99-3). This fi scal forecast of state and local spending patterns fi nds that the vast majority of states will face signifi cant fi scal defi cits over the next eight years, which will in turn lead to increased scrutiny of higher education in almost all states, and to curtailed spending for public higher education in many states.
Claiming Common Ground
37
South Dakota: Developing Policy-Driven Change in Higher Education, by Mario Martinez (June 1999, #99-2). This report describes the processes for change in higher education that government, business, and higher education leaders are creating and implementing in South Dakota.
Taking Responsibility: Leaders’ Expectations of Higher Education, by John Immerwahr (January 1999, #99-1). This paper reports the views of those most involved with decision-making about higher education, based on focus groups and a survey conducted by Public Agenda.
The Challenges and Opportunities Facing Higher Education: An Agenda for Policy Research, by Dennis Jones, Peter Ewell, and Aims McGuinness (December 1998, #98-8). This report argues that due to substantial changes in the landscape of postsecondary education, new state-level policy frameworks must be developed and implemented.
Higher Education Governance: Balancing Institutional and Market Infl uences, by Richard C. Richardson, Jr., Kathy Reeves Bracco, Patrick M. Callan, and Joni E. Finney (November 1998, #98-7). This publication describes the structural relationships that affect institutional effectiveness in higher education, and argues that state policy should strive for a balance between institutional and market forces.
Federal Tuition Tax Credits and State Higher Education Policy: A Guide for State Policy Makers, by Kristin D. Conklin (December 1998, #98-6). This report examines the implications of the federal income tax provisions for students and their families, and makes recommendations for state higher education policy.
The Challenges Facing California Higher Education: A Memorandum to the Next Governor of California, by David W. Breneman (September 1998, #98-5). This memorandum argues that California should develop a new Master Plan for Higher Education.
Tidal Wave II Revisited: A Review of Earlier Enrollment Projections for California Higher Education, by Gerald C. Hayward, David W. Breneman, and Leobardo F. Estrada (September 1998, #98-4). This review fi nds that earlier forecasts of a surge in higher education enrollments were accurate.
Organizing for Learning: The View from the Governor’s Offi ce, by James B. Hunt Jr., chair of the National Center for Public Policy and Higher Education, and former governor of North Carolina (June 1998, #98-3). This publication is an address to the American Association for Higher Education concerning opportunity in higher education.
The Price of Admission: The Growing Importance of Higher Education, by John Immerwahr (Spring 1998, #98-2). This report is a national survey of Americans’ views on higher education, conducted and reported by Public Agenda.
Concept Paper: A National Center to Address Higher Education Policy, by Patrick M. Callan (March 1998, #98-1). This concept paper describes the purposes of the National Center for Public Policy and Higher Education.
Claiming Common Ground
www.highereducation.org
38