Embed Size (px)
Citation preview
Office of the New York City Comptroller Scott M. Stringer
Office of the New York City Comptroller Scott M. Stringer Bureau of Law and Adjustment www.comptroller.nyc.gov
February 2018
Office of the Comptroller • City of New York • One Centre Street, New York, NY 10007 • Phone: (212) 669-3500 • comptroller.nyc.gov
@NYCComptroller
Claims Report: Fiscal Year 2017
i Claims Report: Fiscal Year 2017
ii Office of the New York City Comptroller Scott M. Stringer
THE CITY OF NEW YORK OFFICE OF THE COMPTROLLER
SCOTT M. STRINGER COMPTROLLER
February 20, 2018
Dear Fellow New Yorkers:
I am pleased to share with you the New York City Comptroller’s Office Claims Report for fiscal year (FY) 2017, covering July 1, 2016 through June 30, 2017. This report, the fourth in my administration, evaluates claims filed against the City of New York, outlining claim trends by type across City agencies. Claim settlements and judgments for personal injury and property damage cost each City resident approximately $79.13 in FY 2017. All City agencies should use this report and perform their own analysis in order to reduce the number and cost of claims and appropriately assess risk so that the City can do better in managing risk on behalf of its residents.
In FY 2017, personal injury and property damage (tort claims) settlements cost the City $675.6 million, nearly a six percent increase from the $639.2 million paid in FY 2016. The City settled other non-tort claims for a total of $343.1 million, representing a ten percent decrease from FY 2016, when settlements totaled $381.1 million.
In FY 2017, the City paid out $84.5 million to continue to clear the backlog of high exposure legacy cases that have been in litigation for a decade or more. This $84.5 million dollar figure constitutes 13 percent of total tort payouts in FY 2017 of $675.6 million.
Although the City is facing historically high settlement payouts, there are reasons to be optimistic. FY 2017 saw a decline in claims filed against City agencies, such as Department of Transportation (DOT), Department of Sanitation (DSNY), NYC Health + Hospitals (H+H), and Department of Parks and Recreation (Parks). And between FY 2016 and FY 2017, the number of claims filed against the New York Police Department (NYPD) dropped by 14 percent. This reduction in the number of claims filed against the NYPD continues the decline in the number of claims filed from FY 2014 to FY 2016.
iii Claims Report: Fiscal Year 2017
Although the number of claims filed against the NYPD declined in FY 2017, claims and cases against the NYPD that were resolved in FY 2017 cost the City $308.2 million, the highest in City history. However, as highlighted and explained in this report, it was a very small number of wrongful conviction cases that disproportionally accounted for the total amount.
When it is prudent to do so, my office evaluates and resolves meritorious claims pre-litigation to provide closure to claimants sooner and enable the City to better utilize its litigation and trial counsel resources. During FY 2017, my office settled significant civil rights claims before litigation to avoid lengthy proceedings that are costly for the City and claimants alike. In particular, we settled civil rights claims redressing the wrongful convictions of Vanessa Gathers, William Vasquez, Amaury Villalobos, and Raymond Mora. In addition, my office settled pre-litigation the wrongful death claim filed by the estate of Felix Kumi to avoid the risk of unreasonable verdicts and judgments.
My administration has developed and deployed data-driven tools, including ClaimStat, to reduce future claims costs. We will continue to work closely with the NYPD, DOC, and DSNY to share data to reduce risks posed to the City and its residents and visitors. We welcome partnerships with other City agencies so that we can further expand the use of data-driven processes to implement the best risk management tools. In the long-term, utilization of technology and efficient coordination with other City agencies should result in a continued decline in the number of claims filed, lower settlement costs, and a safer and a better City for all New Yorkers.
Sincerely,
Scott M. Stringer New York City Comptroller
iv Office of the New York City Comptroller Scott M. Stringer
I. EXECUTIVE SUMMARY .............................................................. 1
II. OVERVIEW OF THE COMPTROLLER’S INITIATIVES TO
MANAGE RISK AND IMPLEMENT BEST PRACTICES .............. 2
II. LEGACY CLAIMS ......................................................................... 3
III. TORT CLAIMS .............................................................................. 5
A. PERSONAL INJURY CLAIMS .................................................. 5
B. PROPERTY DAMAGE CLAIMS ............................................... 6
C. TORT CLAIM TRENDS BY CLAIM TYPE ................................ 8
1. POLICE ACTION CLAIMS .................................................. 8
2. CIVIL RIGHTS CLAIMS ...................................................... 9
3. MEDICAL MALPRACTICE CLAIMS ................................. 10
4. MOTOR VEHICLE CLAIMS .............................................. 12
5. SIDEWALK CLAIMS.......................................................... 12
D. TORT CLAIM TRENDS BY AGENCY .................................... 14
1. NEW YORK POLICE DEPARTMENT ............................... 15
2. NYC HEALTH + HOSPITALS ........................................... 18
3. DEPARTMENT OF CORRECTION .................................. 21
E. TORT CLAIM TRENDS BY BOROUGH ................................. 22
IV. LAW (NON-TORT) CLAIMS ........................................................ 23
A. OVERALL LAW CLAIM TRENDS ........................................... 23
APPENDICES
A. DESCRIPTION OF CLAIM TYPES ......................................... 30
B. LEGAL BACKGROUND .......................................................... 36
A. TOP TORT CLAIMS ADJUDICATED IN FY 2017 ................... 37
D. CHART INDEX ........................................................................ 38
E. DETAILED TABLES ................................................................ 39
ENDNOTES ..................................................................................... 40
TABLE OF CONTENTS
1 Claims Report: Fiscal Year 2017
Under the New York City Charter, the Comptroller has the power to settle and adjust all claims in favor of or against the City.1 This work is performed by the Comptroller’s Office Bureau of Law and Adjustment (BLA), composed of attorneys, claims professionals, and administrative staff under the direction of the Comptroller, General Counsel, and the Assistant Comptroller for BLA.
In FY 2017, BLA adjusted or settled 13,943 claims that ultimately resulted in authorizing total City outlays of more than $1 billion.2
For FY 2017, the City paid out $675.6 million in tort claim settlements and judgments—nearly six percent more than the $639.2 million paid out in FY 2016.3 These tort claims ranged from slip/trip and fall to medical malpractice, police action, and motor vehicle property damage claims.
The number of tort claims filed against the NYPD declined in FY 2017, but cost the City $308.2 million, the highest in City history. It is important to note, however, that a small number of cases disproportionally accounted for the total amount. In FY 2017, eleven wrongful conviction claims, representing 0.27 percent of 4,014 police cases resolved during FY 2017, settled for a total of $78.6 million, which accounted for 26 percent of the total $308.2 million in NYPD payouts.
In FY 2017, the City paid out $343.1 million in non-tort claims, or “law claims,” a ten percent decrease from the $381.1 million paid out in FY 2016. These law claims include disputes arising from City contracts, equitable claims, refund claims, City employee salary disputes, claims involving DOE special education matters, equitable claim, sidewalk assessments, and cleanup costs levied on property owners who are in violation of the Mental Hygiene Law.
In FY 2017, the City paid out $84.5 million for legacy claims that were filed before FY 2008, which includes $29.5 million paid out to four New York City firefighters and families for the death and serious injuries sustained from responding to a January 2005 fire at an apartment building in the Bronx. Excluding settlement payments on legacy claims, personal injury tort claim payouts declined from $593.1 million in FY 2016 to $591.3 million in FY 2017.
Finally, this report also includes a look-back to FY 20084 to provide a broader perspective on claim filings and settlements and judgments in order to contextualize the FY 2017 numbers.
I. EXECUTIVE SUMMARY
2 Office of the New York City Comptroller Scott M. Stringer
ClaimStat Update and Inter-Agency Partnerships
In an effort to drive down the cost of claims, in 2014, during the first year of Comptroller Stringer’s administration, the Comptroller’s Office launched ClaimStat, a data-driven analysis of claims against the City. ClaimStat was introduced to help agencies reduce claims by providing data that enables agencies to identify practices that lead to costly settlements and judgments against the City. Using ClaimStat data, the Comptroller’s Office has released agency-related updates concerning claims, including filing trends and resolved claim payouts. In addition, the Comptroller’s Office holds regularly scheduled conference calls and partners with several City agencies in order to discuss and share relevant claims data to help agencies better manage risk, implement agency best practices, and efficiently allocate City resources.
BLA holds weekly telephonic conferences and exchanges real-time data with the NYPD’s Risk Mitigation Unit to identify claim trends as early as possible. This partnership allows the Comptroller’s Office to gather evidence and information necessary to make an early assessment of the City’s exposure to certain types of claims and share relevant data with the NYPD so that they may enact policies to address practices that lead to increased exposure for the City. Currently, BLA also shares real time data and holds regularly scheduled telephonic conferences with the Department of Correction (DOC), and the Department of Sanitation (DSNY). In addition, BLA shares data with Department of Environmental Protection (DEP), Department of Citywide Administrative Services (DCAS), and Department of Transportation (DOT) on a limited basis. The Comptroller’s Office is continually working to expand coordinated efforts to mitigate risk and to implement best practices.
Recovery Program Update
The Comptroller’s Office partners with the Human Resources Administration—particularly with the Office of Child Support Enforcement (OCSE)—to collect reimbursements for public assistance and Medicaid benefits, as well as child support obligations, from claimants who receive settlement payouts from the City. The Comptroller’s Office and the OCSE successfully automated the process to ensure that outstanding payments are processed and collected properly. The Comptroller’s Office also works with the New York City Department of Finance to collect offsets, including unpaid parking tickets, against claimants who reach a settlement with the City. In FY 2017, BLA collected $8.3 million from claimants with outstanding obligations to the City or with child support orders in arrears compared to $7.3 million in FY 2016.
II. OVERVIEW OF THE COMPTROLLER’S INITIATIVES TO MANAGE RISK AND IMPLEMENT BEST PRACTICES
3 Claims Report: Fiscal Year 2017
Damage to the City (Pre-Litigation)
The Comptroller’s Office initiates affirmative claims to collect money from individuals who have damaged City property. Most of these claims involve damage to City-owned motor vehicles and City infrastructure. BLA’s efforts in asserting these claims on behalf of the City resulted in the collection of $1.9 million in FY 2017.
Son of Sam Law (New York State Executive Law § 632-a)
The New York State Son of Sam Law permits a crime victim to commence a civil action to recover money damages for “profits from a crime” or the “funds of a convicted person.”5 Under the law, the Comptroller’s Office must report to the New York State Office of Victim Services (Victim Services) any City settlement obligation to a convicted person that exceeds $10,000. BLA automated its process to identify claims that should be reported and works closely with Victim Services and the New York State Attorney General’s Office to help identify funds in excess of $10,000 awarded to convicted persons from whom victims can recover money. In FY 2017, the City paid $372,000 to crime victims who recovered from claim settlements under the Son of Sam Law. With this FY 2017 payment of $372,000, a total of $658,000 has been paid to crime victims from New York City settlements since FY 2011 under the New York State Son of Sam Law.
Payments for Personal Injury Tort Claims That Were Filed Before 2008
New Yorkers continue to pay for claims that were filed more than a decade ago. In FY 2017, the City paid out $84.5 million for claims that were filed prior to FY 2008, including $29.5 million paid out to five New York City firefighters and families for the death and serious injuries sustained from responding to a January 2005 fire at an apartment building in the Bronx.
III. LEGACY CLAIMS
4 Office of the New York City Comptroller Scott M. Stringer
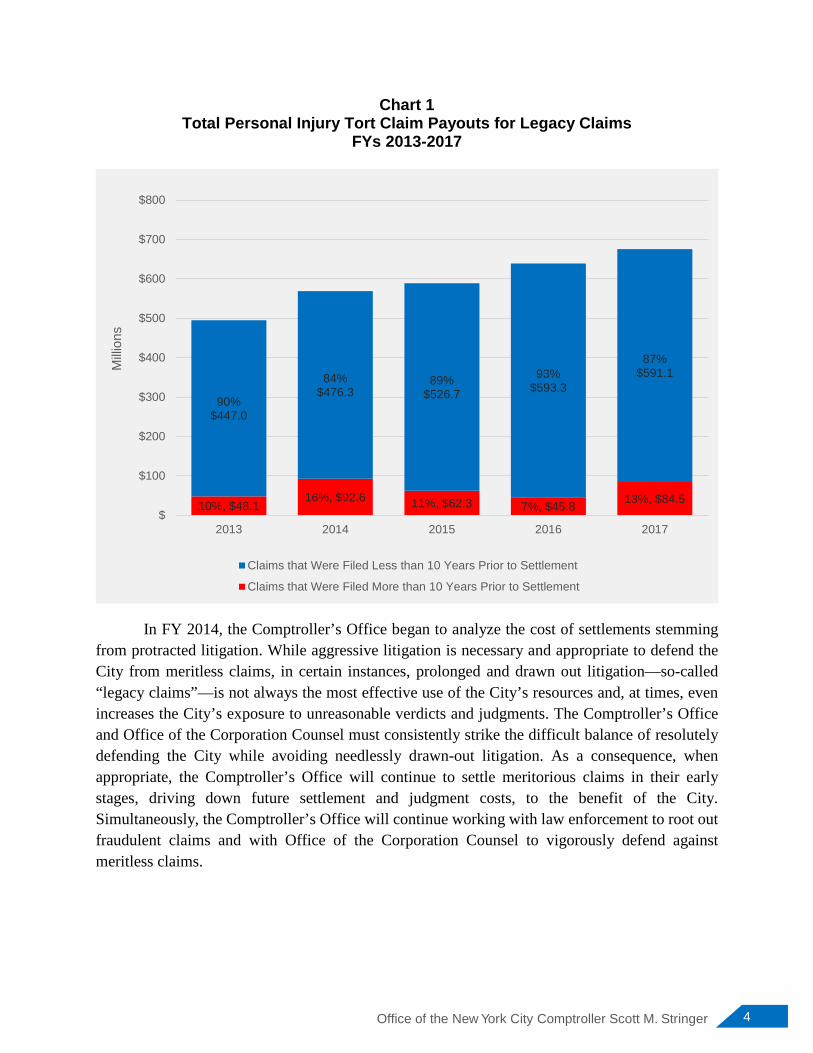
Chart 1 Total Personal Injury Tort Claim Payouts for Legacy Claims
FYs 2013-2017
In FY 2014, the Comptroller’s Office began to analyze the cost of settlements stemming from protracted litigation. While aggressive litigation is necessary and appropriate to defend the City from meritless claims, in certain instances, prolonged and drawn out litigation—so-called “legacy claims”—is not always the most effective use of the City’s resources and, at times, even increases the City’s exposure to unreasonable verdicts and judgments. The Comptroller’s Office and Office of the Corporation Counsel must consistently strike the difficult balance of resolutely defending the City while avoiding needlessly drawn-out litigation. As a consequence, when appropriate, the Comptroller’s Office will continue to settle meritorious claims in their early stages, driving down future settlement and judgment costs, to the benefit of the City. Simultaneously, the Comptroller’s Office will continue working with law enforcement to root out fraudulent claims and with Office of the Corporation Counsel to vigorously defend against meritless claims.
10%, $48.116%, $92.6 11%, $62.3 7%, $45.8 13%, $84.5
90%$447.0
84%$476.3
89%$526.7
93%$593.3
87%$591.1
$
$100
$200
$300
$400
$500
$600
$700
$800
2013 2014 2015 2016 2017
Milli
ons
Claims that Were Filed Less than 10 Years Prior to Settlement
Claims that Were Filed More than 10 Years Prior to Settlement
5 Claims Report: Fiscal Year 2017
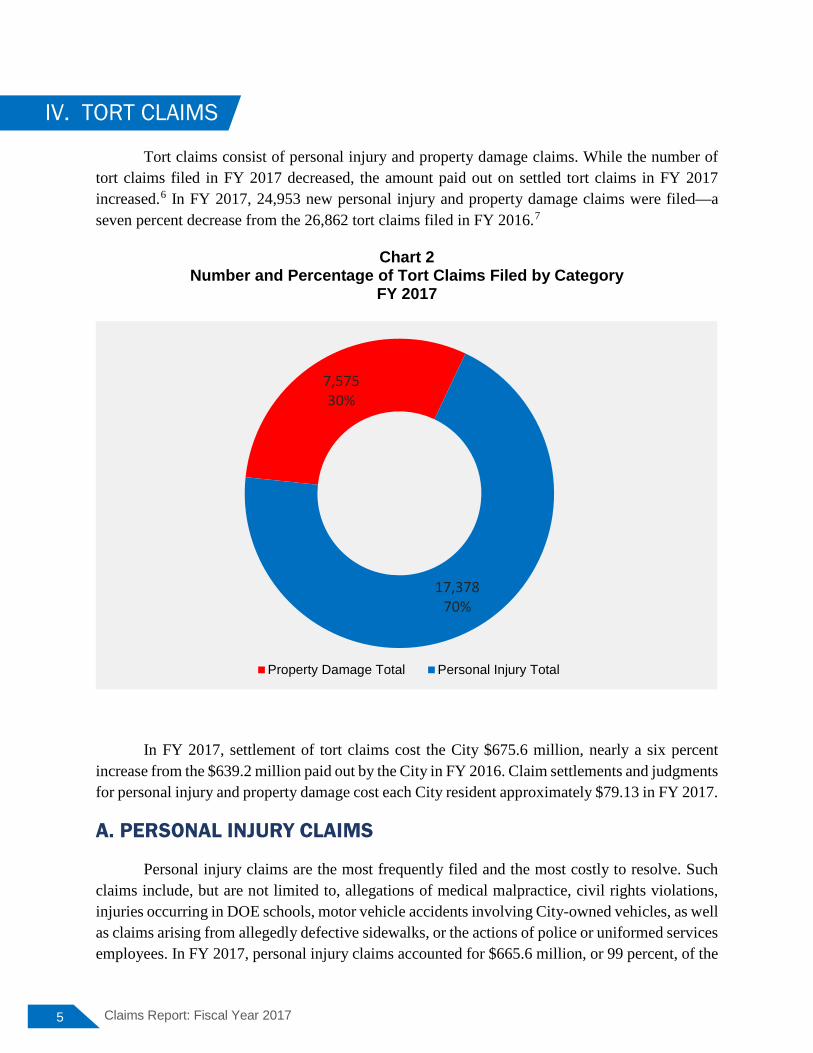
Tort claims consist of personal injury and property damage claims. While the number of tort claims filed in FY 2017 decreased, the amount paid out on settled tort claims in FY 2017 increased.6 In FY 2017, 24,953 new personal injury and property damage claims were filed—a seven percent decrease from the 26,862 tort claims filed in FY 2016.7
Chart 2 Number and Percentage of Tort Claims Filed by Category
FY 2017
In FY 2017, settlement of tort claims cost the City $675.6 million, nearly a six percent increase from the $639.2 million paid out by the City in FY 2016. Claim settlements and judgments for personal injury and property damage cost each City resident approximately $79.13 in FY 2017.
A. PERSONAL INJURY CLAIMS
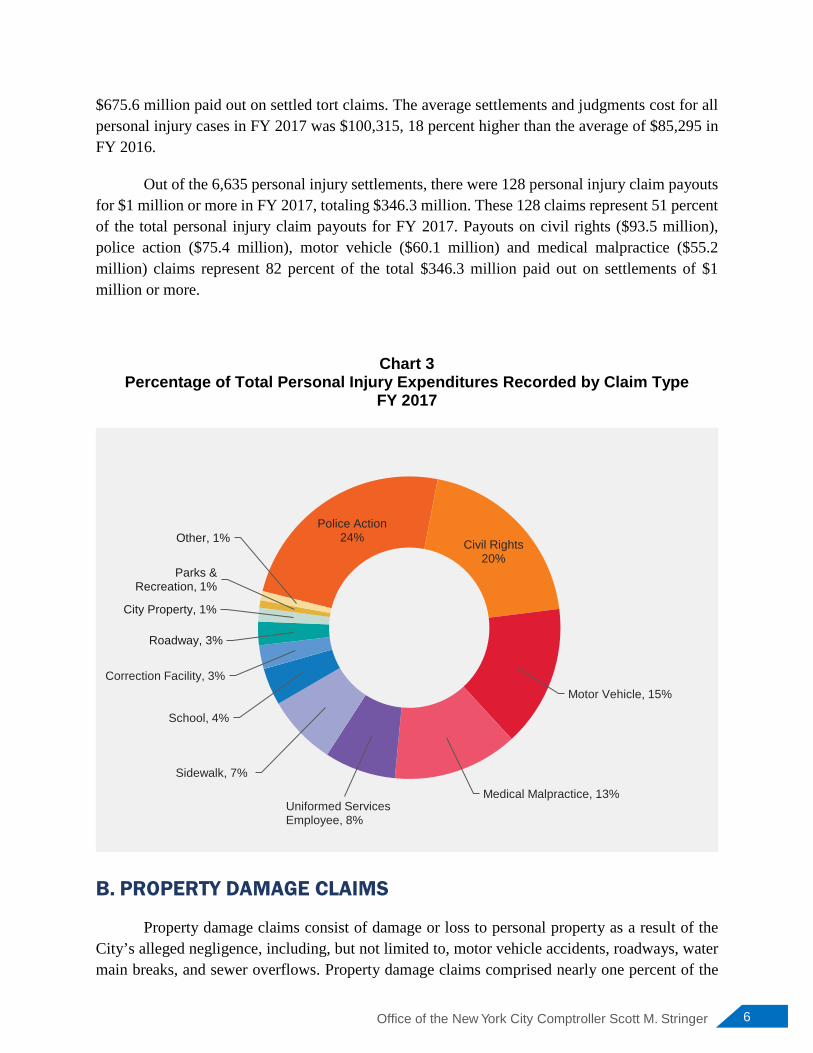
Personal injury claims are the most frequently filed and the most costly to resolve. Such claims include, but are not limited to, allegations of medical malpractice, civil rights violations, injuries occurring in DOE schools, motor vehicle accidents involving City-owned vehicles, as well as claims arising from allegedly defective sidewalks, or the actions of police or uniformed services employees. In FY 2017, personal injury claims accounted for $665.6 million, or 99 percent, of the
7,57530%
17,37870%
Property Damage Total Personal Injury Total
IV. TORT CLAIMS
6 Office of the New York City Comptroller Scott M. Stringer
$675.6 million paid out on settled tort claims. The average settlements and judgments cost for all personal injury cases in FY 2017 was $100,315, 18 percent higher than the average of $85,295 in FY 2016.
Out of the 6,635 personal injury settlements, there were 128 personal injury claim payouts for $1 million or more in FY 2017, totaling $346.3 million. These 128 claims represent 51 percent of the total personal injury claim payouts for FY 2017. Payouts on civil rights ($93.5 million), police action ($75.4 million), motor vehicle ($60.1 million) and medical malpractice ($55.2 million) claims represent 82 percent of the total $346.3 million paid out on settlements of $1 million or more.
Chart 3 Percentage of Total Personal Injury Expenditures Recorded by Claim Type
FY 2017
B. PROPERTY DAMAGE CLAIMS
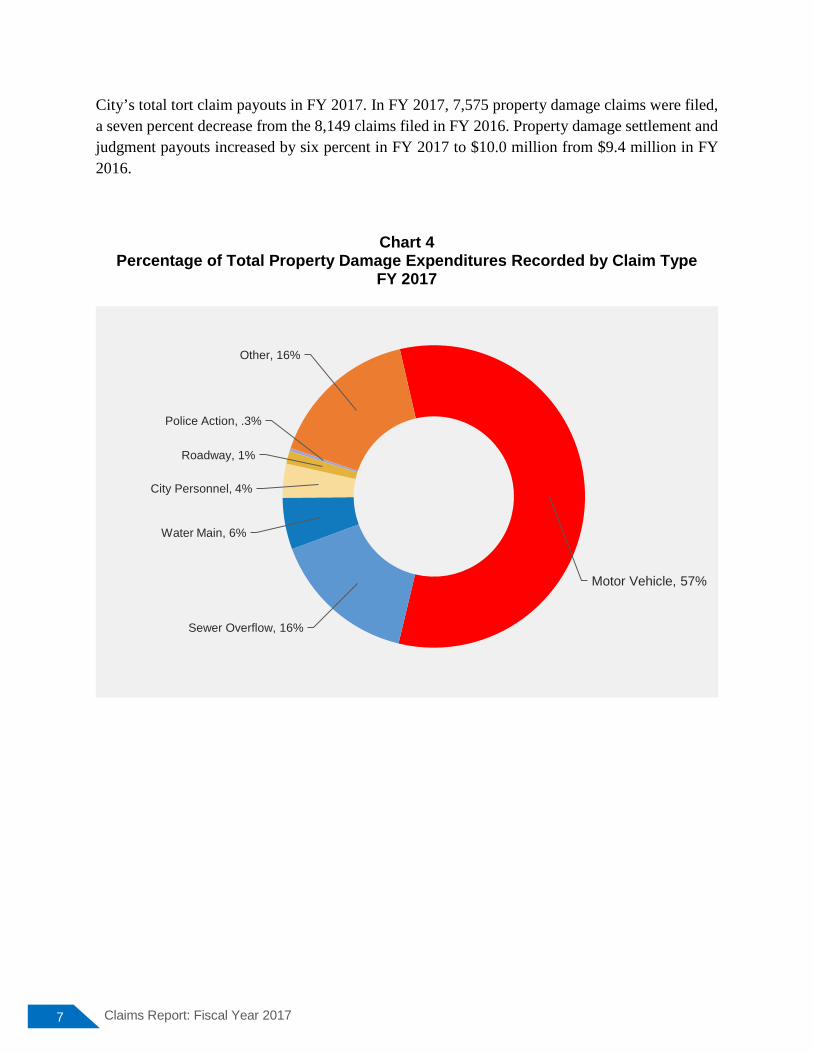
Property damage claims consist of damage or loss to personal property as a result of the City’s alleged negligence, including, but not limited to, motor vehicle accidents, roadways, water main breaks, and sewer overflows. Property damage claims comprised nearly one percent of the
Police Action24% Civil Rights
20%
Motor Vehicle, 15%
Medical Malpractice, 13%Uniformed Services Employee, 8%
Sidewalk, 7%
School, 4%
Correction Facility, 3%
Roadway, 3%
City Property, 1%
Parks & Recreation, 1%
Other, 1%
7 Claims Report: Fiscal Year 2017
City’s total tort claim payouts in FY 2017. In FY 2017, 7,575 property damage claims were filed, a seven percent decrease from the 8,149 claims filed in FY 2016. Property damage settlement and judgment payouts increased by six percent in FY 2017 to $10.0 million from $9.4 million in FY 2016.
Chart 4 Percentage of Total Property Damage Expenditures Recorded by Claim Type
FY 2017
Motor Vehicle, 57%
Sewer Overflow, 16%
Water Main, 6%
City Personnel, 4%
Roadway, 1%
Police Action, .3%
Other, 16%
8 Office of the New York City Comptroller Scott M. Stringer
C. TORT CLAIM TRENDS BY CLAIM TYPE
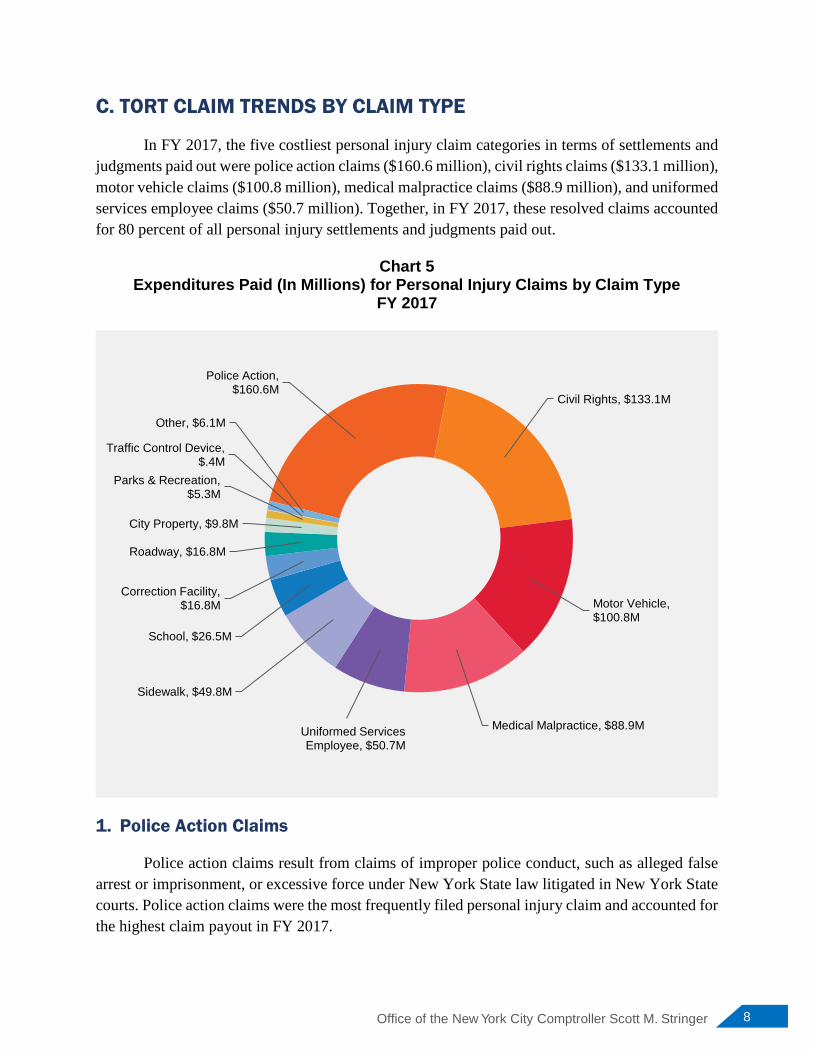
In FY 2017, the five costliest personal injury claim categories in terms of settlements and judgments paid out were police action claims ($160.6 million), civil rights claims ($133.1 million), motor vehicle claims ($100.8 million), medical malpractice claims ($88.9 million), and uniformed services employee claims ($50.7 million). Together, in FY 2017, these resolved claims accounted for 80 percent of all personal injury settlements and judgments paid out.
Chart 5 Expenditures Paid (In Millions) for Personal Injury Claims by Claim Type
FY 2017
1. Police Action Claims
Police action claims result from claims of improper police conduct, such as alleged false arrest or imprisonment, or excessive force under New York State law litigated in New York State courts. Police action claims were the most frequently filed personal injury claim and accounted for the highest claim payout in FY 2017.
Police Action, $160.6M
Civil Rights, $133.1M
Motor Vehicle, $100.8M
Medical Malpractice, $88.9MUniformed Services Employee, $50.7M
Sidewalk, $49.8M
School, $26.5M
Correction Facility,$16.8M
Roadway, $16.8M
City Property, $9.8M
Parks & Recreation, $5.3M
Traffic Control Device, $.4M
Other, $6.1M
9 Claims Report: Fiscal Year 2017
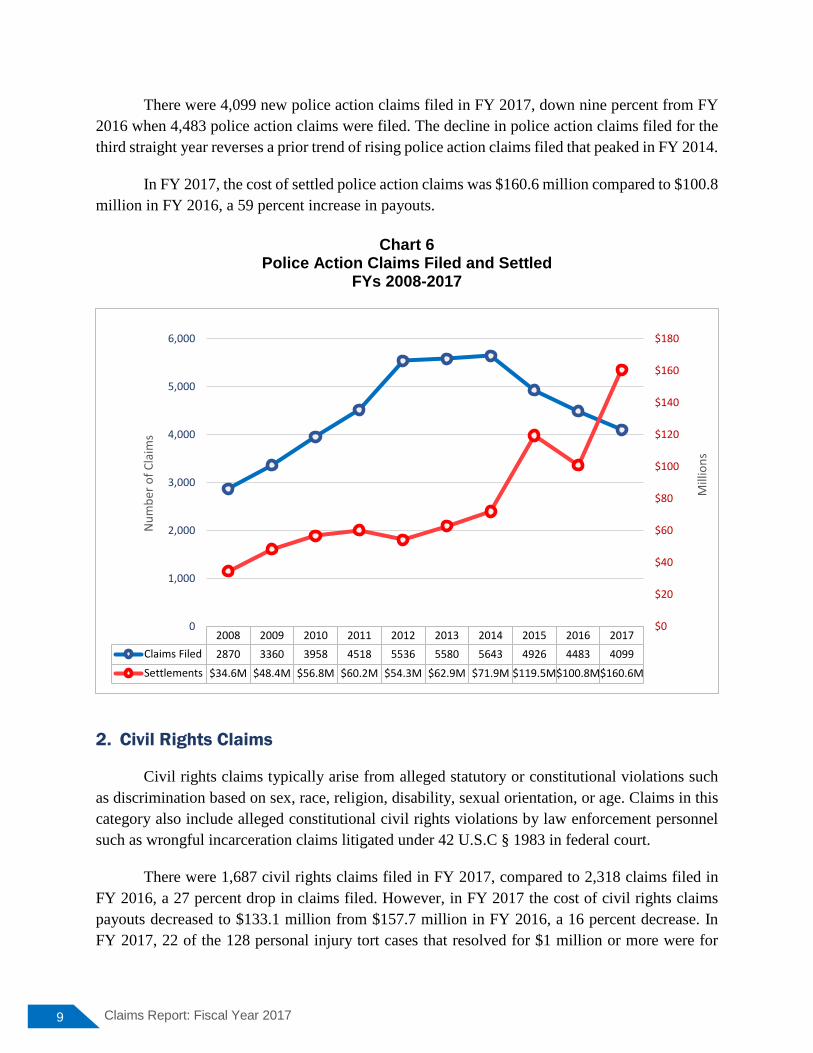
There were 4,099 new police action claims filed in FY 2017, down nine percent from FY 2016 when 4,483 police action claims were filed. The decline in police action claims filed for the third straight year reverses a prior trend of rising police action claims filed that peaked in FY 2014.
In FY 2017, the cost of settled police action claims was $160.6 million compared to $100.8 million in FY 2016, a 59 percent increase in payouts.
Chart 6
Police Action Claims Filed and Settled FYs 2008-2017
2. Civil Rights Claims
Civil rights claims typically arise from alleged statutory or constitutional violations such as discrimination based on sex, race, religion, disability, sexual orientation, or age. Claims in this category also include alleged constitutional civil rights violations by law enforcement personnel such as wrongful incarceration claims litigated under 42 U.S.C § 1983 in federal court.
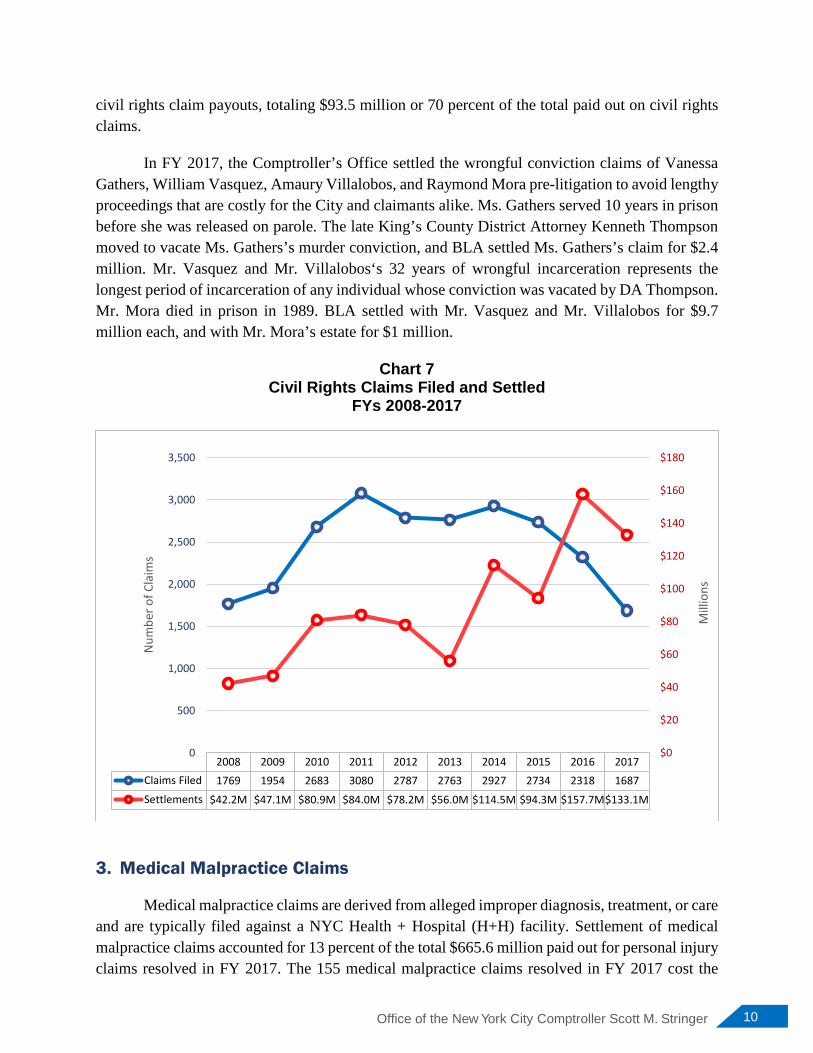
There were 1,687 civil rights claims filed in FY 2017, compared to 2,318 claims filed in FY 2016, a 27 percent drop in claims filed. However, in FY 2017 the cost of civil rights claims payouts decreased to $133.1 million from $157.7 million in FY 2016, a 16 percent decrease. In FY 2017, 22 of the 128 personal injury tort cases that resolved for $1 million or more were for
2008 2009 2010 2011 2012 2013 2014 2015 2016 2017Claims Filed 2870 3360 3958 4518 5536 5580 5643 4926 4483 4099Settlements $34.6M $48.4M $56.8M $60.2M $54.3M $62.9M $71.9M $119.5M$100.8M$160.6M
$0
$20
$40
$60
$80
$100
$120
$140
$160
$180
0
1,000
2,000
3,000
4,000
5,000
6,000
Mill
ions
Num
ber o
f Cla
ims
10 Office of the New York City Comptroller Scott M. Stringer
civil rights claim payouts, totaling $93.5 million or 70 percent of the total paid out on civil rights claims.
In FY 2017, the Comptroller’s Office settled the wrongful conviction claims of Vanessa Gathers, William Vasquez, Amaury Villalobos, and Raymond Mora pre-litigation to avoid lengthy proceedings that are costly for the City and claimants alike. Ms. Gathers served 10 years in prison before she was released on parole. The late King’s County District Attorney Kenneth Thompson moved to vacate Ms. Gathers’s murder conviction, and BLA settled Ms. Gathers’s claim for $2.4 million. Mr. Vasquez and Mr. Villalobos‘s 32 years of wrongful incarceration represents the longest period of incarceration of any individual whose conviction was vacated by DA Thompson. Mr. Mora died in prison in 1989. BLA settled with Mr. Vasquez and Mr. Villalobos for $9.7 million each, and with Mr. Mora’s estate for $1 million.
Chart 7 Civil Rights Claims Filed and Settled
FYs 2008-2017
3. Medical Malpractice Claims
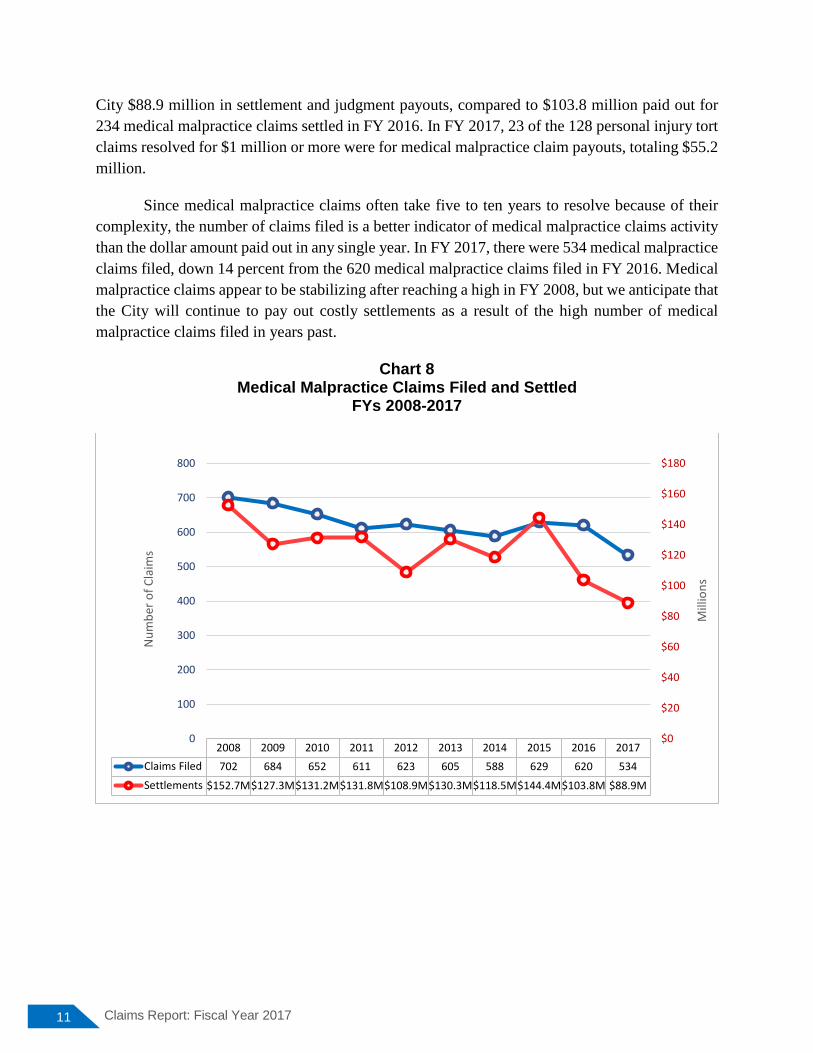
Medical malpractice claims are derived from alleged improper diagnosis, treatment, or care and are typically filed against a NYC Health + Hospital (H+H) facility. Settlement of medical malpractice claims accounted for 13 percent of the total $665.6 million paid out for personal injury claims resolved in FY 2017. The 155 medical malpractice claims resolved in FY 2017 cost the
2008 2009 2010 2011 2012 2013 2014 2015 2016 2017Claims Filed 1769 1954 2683 3080 2787 2763 2927 2734 2318 1687Settlements $42.2M $47.1M $80.9M $84.0M $78.2M $56.0M $114.5M $94.3M $157.7M$133.1M
$0
$20
$40
$60
$80
$100
$120
$140
$160
$180
0
500
1,000
1,500
2,000
2,500
3,000
3,500
Mill
ions
Num
ber o
f Cla
ims
11 Claims Report: Fiscal Year 2017
City $88.9 million in settlement and judgment payouts, compared to $103.8 million paid out for 234 medical malpractice claims settled in FY 2016. In FY 2017, 23 of the 128 personal injury tort claims resolved for $1 million or more were for medical malpractice claim payouts, totaling $55.2 million.
Since medical malpractice claims often take five to ten years to resolve because of their complexity, the number of claims filed is a better indicator of medical malpractice claims activity than the dollar amount paid out in any single year. In FY 2017, there were 534 medical malpractice claims filed, down 14 percent from the 620 medical malpractice claims filed in FY 2016. Medical malpractice claims appear to be stabilizing after reaching a high in FY 2008, but we anticipate that the City will continue to pay out costly settlements as a result of the high number of medical malpractice claims filed in years past.
Chart 8 Medical Malpractice Claims Filed and Settled
FYs 2008-2017
2008 2009 2010 2011 2012 2013 2014 2015 2016 2017Claims Filed 702 684 652 611 623 605 588 629 620 534Settlements $152.7M$127.3M$131.2M$131.8M$108.9M$130.3M$118.5M$144.4M$103.8M $88.9M
$0
$20
$40
$60
$80
$100
$120
$140
$160
$180
0
100
200
300
400
500
600
700
800
Mill
ions
Num
ber o
f Cla
ims
12 Office of the New York City Comptroller Scott M. Stringer
4. Motor Vehicle Claims
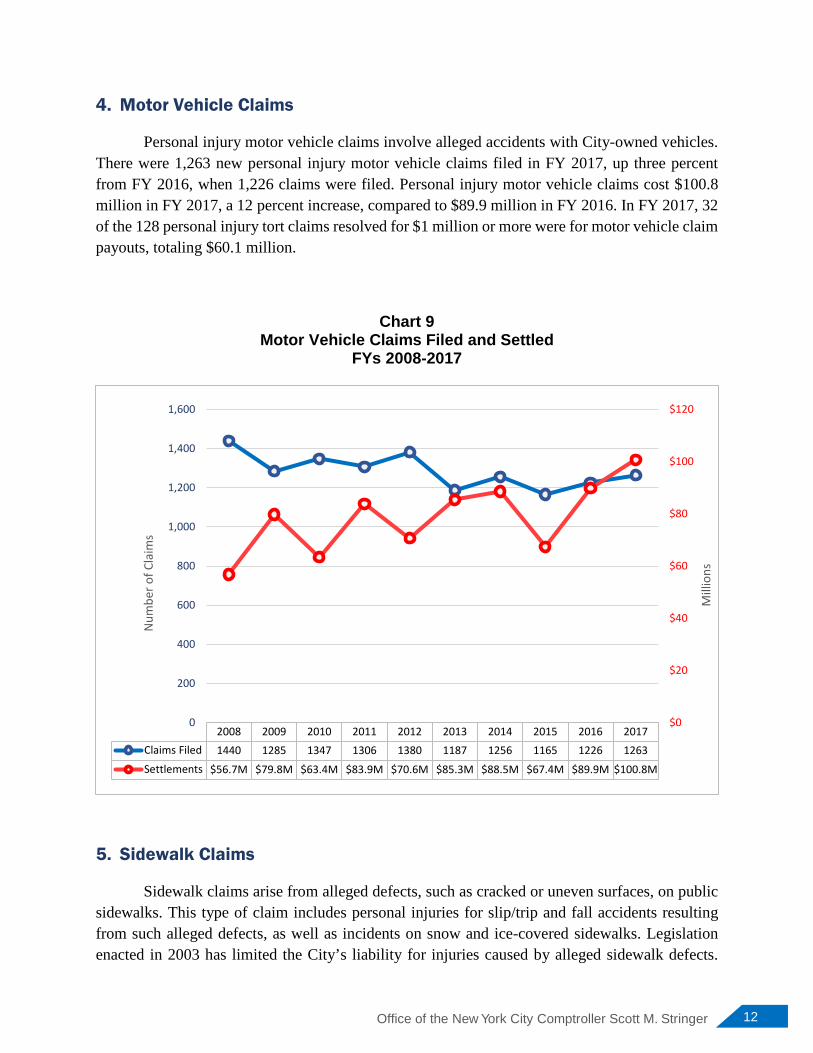
Personal injury motor vehicle claims involve alleged accidents with City-owned vehicles. There were 1,263 new personal injury motor vehicle claims filed in FY 2017, up three percent from FY 2016, when 1,226 claims were filed. Personal injury motor vehicle claims cost $100.8 million in FY 2017, a 12 percent increase, compared to $89.9 million in FY 2016. In FY 2017, 32 of the 128 personal injury tort claims resolved for $1 million or more were for motor vehicle claim payouts, totaling $60.1 million.
Chart 9 Motor Vehicle Claims Filed and Settled
FYs 2008-2017
5. Sidewalk Claims
Sidewalk claims arise from alleged defects, such as cracked or uneven surfaces, on public sidewalks. This type of claim includes personal injuries for slip/trip and fall accidents resulting from such alleged defects, as well as incidents on snow and ice-covered sidewalks. Legislation enacted in 2003 has limited the City’s liability for injuries caused by alleged sidewalk defects.
2008 2009 2010 2011 2012 2013 2014 2015 2016 2017Claims Filed 1440 1285 1347 1306 1380 1187 1256 1165 1226 1263Settlements $56.7M $79.8M $63.4M $83.9M $70.6M $85.3M $88.5M $67.4M $89.9M $100.8M
$0
$20
$40
$60
$80
$100
$120
0
200
400
600
800
1,000
1,200
1,400
1,600
Mill
ions
Num
ber o
f Cla
ims
13 Claims Report: Fiscal Year 2017
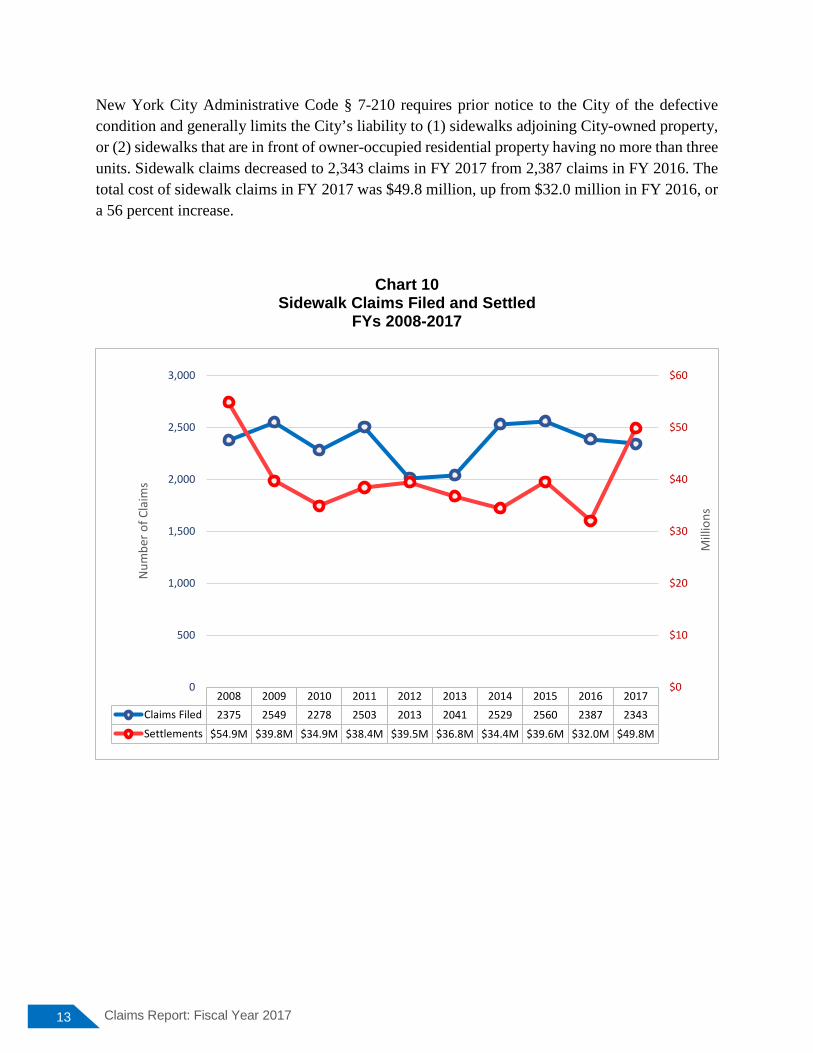
New York City Administrative Code § 7-210 requires prior notice to the City of the defective condition and generally limits the City’s liability to (1) sidewalks adjoining City-owned property, or (2) sidewalks that are in front of owner-occupied residential property having no more than three units. Sidewalk claims decreased to 2,343 claims in FY 2017 from 2,387 claims in FY 2016. The total cost of sidewalk claims in FY 2017 was $49.8 million, up from $32.0 million in FY 2016, or a 56 percent increase.
Chart 10 Sidewalk Claims Filed and Settled
FYs 2008-2017
2008 2009 2010 2011 2012 2013 2014 2015 2016 2017Claims Filed 2375 2549 2278 2503 2013 2041 2529 2560 2387 2343Settlements $54.9M $39.8M $34.9M $38.4M $39.5M $36.8M $34.4M $39.6M $32.0M $49.8M
$0
$10
$20
$30
$40
$50
$60
0
500
1,000
1,500
2,000
2,500
3,000
Mill
ions
Num
ber o
f Cla
ims
14 Office of the New York City Comptroller Scott M. Stringer
D. TORT CLAIM TRENDS BY AGENCY
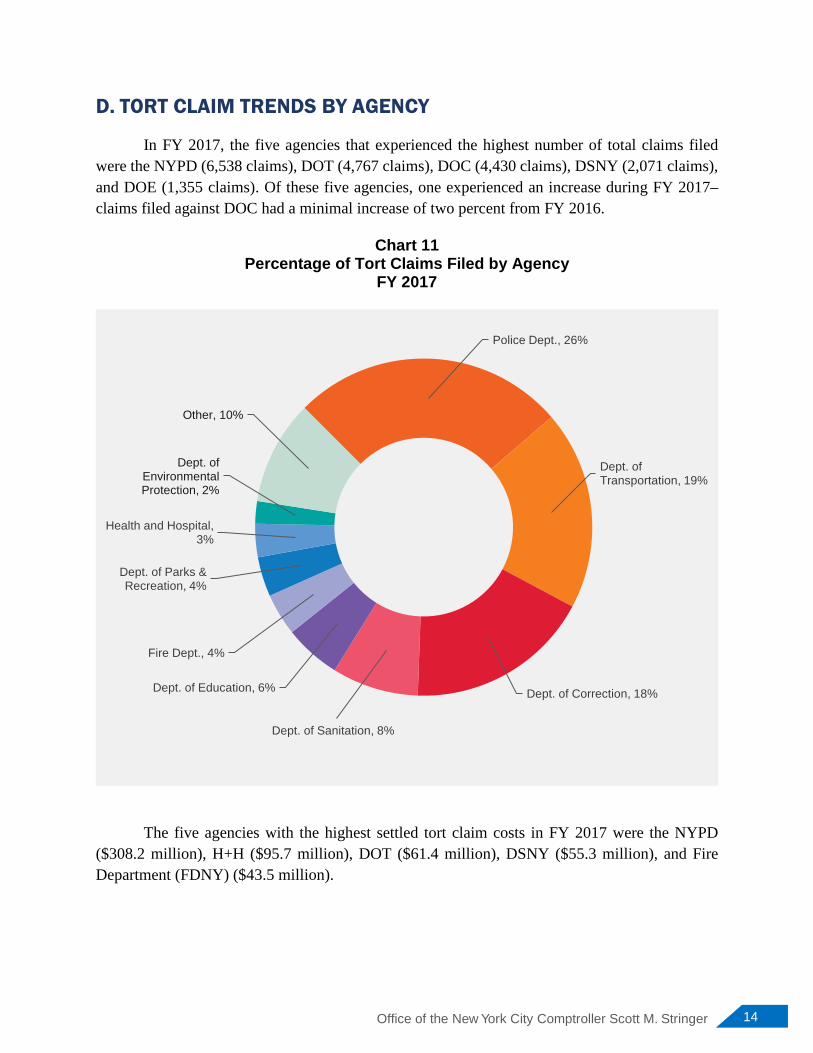
In FY 2017, the five agencies that experienced the highest number of total claims filed were the NYPD (6,538 claims), DOT (4,767 claims), DOC (4,430 claims), DSNY (2,071 claims), and DOE (1,355 claims). Of these five agencies, one experienced an increase during FY 2017–claims filed against DOC had a minimal increase of two percent from FY 2016.
Chart 11 Percentage of Tort Claims Filed by Agency
FY 2017
The five agencies with the highest settled tort claim costs in FY 2017 were the NYPD
($308.2 million), H+H ($95.7 million), DOT ($61.4 million), DSNY ($55.3 million), and Fire Department (FDNY) ($43.5 million).
Police Dept., 26%
Dept. of Transportation, 19%
Dept. of Correction, 18%
Dept. of Sanitation, 8%
Dept. of Education, 6%
Fire Dept., 4%
Dept. of Parks & Recreation, 4%
Health and Hospital, 3%
Dept. of Environmental Protection, 2%
Other, 10%
15 Claims Report: Fiscal Year 2017
1. New York Police Department
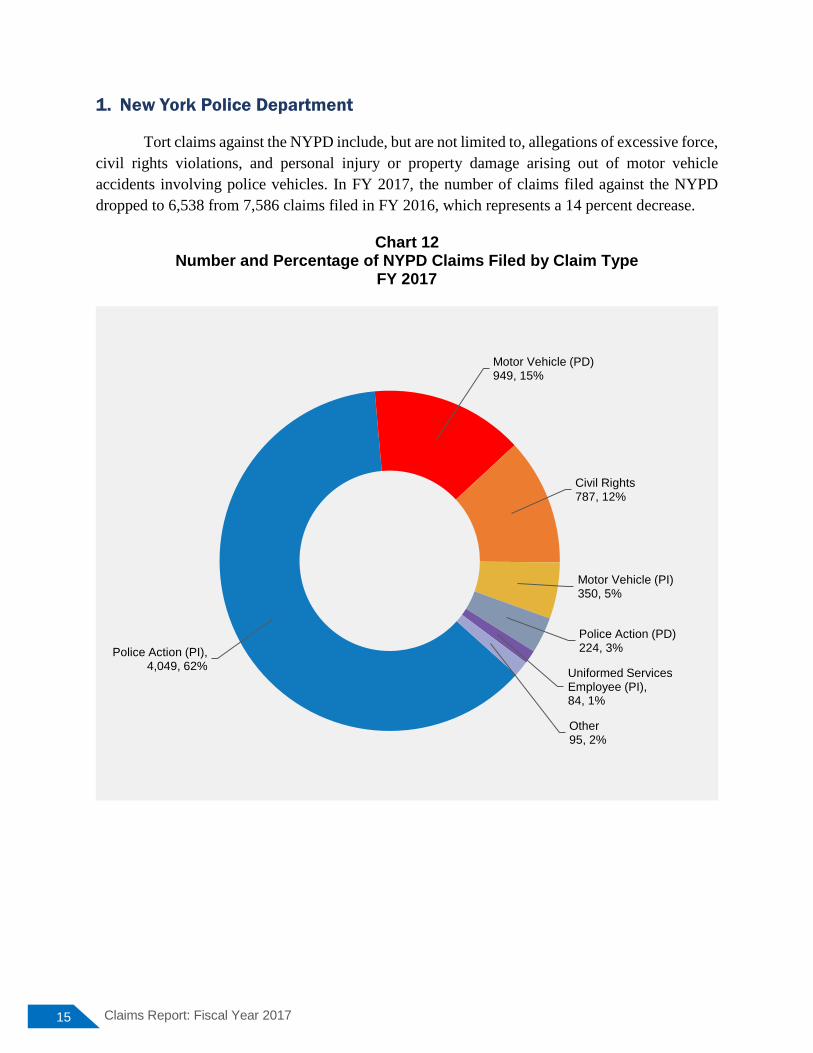
Tort claims against the NYPD include, but are not limited to, allegations of excessive force, civil rights violations, and personal injury or property damage arising out of motor vehicle accidents involving police vehicles. In FY 2017, the number of claims filed against the NYPD dropped to 6,538 from 7,586 claims filed in FY 2016, which represents a 14 percent decrease.
Chart 12 Number and Percentage of NYPD Claims Filed by Claim Type
FY 2017
Police Action (PI),4,049, 62%
Motor Vehicle (PD)949, 15%
Civil Rights787, 12%
Motor Vehicle (PI)350, 5%
Police Action (PD)224, 3%
Uniformed Services Employee (PI), 84, 1%
Other95, 2%
16 Office of the New York City Comptroller Scott M. Stringer
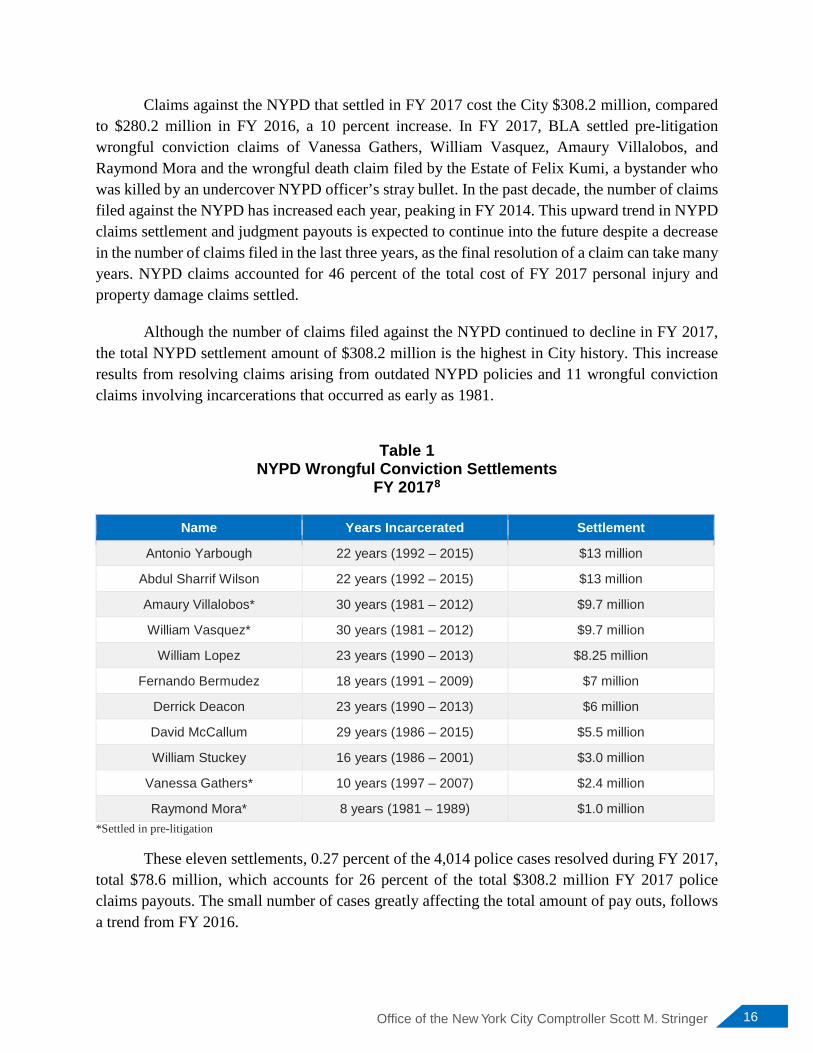
Claims against the NYPD that settled in FY 2017 cost the City $308.2 million, compared to $280.2 million in FY 2016, a 10 percent increase. In FY 2017, BLA settled pre-litigation wrongful conviction claims of Vanessa Gathers, William Vasquez, Amaury Villalobos, and Raymond Mora and the wrongful death claim filed by the Estate of Felix Kumi, a bystander who was killed by an undercover NYPD officer’s stray bullet. In the past decade, the number of claims filed against the NYPD has increased each year, peaking in FY 2014. This upward trend in NYPD claims settlement and judgment payouts is expected to continue into the future despite a decrease in the number of claims filed in the last three years, as the final resolution of a claim can take many years. NYPD claims accounted for 46 percent of the total cost of FY 2017 personal injury and property damage claims settled.
Although the number of claims filed against the NYPD continued to decline in FY 2017, the total NYPD settlement amount of $308.2 million is the highest in City history. This increase results from resolving claims arising from outdated NYPD policies and 11 wrongful conviction claims involving incarcerations that occurred as early as 1981.
Table 1
NYPD Wrongful Conviction Settlements FY 20178
Name Years Incarcerated Settlement
Antonio Yarbough 22 years (1992 – 2015) $13 million
Abdul Sharrif Wilson 22 years (1992 – 2015) $13 million
Amaury Villalobos* 30 years (1981 – 2012) $9.7 million
William Vasquez* 30 years (1981 – 2012) $9.7 million
William Lopez 23 years (1990 – 2013) $8.25 million
Fernando Bermudez 18 years (1991 – 2009) $7 million
Derrick Deacon 23 years (1990 – 2013) $6 million
David McCallum 29 years (1986 – 2015) $5.5 million
William Stuckey 16 years (1986 – 2001) $3.0 million
Vanessa Gathers* 10 years (1997 – 2007) $2.4 million
Raymond Mora* 8 years (1981 – 1989) $1.0 million *Settled in pre-litigation
These eleven settlements, 0.27 percent of the 4,014 police cases resolved during FY 2017, total $78.6 million, which accounts for 26 percent of the total $308.2 million FY 2017 police claims payouts. The small number of cases greatly affecting the total amount of pay outs, follows a trend from FY 2016.
17 Claims Report: Fiscal Year 2017
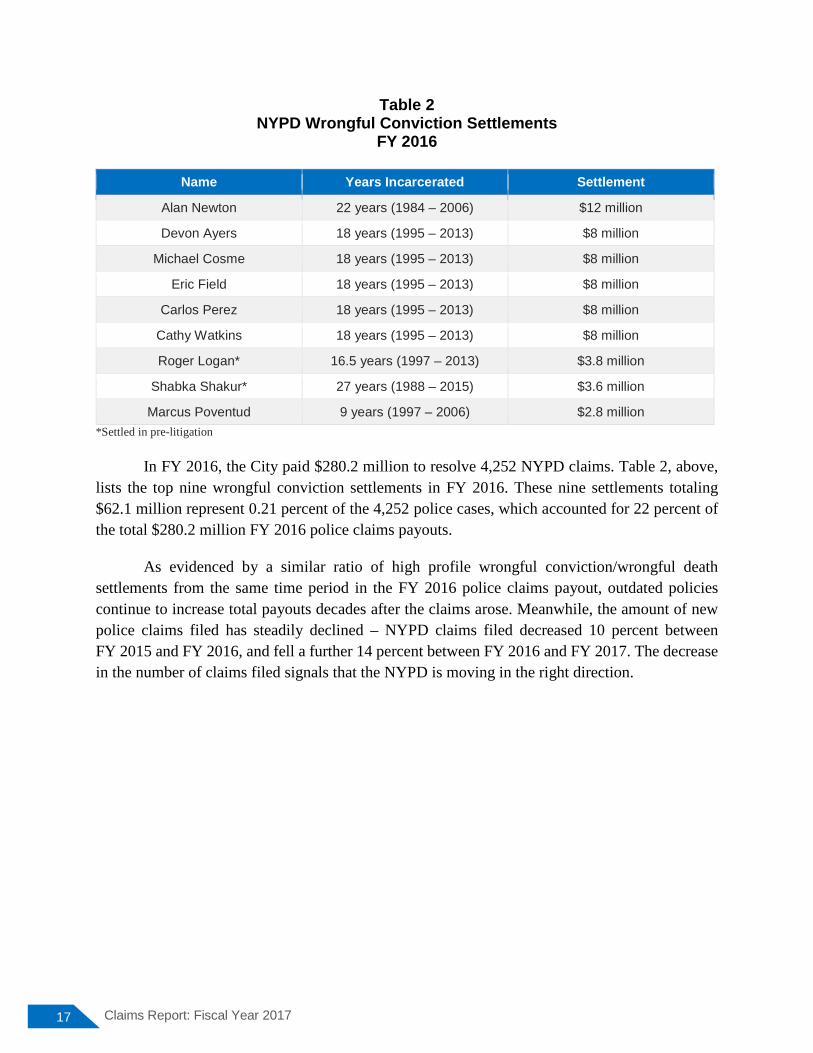
Table 2 NYPD Wrongful Conviction Settlements
FY 2016
Name Years Incarcerated Settlement
Alan Newton 22 years (1984 – 2006) $12 million
Devon Ayers 18 years (1995 – 2013) $8 million
Michael Cosme 18 years (1995 – 2013) $8 million
Eric Field 18 years (1995 – 2013) $8 million
Carlos Perez 18 years (1995 – 2013) $8 million
Cathy Watkins 18 years (1995 – 2013) $8 million
Roger Logan* 16.5 years (1997 – 2013) $3.8 million
Shabka Shakur* 27 years (1988 – 2015) $3.6 million
Marcus Poventud 9 years (1997 – 2006) $2.8 million *Settled in pre-litigation
In FY 2016, the City paid $280.2 million to resolve 4,252 NYPD claims. Table 2, above,
lists the top nine wrongful conviction settlements in FY 2016. These nine settlements totaling $62.1 million represent 0.21 percent of the 4,252 police cases, which accounted for 22 percent of the total $280.2 million FY 2016 police claims payouts.
As evidenced by a similar ratio of high profile wrongful conviction/wrongful death settlements from the same time period in the FY 2016 police claims payout, outdated policies continue to increase total payouts decades after the claims arose. Meanwhile, the amount of new police claims filed has steadily declined – NYPD claims filed decreased 10 percent between FY 2015 and FY 2016, and fell a further 14 percent between FY 2016 and FY 2017. The decrease in the number of claims filed signals that the NYPD is moving in the right direction.
18 Office of the New York City Comptroller Scott M. Stringer
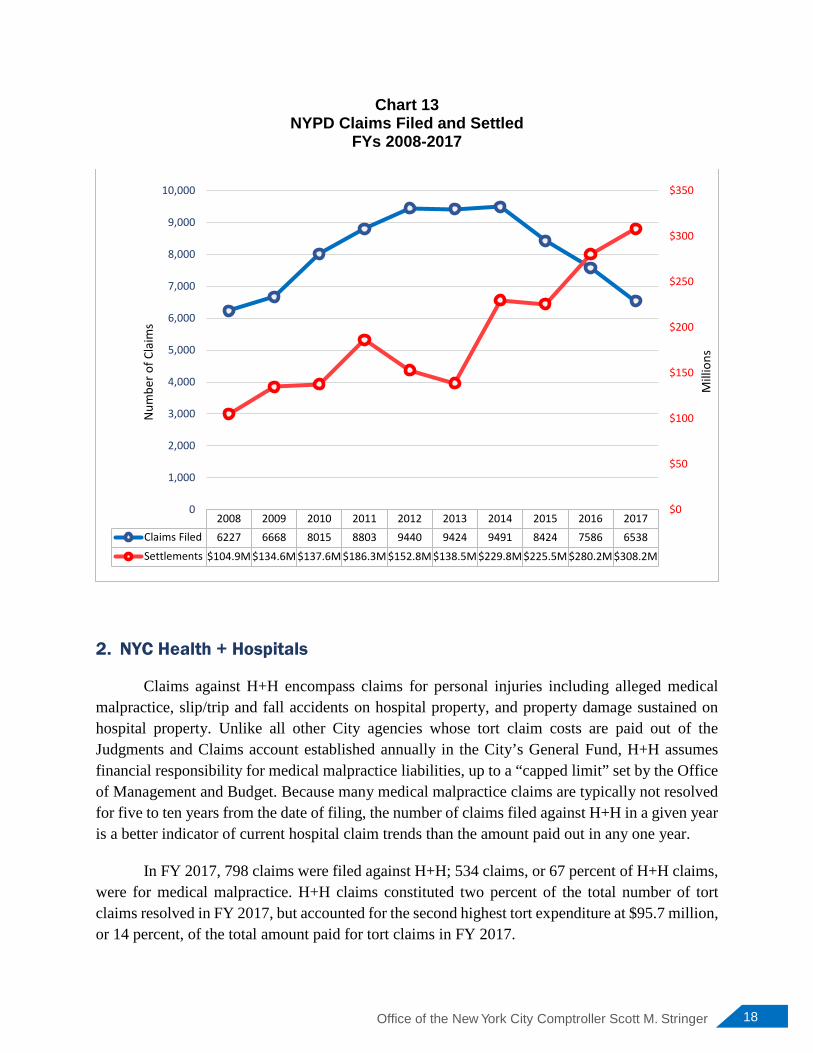
Chart 13 NYPD Claims Filed and Settled
FYs 2008-2017
2. NYC Health + Hospitals
Claims against H+H encompass claims for personal injuries including alleged medical malpractice, slip/trip and fall accidents on hospital property, and property damage sustained on hospital property. Unlike all other City agencies whose tort claim costs are paid out of the Judgments and Claims account established annually in the City’s General Fund, H+H assumes financial responsibility for medical malpractice liabilities, up to a “capped limit” set by the Office of Management and Budget. Because many medical malpractice claims are typically not resolved for five to ten years from the date of filing, the number of claims filed against H+H in a given year is a better indicator of current hospital claim trends than the amount paid out in any one year.
In FY 2017, 798 claims were filed against H+H; 534 claims, or 67 percent of H+H claims, were for medical malpractice. H+H claims constituted two percent of the total number of tort claims resolved in FY 2017, but accounted for the second highest tort expenditure at $95.7 million, or 14 percent, of the total amount paid for tort claims in FY 2017.
2008 2009 2010 2011 2012 2013 2014 2015 2016 2017Claims Filed 6227 6668 8015 8803 9440 9424 9491 8424 7586 6538Settlements $104.9M $134.6M $137.6M $186.3M $152.8M $138.5M $229.8M $225.5M $280.2M $308.2M
$0
$50
$100
$150
$200
$250
$300
$350
0
1,000
2,000
3,000
4,000
5,000
6,000
7,000
8,000
9,000
10,000
Mill
ions
Num
ber o
f Cla
ims
19 Claims Report: Fiscal Year 2017
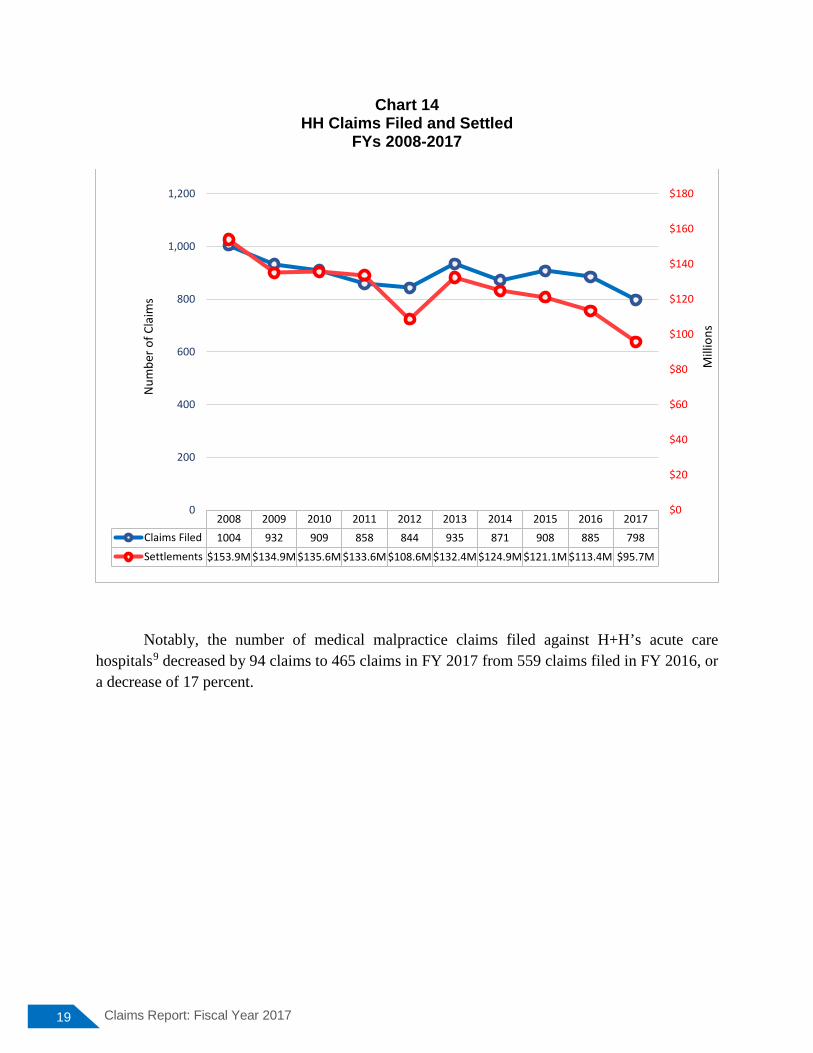
Chart 14 HH Claims Filed and Settled
FYs 2008-2017
Notably, the number of medical malpractice claims filed against H+H’s acute care hospitals9 decreased by 94 claims to 465 claims in FY 2017 from 559 claims filed in FY 2016, or a decrease of 17 percent.
2008 2009 2010 2011 2012 2013 2014 2015 2016 2017Claims Filed 1004 932 909 858 844 935 871 908 885 798Settlements $153.9M $134.9M $135.6M $133.6M $108.6M $132.4M $124.9M $121.1M $113.4M $95.7M
$0
$20
$40
$60
$80
$100
$120
$140
$160
$180
0
200
400
600
800
1,000
1,200
Mill
ions
Num
ber o
f Cla
ims
20 Office of the New York City Comptroller Scott M. Stringer
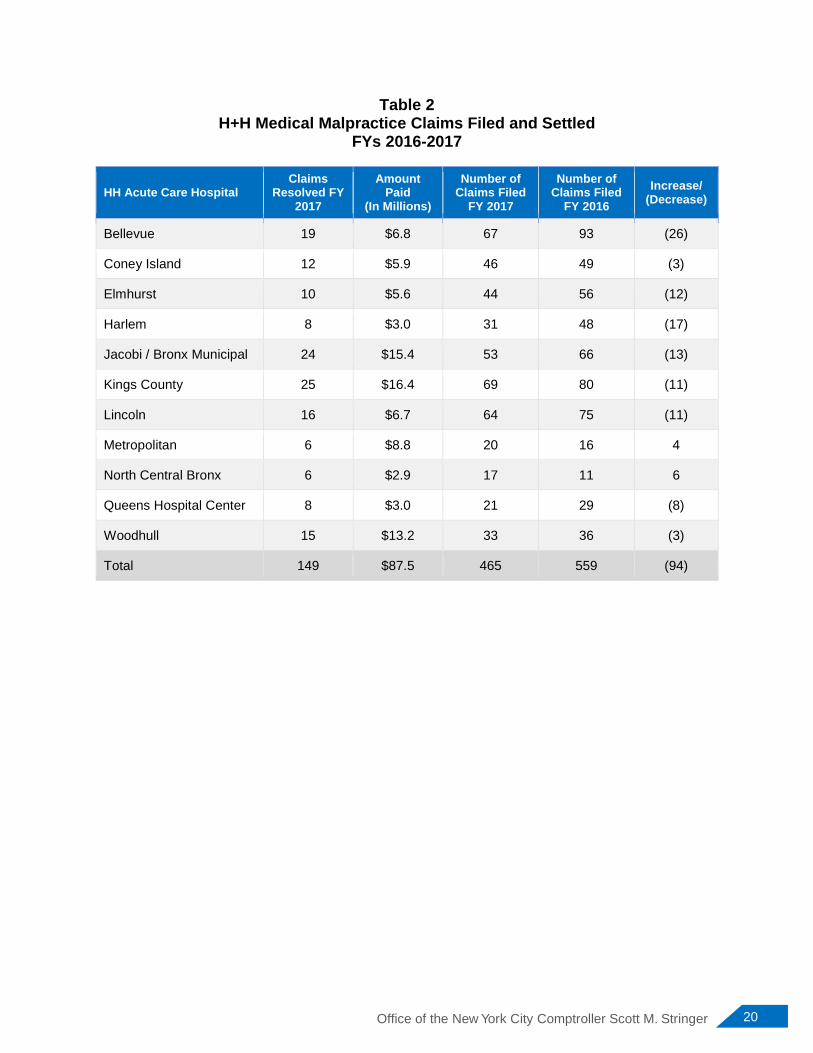
Table 2 H+H Medical Malpractice Claims Filed and Settled
FYs 2016-2017
HH Acute Care Hospital Claims
Resolved FY 2017
Amount Paid
(In Millions)
Number of Claims Filed
FY 2017
Number of Claims Filed
FY 2016 Increase/
(Decrease)
Bellevue 19 $6.8 67 93 (26)
Coney Island 12 $5.9 46 49 (3)
Elmhurst 10 $5.6 44 56 (12)
Harlem 8 $3.0 31 48 (17)
Jacobi / Bronx Municipal 24 $15.4 53 66 (13)
Kings County 25 $16.4 69 80 (11)
Lincoln 16 $6.7 64 75 (11)
Metropolitan 6 $8.8 20 16 4
North Central Bronx 6 $2.9 17 11 6
Queens Hospital Center 8 $3.0 21 29 (8)
Woodhull 15 $13.2 33 36 (3)
Total 149 $87.5 465 559 (94)
21 Claims Report: Fiscal Year 2017
3. Department of Correction
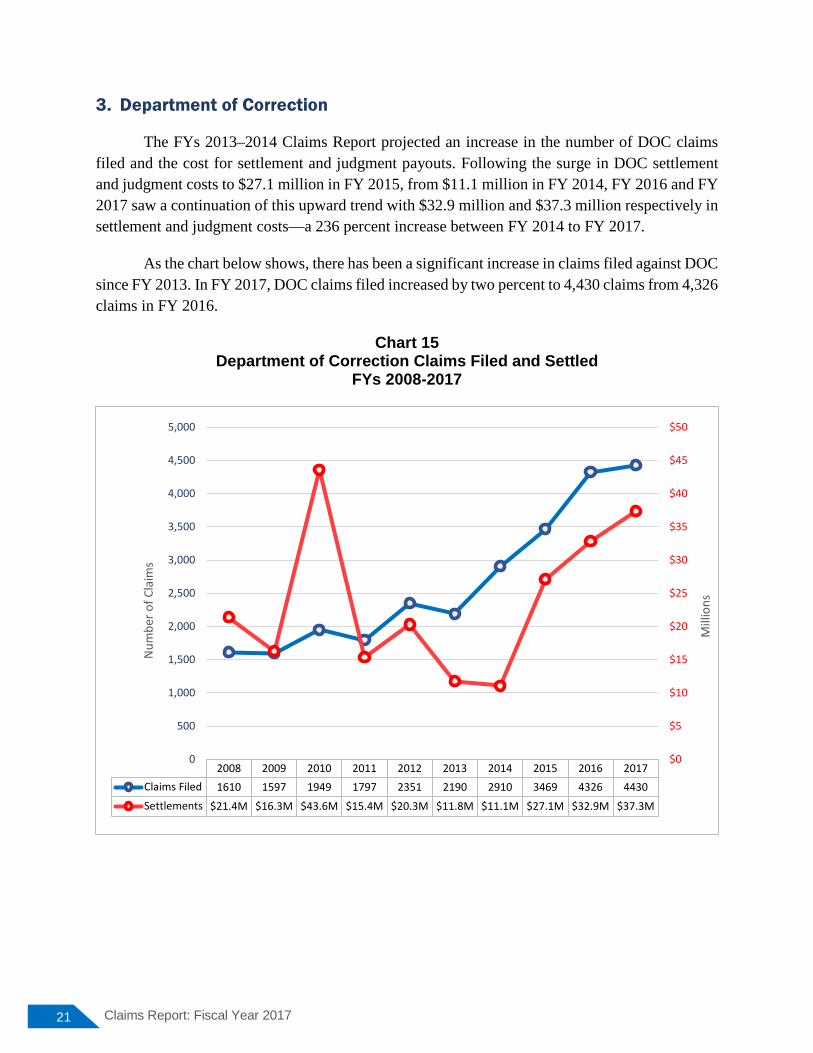
The FYs 2013–2014 Claims Report projected an increase in the number of DOC claims filed and the cost for settlement and judgment payouts. Following the surge in DOC settlement and judgment costs to $27.1 million in FY 2015, from $11.1 million in FY 2014, FY 2016 and FY 2017 saw a continuation of this upward trend with $32.9 million and $37.3 million respectively in settlement and judgment costs—a 236 percent increase between FY 2014 to FY 2017.
As the chart below shows, there has been a significant increase in claims filed against DOC since FY 2013. In FY 2017, DOC claims filed increased by two percent to 4,430 claims from 4,326 claims in FY 2016.
Chart 15 Department of Correction Claims Filed and Settled
FYs 2008-2017
2008 2009 2010 2011 2012 2013 2014 2015 2016 2017Claims Filed 1610 1597 1949 1797 2351 2190 2910 3469 4326 4430Settlements $21.4M $16.3M $43.6M $15.4M $20.3M $11.8M $11.1M $27.1M $32.9M $37.3M
$0
$5
$10
$15
$20
$25
$30
$35
$40
$45
$50
0
500
1,000
1,500
2,000
2,500
3,000
3,500
4,000
4,500
5,000
Mill
ions
Num
ber o
f Cla
ims
22 Office of the New York City Comptroller Scott M. Stringer
E. TORT CLAIM TRENDS BY BOROUGH10
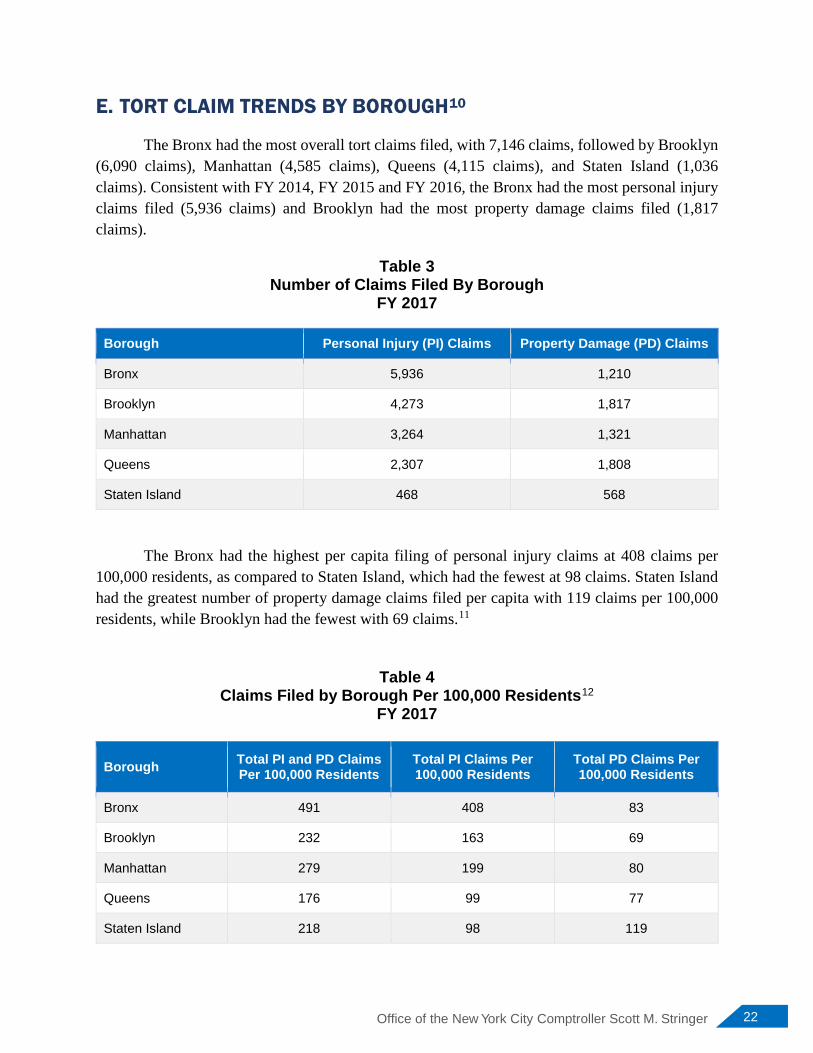
The Bronx had the most overall tort claims filed, with 7,146 claims, followed by Brooklyn (6,090 claims), Manhattan (4,585 claims), Queens (4,115 claims), and Staten Island (1,036 claims). Consistent with FY 2014, FY 2015 and FY 2016, the Bronx had the most personal injury claims filed (5,936 claims) and Brooklyn had the most property damage claims filed (1,817 claims).
Table 3 Number of Claims Filed By Borough
FY 2017
Borough Personal Injury (PI) Claims Property Damage (PD) Claims
Bronx 5,936 1,210
Brooklyn 4,273 1,817
Manhattan 3,264 1,321
Queens 2,307 1,808
Staten Island 468 568
The Bronx had the highest per capita filing of personal injury claims at 408 claims per
100,000 residents, as compared to Staten Island, which had the fewest at 98 claims. Staten Island had the greatest number of property damage claims filed per capita with 119 claims per 100,000 residents, while Brooklyn had the fewest with 69 claims.11
Table 4
Claims Filed by Borough Per 100,000 Residents12 FY 2017
Borough Total PI and PD Claims Per 100,000 Residents
Total PI Claims Per 100,000 Residents
Total PD Claims Per 100,000 Residents
Bronx 491 408 83
Brooklyn 232 163 69
Manhattan 279 199 80
Queens 176 99 77
Staten Island 218 98 119
23 Claims Report: Fiscal Year 2017
Table 5 Claims Resolved and Amounts Paid by Borough
FY 2017
Borough Number of PI Claims Resolved
Amount Paid for
PI Claims (In Millions)
Number of PD Claims Resolved
Amount Paid for
PD Claims (In Millions)
Total PI and PD Claims
Resolved
Total PI and PD Claim
Payouts (In Millions)
Bronx 2,298 $190.9 271 $0.8 2,569 $191.6
Brooklyn 1,800 $241.4 514 $1.9 2,314 $243.4
Manhattan 1,104 $109.0 432 $2.8 1,536 $111.9
Queens 869 $66.0 512 $2.9 1,381 $69.0
Staten Island 257 $22.6 171 $0.5 428 $23.1
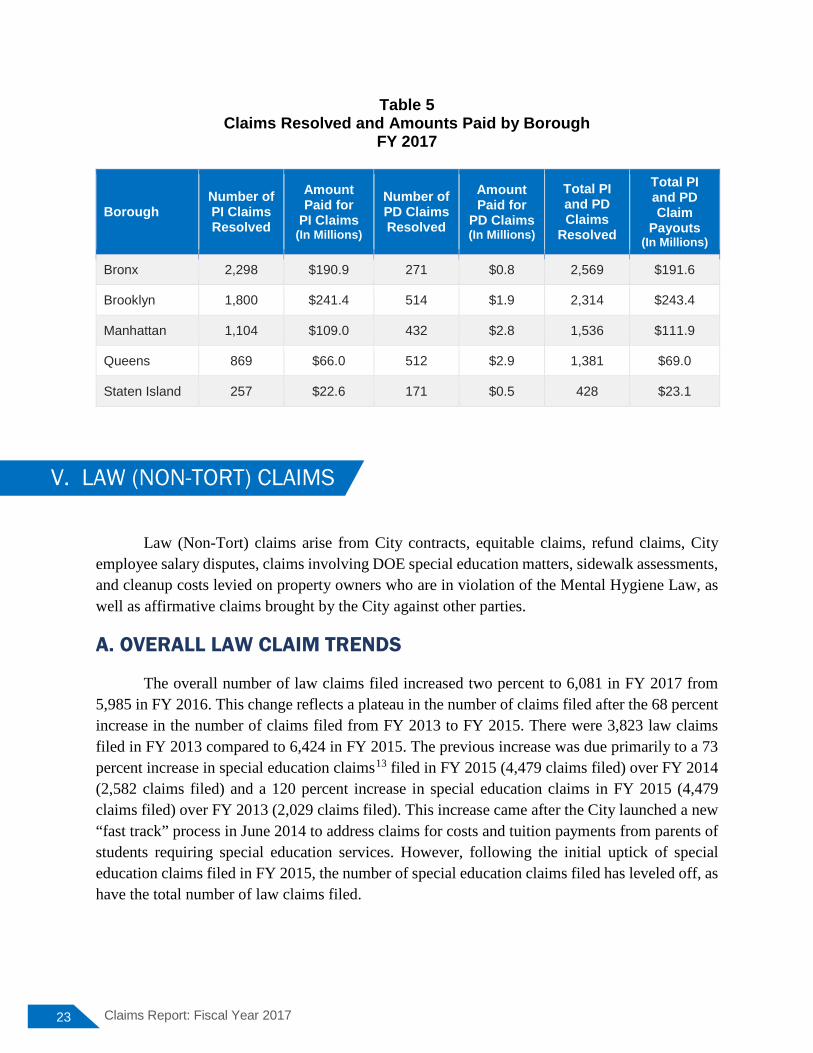
Law (Non-Tort) claims arise from City contracts, equitable claims, refund claims, City employee salary disputes, claims involving DOE special education matters, sidewalk assessments, and cleanup costs levied on property owners who are in violation of the Mental Hygiene Law, as well as affirmative claims brought by the City against other parties.
A. OVERALL LAW CLAIM TRENDS
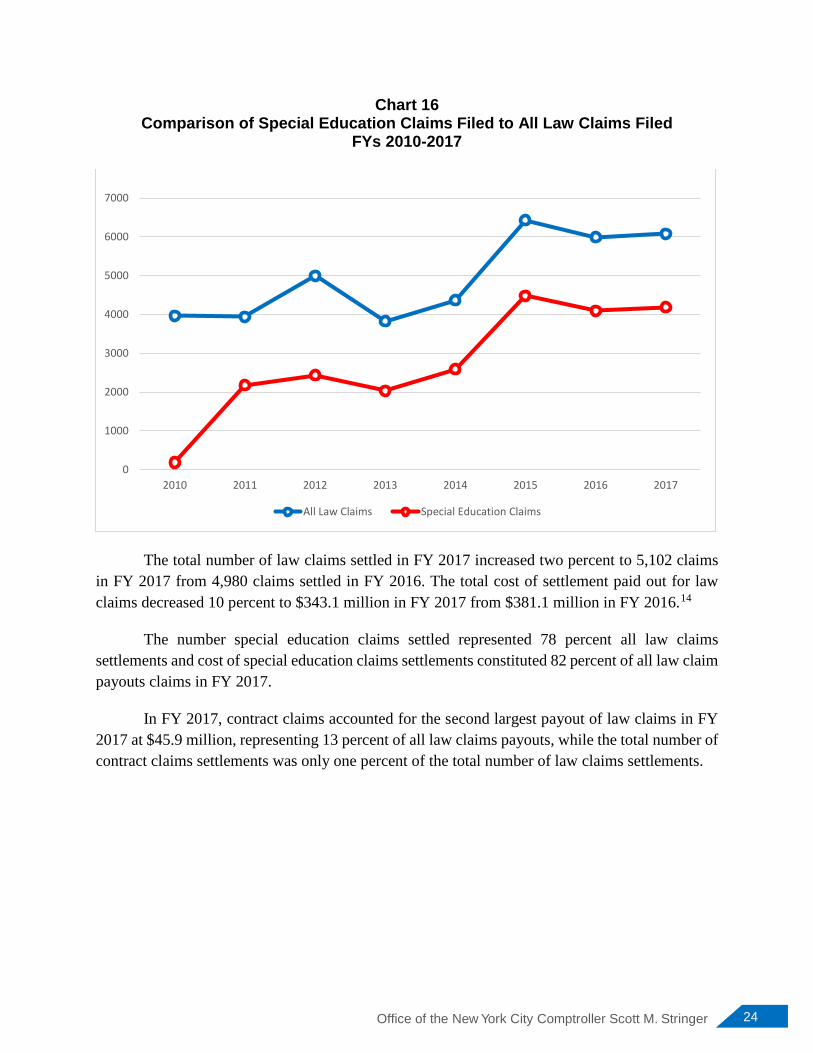
The overall number of law claims filed increased two percent to 6,081 in FY 2017 from 5,985 in FY 2016. This change reflects a plateau in the number of claims filed after the 68 percent increase in the number of claims filed from FY 2013 to FY 2015. There were 3,823 law claims filed in FY 2013 compared to 6,424 in FY 2015. The previous increase was due primarily to a 73 percent increase in special education claims13 filed in FY 2015 (4,479 claims filed) over FY 2014 (2,582 claims filed) and a 120 percent increase in special education claims in FY 2015 (4,479 claims filed) over FY 2013 (2,029 claims filed). This increase came after the City launched a new “fast track” process in June 2014 to address claims for costs and tuition payments from parents of students requiring special education services. However, following the initial uptick of special education claims filed in FY 2015, the number of special education claims filed has leveled off, as have the total number of law claims filed.
V. LAW (NON-TORT) CLAIMS
24 Office of the New York City Comptroller Scott M. Stringer
Chart 16 Comparison of Special Education Claims Filed to All Law Claims Filed
FYs 2010-2017
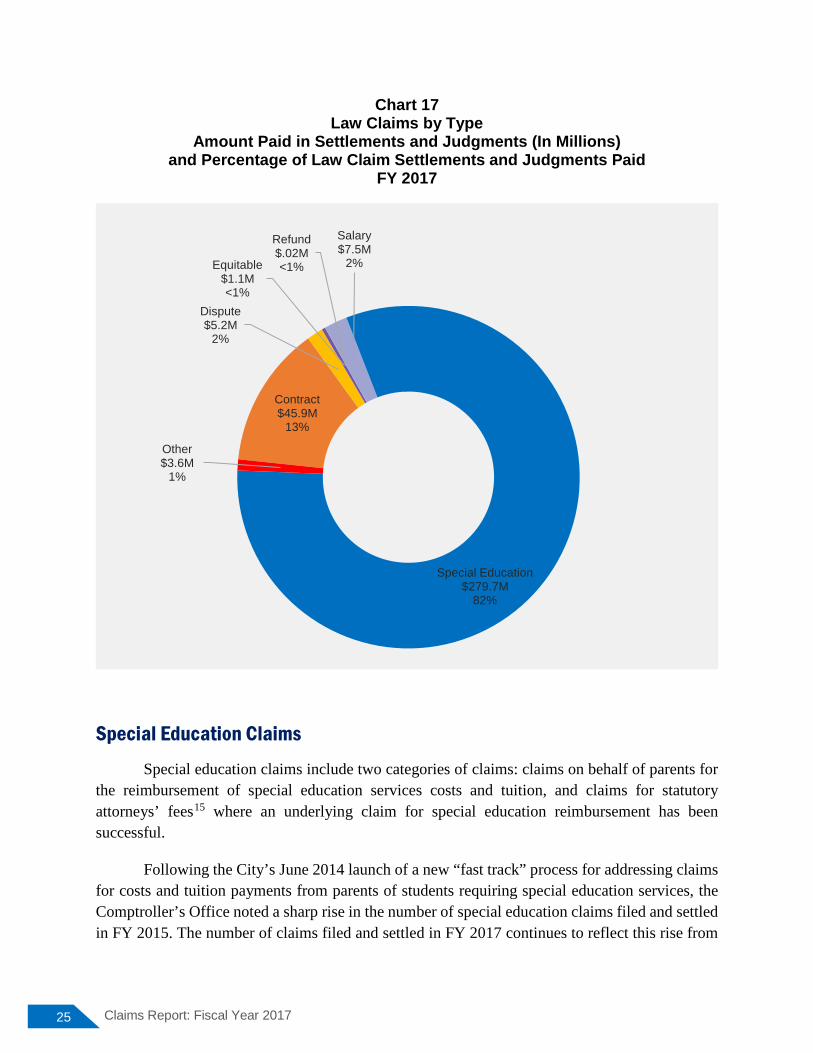
The total number of law claims settled in FY 2017 increased two percent to 5,102 claims in FY 2017 from 4,980 claims settled in FY 2016. The total cost of settlement paid out for law claims decreased 10 percent to $343.1 million in FY 2017 from $381.1 million in FY 2016.14
The number special education claims settled represented 78 percent all law claims settlements and cost of special education claims settlements constituted 82 percent of all law claim payouts claims in FY 2017.
In FY 2017, contract claims accounted for the second largest payout of law claims in FY 2017 at $45.9 million, representing 13 percent of all law claims payouts, while the total number of contract claims settlements was only one percent of the total number of law claims settlements.
0
1000
2000
3000
4000
5000
6000
7000
2010 2011 2012 2013 2014 2015 2016 2017
All Law Claims Special Education Claims
25 Claims Report: Fiscal Year 2017
Chart 17 Law Claims by Type
Amount Paid in Settlements and Judgments (In Millions) and Percentage of Law Claim Settlements and Judgments Paid
FY 2017
Special Education Claims Special education claims include two categories of claims: claims on behalf of parents for
the reimbursement of special education services costs and tuition, and claims for statutory attorneys’ fees15 where an underlying claim for special education reimbursement has been successful.
Following the City’s June 2014 launch of a new “fast track” process for addressing claims for costs and tuition payments from parents of students requiring special education services, the Comptroller’s Office noted a sharp rise in the number of special education claims filed and settled in FY 2015. The number of claims filed and settled in FY 2017 continues to reflect this rise from
Contract$45.9M
13%
Dispute$5.2M
2%
Equitable$1.1M<1%
Refund$.02M<1%
Salary$7.5M
2%
Special Education$279.7M
82%
Other$3.6M
1%
26 Office of the New York City Comptroller Scott M. Stringer
pre-“fast track” levels. However, following the initial uptick in FY 2015, the number of claims filed and settled have stabilized.
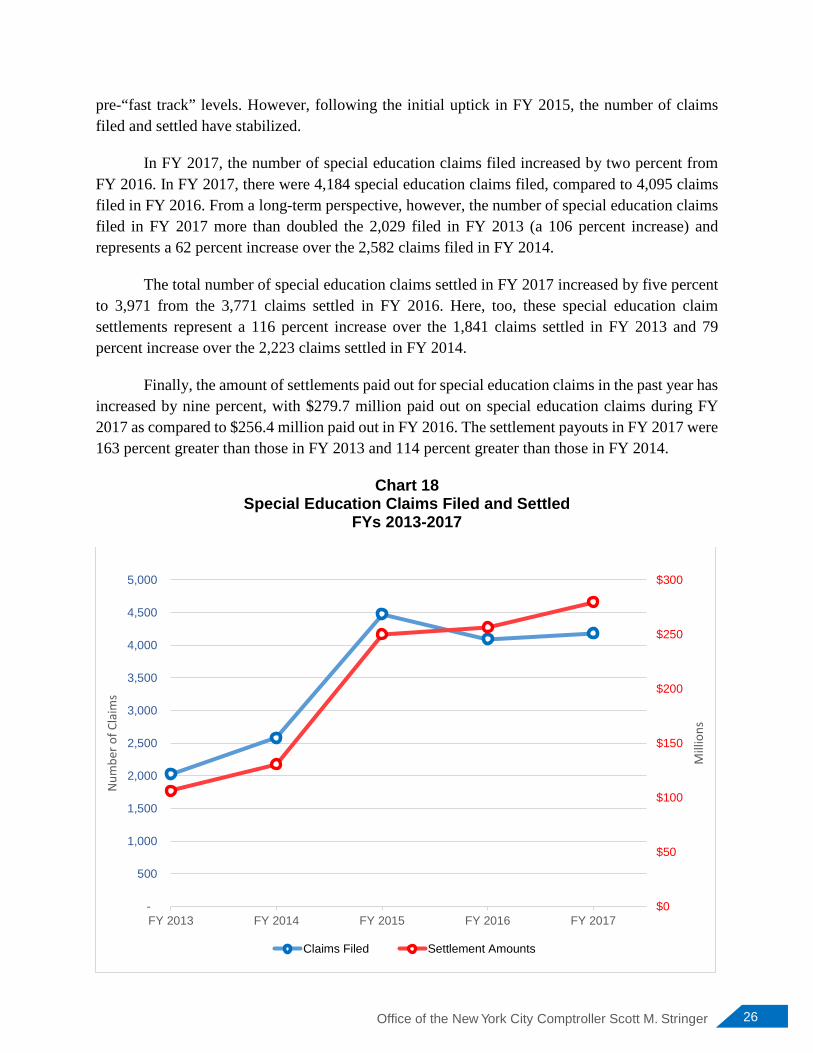
In FY 2017, the number of special education claims filed increased by two percent from FY 2016. In FY 2017, there were 4,184 special education claims filed, compared to 4,095 claims filed in FY 2016. From a long-term perspective, however, the number of special education claims filed in FY 2017 more than doubled the 2,029 filed in FY 2013 (a 106 percent increase) and represents a 62 percent increase over the 2,582 claims filed in FY 2014.
The total number of special education claims settled in FY 2017 increased by five percent to 3,971 from the 3,771 claims settled in FY 2016. Here, too, these special education claim settlements represent a 116 percent increase over the 1,841 claims settled in FY 2013 and 79 percent increase over the 2,223 claims settled in FY 2014.
Finally, the amount of settlements paid out for special education claims in the past year has increased by nine percent, with $279.7 million paid out on special education claims during FY 2017 as compared to $256.4 million paid out in FY 2016. The settlement payouts in FY 2017 were 163 percent greater than those in FY 2013 and 114 percent greater than those in FY 2014.
Chart 18 Special Education Claims Filed and Settled
FYs 2013-2017
$0
$50
$100
$150
$200
$250
$300
-
500
1,000
1,500
2,000
2,500
3,000
3,500
4,000
4,500
5,000
FY 2013 FY 2014 FY 2015 FY 2016 FY 2017
Mill
ions
Num
ber o
f Cla
ims
Claims Filed Settlement Amounts
27 Claims Report: Fiscal Year 2017
Contract Delay Claims
Contract claims arise when there is a disagreement between the City and private contractors (construction or non-construction) and where the City is a lessee or lessor of property.
The number of contract claims filed in FY 2017 increased three percent over FY 2016, from 152 claims filed in FY 2016 to 157 claims filed in FY 2017. While the number of settlements of contract claims has decreased only three percent from 33 contract claims settled in FY 2017 to 32 contract claim settled in FY 2017, there has been a seven percent decrease in the amount paid out for contract claims from the $49.6 million paid out in FY 2016 to $45.9 million in FY 2017.
Contract claims include a subcategory of claims called delay claims, meaning a contractor alleges that it was damaged by delays caused by the actions or inactions of the City on a construction project. Delay claims typically arise on larger construction projects such as those involving construction or renovation of public buildings and infrastructure like bridges, sewers and wastewater treatment plants. The analyses of these claims require the expertise of numerous staff members within the Comptroller’s Office, including professional engineers, auditors, and attorneys.
While only 10 delay claims settled in FY 2017, accounting for less than a third of the 32 contract claims settled, the pay out on these 10 delay claims, $40.1 million, makes up more than 87 percent of the $45.9 million total settlements for contract claims in FY 2017.
In FY 2017, these 10 delay claims, with alleged damages totaling $184.3 million, were negotiated and settled for $40.1 million. This represents an adjusted difference of $144.2 million, or 78 percent decrease, from the amount of damages claimed by contractors. In FY 2017, settlements of claims for damages attributable to agency-caused delays increased the overall cost of these projects to the City by more than six percent over the original contract prices.
Of the 10 delay claims settled in FY 2017, four of those claims arose out of contracts with DEP. These four claims alleged damages totaling $165.9 million, which the City was able to negotiate and settle for $31.6 million. This represents an adjustment of 81 percent of the claimed damages. Of these four DEP claims, two arose out of contracts for the upgrade of water pollution control plants (WPCP contracts). The settlement of the two WPCP contract delay claims account for 96 percent of the DEP delay claim settlements and 76 percent of all delay claims settlements in FY 2017. Settlement of WPCP contract delay claims accounted for 73 percent of all delay claims settlements in FY 2016 and 76 percent of all delay claims settlements in FY 2015. Delays in WPCP contracts continue to account for the largest portion of payouts for delay claim settlements.

28 Office of the New York City Comptroller Scott M. Stringer
Chart 19 Contract Delay Claims by Agency
Amount Paid in Settlements and Judgments and Percentage of Delay Claim Settlements and Judgments Paid (In Millions)
FY 2017
Alternative Dispute Resolution Claims
Contracts between the City and vendors solicited after September 1990 have included an Alternative Dispute Resolution (ADR) provision designed to provide a speedy alternative to litigation. When a dispute arises, a contractor may attempt to resolve it directly with the agency involved. If no agreement is reached during that process, a claim can subsequently be filed with the Comptroller's Office. If the claim is not resolved, the contractor may appeal to the Contract Dispute Resolution Board.
In FY 2017, 36 dispute claims were negotiated and settled for a total of $5.2 million. This represents a 15 percent decrease in the amount paid out on dispute claims from the $6.1 million paid out in 62 dispute claims settled in FY 2016.16
Dept. of Environmental Protection$31.6M79%
Dept. of Transportation$1.5M
4%
Dept. of Design and Construction
$6.9M17%
Dept. of Parks and Recreation
$0.2M<1%
29 Claims Report: Fiscal Year 2017
Affirmative Claims
Affirmative claims are those brought by the City against individuals, companies, and corporations for torts, breaches of contract, and as remedies for violations of civil codes. These claims include, among others, funds due to the City for housing or building code violations, actions arising from the sale of unlicensed cigarettes and other public nuisances, contract overpayments, and recoupment of Medicaid assistance payments.
In FY 2017, the Comptroller’s Office approved settlement of 985 affirmative claims for a benefit to the City of $11 million, as compared to FY 2016, when 1,016 affirmative claims were settled for $9.5 million.17 The FY 2017 amounts recovered were $1.5 million or 16 percent greater than FY 2016 in part due to a 300 percent increase in the recovery of civil penalties, a subcategory of affirmative claims wherein the City seeks monetary penalties for violations of civil code violations such as housing or building code violations, the sale of untaxed cigarettes and the creation of other public nuisances. In FY 2017, the City recovered civil penalties in the amount of $1.6 million on 337 claims, up from $0.4 million recovered in civil penalties on 139 claims in FY 2016.
Other Claims
Various other types of law claims are evaluated and resolved by the Comptroller’s Office, including equitable claims (claims for payment on goods or services that are not supported by a valid, registered contracts but may be recognized if the City received a benefit and settlement would serve the public interest), refund claims (claims seeking refunds for alleged overpayments and unjust fines), and change of grade claims (claims by property owners seeking compensation for damages caused by changes in grade to sidewalks that impair access to their property and drainage).
Notably, three claims resulting from the revocation of tax abatements to residential properties where the owners failed to market the apartments as rent stabilized after having received a tax benefit conditioned on doing so were settled in FY 2017. The settlements resulted in a monetary benefit to the City in the form of penalties of $158,000. Moreover, the City was able to guarantee New Yorkers additional affordable housing by negotiating settlements by which these three buildings will remain rent stabilized for the next 15 years.
30 Office of the New York City Comptroller Scott M. Stringer
APPENDIX A Description of Claim Types
Claims that are filed against the City are classified into categories to facilitate analysis by
the Comptroller's Office and other interested parties.
Under the present classification structure, claims are categorized initially by the City agency involved and by general category of claim: personal injury, property damage, or law. Each general category has subtypes, and it is at this level that claims are analyzed. For example, personal injury claims may include alleged slip/trip and fall accidents on sidewalks (claims alleging a defective sidewalk), or injuries that occurred in school (school claims), or in a City park (recreation claims). The present coding system classifies claim types as follows:
A. ADMIRALTY
Admiralty claims include claims by passengers or other persons injured on the water, either on City vessels or ferries, gangplanks, or piers.
B. ROADWAY
Roadway claims include pedestrians, motorists, or others claiming injuries as a result of alleged defects in a street or roadway, such as potholes, cracked, wet or snow-covered roadways, sewer gratings, raised, missing or exploding manhole covers, or roadways under repair.
C. SIDEWALK
Sidewalk claims include pedestrians or others claiming injury because of an allegedly defective sidewalk such as, broken or uneven sidewalks, broken curbstones, protruding bolts, grates, or parking meter or traffic sign stubs, defective boardwalks, and snow and ice claims.
D. TRAFFIC CONTROL DEVICE Traffic control device claims are filed by pedestrians or motorists injured in accidents allegedly caused by malfunctioning traffic signals, defective or missing traffic devices, or downed or missing traffic signs.
E. POLICE ACTION
Police action claims result from alleged improper police action, such as false arrest or imprisonment, excessive force or assault, or failure to provide police protection.
I. PERSONAL INJURY CLAIMS
31 Claims Report: Fiscal Year 2017
F. SCHOOL School claims are those filed against the DOE by students, teachers, other staff, parents, or visitors to DOE facilities.
G. MEDICAL MALPRACTICE
This category of claim derives from medical malpractice in the diagnosis, treatment, or care at a City or H+H facility or from EMS treatment.
H. HEALTH FACILITY/NON-MEDICAL INCIDENTS
These claims involve non-medical acts involving a City or H+H facility or employee, such as injuries sustained by visitors due to wet floors, assaults of patients or visitors, loss of sepulcher, or abuse or assaults of senior citizens by home care workers.
I. MOTOR VEHICLE Motor vehicle claims involve alleged accidents with City-owned vehicles. Included in this category are cases of pedestrians, motorists, or passengers of other vehicles allegedly struck by a City-owned vehicle, and operators or passengers of City-owned vehicles involved in a collision.
J. UNIFORMED SERVICES EMPLOYEE Included in this category of claims are those filed by City employees of the uniformed services, such as NYPD, FDNY, DOE teachers, or DSNY employees who are not subject to Workers' Compensation laws and may sue the City for on-the-job personal injuries.
K. PARKS AND RECREATION These claims are asserted by persons allegedly injured because of defective equipment or negligent maintenance of property under the jurisdiction of the Department of Parks and Recreation. This includes incidents that occur in Parks Department buildings or on playground equipment and grounds, and incidents involving falling trees or limbs, whether on a street, sidewalk, or in a park.
L. CITY PROPERTY This category includes claims by tenants or others asserting that they were injured by an alleged defect in or the negligent maintenance of City-owned land, or a City-owned or City-administered building or facility.
32 Office of the New York City Comptroller Scott M. Stringer
M. CATASTROPHE This claim type includes claims filed as a result of natural disasters, such as floods or earthquakes; environmental accidents, such as leaking gas tanks; power failures, such as blackouts; and civil disturbances, such as riots.
N. CIVIL RIGHTS
Civil rights claims involve alleged Federal, State or City statutory or constitutional violations, such as discrimination based on sex, race, religion, disability, sexual orientation, or age.
O. CORRECTION FACILITY Correction claims involve claims by inmates, employees of and visitors to City correction institutions or facilities who were allegedly injured by the actions of City employees or inmates.
P. AFFIRMATIVE CLAIMS
Claims brought by the City against individuals, companies, and corporations for damages to City property.
A. ADMIRALTY
These claims are for alleged property damaged on the water, either on City vessels, ferries, gangplanks, or piers.
B. SEWER OVERFLOW
Sewer overflow claims include alleged flooding or water damage to real or personal property caused by inadequate sewer repairs or clogged/obstructed City sewers.
C. WATER MAIN BREAK
Water main break claims include alleged water damage to real or personal property as a result of leaking or broken water mains or fire hydrants.
D. ROADWAY This claim type includes claims for vehicles that are damaged by allegedly defective roadways, or from objects that have fallen from bridges or overpasses. Also included are
II. PROPERTY DAMAGE CLAIMS
33 Claims Report: Fiscal Year 2017
claims made by pedestrians who sustained damage to personal property as a result of an alleged fall on a defective roadway.
E. SIDEWALK Sidewalk claims are made by individuals who sustain damage to personal property as a result of an allegedly defective sidewalk.
F. TRAFFIC DEVICE This claim type includes vehicles or other personal property damaged in accidents allegedly caused by defective, obstructed, or missing traffic lights or stop signs.
G. POLICE ACTION
Police action claims relate to vehicles or other personal property that is allegedly stolen, damaged, sold, or destroyed while in police custody.
H. SCHOOL School claims include allegations for lost, stolen, or damaged personal property that belongs to students, teachers, or DOE staff while on DOE property.
I. HEALTH FACILITY These claims include the personal property of patients or others that has allegedly been lost, stolen, or damaged while on H+H or City hospital property.
J. MOTOR VEHICLE Motor vehicle claims include vehicles or other personal property that is allegedly damaged in accidents with City-owned vehicles. Included are parked cars allegedly hit by City-owned vehicles and vehicles damaged while being towed.
K. UNIFORMED SERVICES/CITY EMPLOYEES
This claim type includes claims for personal property that is allegedly lost, damaged, or stolen from City employees while at work.
L. PARKS AND RECREATION Claims in this category include personal property that is allegedly lost, stolen, or damaged in the City's parks. Damage occurs from vandalism, poor maintenance, unmarked fresh paint, or accidents involving grounds and equipment.
34 Office of the New York City Comptroller Scott M. Stringer
M. PUBLIC BUILDINGS AND PROPERTY This claim type includes claims for personal property allegedly damaged or stolen as a result of a defect or negligence in maintaining City-owned land, buildings or facilities.
N. CATASTROPHE
These claims include property damage allegedly caused by the City's response to a natural disaster (such as a flood or earthquake), an environmental accident (such as a leaking gas tank), power failures (blackouts), or civil disturbances (such as riots).
O. DAMAGE CITY ACTION/PERSONNEL These claims include property damaged allegedly caused by City-owned vehicles or equipment, such as a City-owned vehicle damaging a homeowner's fence or other property, or damage caused by a traffic light falling onto a vehicle.
P. CORRECTION FACILITY
Correction facility claims include claims by prisoners, inmates, detainees, or visitors whose personal property is lost, stolen, or damaged while in a correction institution.
A. CONTRACT
Claims in this category arise from disputes between the City and private contractors (construction or non-construction) and where the City is a lessee or lessor of property.
B. ALTERNATIVE DISPUTE RESOLUTION Contracts between the City and vendors solicited after September 1990 include an Alternative Dispute Resolution provision designed to provide a speedy alternative to litigation. When disputes arise, contractors may attempt to resolve them directly with the City agency involved. If no agreement is reached, a claim can then be filed with the Comptroller's Office. If the claim is denied, the contractor may appeal to the Contract Dispute Resolution Board.
C. ILLEGAL BUT EQUITABLE These claims typically allege that work was performed at the direction of the City and/or the City accepted services, but the necessary contract and other approval were not obtained. These claims, though invalid at law, may be recognized as equitable and proper if it can be determined that the City received a benefit and that the public interest would be served by payment or compromise.
III. LAW CLAIMS
35 Claims Report: Fiscal Year 2017
D. SALARY Salary claims are those claims for back pay and/or attorneys’ fees by prospective, current, or former City employees alleging employment related disputes. These disputes include claims for discrimination, out-of-title work, pay differential, annual leave, and suspension; excluded from this claim type is those claims that are seeking damages for personal injury.
E. REFUND Refund claims include claims by private individuals seeking refunds for alleged overpayments and unjust fines.
F. CHANGE OF GRADE These claims are made by commercial or residential property owners or lessees. The claims arise from changes in grade to a sidewalk that impair access to property and drainage. Claims typically are made for loss of business due to walkway or driveway repairs.
G. SPECIAL EDUCATION
These claims include claims on behalf of parents for the reimbursement of special education services costs and tuition and claims for statutory attorneys’ fees where an underlying claim for special education reimbursement has been successful.
H. AFFIRMATIVE CLAIMS Claims brought by the City against individuals, companies, and corporations for torts, breaches of contract, and remedy for violations of civil codes.
36 Office of the New York City Comptroller Scott M. Stringer
APPENDIX B Legal Background
The decision of the New York Court of Appeals in Bernadine v. New York City, issued in 1945, exposed the City for the first time to liability for torts committed by the City’s officers, agents, and employees.18
In Bernadine, the Court held that “the civil divisions of the State are answerable equally with individuals and private corporations for wrongs of officers and employees—even if no separate statute sanctions that enlarged liability in a given instance.”19 The Court, in effect, abolished the doctrine of sovereign immunity for municipalities, but did not provide municipalities any of the protections accorded to the State by the Court of Claims Act.20 In particular, claimants seeking to recover from municipalities for their agents' negligent and wrongful acts are entitled to a jury trial.
Municipal liability is also governed by local law. Under their home rule authority, municipalities can limit liability to some extent through limitations on the right to sue. An example is New York City’s prior notice law, enacted in 1979 in an effort to limit the City’s liability in slip/trip and fall cases on City sidewalks and streets.
To commence an action against the City, a claimant typically must first notify the City by filing a Notice of Claim with the Comptroller’s Office.21 However, in the case of claims against the H+H, claims must be filed directly with H+H. In most instances, the notice of claim for personal injury or property damage must be filed within 90 days of an alleged injury or wrong.22
The City Charter grants the Comptroller the power to settle and adjust all claims in favor of or against the City.23 The Comptroller has the power to investigate claims, evaluate liability and damages, and reach a settlement prior to litigation.24 If the Comptroller denies liability or is unable to arrive at a settlement with a claimant, the claimant may commence suit. Actions regarding tort claims must generally be filed within a year and 90 days after the loss.25 The Office of the Corporation Counsel, under the direction of the Corporation Counsel, defends the City in most actions (H+H defends its medical malpractice actions). No litigation can be settled without the approval of the Comptroller.26
I. MUNICIPAL LIABILITY
II. CLAIMS PROCESS
37 Claims Report: Fiscal Year 2017
APPENDIX C Top Tort Claims Adjudicated in FY 2017
The City resolved five post-verdict claims involving New York City firefighters and families for the death and serious injuries sustained from responding to a January 2005 fire at an apartment building in the Bronx. Settlement of $29.5 million.
Two claimants/plaintiffs arrested and convicted in connection with murder of one the claimants’ mother, sister and sister’s friend that occurred in June 1992. Claimants/plaintiffs were each incarcerated for 22 years. Claimants/plaintiffs alleged wrongful conviction and incarceration. Settlement of $26 million.
In 1981, three claimants were convicted of arson and murder arising out of a fire that resulted in the death of a mother and her five children. The three claimants alleged wrongful conviction and incarceration. Settlement of $20.4 million.
Two claimants/plaintiffs convicted of murder in 1986 and the convictions were subsequently overturned. Claimants/plaintiffs alleged wrongful conviction and incarceration. Settlement of $8.5 million.
Claimant/plaintiff convicted of murder in 1990 and incarcerated until 2013 when his habeas petition for release was granted. Claimant/plaintiff alleged wrongful conviction and incarceration. Settlement of $8.3 million.
Claimant/plaintiff convicted of murder in 1991 and incarcerated until 2009 when the conviction was vacated. Claimant/plaintiff alleged wrongful conviction and incarceration. Settlement of $7.0 million.
Claimant/plaintiff alleged excessive force against the New York City Police Department after an off-duty police officer fired his weapon into a vehicle, resulting in the claimant/plaintiff being struck six times. Settlement of $6.9 million.
Claimant/plaintiff convicted of murder in 1990 and incarcerated until 2013 when the claimant/plaintiff was acquitted. Claimant/plaintiff alleged wrongful conviction and incarceration. Settlement of $6.0 million.
Wrongful death claim arising out of the alleged failure of Department of Correction to provide medication and running water to a mentally ill and diabetic inmate. Settlement of $5.8 million.
38 Office of the New York City Comptroller Scott M. Stringer
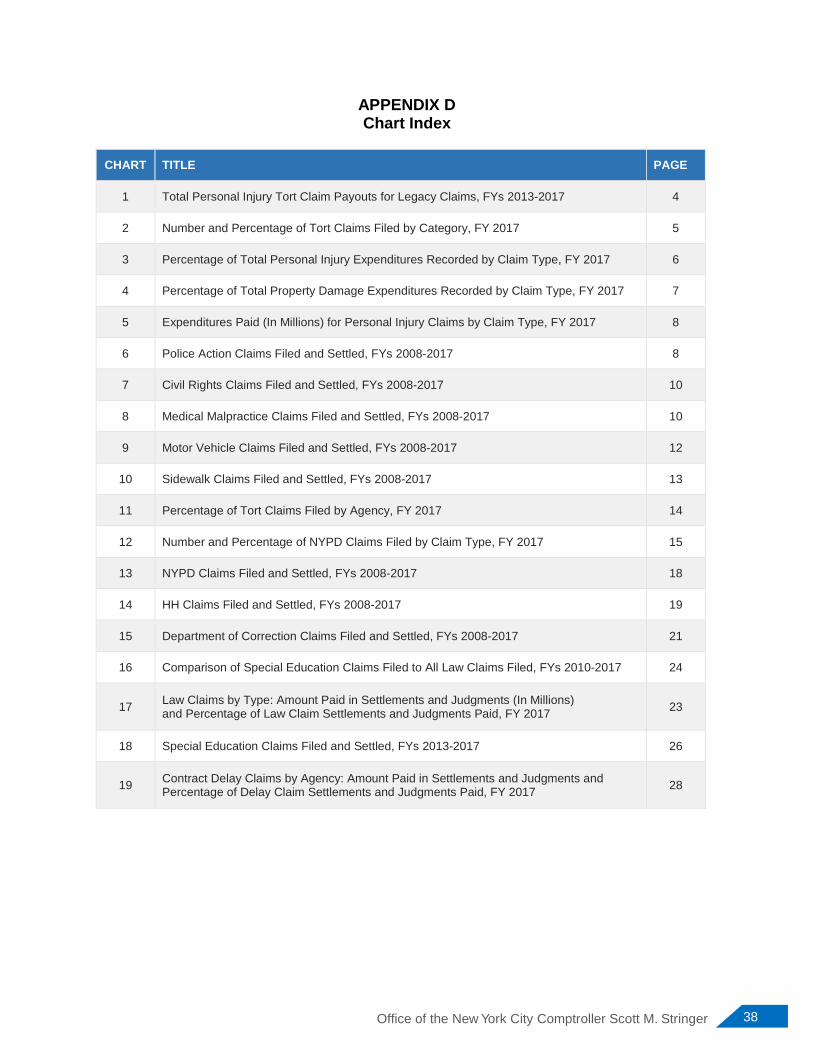
APPENDIX D Chart Index
CHART TITLE PAGE
1 Total Personal Injury Tort Claim Payouts for Legacy Claims, FYs 2013-2017 4
2 Number and Percentage of Tort Claims Filed by Category, FY 2017 5
3 Percentage of Total Personal Injury Expenditures Recorded by Claim Type, FY 2017 6
4 Percentage of Total Property Damage Expenditures Recorded by Claim Type, FY 2017 7
5 Expenditures Paid (In Millions) for Personal Injury Claims by Claim Type, FY 2017 8
6 Police Action Claims Filed and Settled, FYs 2008-2017 8
7 Civil Rights Claims Filed and Settled, FYs 2008-2017 10
8 Medical Malpractice Claims Filed and Settled, FYs 2008-2017 10
9 Motor Vehicle Claims Filed and Settled, FYs 2008-2017 12
10 Sidewalk Claims Filed and Settled, FYs 2008-2017 13
11 Percentage of Tort Claims Filed by Agency, FY 2017 14
12 Number and Percentage of NYPD Claims Filed by Claim Type, FY 2017 15
13 NYPD Claims Filed and Settled, FYs 2008-2017 18
14 HH Claims Filed and Settled, FYs 2008-2017 19
15 Department of Correction Claims Filed and Settled, FYs 2008-2017 21
16 Comparison of Special Education Claims Filed to All Law Claims Filed, FYs 2010-2017 24
17 Law Claims by Type: Amount Paid in Settlements and Judgments (In Millions) and Percentage of Law Claim Settlements and Judgments Paid, FY 2017 23
18 Special Education Claims Filed and Settled, FYs 2013-2017 26
19 Contract Delay Claims by Agency: Amount Paid in Settlements and Judgments and Percentage of Delay Claim Settlements and Judgments Paid, FY 2017 28
39 Claims Report: Fiscal Year 2017
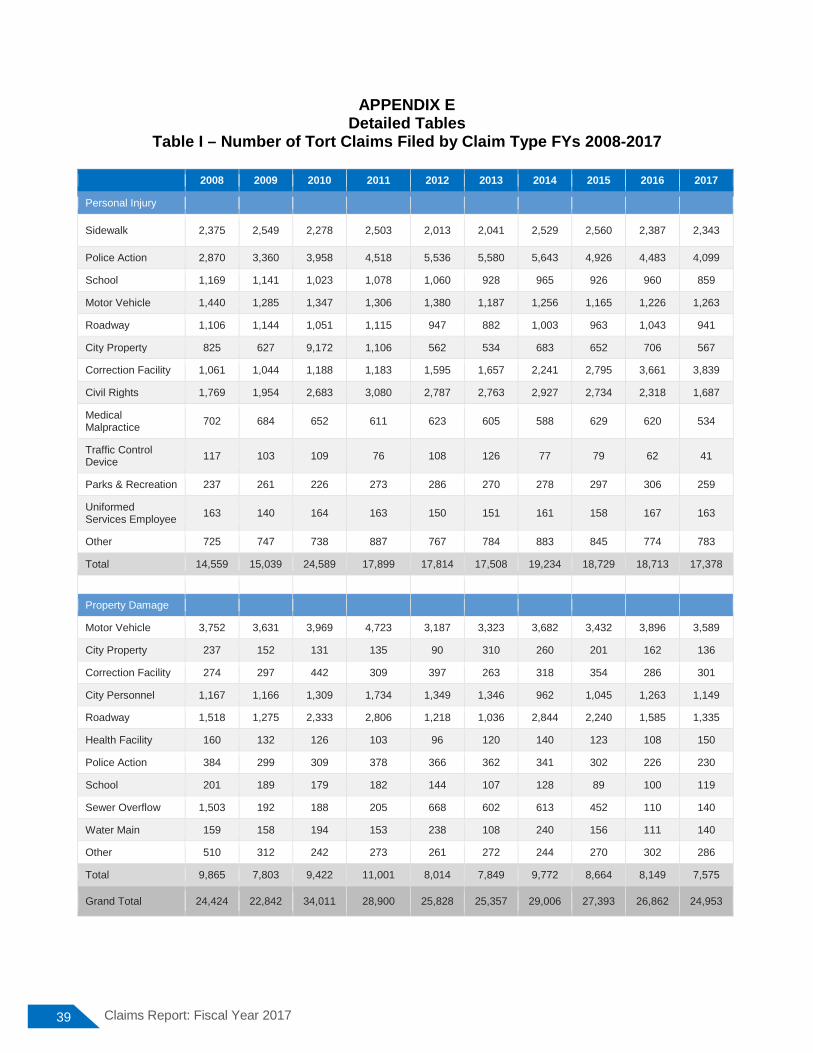
APPENDIX E Detailed Tables
Table I – Number of Tort Claims Filed by Claim Type FYs 2008-2017
2008 2009 2010 2011 2012 2013 2014 2015 2016 2017
Personal Injury
Sidewalk 2,375 2,549 2,278 2,503 2,013 2,041 2,529 2,560 2,387 2,343
Police Action 2,870 3,360 3,958 4,518 5,536 5,580 5,643 4,926 4,483 4,099
School 1,169 1,141 1,023 1,078 1,060 928 965 926 960 859
Motor Vehicle 1,440 1,285 1,347 1,306 1,380 1,187 1,256 1,165 1,226 1,263
Roadway 1,106 1,144 1,051 1,115 947 882 1,003 963 1,043 941
City Property 825 627 9,172 1,106 562 534 683 652 706 567
Correction Facility 1,061 1,044 1,188 1,183 1,595 1,657 2,241 2,795 3,661 3,839
Civil Rights 1,769 1,954 2,683 3,080 2,787 2,763 2,927 2,734 2,318 1,687
Medical Malpractice 702 684 652 611 623 605 588 629 620 534
Traffic Control Device 117 103 109 76 108 126 77 79 62 41
Parks & Recreation 237 261 226 273 286 270 278 297 306 259
Uniformed Services Employee 163 140 164 163 150 151 161 158 167 163
Other 725 747 738 887 767 784 883 845 774 783
Total 14,559 15,039 24,589 17,899 17,814 17,508 19,234 18,729 18,713 17,378
Property Damage
Motor Vehicle 3,752 3,631 3,969 4,723 3,187 3,323 3,682 3,432 3,896 3,589
City Property 237 152 131 135 90 310 260 201 162 136
Correction Facility 274 297 442 309 397 263 318 354 286 301
City Personnel 1,167 1,166 1,309 1,734 1,349 1,346 962 1,045 1,263 1,149
Roadway 1,518 1,275 2,333 2,806 1,218 1,036 2,844 2,240 1,585 1,335
Health Facility 160 132 126 103 96 120 140 123 108 150
Police Action 384 299 309 378 366 362 341 302 226 230
School 201 189 179 182 144 107 128 89 100 119
Sewer Overflow 1,503 192 188 205 668 602 613 452 110 140
Water Main 159 158 194 153 238 108 240 156 111 140
Other 510 312 242 273 261 272 244 270 302 286
Total 9,865 7,803 9,422 11,001 8,014 7,849 9,772 8,664 8,149 7,575
Grand Total 24,424 22,842 34,011 28,900 25,828 25,357 29,006 27,393 26,862 24,953
40 Office of the New York City Comptroller Scott M. Stringer
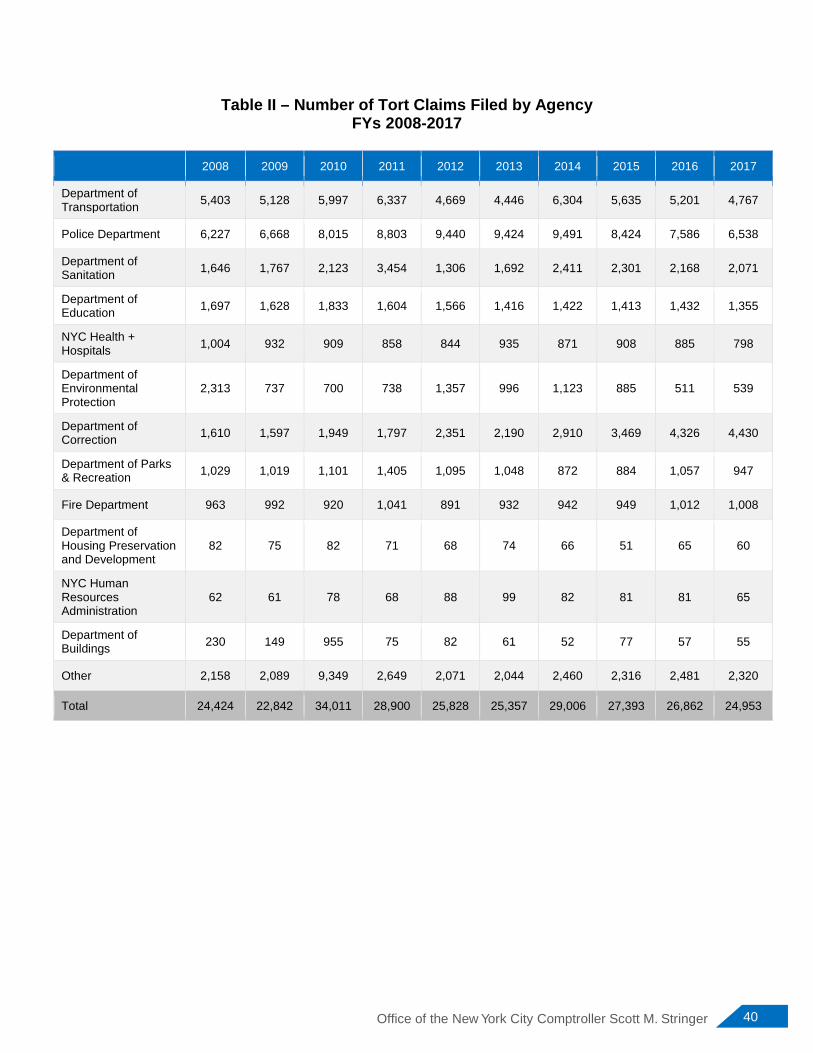
Table II – Number of Tort Claims Filed by Agency FYs 2008-2017
2008 2009 2010 2011 2012 2013 2014 2015 2016 2017
Department of Transportation 5,403 5,128 5,997 6,337 4,669 4,446 6,304 5,635 5,201 4,767
Police Department 6,227 6,668 8,015 8,803 9,440 9,424 9,491 8,424 7,586 6,538
Department of Sanitation 1,646 1,767 2,123 3,454 1,306 1,692 2,411 2,301 2,168 2,071
Department of Education 1,697 1,628 1,833 1,604 1,566 1,416 1,422 1,413 1,432 1,355
NYC Health + Hospitals 1,004 932 909 858 844 935 871 908 885 798
Department of Environmental Protection
2,313 737 700 738 1,357 996 1,123 885 511 539
Department of Correction 1,610 1,597 1,949 1,797 2,351 2,190 2,910 3,469 4,326 4,430
Department of Parks & Recreation 1,029 1,019 1,101 1,405 1,095 1,048 872 884 1,057 947
Fire Department 963 992 920 1,041 891 932 942 949 1,012 1,008
Department of Housing Preservation and Development
82 75 82 71 68 74 66 51 65 60
NYC Human Resources Administration
62 61 78 68 88 99 82 81 81 65
Department of Buildings 230 149 955 75 82 61 52 77 57 55
Other 2,158 2,089 9,349 2,649 2,071 2,044 2,460 2,316 2,481 2,320
Total 24,424 22,842 34,011 28,900 25,828 25,357 29,006 27,393 26,862 24,953
41 Claims Report: Fiscal Year 2017
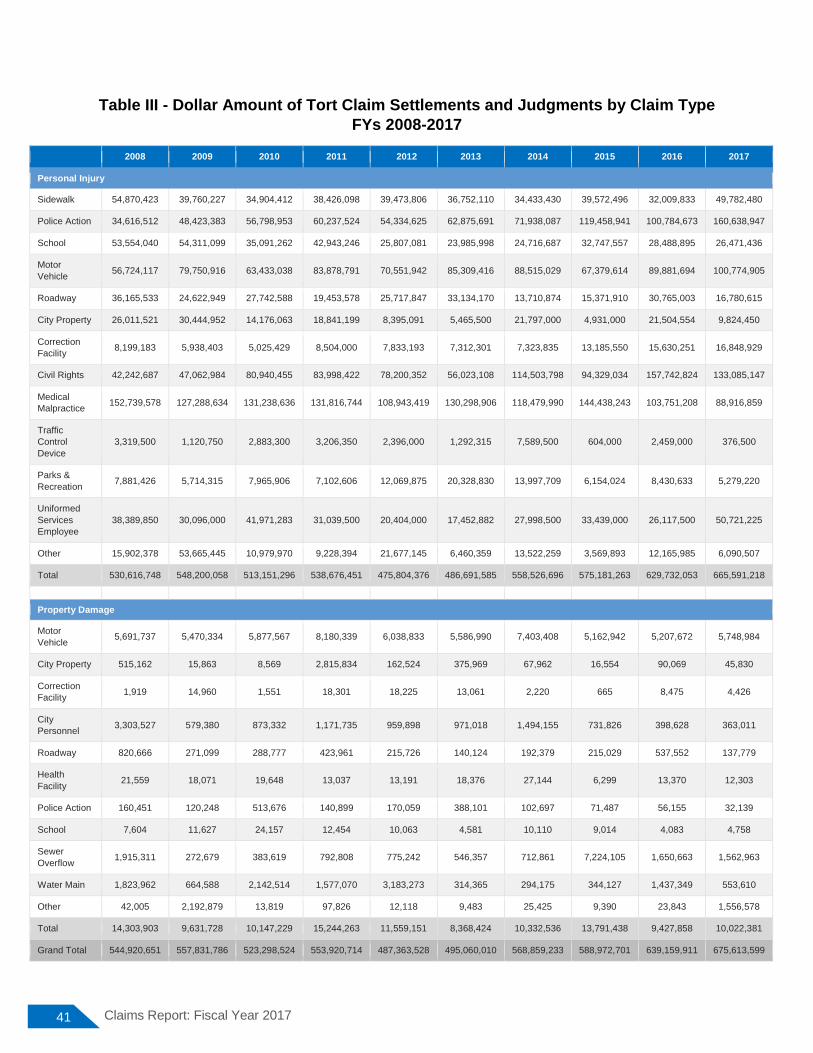
Table III - Dollar Amount of Tort Claim Settlements and Judgments by Claim Type FYs 2008-2017
2008 2009 2010 2011 2012 2013 2014 2015 2016 2017
Personal Injury Sidewalk 54,870,423 39,760,227 34,904,412 38,426,098 39,473,806 36,752,110 34,433,430 39,572,496 32,009,833 49,782,480
Police Action 34,616,512 48,423,383 56,798,953 60,237,524 54,334,625 62,875,691 71,938,087 119,458,941 100,784,673 160,638,947
School 53,554,040 54,311,099 35,091,262 42,943,246 25,807,081 23,985,998 24,716,687 32,747,557 28,488,895 26,471,436
Motor Vehicle 56,724,117 79,750,916 63,433,038 83,878,791 70,551,942 85,309,416 88,515,029 67,379,614 89,881,694 100,774,905
Roadway 36,165,533 24,622,949 27,742,588 19,453,578 25,717,847 33,134,170 13,710,874 15,371,910 30,765,003 16,780,615
City Property 26,011,521 30,444,952 14,176,063 18,841,199 8,395,091 5,465,500 21,797,000 4,931,000 21,504,554 9,824,450
Correction Facility 8,199,183 5,938,403 5,025,429 8,504,000 7,833,193 7,312,301 7,323,835 13,185,550 15,630,251 16,848,929
Civil Rights 42,242,687 47,062,984 80,940,455 83,998,422 78,200,352 56,023,108 114,503,798 94,329,034 157,742,824 133,085,147
Medical Malpractice 152,739,578 127,288,634 131,238,636 131,816,744 108,943,419 130,298,906 118,479,990 144,438,243 103,751,208 88,916,859
Traffic Control Device
3,319,500 1,120,750 2,883,300 3,206,350 2,396,000 1,292,315 7,589,500 604,000 2,459,000 376,500
Parks & Recreation 7,881,426 5,714,315 7,965,906 7,102,606 12,069,875 20,328,830 13,997,709 6,154,024 8,430,633 5,279,220
Uniformed Services Employee
38,389,850 30,096,000 41,971,283 31,039,500 20,404,000 17,452,882 27,998,500 33,439,000 26,117,500 50,721,225
Other 15,902,378 53,665,445 10,979,970 9,228,394 21,677,145 6,460,359 13,522,259 3,569,893 12,165,985 6,090,507
Total 530,616,748 548,200,058 513,151,296 538,676,451 475,804,376 486,691,585 558,526,696 575,181,263 629,732,053 665,591,218
Property Damage Motor Vehicle 5,691,737 5,470,334 5,877,567 8,180,339 6,038,833 5,586,990 7,403,408 5,162,942 5,207,672 5,748,984
City Property 515,162 15,863 8,569 2,815,834 162,524 375,969 67,962 16,554 90,069 45,830
Correction Facility 1,919 14,960 1,551 18,301 18,225 13,061 2,220 665 8,475 4,426
City Personnel 3,303,527 579,380 873,332 1,171,735 959,898 971,018 1,494,155 731,826 398,628 363,011
Roadway 820,666 271,099 288,777 423,961 215,726 140,124 192,379 215,029 537,552 137,779
Health Facility 21,559 18,071 19,648 13,037 13,191 18,376 27,144 6,299 13,370 12,303
Police Action 160,451 120,248 513,676 140,899 170,059 388,101 102,697 71,487 56,155 32,139
School 7,604 11,627 24,157 12,454 10,063 4,581 10,110 9,014 4,083 4,758
Sewer Overflow 1,915,311 272,679 383,619 792,808 775,242 546,357 712,861 7,224,105 1,650,663 1,562,963
Water Main 1,823,962 664,588 2,142,514 1,577,070 3,183,273 314,365 294,175 344,127 1,437,349 553,610
Other 42,005 2,192,879 13,819 97,826 12,118 9,483 25,425 9,390 23,843 1,556,578
Total 14,303,903 9,631,728 10,147,229 15,244,263 11,559,151 8,368,424 10,332,536 13,791,438 9,427,858 10,022,381
Grand Total 544,920,651 557,831,786 523,298,524 553,920,714 487,363,528 495,060,010 568,859,233 588,972,701 639,159,911 675,613,599
42 Office of the New York City Comptroller Scott M. Stringer
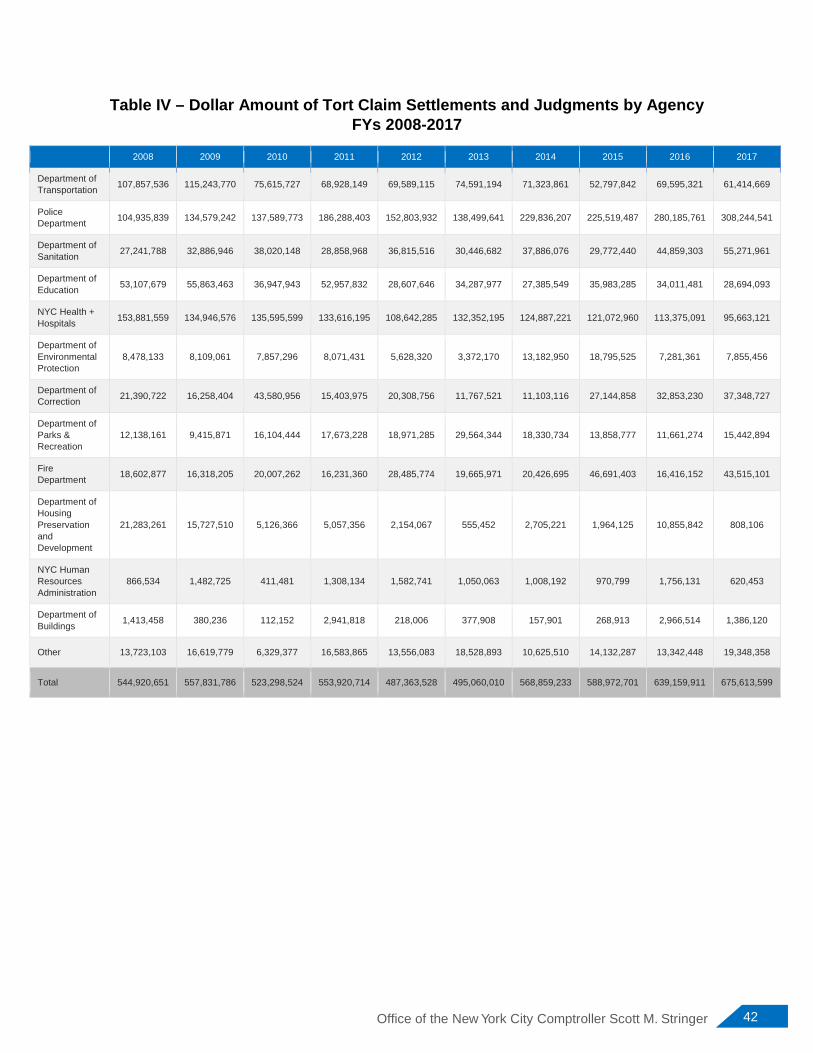
Table IV – Dollar Amount of Tort Claim Settlements and Judgments by Agency FYs 2008-2017
2008 2009 2010 2011 2012 2013 2014 2015 2016 2017
Department of Transportation 107,857,536 115,243,770 75,615,727 68,928,149 69,589,115 74,591,194 71,323,861 52,797,842 69,595,321 61,414,669
Police Department 104,935,839 134,579,242 137,589,773 186,288,403 152,803,932 138,499,641 229,836,207 225,519,487 280,185,761 308,244,541
Department of Sanitation 27,241,788 32,886,946 38,020,148 28,858,968 36,815,516 30,446,682 37,886,076 29,772,440 44,859,303 55,271,961
Department of Education 53,107,679 55,863,463 36,947,943 52,957,832 28,607,646 34,287,977 27,385,549 35,983,285 34,011,481 28,694,093
NYC Health + Hospitals 153,881,559 134,946,576 135,595,599 133,616,195 108,642,285 132,352,195 124,887,221 121,072,960 113,375,091 95,663,121
Department of Environmental Protection
8,478,133 8,109,061 7,857,296 8,071,431 5,628,320 3,372,170 13,182,950 18,795,525 7,281,361 7,855,456
Department of Correction 21,390,722 16,258,404 43,580,956 15,403,975 20,308,756 11,767,521 11,103,116 27,144,858 32,853,230 37,348,727
Department of Parks & Recreation
12,138,161 9,415,871 16,104,444 17,673,228 18,971,285 29,564,344 18,330,734 13,858,777 11,661,274 15,442,894
Fire Department 18,602,877 16,318,205 20,007,262 16,231,360 28,485,774 19,665,971 20,426,695 46,691,403 16,416,152 43,515,101
Department of Housing Preservation and Development
21,283,261 15,727,510 5,126,366 5,057,356 2,154,067 555,452 2,705,221 1,964,125 10,855,842 808,106
NYC Human Resources Administration
866,534 1,482,725 411,481 1,308,134 1,582,741 1,050,063 1,008,192 970,799 1,756,131 620,453
Department of Buildings 1,413,458 380,236 112,152 2,941,818 218,006 377,908 157,901 268,913 2,966,514 1,386,120
Other 13,723,103 16,619,779 6,329,377 16,583,865 13,556,083 18,528,893 10,625,510 14,132,287 13,342,448 19,348,358
Total 544,920,651 557,831,786 523,298,524 553,920,714 487,363,528 495,060,010 568,859,233 588,972,701 639,159,911 675,613,599
43 Claims Report: Fiscal Year 2017
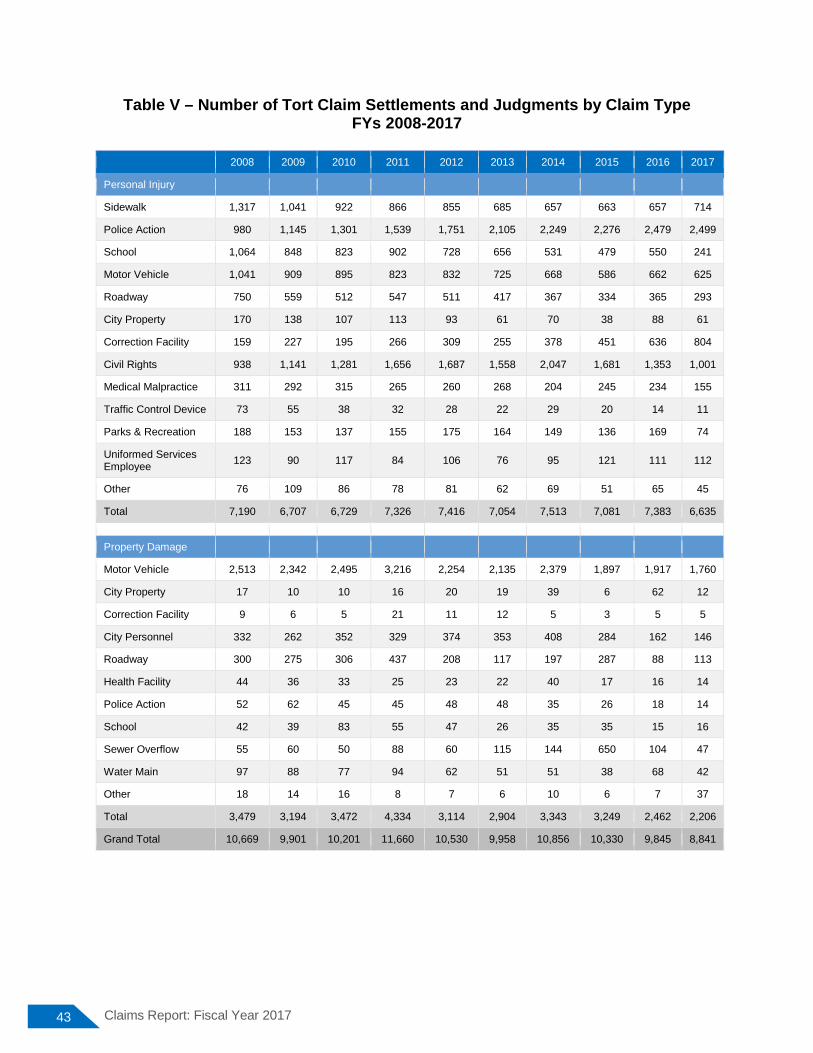
Table V – Number of Tort Claim Settlements and Judgments by Claim Type FYs 2008-2017
2008 2009 2010 2011 2012 2013 2014 2015 2016 2017
Personal Injury
Sidewalk 1,317 1,041 922 866 855 685 657 663 657 714
Police Action 980 1,145 1,301 1,539 1,751 2,105 2,249 2,276 2,479 2,499
School 1,064 848 823 902 728 656 531 479 550 241
Motor Vehicle 1,041 909 895 823 832 725 668 586 662 625
Roadway 750 559 512 547 511 417 367 334 365 293
City Property 170 138 107 113 93 61 70 38 88 61
Correction Facility 159 227 195 266 309 255 378 451 636 804
Civil Rights 938 1,141 1,281 1,656 1,687 1,558 2,047 1,681 1,353 1,001
Medical Malpractice 311 292 315 265 260 268 204 245 234 155
Traffic Control Device 73 55 38 32 28 22 29 20 14 11
Parks & Recreation 188 153 137 155 175 164 149 136 169 74
Uniformed Services Employee 123 90 117 84 106 76 95 121 111 112
Other 76 109 86 78 81 62 69 51 65 45
Total 7,190 6,707 6,729 7,326 7,416 7,054 7,513 7,081 7,383 6,635
Property Damage
Motor Vehicle 2,513 2,342 2,495 3,216 2,254 2,135 2,379 1,897 1,917 1,760
City Property 17 10 10 16 20 19 39 6 62 12
Correction Facility 9 6 5 21 11 12 5 3 5 5
City Personnel 332 262 352 329 374 353 408 284 162 146
Roadway 300 275 306 437 208 117 197 287 88 113
Health Facility 44 36 33 25 23 22 40 17 16 14
Police Action 52 62 45 45 48 48 35 26 18 14
School 42 39 83 55 47 26 35 35 15 16
Sewer Overflow 55 60 50 88 60 115 144 650 104 47
Water Main 97 88 77 94 62 51 51 38 68 42
Other 18 14 16 8 7 6 10 6 7 37
Total 3,479 3,194 3,472 4,334 3,114 2,904 3,343 3,249 2,462 2,206
Grand Total 10,669 9,901 10,201 11,660 10,530 9,958 10,856 10,330 9,845 8,841
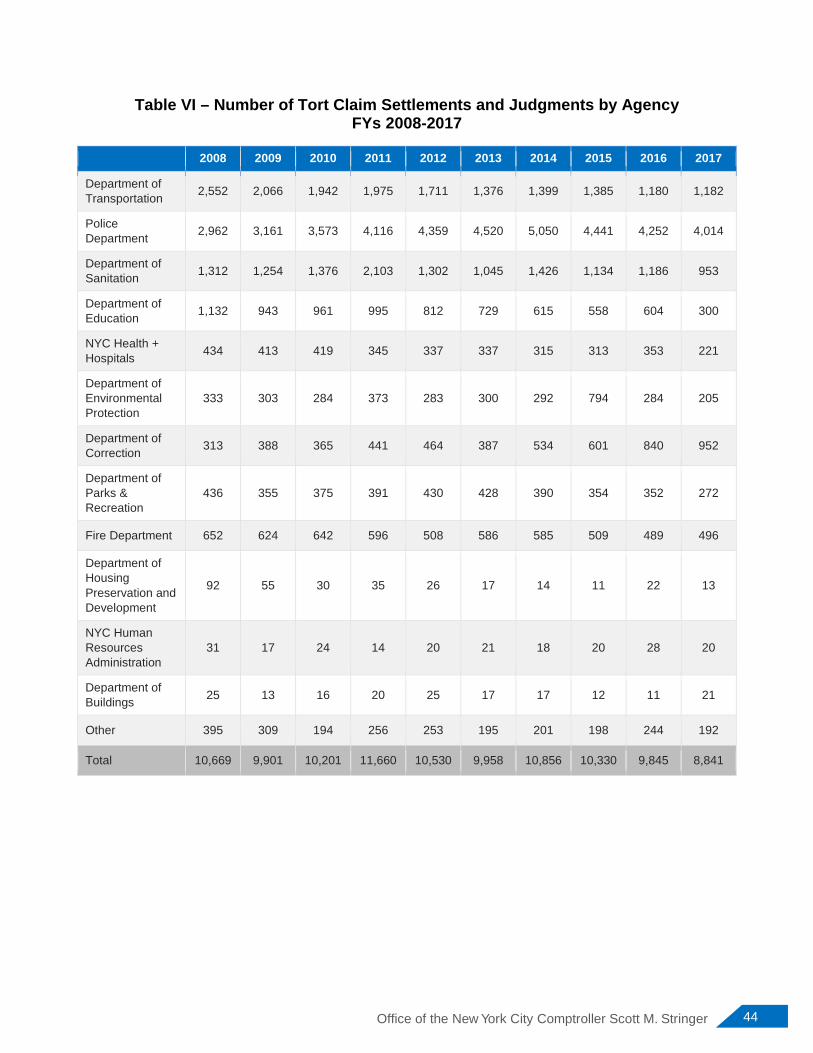
44 Office of the New York City Comptroller Scott M. Stringer
Table VI – Number of Tort Claim Settlements and Judgments by Agency FYs 2008-2017
2008 2009 2010 2011 2012 2013 2014 2015 2016 2017
Department of Transportation 2,552 2,066 1,942 1,975 1,711 1,376 1,399 1,385 1,180 1,182
Police Department 2,962 3,161 3,573 4,116 4,359 4,520 5,050 4,441 4,252 4,014
Department of Sanitation 1,312 1,254 1,376 2,103 1,302 1,045 1,426 1,134 1,186 953
Department of Education 1,132 943 961 995 812 729 615 558 604 300
NYC Health + Hospitals 434 413 419 345 337 337 315 313 353 221
Department of Environmental Protection
333 303 284 373 283 300 292 794 284 205
Department of Correction 313 388 365 441 464 387 534 601 840 952
Department of Parks & Recreation
436 355 375 391 430 428 390 354 352 272
Fire Department 652 624 642 596 508 586 585 509 489 496
Department of Housing Preservation and Development
92 55 30 35 26 17 14 11 22 13
NYC Human Resources Administration
31 17 24 14 20 21 18 20 28 20
Department of Buildings 25 13 16 20 25 17 17 12 11 21
Other 395 309 194 256 253 195 201 198 244 192
Total 10,669 9,901 10,201 11,660 10,530 9,958 10,856 10,330 9,845 8,841
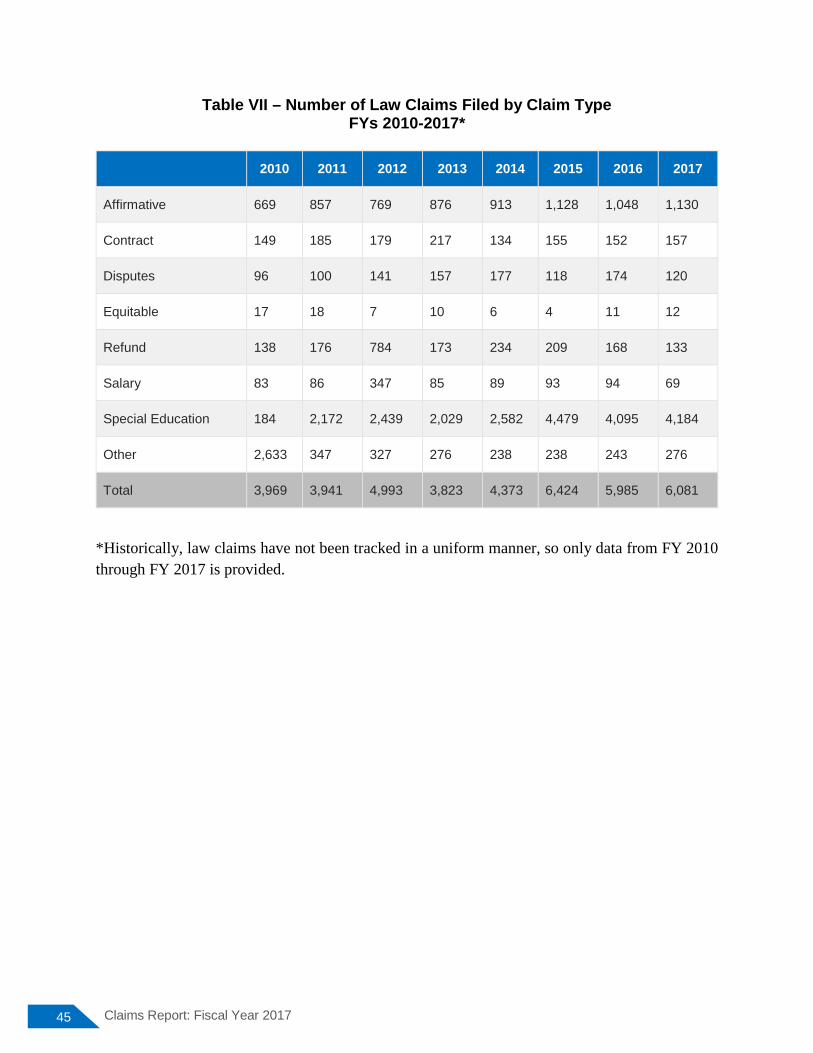
45 Claims Report: Fiscal Year 2017
Table VII – Number of Law Claims Filed by Claim Type FYs 2010-2017*
2010 2011 2012 2013 2014 2015 2016 2017
Affirmative 669 857 769 876 913 1,128 1,048 1,130
Contract 149 185 179 217 134 155 152 157
Disputes 96 100 141 157 177 118 174 120
Equitable 17 18 7 10 6 4 11 12
Refund 138 176 784 173 234 209 168 133
Salary 83 86 347 85 89 93 94 69
Special Education 184 2,172 2,439 2,029 2,582 4,479 4,095 4,184
Other 2,633 347 327 276 238 238 243 276
Total 3,969 3,941 4,993 3,823 4,373 6,424 5,985 6,081
*Historically, law claims have not been tracked in a uniform manner, so only data from FY 2010 through FY 2017 is provided.
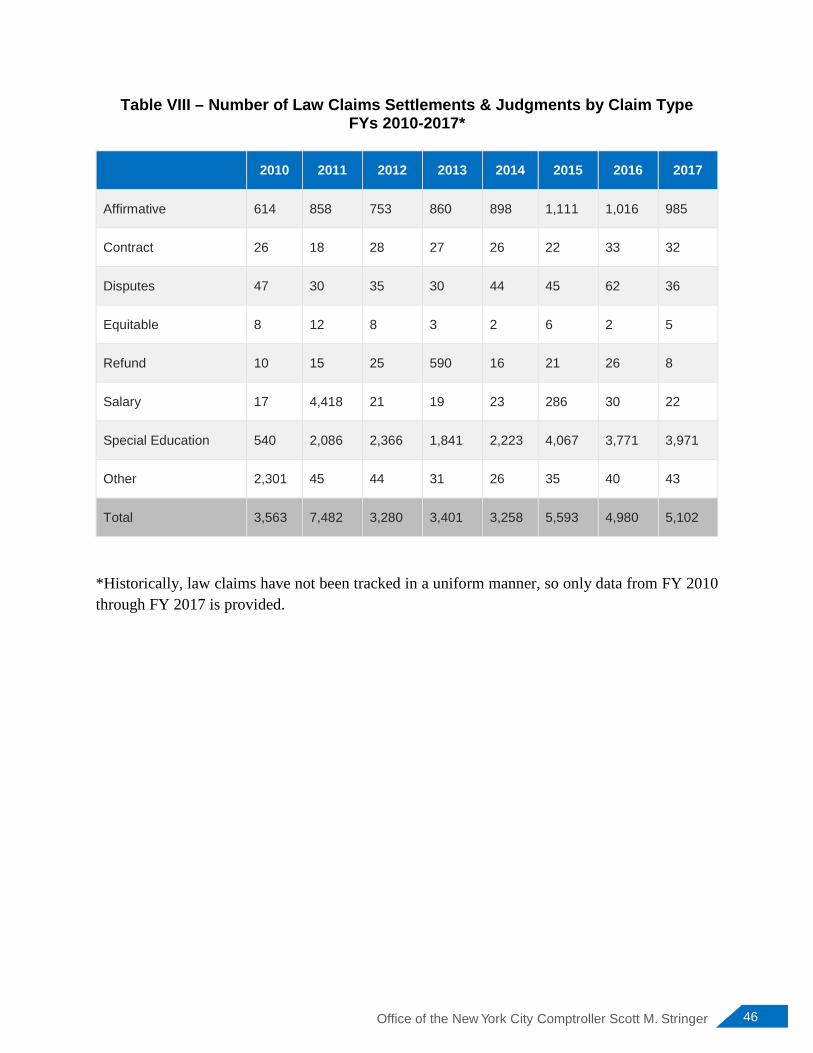
46 Office of the New York City Comptroller Scott M. Stringer
Table VIII – Number of Law Claims Settlements & Judgments by Claim Type FYs 2010-2017*
2010 2011 2012 2013 2014 2015 2016 2017
Affirmative 614 858 753 860 898 1,111 1,016 985
Contract 26 18 28 27 26 22 33 32
Disputes 47 30 35 30 44 45 62 36
Equitable 8 12 8 3 2 6 2 5
Refund 10 15 25 590 16 21 26 8
Salary 17 4,418 21 19 23 286 30 22
Special Education 540 2,086 2,366 1,841 2,223 4,067 3,771 3,971
Other 2,301 45 44 31 26 35 40 43
Total 3,563 7,482 3,280 3,401 3,258 5,593 4,980 5,102
*Historically, law claims have not been tracked in a uniform manner, so only data from FY 2010 through FY 2017 is provided.
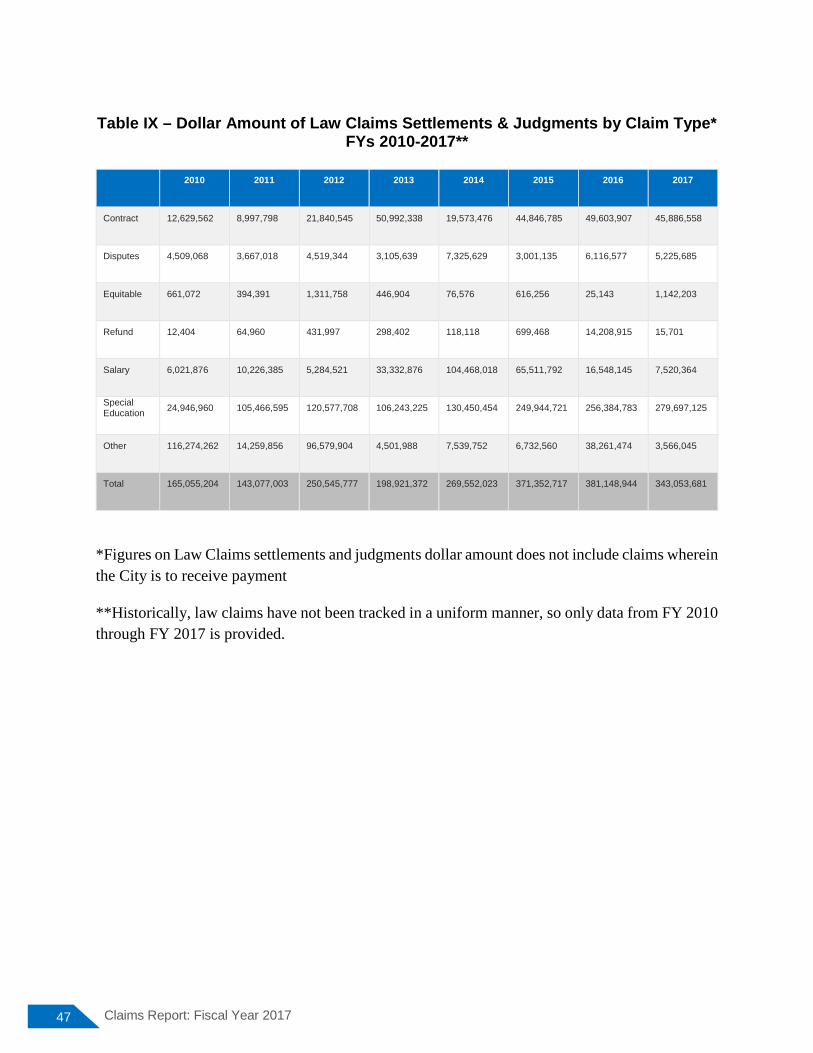
47 Claims Report: Fiscal Year 2017
Table IX – Dollar Amount of Law Claims Settlements & Judgments by Claim Type*
FYs 2010-2017**
2010 2011 2012 2013 2014 2015 2016 2017
Contract 12,629,562 8,997,798 21,840,545 50,992,338 19,573,476 44,846,785 49,603,907 45,886,558
Disputes 4,509,068 3,667,018 4,519,344 3,105,639 7,325,629 3,001,135 6,116,577 5,225,685
Equitable 661,072 394,391 1,311,758 446,904 76,576 616,256 25,143 1,142,203
Refund 12,404 64,960 431,997 298,402 118,118 699,468 14,208,915 15,701
Salary 6,021,876 10,226,385 5,284,521 33,332,876 104,468,018 65,511,792 16,548,145 7,520,364
Special Education 24,946,960 105,466,595 120,577,708 106,243,225 130,450,454 249,944,721 256,384,783 279,697,125
Other 116,274,262 14,259,856 96,579,904 4,501,988 7,539,752 6,732,560 38,261,474 3,566,045
Total 165,055,204 143,077,003 250,545,777 198,921,372 269,552,023 371,352,717 381,148,944 343,053,681
*Figures on Law Claims settlements and judgments dollar amount does not include claims wherein the City is to receive payment
**Historically, law claims have not been tracked in a uniform manner, so only data from FY 2010 through FY 2017 is provided.
48 Office of the New York City Comptroller Scott M. Stringer
1 City Charter Chapter 5, § 93(i). 2 The Comptroller’s Office records claims data in its Omnibus Automated Image Storage and Information System
(OAISIS). This report is based on data available in OAISIS as of December 1, 2017. Since OAISIS is a dynamic system that is updated constantly, data in this report does not reflect values for matters that have occurred but have not yet been reported in OAISIS.
3 New York City’s tort claim costs are paid from the Judgments and Claims account established annually in the City’s General Fund, except H+H assumes financial responsibility for its settlements.
4 Historically, law claims have not been tracked in a uniform manner, so only data from FY 2010 through FY 2017 is provided.
5 NY Exec. Law § 632-a(1)(a), (b). 6 For the purposes of the Claims Report, “filed” describes those claims in which a notice of claim was timely filed
with the Comptroller’s Office; “settled” means any claim or lawsuit that was resolved and resulted in the City paying out money to claimant.
7 See Appendix A for a description of claim types. 8 For additional claim details, the top eight claims also appear in the “Top Tort Claims Adjudicated in FY 2017” located on p.37. 9 HH operates 11 acute care hospitals. 10 Personal injury and property damage claims are analyzed by borough based on location of incident. Some notices
of claim are filed without borough specific information or allege incidents that occurred outside the five boroughs. Law claims are not tracked by borough. Population statistics do not take into account commuters or tourists.
11 The United States Census Bureau estimated as of July 1, 2015 the total population for New York City was 8,550,405 residents. In order of population the boroughs are: Brooklyn (2,629,150 or 31 percent of the total population); Queens (2,333,054 or 27 percent of the total population); Manhattan (1,643,734 or 19 percent of the total population); Bronx (1,455,720 or 17 percent of the total population); and Staten Island (476,015 or six percent of the total population). Statistics do not take into account commuters and tourists.
12 Rounded to the nearest whole claim. 13 These numbers include both claims by parents for reimbursement of special education costs and tuition and claims
for attorneys’ fees where an underlying claim for special education reimbursement has been successful. 14 While the total number of law claims settlements and judgements include all resolved law claims, law claims
settlements and judgment payment figures do not include claims wherein the City is to receive payment. 15 Claims for special education services costs and tuition reimbursement submitted by the DOE for settlement at the
administrative level are for claims of more than $25,000. Claims submitted by DOE for attorneys’ fees where an underlying claim for special education reimbursement has been successful at the administrative level are for claims of more than $13,500. Requests for settlement authority submitted by the Office of the Corporation Counsel for special education reimbursement claims and attorneys’ fees claims that have proceeded to litigation are for claims in any amount.
16 Settled dispute claims only reflect those disputes for which the contractor and the Comptroller’s Office have agreed to a settlement that involves a monetary payout. These settlements do not include dispute claims where the Comptroller’s Office has issued a contract interpretation determination that has been accepted by the contractor.
17 Data regarding affirmative claims in the FY 2017 Claims Report reflect updated agency reporting that was not reflected in prior years’ Claims Reports.
18 Bernadine v. City of New York, 294 N.Y. 361, 365 (1945). 19 Id. 20 Court of Claims Act of 1920, L. 1920, ch. 922, and L. 1929, ch. 467, § 1. 21 General Municipal Law, Article § 50-e. Effective September 2010, claimants can file personal injury and property
damage claims electronically through the Comptroller’s website (http://comptroller.nyc.gov/services/for-the-public/claims/file-a-claim/).
22 General Municipal Law, Article 4, § 50-e. One notable exception is a claim under 42 U.S.C. § 1983, the Federal Civil Rights Act; a § 1983 action can be filed directly in court without filing a notice of claim if no state cause of action is asserted.
23 City Charter, Chapter 5, § 93(i).
ENDNOTES

49 Claims Report: Fiscal Year 2017
24 BLA investigates claims filed against the City; obtains and evaluates accident reports and other documents
provided by agencies; conducts field visits, interviews witnesses, and conducts hearings; evaluates liability and damages; and attempts to settle appropriate cases. The Comptroller’s Office Bureau of Engineering investigates construction contract claims and negotiates claim settlements, together with BLA and, if litigation is pending, the Office of the Corporation Counsel.
25 General Municipal Law, Article 4, § 50-i. A significant exception to this requirement is in the area of medical malpractice, in particular, claims for injuries to newborn infants.
26 City Charter, Chapter 17, § 394(c).
2 Office of the New York City Comptroller Scott M. Stringer
I.
New York City Comptroller
Scott M. Stringer
Office of the Comptroller • City of New York • One Centre Street, New York, NY 10007 • Phone: (212) 669-3500 • comptroller.nyc.gov
@NYCComptroller