Embed Size (px)
Citation preview
Clark County Buildable Lands
PAC Report
February 2021
Prepared for: Clark County
KOIN Center 222 SW Columbia Street
Suite 1600 Portland, OR 97201
503-222-6060

This page intentionally blank
Acknowledgements
ECONorthwest prepared this report for Clark County. ECONorthwest and Clark County thank those who helped provide input on the Vacant Buildable Lands Model and the Buildable Lands Update process.
Buildable Lands Project Advisory Committee
Bryan Snodgrass, City of Vancouver
Jim Malinowski, Clark County Citizen’s United
David McDonald, Friends of Clark County
Matt Swindell, Clark County Planning Commission1
Eric Golemo, Development Engineering Advisory Board
Marjorie Ledell, City of Vancouver Planning Commission
Jamie Howsley, Development Engineering Advisory Board
Rian Davis, Clark County Realtors Association2
Jeff Swanson, City of La Center
Ron Barca, Clark County Planning Commission
Jennifer Baker, Columbia River Economic Development Council
Ryan Makinster, Building Industry Association
Jerry Olson, Responsible Growth Forum
Stephen Abramson, Neighborhood Associations Council
Clark County Staff
Oliver Orjiako, Community Planning Director Jose Alvarez, Community Planning, Planner III Bob Pool, GIS Manager
ECONorthwest
Bob Parker, Project Director Becky Hewitt, Project Manager Margaret Raimann, Technical Manager
AHBL
Wayne Carlson, Principal Nicole Stickney, Planning Project Manager
1 Resigned from committee in September 2020
2 Resigned from committee in December 2020
Table of Contents EXECUTIVE SUMMARY .......................................................................................................................................... I
BLPAC PROCESS ........................................................................................................................................................ I RECOMMENDATIONS FROM THE PAC ............................................................................................................................. I ADDITIONAL POTENTIAL REFINEMENTS ......................................................................................................................... IV NEXT STEPS FOR COUNCIL ........................................................................................................................................ VIII
1. INTRODUCTION ........................................................................................................................................... 1 BLPAC PROCESS ...................................................................................................................................................... 1 TOPICS REVIEWED BY THE BLPAC ................................................................................................................................ 2 REPORT OVERVIEW ................................................................................................................................................... 3
2. BLPAC RECOMMENDATIONS ........................................................................................................................ 4 RESIDENTIAL LAND CLASSIFICATION: INDEX BUILDING VALUE THRESHOLD ............................................................................ 4 RESIDENTIAL LAND CLASSIFICATION: VACANT PLATTED LOTS ............................................................................................. 5 RESIDENTIAL LAND CLASSIFICATION: SMALL UNDERUTILIZED LOTS ...................................................................................... 6 RESIDENTIAL AND EMPLOYMENT LAND CLASSIFICATIONS: TAX-EXEMPT PROPERTIES .............................................................. 8 EMPLOYMENT LAND CLASSIFICATION: INDEX BUILDING VALUE .......................................................................................... 9 EMPLOYMENT LAND CLASSIFICATION: ACCOUNT FOR ACTIVE BUSINESS USE ........................................................................ 9 EMPLOYMENT LAND CLASSIFICATION: EMPLOYMENT DENSITY ......................................................................................... 10 ACCOUNTING FOR REDEVELOPMENT .......................................................................................................................... 13 MODELING MIXED USE AREAS .................................................................................................................................. 15 MARKET FACTOR .................................................................................................................................................... 18 POPULATION CAPACITY ............................................................................................................................................ 21 INFRASTRUCTURE GAPS ............................................................................................................................................ 22 RURAL LAND CAPACITY ............................................................................................................................................ 23
3. ADDITIONAL POTENTIAL REFINEMENTS ..................................................................................................... 26 EMPLOYMENT LAND: EXCESS AND REARAGE ACRES ....................................................................................................... 26 POPULATION CAPACITY ............................................................................................................................................ 28 CRITICAL LANDS ...................................................................................................................................................... 33 INFRASTRUCTURE SET-ASIDES ................................................................................................................................... 35

This page intentionally blank
ECONorthwest Clark County Buildable Lands PAC Report - February 2021 i
Executive Summary
The Buildable Lands Program (RCW.70A.215) requires local governments to monitor the amount and density of residential, commercial, and industrial development that has occurred since adoption or revision of a jurisdiction’s GMA comprehensive plan. This analysis, called the Buildable Lands Report, is an evaluation of the adequacy of the remaining suitable residential, commercial, and industrial land supply within urban growth areas (UGAs) to accommodate projected growth at observed development densities.
In late 2019, Clark County contracted with ECONorthwest and AHBL to assist in identifying and addressing needed updates to the County’s Buildable Lands Methodology and Vacant Buildable Lands Model (VBLM), and preparation for a 2021 Buildable Lands Report.3 The consultant team worked with the Clark County Buildable Lands Team (the Project Team) and a Buildable Lands Project Advisory Committee (BLPAC). The role of the BLPAC was to consider options for updating the methodology and make recommendations to County Council on preferred methods and options based on analysis by the Project Team. This report provides a summary of the meetings of the BLPAC and their recommendations to County Council.
BLPAC Process
The BLPAC met eight times between December 2019 and January 2021 to review analysis, findings, and preliminary recommendations from the Project Team (the consultant team and County staff) for whether and what refinements to the County’s buildable lands methodology are needed to address the issue. The BLPAC gave preliminary recommendations on some of the topics during the course of the early meetings, and took final votes on most recommendations at the final meeting, after reviewing results of preliminary runs of the VBLM to understand the impact of the potential changes. The BLPAC worked towards consensus to the greatest degree possible in making their recommendations to the Council.
Recommendations from the PAC
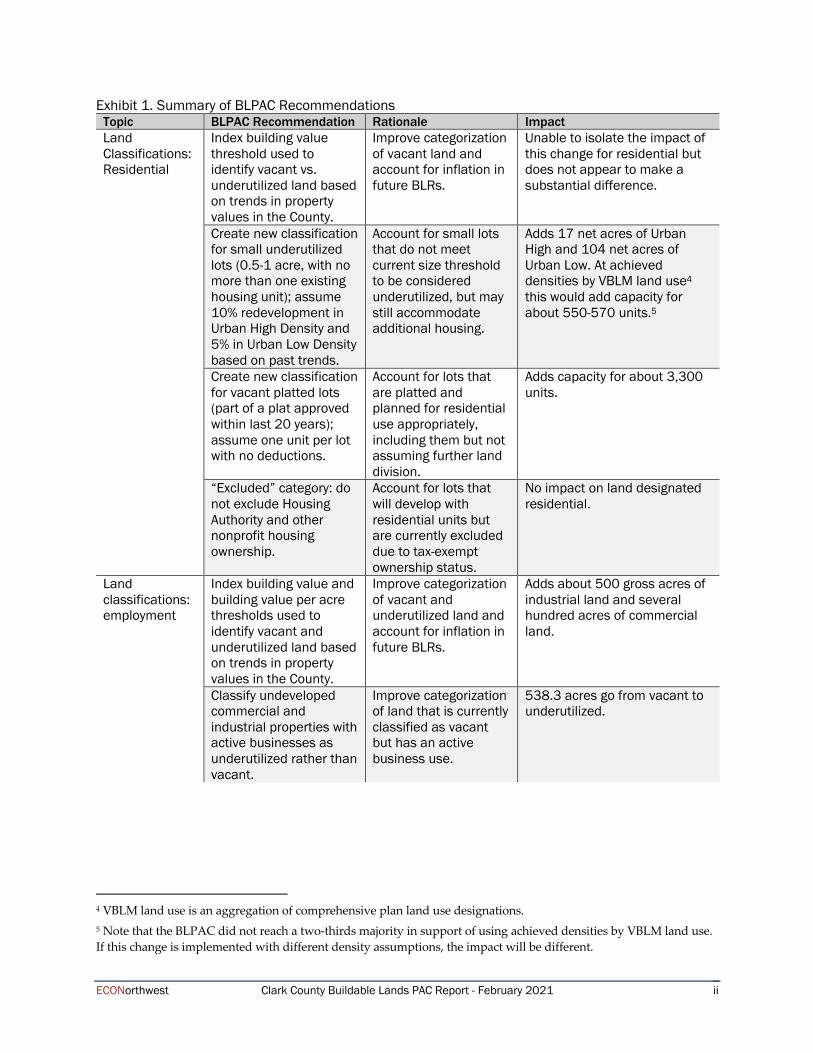
During their final meeting on January 6, 2021, the BLPAC voted on recommendations for refinements to the Buildable Lands methodology and assumptions. The refinements that had sufficient support to become recommendations from the BLPAC are summarized in Exhibit 1.
3 In 2017, Washington Legislature passed E2SSB 5254 which amended the Buildable Lands statute (RCW 36.70A.215).
The Department of Commerce prepared an updated guidebook (Buildable Lands Program Guidelines) in 2018. The
guidebook describes best practices and methodologies related to preparing buildable land reports. Clark County has
to complete its Buildable Lands Update and submit to the Department of Commerce by June 30, 2021.
ECONorthwest Clark County Buildable Lands PAC Report - February 2021 ii
Exhibit 1. Summary of BLPAC Recommendations Topic BLPAC Recommendation Rationale Impact Land Classifications: Residential
Index building value threshold used to identify vacant vs. underutilized land based on trends in property values in the County.
Improve categorization of vacant land and account for inflation in future BLRs.
Unable to isolate the impact of this change for residential but does not appear to make a substantial difference.
Create new classification for small underutilized lots (0.5-1 acre, with no more than one existing housing unit); assume 10% redevelopment in Urban High Density and 5% in Urban Low Density based on past trends.
Account for small lots that do not meet current size threshold to be considered underutilized, but may still accommodate additional housing.
Adds 17 net acres of Urban High and 104 net acres of Urban Low. At achieved densities by VBLM land use4 this would add capacity for about 550-570 units.5
Create new classification for vacant platted lots (part of a plat approved within last 20 years); assume one unit per lot with no deductions.
Account for lots that are platted and planned for residential use appropriately, including them but not assuming further land division.
Adds capacity for about 3,300 units.
“Excluded” category: do not exclude Housing Authority and other nonprofit housing ownership.
Account for lots that will develop with residential units but are currently excluded due to tax-exempt ownership status.
No impact on land designated residential.
Land classifications: employment
Index building value and building value per acre thresholds used to identify vacant and underutilized land based on trends in property values in the County.
Improve categorization of vacant and underutilized land and account for inflation in future BLRs.
Adds about 500 gross acres of industrial land and several hundred acres of commercial land.
Classify undeveloped commercial and industrial properties with active businesses as underutilized rather than vacant.
Improve categorization of land that is currently classified as vacant but has an active business use.
538.3 acres go from vacant to underutilized.
4 VBLM land use is an aggregation of comprehensive plan land use designations.
5 Note that the BLPAC did not reach a two-thirds majority in support of using achieved densities by VBLM land use.
If this change is implemented with different density assumptions, the impact will be different.
ECONorthwest Clark County Buildable Lands PAC Report - February 2021 iii
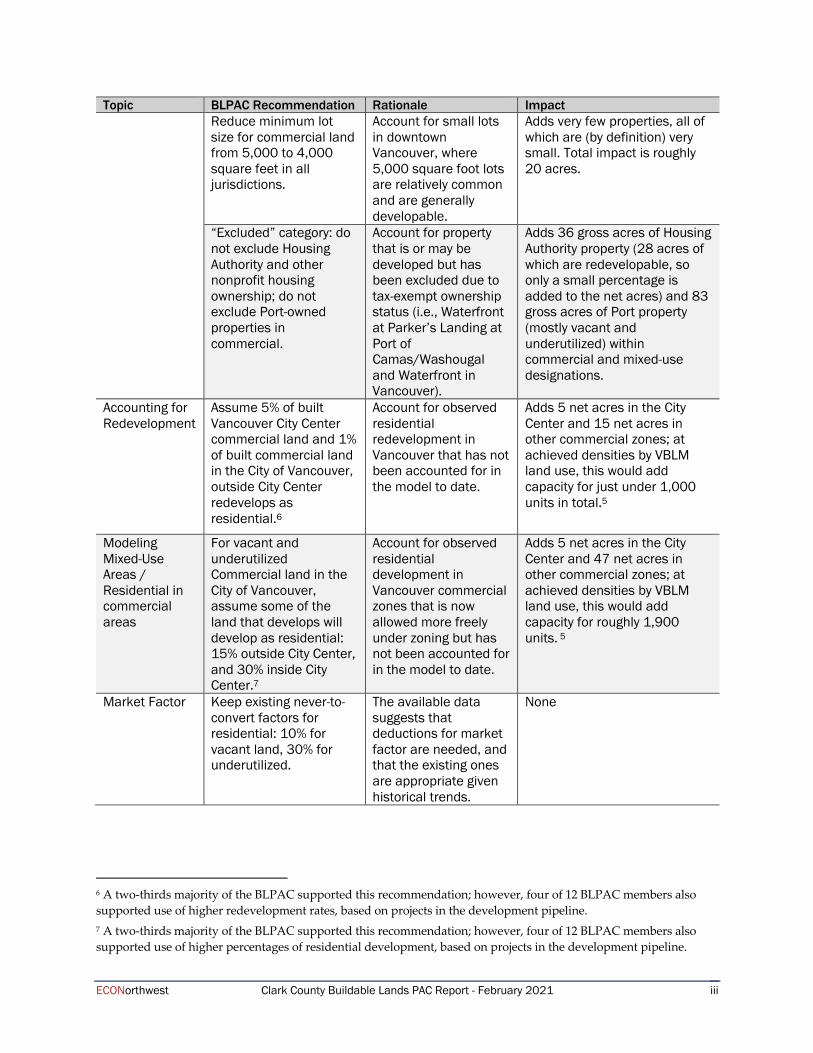
Topic BLPAC Recommendation Rationale Impact Reduce minimum lot size for commercial land from 5,000 to 4,000 square feet in all jurisdictions.
Account for small lots in downtown Vancouver, where 5,000 square foot lots are relatively common and are generally developable.
Adds very few properties, all of which are (by definition) very small. Total impact is roughly 20 acres.
“Excluded” category: do not exclude Housing Authority and other nonprofit housing ownership; do not exclude Port-owned properties in commercial.
Account for property that is or may be developed but has been excluded due to tax-exempt ownership status (i.e., Waterfront at Parker’s Landing at Port of Camas/Washougal and Waterfront in Vancouver).
Adds 36 gross acres of Housing Authority property (28 acres of which are redevelopable, so only a small percentage is added to the net acres) and 83 gross acres of Port property (mostly vacant and underutilized) within commercial and mixed-use designations.
Accounting for Redevelopment
Assume 5% of built Vancouver City Center commercial land and 1% of built commercial land in the City of Vancouver, outside City Center redevelops as residential.6
Account for observed residential redevelopment in Vancouver that has not been accounted for in the model to date.
Adds 5 net acres in the City Center and 15 net acres in other commercial zones; at achieved densities by VBLM land use, this would add capacity for just under 1,000 units in total.5
Modeling Mixed-Use Areas / Residential in commercial areas
For vacant and underutilized Commercial land in the City of Vancouver, assume some of the land that develops will develop as residential: 15% outside City Center, and 30% inside City Center.7
Account for observed residential development in Vancouver commercial zones that is now allowed more freely under zoning but has not been accounted for in the model to date.
Adds 5 net acres in the City Center and 47 net acres in other commercial zones; at achieved densities by VBLM land use, this would add capacity for roughly 1,900 units. 5
Market Factor Keep existing never-to-convert factors for residential: 10% for vacant land, 30% for underutilized.
The available data suggests that deductions for market factor are needed, and that the existing ones are appropriate given historical trends.
None
6 A two-thirds majority of the BLPAC supported this recommendation; however, four of 12 BLPAC members also
supported use of higher redevelopment rates, based on projects in the development pipeline.
7 A two-thirds majority of the BLPAC supported this recommendation; however, four of 12 BLPAC members also
supported use of higher percentages of residential development, based on projects in the development pipeline.
ECONorthwest Clark County Buildable Lands PAC Report - February 2021 iv
Topic BLPAC Recommendation Rationale Impact Population Capacity
If County Council decides to use achieved density8 as the basis for residential land capacity,9 the County should first work with jurisdictions to refine the data to remove outliers and anomalies.
Improve residential density assumptions to better reflect historic development trends by VBLM land use.
Unknown
Employment Density
Retain existing employment density assumptions.
Case study analysis shows that existing assumptions are within typical employment densities. Washington employment data is not available at the local level that would allow for a more detailed analysis of densities.
None
Infrastructure Gaps
Do not exclude any land on the basis of infrastructure gaps; however, continue to apply reduced capacity assumptions for Yacolt due to lack of sewer facilities.
Jurisdictions are required to serve land within the UGA within 20 years. Jurisdictions surveyed did not indicate infrastructure gaps to factor into the model.
None
Rural Land Capacity
Keep existing methodology as described in Attachment B.
Align with Buildable Lands Guidance on collection of data on urban and rural land uses.
None
Additional Potential Refinements
The BLPAC did not reach a two-thirds majority on some of the Project Team’s proposed recommendations. This section summarizes each of the potential refinements that received partial BLPAC support, the options that the Project Team presented to the BLPAC, the impacts to the model results, and the range of BLPAC’s perspectives related to the recommendation.
8 “Achieved density” is defined as the actual density of housing that has been constructed since the last periodic
evaluation.
9 The BLPAC was split on whether to use achieved density in the VBLM; however, the County is required to consider
achieved densities, whether they are used in the VBLM or not. This is discussed further below.
ECONorthwest Clark County Buildable Lands PAC Report - February 2021 v
Account for Excess and Rearage Acres on Built Land in Employment Land Supply
Project Team Recommendation: Include areas identified as “excess” and “rearage” by the Assessor on commercial and industrial sites classified as built to the model results as net available acres, assuming that 75% of “excess” land will develop, and that 20% of “rearage” land will develop.10
Rationale: The County Assessor maintains data related to the assessment of additional available acreage for commercial and industrial uses. This includes acreage on lots that have an existing use, but the site may have available acreage that is not actively in use. As part of their method, the Assessor evaluates both “excess” and “rearage” acreage. Excess is defined as extra acreage that is developable on a parcel, generally with its own street frontage. Rearage is land that is located behind the primary development on the parcel; it generally lacks frontage and/or access. The Assessor estimated that 75% of identified excess land will develop, while only 20% of rearage land will develop.
Impact: This would result in adding about 217 net acres of industrial land and about 38 net acres of commercial land.11
BLPAC Perspectives: Seven BLPAC members voted in support of this recommendation; five were opposed. In previous meetings where this topic was discussed, BLPAC members were largely in support of the concept, though several expressed concerns about the accuracy of the employment land supply in the model overall. In general, the model is a long-range planning tool and does not distinguish between land that is “shovel ready” and land lacking infrastructure or environmental mitigation. (Several members raised concerns at various points in the process that the employment land included in the model includes land that is not viable for employment use, but did not identify specific parcels of concern.) In the final meeting, CREDC representative Jennifer Baker requested that this item be voted on separately from other refinements that were part of a “consent agenda” of items that the BLPAC had generally supported in prior meetings. BLPAC members who voted against this recommendation in the final meeting did not state specific reasons, as time for discussion was limited.
Population Capacity
Project Team Recommendation: Use achieved density by VBLM land use (Urban Residential High vs. Urban Residential Low) in the residential model. (The model currently uses policy target densities for each UGA.)
Rationale: The County is required to determine land needs based on the actual density of development (RCW 36.70A.215(3)(e)). Currently, the County complies with this by calculating achieved density by UGA overall and considering this in determining land needs, in addition to
10 Based on communication with Clark County Assessor’s Office in April 2020.
11 Note that the impact estimates were revised since the information provided to the BLPAC to correctly reflect the
75% and 20% of acreage to be included.
ECONorthwest Clark County Buildable Lands PAC Report - February 2021 vi
the policy target densities for each UGA. One approach suggested in the Department of Commerce Guidelines is to use achieved density by zoning or comprehensive plan designation. This is a more refined and accurate basis for achieved density, because it takes into account the zoned / planned density of the remaining vacant land. The Project Team evaluated both achieved density by zone and VBLM land use and concluded that VBLM land use would be more efficient to integrate in the model.
Impact: The average density achieved in Vancouver UGA overall was 10.4 dwelling units per acre—30 percent higher than the policy target density (8 dwelling units per acre). The overall impact on housing capacity was moderate in aggregate, but more pronounced in Vancouver.12
BLPAC Perspectives: Five BLPAC members voted in support of this recommendation; six were opposed. Several of those who supported the change indicated they felt that using observations and “ground truthing” was an important part of updates, and that the evidence in the record supports this refinement. One of the members who opposed the change expressed concern that assuming higher densities would then require development to continue at higher densities because less land would be available. In a prior meeting and discussion on this subject during the sixth meeting (before estimates of the impact and preliminary estimates of the actual achieved densities were available), all of the BLPAC members indicated they had no objection to the Project Team’s recommendation.
Should the Council elect to move forward with this refinement, as noted in Exhibit 1, the BLPAC voted in support (11 of 12) of the County working with jurisdictions to refine the density assumptions. Several members expressed concern with the details of the achieved density data and assumptions, including the impact of outliers on average densities. One suggested using medians rather than averages; others supported more general discussions with local staff to refine the data prior to establishing the assumption.
Infrastructure Set-Asides and Critical Lands
Project Team Recommendations:
§ Infrastructure Deduction:
§ Reconcile methodology differences with calculations used by the development industry by estimating infrastructure as percentage of buildable land.
§ Data supports infrastructure percentage deduction of 31.5% of developable acres.
§ Monitor how changes to regulations related to co-location of stormwater and wetland on a tract affect this percentage.
§ Critical Lands Deduction:
12 Meeting materials for BLPAC 8 provide more detail on achieved density impacts.
ECONorthwest Clark County Buildable Lands PAC Report - February 2021 vii
§ Clarify that the critical land deduction reflects a percent of mapped critical land in a plat that is required to be protected and is ultimately not developable.13 This is separate from the 10% and 30% market factors applied to vacant and underutilized residential land.
§ Data supports a critical land deduction of 40% of mapped critical lands.
§ Set all plat deductions for Urban Residential High in Vancouver at half the rate for Urban Residential Low to account for the fact that multifamily development (which represents roughly half of development in the Urban Residential High designation) generally does not set aside infrastructure in separate tracts.
Rationale: Multiple BLPAC members expressed concerns early in the process that the infrastructure deduction was too low and failed to account for recent changes to stormwater regulations. In addition, there was confusion regarding the critical lands deductions and their relationship to the infrastructure deduction. The goal of this update was to provide an independent review of the infrastructure calculations to verify the deductions and clarify the relationship to critical lands.
The Project Team did extensive analysis of data related to observed infrastructure needs as well as analysis of development and preservation of critical lands, with engineering firm AHBL providing analysis and guidance, particularly on issues related to stormwater regulations. The analysis showed the following reasons to update the infrastructure and critical lands deductions:
1. New stormwater regulations have increased the stormwater component of infrastructure set-asides. While these regulations do not apply to all jurisdictions yet, the Project Team anticipates that they will within the planning horizon.
2. Upcoming updates to the County’s Critical Areas Ordinance (CAO) to address co-location of stormwater management within wetlands will further increase stormwater set-asides in the future.
3. The County’s methodology for calculating infrastructure percentages in the past differed from that recommended by the development industry—the percentages proposed by the development industry were based on a percentage of developable acres (after excluding critical lands) rather than a percentage of gross (total) acres in the plat. Calculating the set-asides as a percent of developable acres, which is an appropriate approach, increases the set-aside percentage, even without accounting for other differences.
4. The critical lands deduction is more appropriately described as a deduction based on the share of mapped critical lands that are preserved when a property is platted rather than
13 Mapped critical lands may be developable for several reasons, including: mapping errors, allowed uses within
buffer areas, areas like critical aquifer recharge areas that can generally be developed, and other options to develop
on critical lands through a discretionary process with adequate technical documentation.
ECONorthwest Clark County Buildable Lands PAC Report - February 2021 viii
an additional market factor. Based on an analysis of recent plats, roughly 40% of critical lands is ultimately not developed when the parent parcel is platted.
The third and fourth items above were discovered later in the process of working with the BLPAC; most of the early refinements from AHBL focused on previous regulation changes and upcoming regulation changes.
Impact: The Project Team tested several prior iterations of potential refinements; none made a substantial difference to the overall capacity and total deductions. While the specific refinements proposed above were not tested in the preliminary VBLM runs, the Project Team believes the changes will be largely off-setting in their overall impact, but will improve the model’s accuracy in areas with critical lands.
BLPAC Perspectives: The BLPAC did not take a final vote on this topic. There were a wide range of opinions about the options under consideration by the BLPAC.
§ Four members expressed support for increasing the infrastructure deduction from 27.7% (in the current model) to 31.5% of developable acres (within the range identified in the Project Team’s final memo to the BLPAC on this subject).
§ Two members supported using the percentages previously estimated by AHBL (as a percentage of total acres), and specifically supported using reduced deductions in the Urban Residential High designation in Vancouver.
§ Several members expressed concern about double-counting deductions for critical lands by including both a market factor and a plat deduction.
§ Several members simply indicated a desire for data-driven assumptions on this subject.
Next Steps for Council
Council Time meeting will be scheduled for Council to provide direction to staff on moving forward to a hearing to adopt modifications to the Vacant Buildable Lands model and rural capacity estimates methodology.
Council hearing to adopt a resolution of amendments to the VBLM and rural capacity estimates.
Staff will run the model to estimate whether sufficient capacity exists to accommodate the 2015 -2035 population projections to include in the Buildable Lands Report.
Public hearing will be held with both the Planning Commission and Council on the Buildable Lands report prior to submittal to Department of Commerce on June 30, 2021.
ECONorthwest Clark County Buildable Lands PAC Report - February 2021 1
1. Introduction
The Buildable Lands Program (RCW.70A.215) requires local governments to monitor the amount and density of residential, commercial and industrial development that has occurred since adoption or revision of a jurisdiction’s GMA comprehensive plan. This analysis, called the Buildable Lands Report is an evaluation of the adequacy of the remaining suitable residential, commercial, and industrial land supply within urban growth areas (UGAs) to accommodate projected growth at observed development densities.
In 2017, Washington Legislature passed E2SSB 5254 which amended the Buildable Lands statute (RCW 36.70A.215). The Department of Commerce prepared an updated guidebook (Buildable Lands Program Guidelines) in 2018. The guidebook describes best practices and methodologies related to preparing buildable land reports, including an emphasis on “showing your work,” or using assumptions that are evidence-based. Clark County has to complete its Buildable Lands Update and submit to the Department of Commerce by June 30, 2021.
Clark County contracted with ECONorthwest and AHBL to assist in identifying and addressing needed updates to the County’s Buildable Lands Methodology and prepare the 2021 Buildable Lands Report in collaboration with the Clark County Buildable Lands Team (the Project Team) and a Buildable Lands Project Advisory Committee (BLPAC). The role of the BLPAC was to consider options for updating the methodology and make recommendations to County Council on preferred methods and options based on analysis by the Project Team. This report provides a summary of the meetings of the BLPAC, their recommendations to County Council, and topics with partial BLPAC support for additional refinement and discussion.
BLPAC Process
The BLPAC met eight times between December 2019 and January 2021. Meetings #3 through #8 were held virtually due to the Covid-19 pandemic. Each meeting included time for public comment, and the County also accepted written public testimony. All meeting materials and public testimony are posted on the County’s project webpage.14
The purpose of the BLPAC was to review research and analysis provided by the consultant team and County staff (“the Project Team”) related to each of the identified issues and make recommendations for whether and what refinements to the County’s VBLM methodology are needed to address the issue. The BLPAC worked towards consensus to the greatest degree possible in making their recommendations to the Council. The BLPAC’s meeting and decision protocols are included in Attachment A. The list of topics identified for consideration by the BLPAC is provided below. The VBLM methodology from 2015 is included for reference in Attachment C.
14 https://clark.wa.gov/community-planning/buildable-lands-project-advisory-committee
ECONorthwest Clark County Buildable Lands PAC Report - February 2021 2
At each meeting, the Project Team brought analysis and findings, along with preliminary recommendations on topics for the BLPAC to consider and discuss. The BLPAC discussed each topic and asked for follow up analysis where necessary. The Project Team sought preliminary recommendations from the BLPAC on some of the topics discussed during some of the first seven meetings but did not seek final votes on recommendations until the final meeting.
Prior to the final meeting, the Project Team completed preliminary runs of the VBLM for the BLPAC to review. The runs included a baseline model that used the existing assumptions, as well as three options that used variations of the recommended updates to assumptions. The details of each option are provided in the BLPAC Meeting 8 memorandum. The Project Team prepared a “Story Map” that illustrated the results of the potential model refinements, and highlighted particular changes that make the greatest impact on the estimated capacity.
Topics Reviewed by the BLPAC
In brief, the topics identified for discussion with the BLPAC and potential refinements identified at the beginning of the project include:
1. Land Classifications: The way land is classified as vacant, underutilized, built, etc. determines whether it is assumed to have potential for development in the buildable lands model.
2. Accounting for Redevelopment: The County’s model does not include an assumption for redevelopment on land classified as built; however, redevelopment is occurring in some urban areas (e.g., Vancouver City Center).
3. Modeling Mixed-Use Areas: The County’s methodology classifies lands into residential, commercial, and industrial based on comprehensive plan designations. Vacant and underutilized land in mixed use areas is assumed to generate a mix of residential and commercial capacity. Some commercial zones allow residential development (e.g., Vancouver City Center) but are not identified as mixed use.
4. Infrastructure Gaps: The new Buildable Lands legislation requires that counties must consider infrastructure gaps—including transportation, water, sewer, and stormwater—in identifying land suitable for development and reaching target densities on those lands.
5. Market Factor: The new legislation requires counties to analyze, justify, and apply an appropriate market supply factor when identifying land suitable for development.
6. Capacity on Rural Lands: Consider clarifications or refinements, if needed, to the approach to estimating capacity on land outside Urban Growth Areas.
7. Infrastructure Set-Asides: Consider whether refinements are needed to the County’s current assumptions for the amount of land that will be dedicated to streets, stormwater facilities, etc. to better align with observed development and/or changing regulations.
ECONorthwest Clark County Buildable Lands PAC Report - February 2021 3
8. Population Capacity: Consider whether refinements are needed to the County’s current assumptions for residential density to better align with observed development and/or changing regulations.
9. Employment Density: The current methodology uses densities based on observed development using data from the Washington Employment Security Department (ESD); however, ESD no longer provides access to this data, making it difficult to validate projections or adjust over time.
Report Overview
This document is organized into two sections:
§ BLPAC Recommendations. This section summarizes the BLPAC’s recommended updates to the VBLM and the supporting analysis for each final recommendation.
§ Additional Potential Refinements. This section summarizes additional topics that the BLPAC reviewed and discussed but did not vote to support as a recommendation. These topics with partial BLPAC support are presented as options for Council to consider, along with summaries of the BLPAC discussion.
ECONorthwest Clark County Buildable Lands PAC Report - February 2021 4
2. BLPAC Recommendations
The BLPAC supported for recommendations related to residential and employment land classifications, redevelopment, mixed use areas, market factor, population capacity, and employment density.15 This section provides each recommendation that the BLPAC supported, along with a summary of the evidence that supports this recommendation.
Residential Land Classification: Index Building Value Threshold
Land with more than $13,000 in building value is excluded from the vacant land category, and is either captured as underutilized or built. The value threshold does not update automatically over time. Because the improvement value threshold has not been updated since 2007 and does not automatically adjust with inflation, over time, it may have become a less accurate predictor of whether land is developed or vacant. The Project Team analyzed vacant and underutilized parcels from the 2007 VBLM to see how building value, building value per acre, and other factors are associated with a likelihood of development.
Recommendation
The BLPAC voted in support (11 of 12 members) of the following recommendation:
Index building value threshold used to identify vacant vs. underutilized land based on
trends in property values in the County.
Supporting Analysis
The PAC initially discussed this topic at the February 21, 2020 meeting (Meeting #2) and discussed additional Project Team analysis at the March 20, 2020 meeting (Meeting #3). The basis for the recommendation is summarized below.
§ The improvement value threshold has not been updated since 2007.
§ According to the County Assessor, building value is a reliable field with an annual update cycle in which values are reviewed for accuracy every year by the State and property owner.
§ While there are property type codes indicating current land use (including vacant), the County Assessor indicated these codes do not have an annual review cycle. They do not drive value, so they are not reviewed as rigorously and are assigned somewhat
15 BLPAC support for a recommendation means that at least two-thirds of the members present at the time of the vote
supported the recommendation. None of the recommendations were unanimous. The number of members voting in
favor is noted for each recommendation.
ECONorthwest Clark County Buildable Lands PAC Report - February 2021 5
differently by individual appraisers. The County Assessor did not recommend using property type codes to classify land in the VBLM.
§ While building value is not a perfect indicator of what land is vacant, the vast majority of vacant and underutilized land that is developing has a building value of zero.
§ When residential lands are valued based on a having a higher and better use than the current development, they can have a building value of zero, even though they have a housing unit; the house is declared “economically obsolescent.” Vacant and underutilized land with a unit on the property valued at or near $0 had a higher chance of converting.
§ There was little property with building values between $0 and $13,000 as of 2007.
Residential Land Classification: Vacant Platted Lots
Lots under 5,000 square feet are currently classified as “built” in the model (meaning they generate no capacity); however, several jurisdictions allow single family development on lots under 5,000 square feet, and this has become increasingly common. In addition, platted lots over 5,000 square feet are grouped with other vacant land that has yet to be platted.
Recommendation
The BLPAC voted in support (11 of 12 members) of the following recommendation:
Create new classification for vacant platted lots (part of a plat approved within last 20 years);
assume one unit per lot with no deductions.
The Project Team presented options for lot size thresholds for this new classification. In the initial VBLM runs presented at BLPAC Meeting #8, the results showed a minimal difference in the number of acres added to the model. The BLPAC supported the concept, and would accept either of the acreage thresholds presented. The Project Team recommends using a minimum lot size of 1,000 square feet (to capture all legal lots, even in zones that allow very small lots) and a maximum of 1 acre (to keep the break between vacant platted and other vacant land that may be further divided clear).
Supporting Analysis
The PAC initially discussed this topic at Meeting #2, and reviewed additional Project Team analysis at Meeting #3. The basis for the recommendation is summarized below.
§ Nearly 2,000 units were built on lots under 5,000 square feet that otherwise would have been identified as vacant (in other words, they met all the criteria except for the minimum lot size) from 2007 to 2019.

ECONorthwest Clark County Buildable Lands PAC Report - February 2021 6
§ Cities of Vancouver, Battle Ground, Camas, Washougal, Ridgefield, La Center and the unincorporated Vancouver UGA now allow single family detached housing on lots under 5,000 square feet.
§ These parcels need a separate category so that the same assumptions that are applied to larger vacant land (e.g., deductions for roads and infrastructure, environmental constraints, and market factor) are not applied to vacant platted lots.
§ The risk that vacant platted lots will have been developed before the comprehensive plan is updated is minimal because the VBLM is run at the beginning of each year. When updating the comprehensive plan, an end of year forecast is done by the County demographer, so that the VBLM and baseline population are as close to being in sync as possible. This baseline population is subtracted from the Office of Financial Management (OFM) projected population, as selected by Council, to determine the amount of growth that needs to be accommodated over the planning horizon. This means a minimal lag in the data. The platted lots account for much of the near-term capacity for housing, but the alignment in timing means that if the unit is not yet complete the population of that unit remains part of the population forecast.
§ Continuing to exclude lots under 1,000 square feet will exclude most remnant parcels that are not buildable. (The data shows that these generally did not develop.)
§ Limiting this classification to lots platted within the last 20 years will isolate lots platted under GMA rules. Older platted lots are more likely to have zoning that does not match the zoning when they were platted, making them more likely to be re-platted and possibly divided prior to development.
Residential Land Classification: Small Underutilized Lots
Lots under one acre with improvement values that exceed the threshold for vacant are considered built under the current methodology. Some of these may have further development potential, and the Project Team developed a recommendation for capturing the capacity on these lots in the model update.
Recommendation
The BLPAC voted in support (11 of 12 members) of the following recommendation:
Create new classification for small underutilized lots in Urban High Density (0.5-1ac, no
more than one housing unit, assuming 10% redevelopment).
Additionally, the BLPAC voted in support (10 of 12 members) of the following recommendation:
Apply the new classification for small underutilized lots to Urban Low Density Residential
as well, assuming 5% redevelopment.
ECONorthwest Clark County Buildable Lands PAC Report - February 2021 7
Supporting Analysis
The PAC initially discussed this topic at Meeting #2, and discussed additional Project Team analysis at Meeting #3. The basis for the recommendation is summarized below.
§ The majority (over 70%) of the residential land identified as built that converted with additional units between 2007 and 201916 was in lots over 20,000 square feet (roughly a half-acre).
§ In the Vancouver UGA, a higher percentage of land within the Urban High Density VBLM land use category converted than within the Urban Low Density land use category. The ability to create additional units on the property can also increase the likelihood of redevelopment or infill.
§ There was general support on the BLPAC for the concept of creating a new classification for lots between a half-acre and one acre with capacity for additional residential development, and the BLPAC agreed with the need to focus on lots with more capacity.
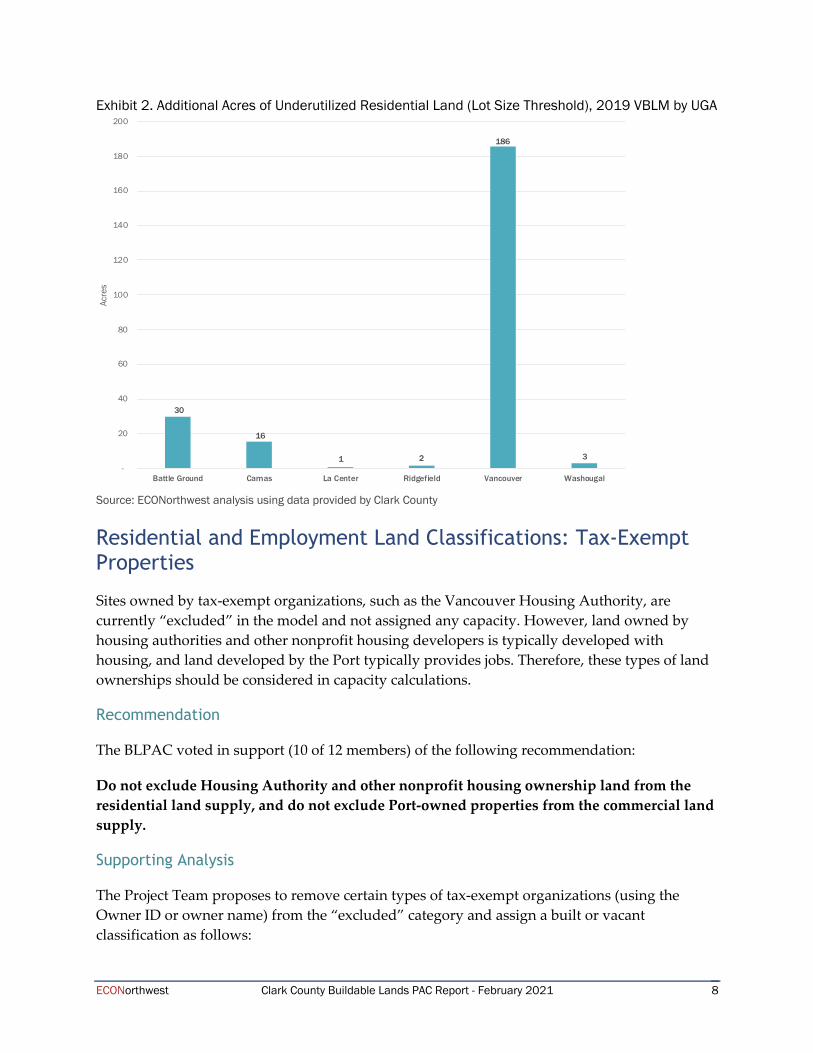
§ BLPAC members suggested that this approach apply to all UGAs, not just the Vancouver UGA. The Project Team reviewed the number of acres in the 2019 VBLM that would be included in this new classification in all Clark County UGAs. Exhibit 2 shows the number of acres that would be included in this classification for the 2019 residential VBLM. While this analysis shows that most of the acres are in Vancouver (186 acres), there are other UGAs with acres on lots that fit these criteria, including Battle Ground (30 acres) and Camas (16). While applying a redevelopment rate of 5-10% of these acres does not result in a large number of acres included in the capacity for residential land, it may help to improve the accuracy of the VBLM overall.
16 This analysis excludes land that was classified as built in the 2007 VBLM but has been identified for this analysis as
a vacant platted lot.
ECONorthwest Clark County Buildable Lands PAC Report - February 2021 8
Exhibit 2. Additional Acres of Underutilized Residential Land (Lot Size Threshold), 2019 VBLM by UGA
Source: ECONorthwest analysis using data provided by Clark County
Residential and Employment Land Classifications: Tax-Exempt Properties
Sites owned by tax-exempt organizations, such as the Vancouver Housing Authority, are currently “excluded” in the model and not assigned any capacity. However, land owned by housing authorities and other nonprofit housing developers is typically developed with housing, and land developed by the Port typically provides jobs. Therefore, these types of land ownerships should be considered in capacity calculations.
Recommendation
The BLPAC voted in support (10 of 12 members) of the following recommendation:
Do not exclude Housing Authority and other nonprofit housing ownership land from the
residential land supply, and do not exclude Port-owned properties from the commercial land
supply.
Supporting Analysis
The Project Team proposes to remove certain types of tax-exempt organizations (using the Owner ID or owner name) from the “excluded” category and assign a built or vacant classification as follows:
30
16
1 2
186
3 -
20
40
60
80
100
120
140
160
180
200
Battle Ground Camas La Center Ridgefield Vancouver Washougal
Acres

ECONorthwest Clark County Buildable Lands PAC Report - February 2021 9
§ Sites with no existing housing units would be classified as vacant and 100% of acres would be allocated to residential.
§ If the site has units, it would be considered built. The redevelopment rates and commercial/residential split (15/85) would apply based on the criteria defined in those sections of this memorandum. (This would also apply to sites with these owner IDs in the residential model.)
Employment Land Classification: Index Building Value
The existing methodology for employment land (i.e., commercial and industrial land) defines vacant land as parcels greater than 5,000 square feet and a building value less than $67,500. Underutilized land is defined as parcels greater than 5,000 square feet with a building value greater than $67,500 and a building value per acre less than $50,000. Parcels that are assessed with another parcel (indicating they are part of a larger site, such as a parking lot for a shopping center) are treated as built.
Recommendation
The BLPAC voted in support (11 of 12 members) of the following recommendation:
Index building value and building value per acre thresholds used to identify vacant and
underutilized land based on trends in property values in the County.
Supporting Analysis
At Meeting #2, the Project Team presented preliminary information related to commercial and industrial land that showed a noticeable amount of development on land classified as “built”, but the historical comparison of commercial and industrial model results were inconclusive. The Project Team observed challenges in analyzing data at the parcel level, as commercial development typically happens at a site level, composed of multiple parcels with multiple buildings or other active uses (e.g., parking lots). PAC members expressed concerns about the validity of building value as an indicator of whether a parcel is vacant or underutilized.
Employment Land Classification: Account for Active Business Use
In the current methodology, industrial sites with no structures or very low-value structures are included in the vacant category.
Recommendation
The BLPAC voted in support (11 of 12 members) of the following recommendation:
Classify undeveloped commercial and industrial properties with active businesses as
underutilized rather than vacant.
ECONorthwest Clark County Buildable Lands PAC Report - February 2021 10
Supporting Analysis
In an observation of the 2020 VBLM results, about 196 acres classified as vacant industrial land had associated business personal property accounts. Upon review of these parcels, about 7 acres were vacant, and the remaining land was classified as critical or had an active use. These remaining areas are better classified as underutilized.
The Project Team recommended that in cases where these sites have a business operation, consideration of personal business property information17 would exclude these sites from being identified as vacant. They would be identified as “underutilized” based on having a low building value per acre.
Employment Land Classification: Employment Density
Once the vacant buildable commercial and industrial lands have been identified, Clark County applies employment density assumptions (expressed as employees per acre or EPA) to the net developable acres to predict how much future employment that land can accommodate. The most recent methodology has one density assumption for commercial land (20 employees per acre) and another one for industrial land (9 employees per acre). The assumptions are the same for all UGAs. The densities have been set based on observed development using spatial data on employment from the Washington Employment Security Department (ESD) that allowed matching of specific employers to tax lots. The 2015 Buildable Lands Report (BLR) used employment data from 2014 to estimate employment density. The achieved densities were lower than the 2007 BLR, and the County continued to use the assumptions from the 2007 report. However, ESD no longer provides access to parcel-specific employment data, leaving Clark County (and all the other Buildable Lands Program counties) without a good data source to validate projections or adjust over time.
Recommendation
The BLPAC voted in support (11 of 12 members) of the following recommendation:
Retain existing employment density assumptions.
Supporting Analysis
Employment density of new development is also reported in the BLR. The most recent analysis uses data from 2006-2014 and relies on data from ESD as well as building permit data to
17 Businesses are required to pay property taxes on “personal property” (i.e., property that is “able to be moved from
one location to another and typically includes most machinery, equipment, furniture and fixtures associated with
commercial, industrial, or agricultural enterprises”). https://www.clark.wa.gov/assessor/business-personal-property-
faq#:~:text=If%20you%20own%20any%20business,real%20and%2For%20personal%20property.
ECONorthwest Clark County Buildable Lands PAC Report - February 2021 11
calculate the employment density of new commercial and industrial development for each UGA.
The employment density survey provides data that support assumptions used to determine land needed for employment uses. The statutory guidance from the program is codified in RCW 36.70A.215. Specifically, the following two subsections address density of employment:
Based on the actual density of development, review commercial, industrial, and housing needs by type and density range to determine the amount of land needed for these uses for the remaining portion of the current 20-year planning period (RCW 36.70A.215(3)(e));
Determine if there is sufficient employment capacity for the remainder of the planning period based upon planned and achieved densities (RCW 36.70A.215(3)(e));
Section 3 provides further guidance on how the data are used:
a. Determine whether there is sufficient suitable land to accommodate the countywide population projection established for the county pursuant to RCW 43.62.035 and the subsequent population allocations within the county and between the county and its cities and the requirements of RCW 36.70A.110;
b. Determine the actual density of housing that has been constructed and the actual amount of land developed for commercial and industrial uses within the urban growth area since the adoption of a comprehensive plan under this chapter or since the last periodic evaluation as required by subsection (1) of this section; and
c. Based on the actual density of development as determined under (b) of this subsection, review commercial, industrial, and housing needs by type and density range to determine the amount of land needed for commercial, industrial, and housing for the remaining portion of the twenty-year planning period used in the most recently adopted comprehensive plan.
The employment density survey provides data that support assumptions used to determine land needed for employment uses. Statutory guidance requires that the county determine land need and employment capacity based on the actual/achieved density of development and the actual amount of land developed for commercial and industrial uses within the UGA since the last periodic evaluation or last update of a comprehensive plan.18
The 2018 Buildable Lands Guidelines provide concise direction on the process and distill the requirements into two questions:
18 RCW 3670A.215(3)
ECONorthwest Clark County Buildable Lands PAC Report - February 2021 12
§ How much land was actually developed for commercial and industrial uses within the UGA since the last comprehensive plan was adopted or the last evaluation completed?
§ Based on this and other relevant information, how much land would be needed for commercial and industrial development during the remainder of the 20-year comprehensive planning period?
Thus, while the guidelines provide direction on how to address commercial and industrial development, they are not proscriptive and provide considerable local discretion with respect to methods and assumptions. Because the focus of this research is on employment density, we do not address other aspects of the methods related to commercial and industrial land other than to remark that the methods used by Clark County in the 2015 BLR are common in these types of studies.
Clark County currently uses an employees per acre (EPA) approach to employment density. As previously stated, the State no longer provides access to the detailed employment data previously used to calculate employment densities.
Results
While the Employment Security Department no longer releases the detailed employment data to the County, the Project Team contacted the ESD to summarize employment for built land in the commercial and industrial VBLM models and by UGA. The purpose of this analysis was to provide a trend of employment densities at generalized geographies in the County, and help check against previous assumptions used in the 2015 BLR methodology. ESD was not able to provide this analysis within the time period of the BLPAC process.
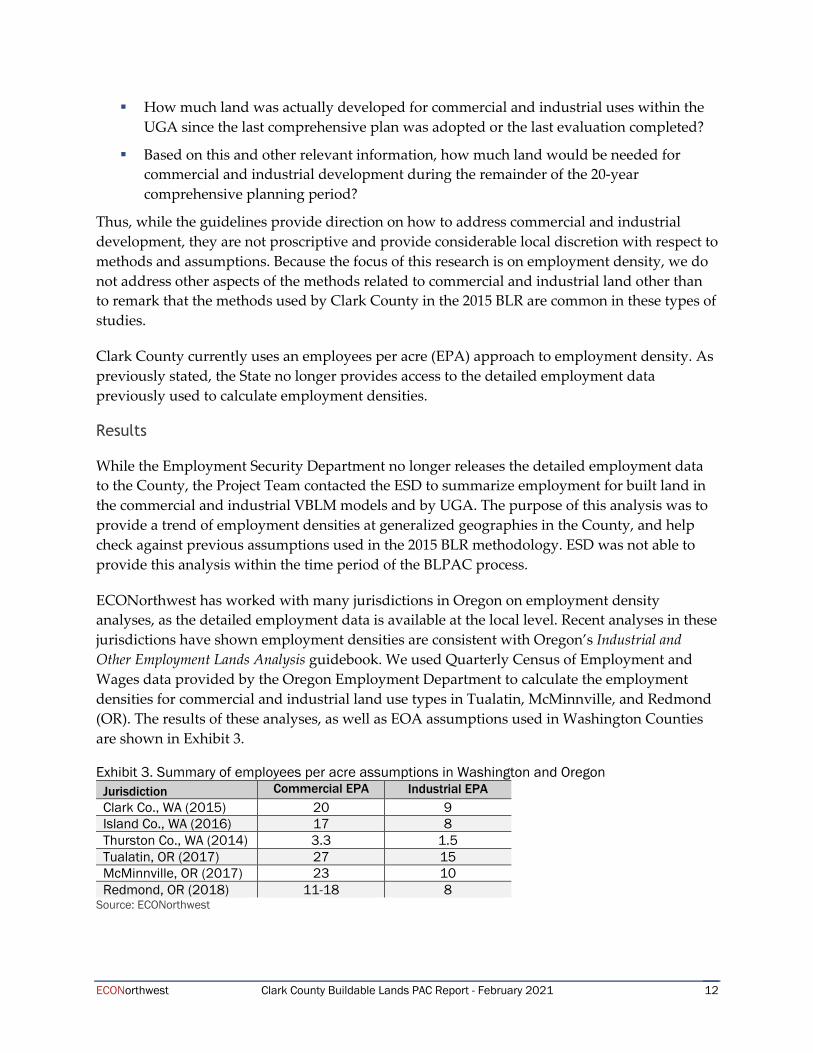
ECONorthwest has worked with many jurisdictions in Oregon on employment density analyses, as the detailed employment data is available at the local level. Recent analyses in these jurisdictions have shown employment densities are consistent with Oregon’s Industrial and Other Employment Lands Analysis guidebook. We used Quarterly Census of Employment and Wages data provided by the Oregon Employment Department to calculate the employment densities for commercial and industrial land use types in Tualatin, McMinnville, and Redmond (OR). The results of these analyses, as well as EOA assumptions used in Washington Counties are shown in Exhibit 3.
Exhibit 3. Summary of employees per acre assumptions in Washington and Oregon Jurisdiction Commercial EPA Industrial EPA Clark Co., WA (2015) 20 9 Island Co., WA (2016) 17 8 Thurston Co., WA (2014) 3.3 1.5 Tualatin, OR (2017) 27 15 McMinnville, OR (2017) 23 10 Redmond, OR (2018) 11-18 8
Source: ECONorthwest
ECONorthwest Clark County Buildable Lands PAC Report - February 2021 13
Employment Land Classifications: Commercial Minimum Lot Size
The existing methodology uses a minimum lot size for vacant employment land of 5,000 square feet.
Recommendation
The BLPAC voted in support (10 of 12 members) of the following recommendation:
Reduce minimum lot size for commercial land from 5,000 to 4,000 square feet in all
jurisdictions.
Supporting Analysis
There are many existing lots designated for commercial use, particularly in Vancouver, that are very close to 5,000 square feet; development has occurred on a number of those lots. The Project Team proposed to reduce the minimum lot size to 4,000 square feet for vacant commercial land in Vancouver in order to account for those properties (other criteria for vacant land would still apply).
Accounting For Redevelopment
The existing methodology includes a demand-side assumption that 5% of population and employment will be accommodated through redevelopment that is not captured in the VBLM.
Recommendation
The BLPAC voted in support (11 of 12 members) of the following recommendation:
Assume 5% of built Vancouver City Center commercial land and 1% of built commercial
land in Vancouver outside City Center redevelops as residential.
(Note: Four of 12 BLPAC members also supported use of higher percentages of residential development, based on projects in the development pipeline, but this modification to the recommendation did not receive support from two-thirds of the BLPAC members.)
Supporting Analysis
Redevelopment in the Vancouver City Center
The Project Team reviewed development in the Vancouver City Center between 2007 and 2019, including residential development that occurred. Land in this area is included in the commercial VBLM, and about 190 acres were classified as built in the 2007 VBLM. Of these, about 9 acres redeveloped with residential uses by 2020, as shown in Exhibit 4. This results in a
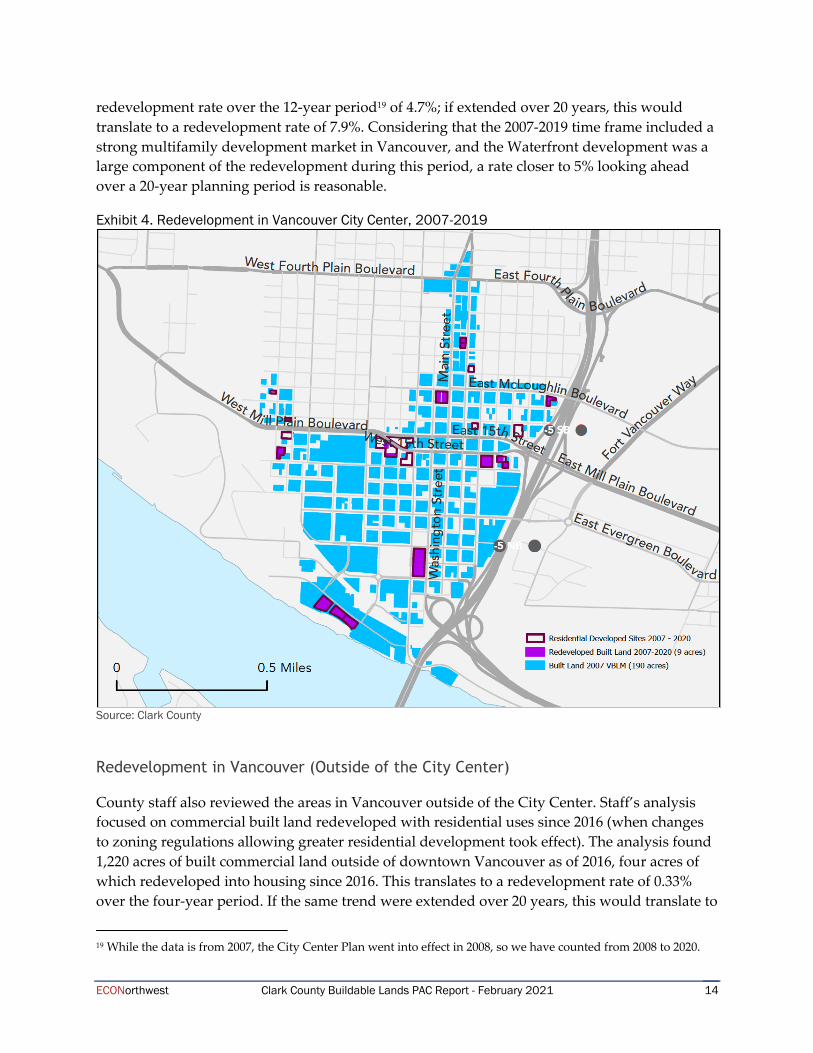
ECONorthwest Clark County Buildable Lands PAC Report - February 2021 14
redevelopment rate over the 12-year period19 of 4.7%; if extended over 20 years, this would translate to a redevelopment rate of 7.9%. Considering that the 2007-2019 time frame included a strong multifamily development market in Vancouver, and the Waterfront development was a large component of the redevelopment during this period, a rate closer to 5% looking ahead over a 20-year planning period is reasonable.
Exhibit 4. Redevelopment in Vancouver City Center, 2007-2019
Source: Clark County
Redevelopment in Vancouver (Outside of the City Center)
County staff also reviewed the areas in Vancouver outside of the City Center. Staff’s analysis focused on commercial built land redeveloped with residential uses since 2016 (when changes to zoning regulations allowing greater residential development took effect). The analysis found 1,220 acres of built commercial land outside of downtown Vancouver as of 2016, four acres of which redeveloped into housing since 2016. This translates to a redevelopment rate of 0.33% over the four-year period. If the same trend were extended over 20 years, this would translate to
19 While the data is from 2007, the City Center Plan went into effect in 2008, so we have counted from 2008 to 2020.
ECONorthwest Clark County Buildable Lands PAC Report - February 2021 15
redevelopment rate of about 1.7%. However, given that the 2016-2020 timeframe included a strong multifamily development market in Vancouver, a rate closer to 1% looking ahead over a 20-year planning period is reasonable.
Further discussion of the approach to accounting for residential development in commercial areas is addressed in the next section.
Other Residential Development on Commercial Land
County staff found that roughly 6% of units (832 out of 13,095) built between 2016 and 2020 developed on non-residential land, excluding the commercial areas in Vancouver. This suggests that even with the proposed refinements above, the model will be missing some residential capacity in locations that are difficult to predict. The Project Team recommended retaining the 5% demand-side redevelopment assumption for housing as well as for employment (since the number of employees on existing developed sites can increase with or without redevelopment).
Modeling Mixed Use Areas
Since 2016 the City of Vancouver has experienced residential growth on commercial land outside of the downtown area, due to recent policy changes that allow more flexibility for residential development in commercial zones. Zoning regulations allow developments that are primarily residential though they may have a commercial component. There is often more flexibility to meet requirements for commercial use through live/work units or horizontal mixed use (i.e., residential and commercial in separate buildings on the same site or as part of one development) in addition to vertically integrated mixed-use development (i.e., residential development with commercial on the ground floor). However, unlike areas zoned for mixed-use, these residential developments are not captured in the VBLM because the model does not currently assume any residential development on commercial land except if it is designated or zoned for mixed use.
Recommendation
The BLPAC voted in support (9 of 12 members) of the following recommendation:
For vacant and underutilized Commercial land in the City of Vancouver, assume some of the
land that develops will develop as residential: 15% outside City Center, and 30% inside City
Center.
The recommended splits are as follows:
§ Within City Center: 30% residential, 70% commercial
§ Outside City Center: 15% residential, 85% commercial
ECONorthwest Clark County Buildable Lands PAC Report - February 2021 16
(Note: Four of 12 BLPAC members also supported use of higher percentages of residential development, based on projects in the development pipeline, but this modification to the recommendation did not receive support from two-thirds of the BLPAC members.)
Supporting Analysis
Magnitude of Residential Development on Commercial Land
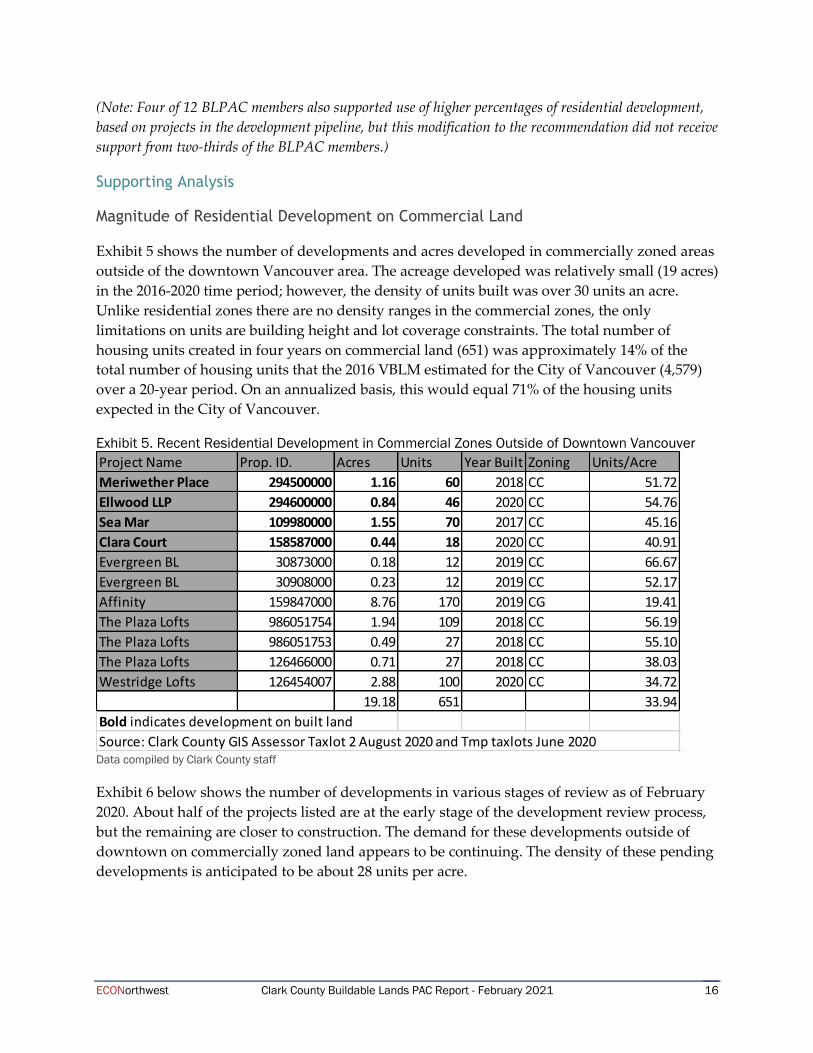
Exhibit 5 shows the number of developments and acres developed in commercially zoned areas outside of the downtown Vancouver area. The acreage developed was relatively small (19 acres) in the 2016-2020 time period; however, the density of units built was over 30 units an acre. Unlike residential zones there are no density ranges in the commercial zones, the only limitations on units are building height and lot coverage constraints. The total number of housing units created in four years on commercial land (651) was approximately 14% of the total number of housing units that the 2016 VBLM estimated for the City of Vancouver (4,579) over a 20-year period. On an annualized basis, this would equal 71% of the housing units expected in the City of Vancouver.
Exhibit 5. Recent Residential Development in Commercial Zones Outside of Downtown Vancouver
Data compiled by Clark County staff
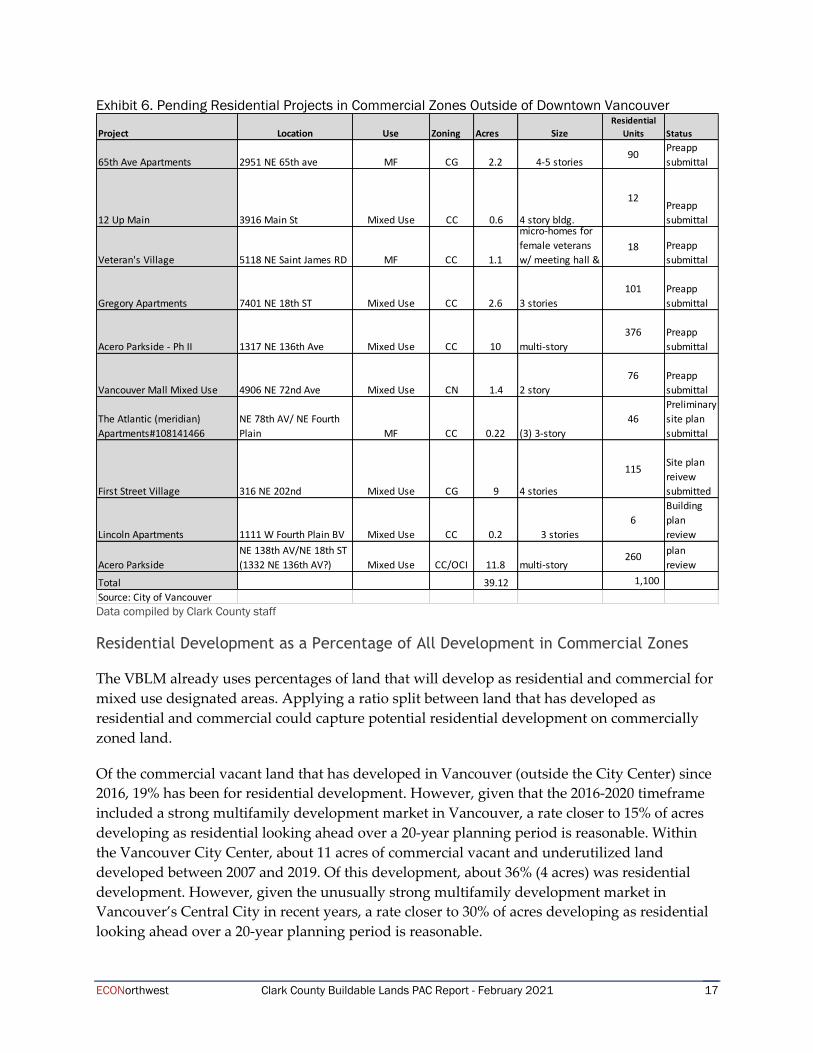
Exhibit 6 below shows the number of developments in various stages of review as of February 2020. About half of the projects listed are at the early stage of the development review process, but the remaining are closer to construction. The demand for these developments outside of downtown on commercially zoned land appears to be continuing. The density of these pending developments is anticipated to be about 28 units per acre.
Project Name Prop. ID. Acres Units Year Built Zoning Units/AcreMeriwether Place 294500000 1.16 60 2018 CC 51.72Ellwood LLP 294600000 0.84 46 2020 CC 54.76Sea Mar 109980000 1.55 70 2017 CC 45.16Clara Court 158587000 0.44 18 2020 CC 40.91Evergreen BL 30873000 0.18 12 2019 CC 66.67Evergreen BL 30908000 0.23 12 2019 CC 52.17Affinity 159847000 8.76 170 2019 CG 19.41The Plaza Lofts 986051754 1.94 109 2018 CC 56.19The Plaza Lofts 986051753 0.49 27 2018 CC 55.10The Plaza Lofts 126466000 0.71 27 2018 CC 38.03Westridge Lofts 126454007 2.88 100 2020 CC 34.72
19.18 651 33.94Bold indicates development on built landSource: Clark County GIS Assessor Taxlot 2 August 2020 and Tmp taxlots June 2020
ECONorthwest Clark County Buildable Lands PAC Report - February 2021 17
Exhibit 6. Pending Residential Projects in Commercial Zones Outside of Downtown Vancouver
Data compiled by Clark County staff
Residential Development as a Percentage of All Development in Commercial Zones
The VBLM already uses percentages of land that will develop as residential and commercial for mixed use designated areas. Applying a ratio split between land that has developed as residential and commercial could capture potential residential development on commercially zoned land.
Of the commercial vacant land that has developed in Vancouver (outside the City Center) since 2016, 19% has been for residential development. However, given that the 2016-2020 timeframe included a strong multifamily development market in Vancouver, a rate closer to 15% of acres developing as residential looking ahead over a 20-year planning period is reasonable. Within the Vancouver City Center, about 11 acres of commercial vacant and underutilized land developed between 2007 and 2019. Of this development, about 36% (4 acres) was residential development. However, given the unusually strong multifamily development market in Vancouver’s Central City in recent years, a rate closer to 30% of acres developing as residential looking ahead over a 20-year planning period is reasonable.
Project Location Use Zoning Acres SizeResidential
Units Status
65th Ave Apartments 2951 NE 65th ave MF CG 2.2 4-5 stories90
Preapp
submittal
12 Up Main 3916 Main St Mixed Use CC 0.6 4 story bldg.
12Preapp
submittal
Veteran's Village 5118 NE Saint James RD MF CC 1.1
micro-homes for
female veterans
w/ meeting hall &
18 Preapp
submittal
Gregory Apartments 7401 NE 18th ST Mixed Use CC 2.6 3 stories
101 Preapp
submittal
Acero Parkside - Ph II 1317 NE 136th Ave Mixed Use CC 10 multi-story
376 Preapp
submittal
Vancouver Mall Mixed Use 4906 NE 72nd Ave Mixed Use CN 1.4 2 story
76 Preapp
submittal
The Atlantic (meridian)
Apartments#108141466
NE 78th AV/ NE Fourth
Plain MF CC 0.22 (3) 3-story
46
Preliminary
site plan
submittal
First Street Village 316 NE 202nd Mixed Use CG 9 4 stories
115Site plan
reivew
submitted
Lincoln Apartments 1111 W Fourth Plain BV Mixed Use CC 0.2 3 stories
6
Building
plan
review
Acero Parkside
NE 138th AV/NE 18th ST
(1332 NE 136th AV?) Mixed Use CC/OCI 11.8 multi-story260
Building
plan
review
Total 39.12 1,100
Source: City of Vancouver
ECONorthwest Clark County Buildable Lands PAC Report - February 2021 18
Market Factor
The existing methodology includes “never to convert” assumptions that account for the fact that not all developable land will be developed. In addition to deductions for constrained land (e.g., wetlands, flood plains, steep slopes, habitat areas, stream corridors, etc.), the methodology applies never-to-convert factors to vacant and underutilized residential land (10% and 30%, respectively). The methodology does not include specific never-to-convert assumption for commercial or industrial land except on constrained land.20
In addition to the never-to-convert factors used in the VBLM, Clark County uses a market factor that is applied on the demand side to the number of net acres needed to accommodate new population/employment growth.21 In 2016, the County applied a 15% demand-side market factor for residential, commercial, and industrial.
Recommendation
The BLPAC voted in support (10 of 11 members22) of the following recommendation related to the supply-side market factor:
At a minimum, keep existing never-to-convert supply-side factors for residential: 10% for
vacant land, 30% for underutilized.
Supporting Analysis
The Project Team introduced the topic of market factor at Meeting #3. Over a 20-year period the current market factor assumption is that 90% of vacant land will develop (10% never-to-convert factor) and 70% of underutilized land will develop (30% never-to-convert factor). County staff completed additional analysis to evaluate the current approach to market factor, including the never-to-convert factor. The new recommendation and additional analysis are described below.
The prior analysis on market factor looked at the total amount of vacant and underutilized residential land within the 1996 UGA boundary relative to the amount of vacant and underutilized residential land within that same area in 1996. This approach was useful as a reference point to compare against the combination of never-to-convert and demand-side market factors, but did not give a good indication of the never-to-convert element on its own. This was due, in part, to a lack of a method to differentiate whether land did not convert because of property-specific factors, as well as the availability of more land than needed as a
20 Note that the never-to-convert assumption accounts for a land market factor—that not all available land will be
developed. In establishing residential land needs, the conversion from population projections to housing units
needed accounts for housing unit vacancy separately. For commercial and industrial land, the use of observed
employment densities (rather than built space) has historically meant that the County did not need to address
vacancy in the same way for commercial and industrial development.
21 This is taking into consideration the following assumptions approved by Council: OFM population projection,
urban/rural split, persons per household, density targets, and infrastructure set-asides.
22 At this point in the voting process, one member had left the meeting.
ECONorthwest Clark County Buildable Lands PAC Report - February 2021 19
result of intentional policy choices intended to provide a buffer in the land market. The additional analysis by County staff described below uses an example study area to evaluate the never-to-convert assumptions more specifically. This analysis also provides a useful reference point for evaluating the critical areas deduction (currently 50% of critical areas are assumed not to develop).
Study Area Approach
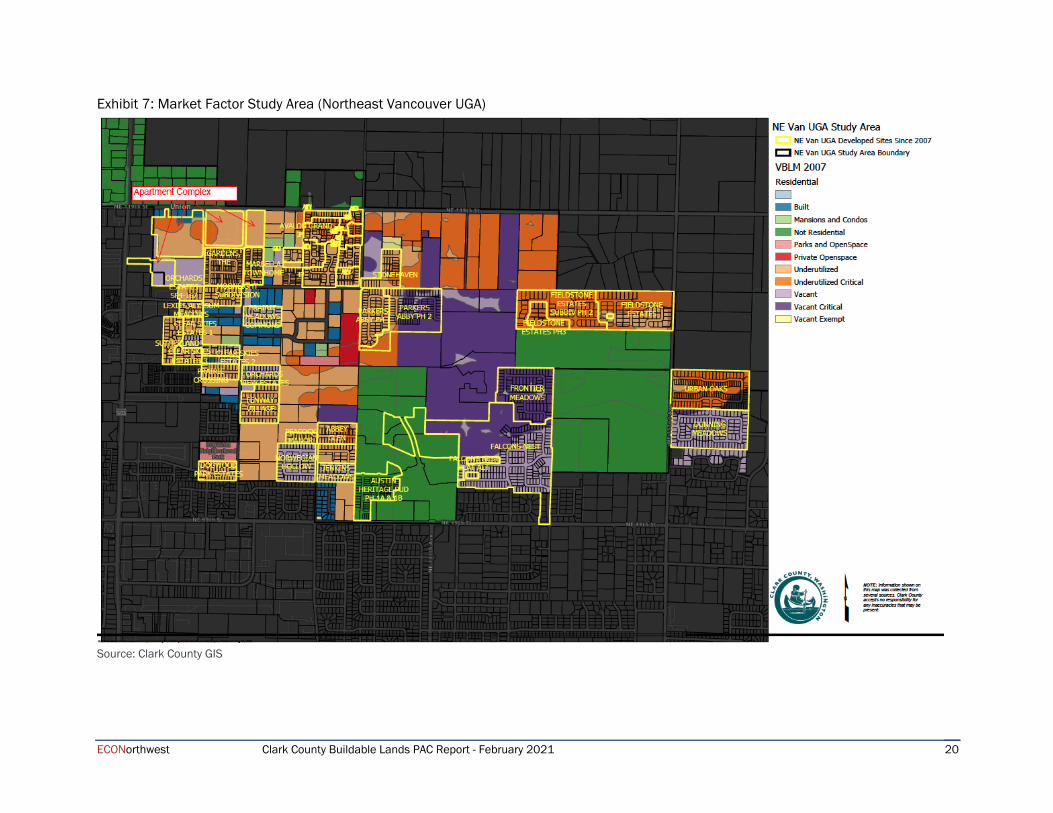
The study area for evaluating the market factor (never-to-convert) and critical areas was brought into the Vancouver UGA in 2004 and had Urban Holding lifted in 2007. A new plan was adopted in 2007 that expanded the UGA in the study area to the east by 40 acres (including Urban Oaks and Dunning Meadows). This area has seen a high rate of growth since 2007 and there is over a decade’s worth of development to analyze even with the slowdown of the Great Recession. The residential area is approximately 600 acres and is located at the Northeast corner of the Vancouver Urban Growth Area and is generally bound by SR503 to the west, 119th Street to the north, NE 99th Street to the south and NE 152nd Ave to the east (Exhibit 7).
The study area includes 43 residential development projects (including multi-phase projects).23 All but four of these are platted subdivisions; the balance are apartment complexes located in the northwest corner of the study area near the intersection of NE 119th Street and SR-503.
The 2007 VLBM for this area was used as a baseline to identify the number of acres classified as Vacant, Vacant with critical, Underutilized and Underutilized with critical. The subdivisions and sites developed since 2007 were overlaid on the area to determine how much of each category had been developed in the intervening years and use the rate of development to compare with the VBLM assumptions. The amount of development in gross acres was used to test market factor and critical assumptions.
23 Austin Heritage development is shown on the map but this area was not included in any of the calculations
because in 2007 it was zoned Mixed Use and no development occurred until after a zone change in 2012.
ECONorthwest Clark County Buildable Lands PAC Report - February 2021 20
Exhibit 7: Market Factor Study Area (Northeast Vancouver UGA)
Source: Clark County GIS

ECONorthwest Clark County Buildable Lands PAC Report - February 2021 21
Results
Exhibit 8 below shows the number of acres developed in the three residential VBLM categories and developed acres as a percentage of the total starting acreage in each category.
Exhibit 8. Gross Acres by VBLM Classification and Percent Developed, NE Vancouver UGA Study Area Residential VBLM Classification
2007 VBLM Acres (Gross)
Acres Developed by 2020
% of Acres Developed by 2020 (13 years)
Average Annual Conversion Rate (Actual)
Assumed Conversion Rate over 20 years
Average Annual Conversion Rate (Assumed)
Vacant 101 80 79% 6.1% 90% 4.5% Underutilized 218 134 61% 4.7% 70% 3.5% Vacant w/Critical 140 47 34%* 2.6%* 45% 2.3% Underutilized w/Critical 145 68 47%* 3.6%* 35% 1.8% Total 604 329 54%
Source: Clark County GIS data compiled by Clark County staff * For purposes of this analysis, critical lands are considered “developed” if they are included within a plat or development site. This does not necessarily mean that they have been built over.
The average annual rate of development is above what is predicted under the current assumptions for all land classifications. However, in a greenfield area that is newly building out, development does not typically occur in a linear, evenly paced fashion over a 20-year period. The parcels remaining after 13 years of development appear to be generally smaller and more constrained than those that have developed. It may be that many of the readily buildable sites with willing owners have been developed in the first 13 years, and that development of the remainder will proceed more slowly. For the vacant and underutilized land, if the pace of development over the next 7 years slowed to roughly a quarter of rate observed in the first 13 years, over 20 years the overall conversion rate would be almost exactly the current assumed conversion rate. This supports continued use of the current never-to-convert factors for residential land.
Population Capacity
Clark County estimates the residential capacity of developable residential land based on a single density (expressed in housing units per net developable acre) for each UGA. These assumptions do not vary by zone / general plan designation. Density assumptions in the VBLM reflect the comprehensive plan policy targets, except for Woodland and Yacolt24, for each UGA (see Table 3 from the 2015 Buildable Lands Report). They are applied to net acres, after accounting for infrastructure set-asides and discounting constrained acres.
24 Woodland and Yacolt do not have comprehensive plan density targets. These are used for capacity estimate purposes only.
ECONorthwest Clark County Buildable Lands PAC Report - February 2021 22
Recommendation:
The BLPAC was split over whether to use achieved density by VBLM land use (Urban Residential High vs. Urban Residential Low) in the residential model—see discussion on page 28. However, the BLPAC voted in support (11 of 12 members) of the following recommendation:
If County Council decides to use achieved density as the basis for residential land capacity, the County should first work with jurisdictions to refine the data to remove outliers and anomalies.
Supporting Analysis
Several members of the BLPAC raised concerns about specific projects skewing the observed averages. For example, staff noted in a memorandum documenting achieved densities that Battle Ground Mixed use development included two single family homes on 13 acres and a church on 4.5 acres, and La Center Mixed Use includes a duplex on a 1.56 acre site that was constrained/critical as one of 7 units on three sites totaling 1.93 acres.
Infrastructure Gaps
The new Buildable Lands legislation requires that identification of land suitable for development and redevelopment must take into consideration infrastructure gaps, including but not limited to transportation, water, sewer, and stormwater.
Clark County does not currently have an explicit step in the Buildable Lands methodology to address infrastructure gaps. The Urban Holding overlay is used to protect land until it is ready for annexation and can be used for areas where infrastructure is not currently available or adequate. However, the Growth Management Act (GMA) requires that cities plan to provide urban services to land within their UGA within 20 years, including land within the Urban Holding overlay.
Recommendation
At Meeting #4, the BLPAC provided preliminary support for the following recommendation:
Do not exclude any land on the basis of infrastructure gaps; however, continue to apply reduced capacity assumptions for Yacolt due to lack of sewer facilities.
Since this recommendation did not affect the results of the VBLM, the BLPAC did not vote on this topic at the final meeting. Concerns related to this issue raised at Meeting #4 included:
§ Yacolt will need to first establish density targets before consideration in the model, so they would not be subject to addressing infrastructure gaps.
ECONorthwest Clark County Buildable Lands PAC Report - February 2021 23
§ Yacolt should provide testimony before making a decision. (There was public comment from several representatives from Yacolt at Meeting #4.)
Supporting Analysis
As part of the VBLM review and work with the BLPAC, Clark County requested input from cities to identify any potential infrastructure gaps that merit consideration in the buildable lands inventory. The Project Team reported back to the BLPAC at Meeting #4 that none identified a potential infrastructure gap that could not be addressed within the 20-year plan timeframe as identified in their respective capital facilities plans. The responses received by staff included: Battle Ground, Camas, La Center, Ridgefield, and Vancouver.
Due to wastewater management issues, the urban development standards that apply to other jurisdictions do not apply to Yacolt. The Town of Yacolt has not been assigned an urban density target, due to their lack of sewer, therefore the recommendation is that the reporting requirement is not applicable to the Town of Yacolt and no change is proposed. (See Community Framework Plan policy 1.1.1 bullet #4, Countywide Planning Policy 1.1.13) This does not affect their existing land use which allows a minimum residential lot size of 12,500 sq. ft, subject to health department approval for on-site septic systems.
An email was sent to Mayor Listek to reiterate the proposed recommendation as stated above along with the March email that was sent to all jurisdictions seeking input on the infrastructure gaps.
Rural Land Capacity
The County’s existing methodology accounts for rural land capacity, but the assumptions were not clearly documented. The Project Team documented the assumptions and presented them to the BLPAC at Meeting #5. Attachment B shows the methodology that the BLPAC reviewed and provided a preliminary recommendation on.
Recommendation
At Meeting #6, the BLPAC provided preliminary support for the following recommendation:
Keep existing methodology as described in Attachment B.
During this meeting, the BLPAC stated the following concerns related to the recommendation: § The capacity analysis should include potential for accommodating commercial and
industrial development on rural lands.
§ This analysis aligns with the goal of estimating capacity, and other issues are related to the Comprehensive Planning Polices, not buildable lands.
ECONorthwest Clark County Buildable Lands PAC Report - February 2021 24
Supporting Analysis
The Department of Commerce issued updated Buildable Lands Guidelines in 2018 based on the passage of ESSB 5254. The Guidelines reference the “annual collection of data on urban and rural land uses” however the Guidelines do not specify what data the county must collect and use. Specific data is addressed in WAC 365-196-425 (3)(b) below (emphasis added). The Clark County Buildable Lands Report has included items ii, iv, and ix since the first report in 2002.
b) Counties should perform a periodic analysis of development occurring in rural areas, to determine if patterns of rural development are protecting rural character and encouraging development in urban areas. This analysis should occur along with the urban growth area review required in RCW 36.70A.130 (3)(a). The analysis may include the following:
(i) Patterns of development occurring in rural areas.
(ii) The percentage of new growth occurring in rural versus urban areas.
(iii) Patterns of rural comprehensive plan or zoning amendments.
(iv) Numbers of permits issued in rural areas.
(v) Numbers of new approved wells and septic systems.
(vi) Growth in traffic levels on rural roads.
(vii) Growth in public facilities and public services costs in rural areas.
(viii) Changes in rural land values and rural employment.
(ix) Potential build-out at the allowed rural densities.
(x) The degree to which the growth that is occurring in the rural areas is consistent with patterns of rural land use and development established in the rural element.
Residential Methodology
The methodology for estimating capacity in the rural area is much simpler than the Vacant Buildable Lands Model method for the urban area. There are no density targets in the rural area. Capacity is estimated based on the rural densities allowed by the underlying zoning. The methodology for estimating the potential build out at rural densities is attached.
There is no infrastructure deduction in the rural area because private roads are being used to serve developments and are also included in lot area calculations. Lots abutting public roads can count up to 30’ of the right-of-way as part of the lot area for the purposes of land division.
ECONorthwest Clark County Buildable Lands PAC Report - February 2021 25
Critical areas are not considered a limiting factor in the potential development of land in the rural area. Development envelopes and cluster development standards allow flexibility in site planning to avoid critical areas. Both the habitat and wetland ordinances have a reasonable use provision that states: “This chapter shall not be used to deny or reduce the number of lots of a proposed rural land division allowed under the applicable zoning density.”
Stormwater is typically treated on site through infiltration, low impact development Best Management Practices (BMP’s) such as dispersion or bioretention ponds. Given the larger parcel sizes in the rural area these BMPs can be accommodated with no loss of potential lots.
Employment Methodology
The Growth Management Act (GMA) allows for the recognition of Limited Areas of More Intensive Rural Development (LAMIRD’S) that existed as commercial nodes in 1990 when the GMA became effective. In Clark County there are seven LAMIRDs, referred to as rural centers.
Commercial and Industrially zoned land in the rural area is concentrated in the rural centers. In addition to commercial businesses to serve the rural residents these rural centers have schools, fire stations and other public facilities. Two of the rural centers, Chelatchie Prairie and Brush Prairie, have land zoned for Heavy Industrial uses.
Forestry, surface mining, agriculture, wineries and equestrian businesses are sources of employment in the rural area that are land dependent.
Home businesses are also allowed on rural residential land on a scale commensurate with parcel size i.e. (a maximum of 6 non-resident employees and up to 5,000 sq. ft. accessory structures are allowed on parcels 20 acres or greater).
Employment data from the Employment Security Department (ESD) has been a challenge to use in the urban areas due to proprietary issues that changed how the ESD can share the data. These proprietary issues are further exacerbated in the rural area due to the limited number of employers, land-based employment and the data limitations, as only employees participating in the unemployment insurance program are counted.
From 1994 through 2016 the County’s comprehensive plans have used employment projections and density assumptions for estimating the amount of land needed to accommodate 20 years of employment growth in the urban areas.
ECONorthwest Clark County Buildable Lands PAC Report - February 2021 26
3. Additional Potential Refinements
This section summarizes topics that the BLPAC reviewed, but did not reach a two-thirds majority for a recommendation. The County Council should review these topics for potential refinements to add to the updated assumptions for the VBLM. The discussion of each topic provides the recommendation that the Project Team presented to the BLPAC, the level of support from the BLPAC, supporting analysis, and the Project Team’s response.
Employment Land: Excess and Rearage Acres
Proposed Refinement and Level of Support
At Meeting #4, the BLPAC provided preliminary support for the following recommendation:
Add some of “excess” (75%) and “rearage” (20%) acres on built land to the employment land supply.
At the final meeting, the BLPAC did not reach a two-thirds majority on this topic, with 7 of 12 voting in favor. This topic did not receive further discussion at the meeting. The initial runs of the VBLM showed that accounting for this land would add about 217 net acres of industrial land and about 38 net acres of commercial land.25
The Project Team believes this refinement is appropriate and accurately captures available land, but is not necessary for legal compliance or to address state guidance.
Supporting Analysis
At Meeting #2, the Project Team presented preliminary information related to commercial and industrial land that showed a noticeable amount of development on land classified as “built”, but the historical comparison of commercial and industrial model results was inconclusive. The Project Team encountered challenges in analyzing data at the parcel level, as commercial development typically happens at a site level, composed of multiple parcels with multiple buildings or other active uses (e.g., parking lots). PAC members expressed concerns about the validity of building value as an indicator of whether a parcel is vacant or underutilized.
In response, the Project Team explored several other possible ways to identify employment land (commercial and industrial) with additional development potential, including the Assessor’s evaluation of excess and rearage land.
The Project Team reached out to the County Assessor to review and explore the Assessor’s methods and data related to the assessment of additional available acreage for commercial and industrial uses. This includes acreage on lots that have an existing use, but the site may have
25 Note that the impact estimates were revised since the information provided to the BLPAC to correctly reflect the 75% and 20% of acreage to be included.
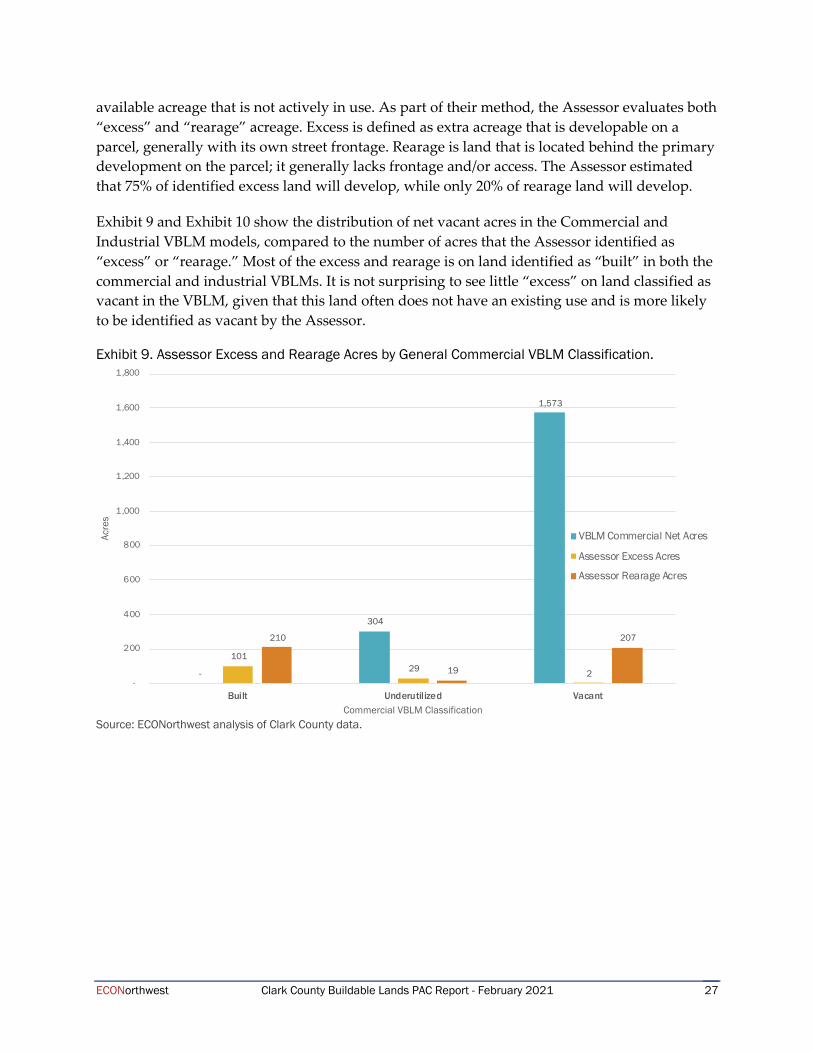
ECONorthwest Clark County Buildable Lands PAC Report - February 2021 27
available acreage that is not actively in use. As part of their method, the Assessor evaluates both “excess” and “rearage” acreage. Excess is defined as extra acreage that is developable on a parcel, generally with its own street frontage. Rearage is land that is located behind the primary development on the parcel; it generally lacks frontage and/or access. The Assessor estimated that 75% of identified excess land will develop, while only 20% of rearage land will develop.
Exhibit 9 and Exhibit 10 show the distribution of net vacant acres in the Commercial and Industrial VBLM models, compared to the number of acres that the Assessor identified as “excess” or “rearage.” Most of the excess and rearage is on land identified as “built” in both the commercial and industrial VBLMs. It is not surprising to see little “excess” on land classified as vacant in the VBLM, given that this land often does not have an existing use and is more likely to be identified as vacant by the Assessor.
Exhibit 9. Assessor Excess and Rearage Acres by General Commercial VBLM Classification.
Source: ECONorthwest analysis of Clark County data.
-
304
1,573
101 29 2
210
19
207
-
200
400
600
800
1,000
1,200
1,400
1,600
1,800
Built Underutilized Vacant
Acre
s
Commercial VBLM Classification
VBLM Commercial Net Acres
Assessor Excess Acres
Assessor Rearage Acres
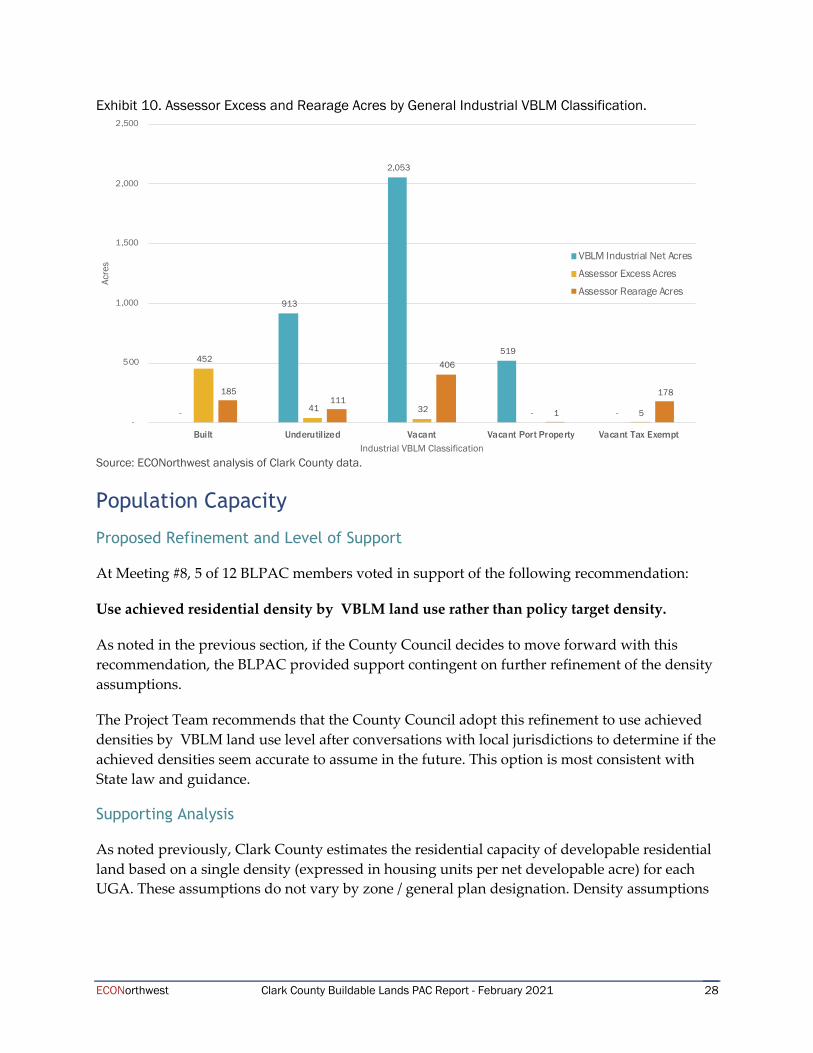
ECONorthwest Clark County Buildable Lands PAC Report - February 2021 28
Exhibit 10. Assessor Excess and Rearage Acres by General Industrial VBLM Classification.
Source: ECONorthwest analysis of Clark County data.
Population Capacity
Proposed Refinement and Level of Support
At Meeting #8, 5 of 12 BLPAC members voted in support of the following recommendation:
Use achieved residential density by VBLM land use rather than policy target density.
As noted in the previous section, if the County Council decides to move forward with this recommendation, the BLPAC provided support contingent on further refinement of the density assumptions.
The Project Team recommends that the County Council adopt this refinement to use achieved densities by VBLM land use level after conversations with local jurisdictions to determine if the achieved densities seem accurate to assume in the future. This option is most consistent with State law and guidance.
Supporting Analysis
As noted previously, Clark County estimates the residential capacity of developable residential land based on a single density (expressed in housing units per net developable acre) for each UGA. These assumptions do not vary by zone / general plan designation. Density assumptions
-
913
2,053
519
-
452
41 32 - 5
185 111
406
1
178
-
500
1,000
1,500
2,000
2,500
Built Underutilized Vacant Vacant Port Property Vacant Tax Exempt
Acre
s
Industrial VBLM Classification
VBLM Industrial Net Acres
Assessor Excess Acres
Assessor Rearage Acres
ECONorthwest Clark County Buildable Lands PAC Report - February 2021 29
in the VBLM reflect the comprehensive plan policy targets, except for Woodland and Yacolt26, for each UGA (see Table 3 from the 2015 Buildable Lands Report). They are applied to net acres, after accounting for infrastructure set-asides and discounting constrained acres.
The current methodology largely overlooks the impact of zoning on capacity going forward, including differences in how remaining vacant land is zoned and changes to zoning regulations over time. The County will continue to calculate achieved density for each UGA overall to compare to the density targets set in Comprehensive Plan policy. The difference in the approaches relates to how capacity is estimated in the VBLM.
State Guidance
RCW 36.70A.215(3) includes the following requirements (emphasis added):
(3) At a minimum, the evaluation component of the program required by subsection (1) of this section shall:
…
(b) An evaluation and identification of land suitable for development or redevelopment shall include:
(i) A review and evaluation of the land use designation and zoning/development regulations; environmental regulations (such as tree retention, stormwater, or critical area regulations) impacting development; and other regulations that could prevent assigned densities from being achieved;
…
(c) Provide an analysis of county and/or city development assumptions, targets, and objectives contained in the countywide planning policies and the county and city comprehensive plans when growth targets and assumptions are not being achieved. It is not appropriate to make a finding that assumed growth contained in the countywide planning policies and the county or city comprehensive plan will occur at the end of the current comprehensive planning twenty-year planning cycle without rationale;
(d) Determine the actual density of housing that has been constructed and the actual amount of land developed for commercial and industrial uses within the urban growth area since the adoption of a comprehensive plan under this chapter or since the last periodic evaluation as required by subsection (1) of this section; and
(e) Based on the actual density of development as determined under (b) of this subsection, review commercial, industrial, and housing needs by type and
26 Woodland and Yacolt do not have comprehensive plan density targets. These are used for capacity estimate purposes only.

ECONorthwest Clark County Buildable Lands PAC Report - February 2021 30
density range to determine the amount of land needed for commercial, industrial, and housing for the remaining portion of the twenty-year planning period used in the most recently adopted comprehensive plan.
It further states that “zoned capacity of land alone is not a sufficient standard to deem land suitable for development or redevelopment within the 20-year period.” (RCW 36.70A.215(3)
The Guidelines reinforce and clarify these regulations as follows (emphasis added):
In addition to being a Review & Evaluation Program requirement to evaluate whether planned densities are being achieved, achieved density data serve as the basis for capacity projections on land suitable for development and redevelopment and must be used to determine urban capacity for the remaining portion of the 20-year planning period.27
Jurisdictions typically analyze the achieved densities of development projects during the evaluation period and create an average achieved density per zoning category based on the actual development data.28
RCW 36.70A.215(3)(b)(i) provides that a review and evaluation of the land use designation and zoning/development regulations and infrastructure gaps are part of the evaluation criteria to determine if there is sufficient land suitable to accommodate county-wide population projections. The goal is to understand if and how development regulations or infrastructure gaps may affect density or timing of growth. 29
…
It [RCW 36.70A.215(3)(a)] also states that zoned capacity of land alone is not a sufficient standard to deem land suitable for development or redevelopment within the 20-year period. This requirement places an expectation on jurisdictions to not just assume properties will develop to their maximum densities allowed under their zoning designations, but to conduct additional analysis related to how development and redevelopment might occur to support urban capacity findings. …
With vacant land at lower densities, lot sizes based on zoning may be used to estimate capacity. These calculations generally result in capacity estimates that are near zoned capacity. Estimating future development capacities for higher density development and redevelopment generally requires more analysis since many other factors, such as
27 Department of Commerce, Buildable Lands Guidelines (2018), page 34. 28 Department of Commerce, Buildable Lands Guidelines (2018), page 24. 29 Department of Commerce, Buildable Lands Guidelines (2018), page 30.
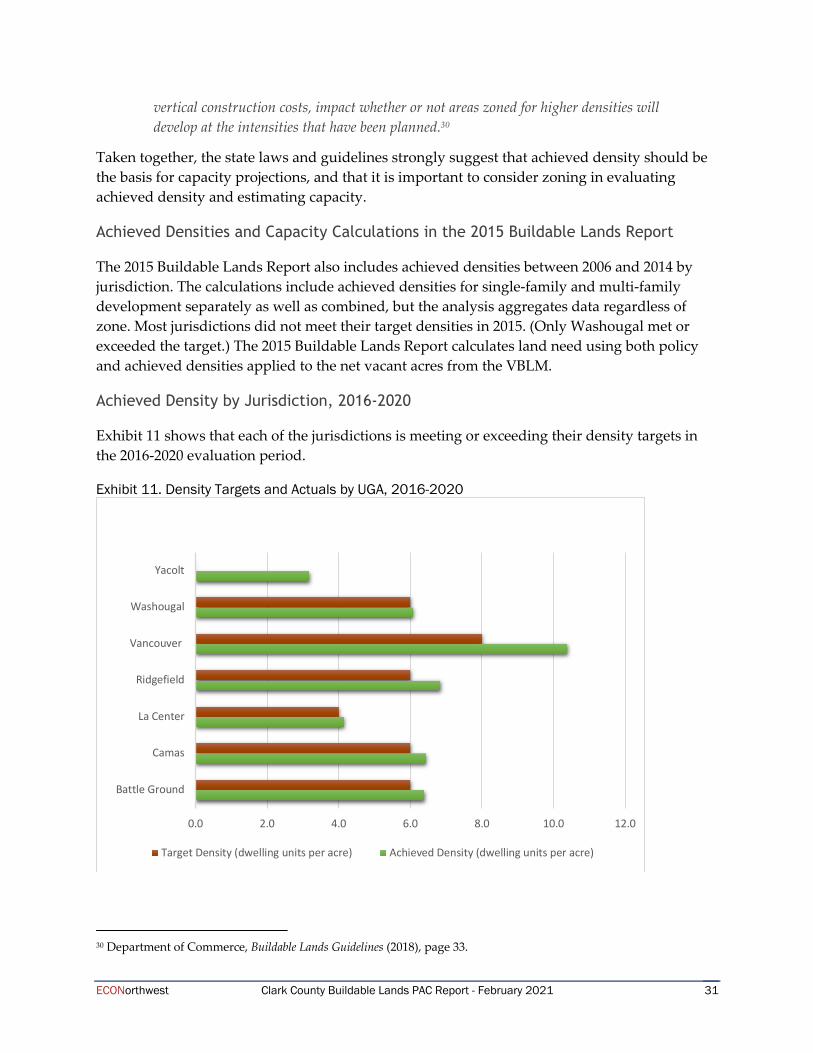
ECONorthwest Clark County Buildable Lands PAC Report - February 2021 31
vertical construction costs, impact whether or not areas zoned for higher densities will develop at the intensities that have been planned.30
Taken together, the state laws and guidelines strongly suggest that achieved density should be the basis for capacity projections, and that it is important to consider zoning in evaluating achieved density and estimating capacity.
Achieved Densities and Capacity Calculations in the 2015 Buildable Lands Report
The 2015 Buildable Lands Report also includes achieved densities between 2006 and 2014 by jurisdiction. The calculations include achieved densities for single-family and multi-family development separately as well as combined, but the analysis aggregates data regardless of zone. Most jurisdictions did not meet their target densities in 2015. (Only Washougal met or exceeded the target.) The 2015 Buildable Lands Report calculates land need using both policy and achieved densities applied to the net vacant acres from the VBLM.
Achieved Density by Jurisdiction, 2016-2020
Exhibit 11 shows that each of the jurisdictions is meeting or exceeding their density targets in the 2016-2020 evaluation period.
Exhibit 11. Density Targets and Actuals by UGA, 2016-2020
30 Department of Commerce, Buildable Lands Guidelines (2018), page 33.
0.0 2.0 4.0 6.0 8.0 10.0 12.0
Battle Ground
Camas
La Center
Ridgefield
Vancouver
Washougal
Yacolt
Target Density (dwelling units per acre) Achieved Density (dwelling units per acre)
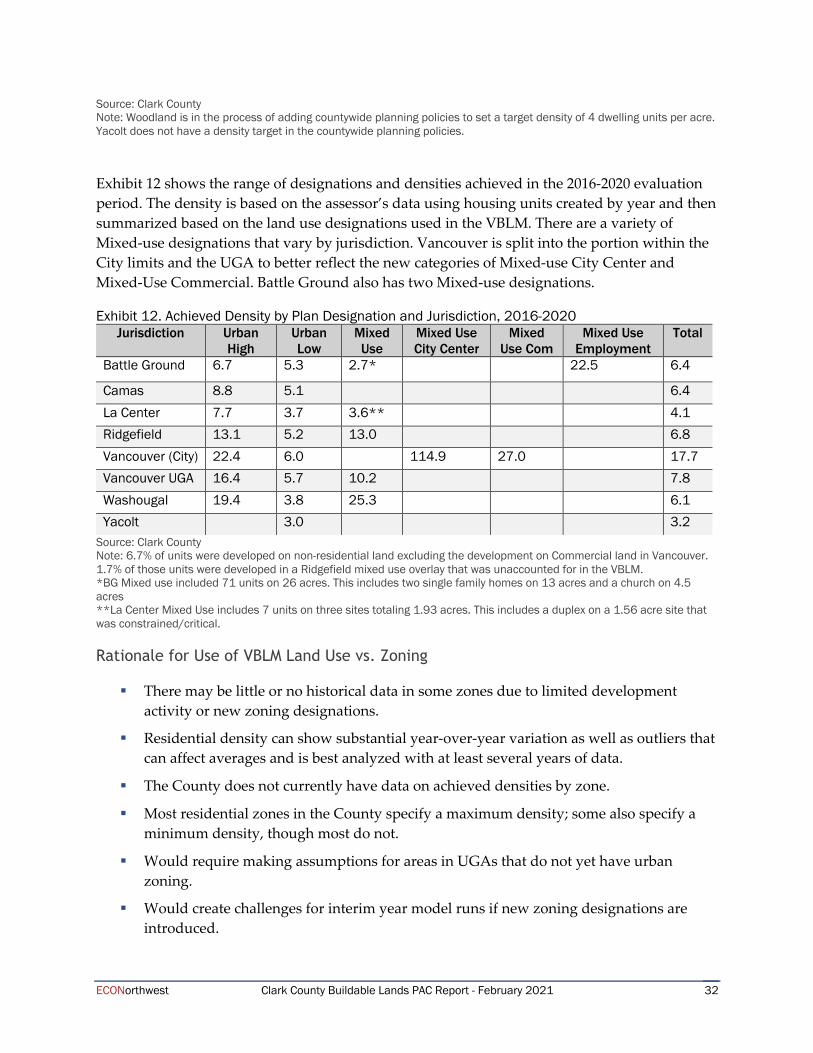
ECONorthwest Clark County Buildable Lands PAC Report - February 2021 32
Source: Clark County Note: Woodland is in the process of adding countywide planning policies to set a target density of 4 dwelling units per acre. Yacolt does not have a density target in the countywide planning policies.
Exhibit 12 shows the range of designations and densities achieved in the 2016-2020 evaluation period. The density is based on the assessor’s data using housing units created by year and then summarized based on the land use designations used in the VBLM. There are a variety of Mixed-use designations that vary by jurisdiction. Vancouver is split into the portion within the City limits and the UGA to better reflect the new categories of Mixed-use City Center and Mixed-Use Commercial. Battle Ground also has two Mixed-use designations.
Exhibit 12. Achieved Density by Plan Designation and Jurisdiction, 2016-2020 Jurisdiction Urban
High Urban Low
Mixed Use
Mixed Use City Center
Mixed Use Com
Mixed Use Employment
Total
Battle Ground 6.7 5.3 2.7* 22.5 6.4
Camas 8.8 5.1 6.4 La Center 7.7 3.7 3.6** 4.1 Ridgefield 13.1 5.2 13.0 6.8 Vancouver (City) 22.4 6.0 114.9 27.0 17.7 Vancouver UGA 16.4 5.7 10.2 7.8 Washougal 19.4 3.8 25.3 6.1 Yacolt 3.0 3.2
Source: Clark County Note: 6.7% of units were developed on non-residential land excluding the development on Commercial land in Vancouver. 1.7% of those units were developed in a Ridgefield mixed use overlay that was unaccounted for in the VBLM. *BG Mixed use included 71 units on 26 acres. This includes two single family homes on 13 acres and a church on 4.5 acres **La Center Mixed Use includes 7 units on three sites totaling 1.93 acres. This includes a duplex on a 1.56 acre site that was constrained/critical.
Rationale for Use of VBLM Land Use vs. Zoning
§ There may be little or no historical data in some zones due to limited development activity or new zoning designations.
§ Residential density can show substantial year-over-year variation as well as outliers that can affect averages and is best analyzed with at least several years of data.
§ The County does not currently have data on achieved densities by zone.
§ Most residential zones in the County specify a maximum density; some also specify a minimum density, though most do not.
§ Would require making assumptions for areas in UGAs that do not yet have urban zoning.
§ Would create challenges for interim year model runs if new zoning designations are introduced.
ECONorthwest Clark County Buildable Lands PAC Report - February 2021 33
BLPAC Discussion
At Meeting #6, BLPAC members stated that zoning seemed more accurate. The Project Team stated that using zoning would require major changes to the way the model is run. They recommended that the County start to collect data on densities by zone (also recommended by the Guidelines), to compare to the densities by VBLM land use going forward. The County can later evaluate if zoning is a more accurate metric, as the buildable lands report is completed on a 7-year cycle.
At Meeting #8, the BLPAC expressed concerns about:
§ Average density used in Vancouver, especially for the Urban Low designation
§ Outliers in smaller jurisdictions skewing the average. Asked about a median.
§ Historic densities won’t capture future/new code changes (Project Team note: adjustments from achieved density could be made to account for changes to regulations; this is recommended in the Guidebook)
§ Observations and ground truthing are important going forward and should be based on real data, such as achieved densities.
§ The information in the record supports using these densities, but some members would like refinements such as median densities
Critical Lands
Proposed Refinement and Level of Support
The Project Team recommends a plat deduction of 40% of mapped critical lands as protected, consistent with the team’s analysis of plat data (this would replace the 50% factor currently applied to critical lands on top of the 10% and 30% market factors for vacant and underutilized land).31
At Meeting #8, the BLPAC considered and discussed several options for refinements related to critical lands, but ultimately did not take a final vote on this topic. The recommendation above strives to respond to feedback from the BLPAC at Meeting #8, incorporating elements of the options considered previously that are best supported by the evidence and the BLPAC’s feedback. The BLPAC’s discussion is summarized on page 35.
31 Mapped critical lands may be developable for several reasons, including: mapping errors, allowed uses within buffer areas, areas like critical aquifer recharge areas that can generally be developed, and other options to develop on critical lands through a discretionary process with adequate technical documentation.
ECONorthwest Clark County Buildable Lands PAC Report - February 2021 34
Supporting Analysis
The critical lands layer is a tool used to flag potential critical lands so that an on-site assessment can be performed in conjunction with the development process. This assessment often identifies a smaller area that requires preservation. In addition, on-site and off-site mitigation allows for development on lands identified as critical in the on-site assessment in some cases. The VBLM identifies critical lands (constrained lands) including:
§ 100-year floodplain (or flood fringe)
§ Wetlands inventory (NWI, high quality, permitted, modeled) with 100-foot buffer
§ Slopes:
§ Greater than 15 percent; or
§ Greater than 25 percent plus a 100-foot buffer within Vancouver
§ Landslide areas with active or historically unstable slopes
§ Designated shorelines
§ Hydric soils plus a 50-foot buffer
§ Habitat areas plus a 100-foot buffer
§ Species areas plus 300-foot buffer
§ Riparian stream buffers – varies by jurisdiction and stream type from 75 feet to 250 feet
Analysis by County staff of all constrained lands that became part of a plat used the same County-wide plat dataset analyzed by AHBL for purposes of establishing refined infrastructure set-aside assumptions. The analysis shows that in aggregate since 2000, 35% of the mapped critical lands were preserved as open space in tracts (Exhibit 13). There has been variation from year to year but no clear trend up or down over time. Most of the rest has become buildable home sites or infrastructure (e.g., roads or stormwater facilities).
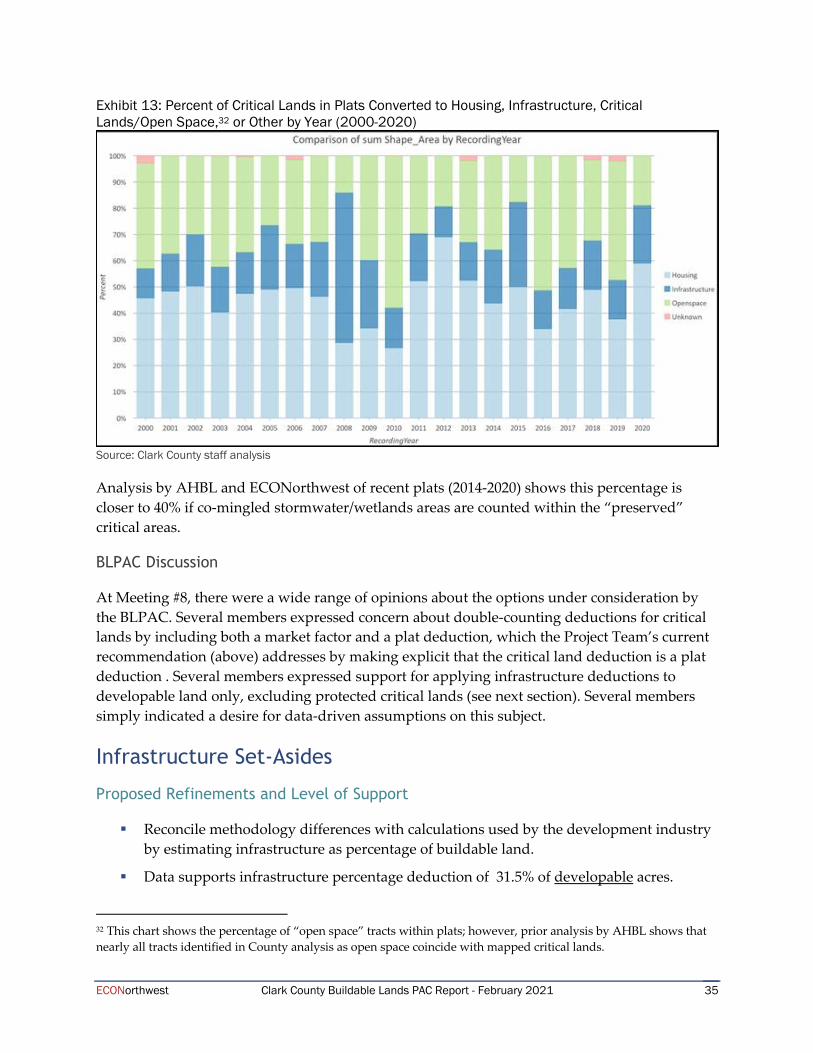
ECONorthwest Clark County Buildable Lands PAC Report - February 2021 35
Exhibit 13: Percent of Critical Lands in Plats Converted to Housing, Infrastructure, Critical Lands/Open Space,32 or Other by Year (2000-2020)
Source: Clark County staff analysis
Analysis by AHBL and ECONorthwest of recent plats (2014-2020) shows this percentage is closer to 40% if co-mingled stormwater/wetlands areas are counted within the “preserved” critical areas.
BLPAC Discussion
At Meeting #8, there were a wide range of opinions about the options under consideration by the BLPAC. Several members expressed concern about double-counting deductions for critical lands by including both a market factor and a plat deduction, which the Project Team’s current recommendation (above) addresses by making explicit that the critical land deduction is a plat deduction . Several members expressed support for applying infrastructure deductions to developable land only, excluding protected critical lands (see next section). Several members simply indicated a desire for data-driven assumptions on this subject.
Infrastructure Set-Asides
Proposed Refinements and Level of Support
§ Reconcile methodology differences with calculations used by the development industry by estimating infrastructure as percentage of buildable land.
§ Data supports infrastructure percentage deduction of 31.5% of developable acres.
32 This chart shows the percentage of “open space” tracts within plats; however, prior analysis by AHBL shows that nearly all tracts identified in County analysis as open space coincide with mapped critical lands.
ECONorthwest Clark County Buildable Lands PAC Report - February 2021 36
§ Monitor how changes to regulations related to co-location of stormwater and wetland on a tract affect this percentage.
§ Apply this deduction to only half of the residential acres in the Urban Residential High designation in Vancouver.
At Meeting #8, the BLPAC considered and discussed several options for refinements related to infrastructure set-asides, but ultimately did not take a final vote on this topic. The recommendation above strives to respond to feedback from the BLPAC at Meeting #8, incorporating elements of the options considered previously that are best supported by the evidence and the BLPAC’s feedback. The BLPAC’s discussion is summarized on page 38.
Supporting Analysis
Infrastructure, including land dedicated to stormwater management, is deducted as one of the factors to adjust from gross to net acres. The County’s current assumption (27.7%) was set in 2007. Some BLPAC members with experience in development have noted that recent changes to stormwater requirements tend to require more land be dedicated to stormwater management. The purpose of this update is to better reflect the impact of changing stormwater regulations and to align infrastructure deductions with the approach to critical lands so that they apply only to developable land (see previous section).
AHBL reviewed applicable stormwater regulations and analyzed plat data to evaluate whether and to what degree changing stormwater regulations have affected land needed for stormwater management, and trends in infrastructure deductions in plats more broadly.
Data Sources
Countywide Plat Dataset: Clark County staff provided a GIS dataset that included all residential plats (long plats) from 2002-2019 and identified the type of land within the plats according to the following categories, called “plat property types.” The general categories were Housing, Open Space, Critical Land, Infrastructure, Stormwater Facility, or “unknown,” and each category contained several sub-types to further describe the type of property. This dataset was generated based on the assessor’s data and was refined by County staff to identify and correct irregularities in the data. AHBL further refined the data to correct any issues, to prevent double-counting, and to re-classify very large areas that had been identified as stormwater facilities but were located within wetlands.33
Example Recorded Plats: In addition, both staff and AHBL reviewed data provided by members of the BLPAC in prior testimony: the Responsible Growth Forum, Development Engineering Advisory Board (DEAB) and the Building Industry Association (BIA) submitted testimony in 2015 as part of the 2016 Comprehensive Plan update process that included analysis of land devoted to infrastructure in 21 subdivision plats from urban unincorporated Clark
33 AHBL identified and corrected 127 records where parcels over 3 acres in size had been identified as stormwater facilities, but were located in where hydric soils, wetlands, and/or buffer existed.
ECONorthwest Clark County Buildable Lands PAC Report - February 2021 37
County and the City of Camas. Staff and AHBL reviewed the final recorded plats from the same subdivisions identified in the 2015 testimony in an effort to establish whether that data provides a suitable basis for the infrastructure deduction in the model. In many cases there were slight differences between the acreages listed in the BIA table for various types of infrastructure and those noted on the final plats. For some subdivisions, not all phases were complete at the time of the testimony; staff and AHBL gathered data for the remaining phases to ensure accurate representation of overall infrastructure percentages. There were also methodological differences, including the way “gross acres” was defined (excluding critical lands tracts—see discussion on page 34) and the treatment of wetland areas that were also used for stormwater management (see discussion on page 39). For areas where stormwater facilities were located within a wetland, AHBL estimated the share of the facilities that is actually used for stormwater (vs. wetland area) on a tract-by-tract basis.
Changes to Stormwater Management Requirements
AHBL summarized recent changes to stormwater regulations and their implications for stormwater facility sizing as follows: 34
On January 13, 2009, Clark County adopted its own local stormwater manual, which is equivalent to the 2005 Ecology Manual, which resulted in a considerable increase in stormwater facility sizing. (The cities within the County were on separate timelines for their respective adoptions.) Prior to January 13, 2009, stormwater regulations in the County did not include continuous runoff modeling methods or modeling of sites in a forested condition. Other changes to the Ecology Stormwater Management Manual since 2005 include the Low Impact Development (LID) performance standard included within the 2012 Western Washington Phase II NPDES Municipal Stormwater Permit. In general, the 2012/2014 Ecology Manual requires on-site post-construction stormwater management practices for smaller projects as compared to the 2005 manual, and also includes more requirements for managing stormwater than the 2005 Manual. For development sites with good infiltration rates, the size of stormwater facilities will be very similarly sized under the 2012/14 Manual and the 2005 Manual. However, sites with poor infiltration rates will be subject to a more pronounced difference in facility sizing when comparing the two manuals.
The thresholds for post-construction stormwater controls differ between the manuals. The 2012/2014 Manual requires projects with more than 5,000 square feet of new plus replaced impervious surface area to meet all of the minimum requirements. In the 2005 Manual, the project threshold was 5,000 square feet of new impervious surface coverage. The change to include replaced impervious surfaces means more projects trigger post construction stormwater controls.
34 VBLM Infrastructure Deductions and Stormwater Facilities Analysis Memorandum. AHBL. May 28, 2020.
ECONorthwest Clark County Buildable Lands PAC Report - February 2021 38
The biggest impact is that Minimum Requirement #5 “On site Management” has significantly changed. Within the UGA, an applicant may choose standard flow control as long certain on-site flow control BMPs such as dispersion, bioretention, and permeable pavements are considered.
For areas outside the UGA, meeting the LID flow control requirement through the use of a conventional stormwater pond requires larger ponds under the 2012/2014 Manual than would have been required under the 2005 Manual or equivalent manuals because of the need to meet the LID Performance Standard.
In addition, the County’s critical areas ordinance on stormwater facilities located in wetlands or their buffers is not current and Washington State Department of Ecology identified that the County must address the degree to which stormwater facilities are allowed in wetlands and their buffers. The County needs to adopt regulations generally avoiding placing stormwater facilities in wetlands and their buffers going forward.35
Impact of Stormwater Manual Changes
To isolate the impact of the recent stormwater manual changes, AHBL compared data from “Pre-2005 manual adoption” years (2002-2007)36, and “Post 2005 manual adoption” years (2017-2019) and differentiated by jurisdiction (and accordingly the stormwater manual in place in the respective location where the plat developed), for the plats recorded in 2017, 2018, 2019. The 2017-2019 data was split into plats developed in locations where post-2005 equivalent stormwater manuals apply (unincorporated areas within UGAs but outside of city limits and land within Vancouver, Battle Ground, Camas and Washougal), and plats developed in cities where post-2005 equivalent stormwater manuals are not being used (Woodland, La Center, Ridgefield and Yacolt).
This analysis found that: “the requirements for stormwater management have affected infrastructure set-asides for residential plats: as stormwater regulations have become increasingly rigorous (based on more sophisticated models and requirements), the amount of land used to meet the requirements has increased.”37 Specifically, AHBL’s analysis found that the amount of land consumed to accommodate stormwater facilities following adoption of the 2005 stormwater manual increased by about 34 percent in jurisdictions subject to the new rules.
(Note that AHBL’s analysis calculated stormwater and other infrastructure as a percent of total plat area rather than as a percentage of developable area. This difference in approach makes a substantial difference in the percentages, as discussed below. To avoid confusion, the
35 Limited exceptions include (1) some “additional” runoff treatment or flow control of stormwater may be allowed in limited cases where specific criteria are met and mitigation is applied; or (2) if it can be shown that treated stormwater is beneficial and can improve the hydrologic functions of the wetland. 36 Clark County adopted its 2005 equivalent manual in early 2009. 37 VBLM Infrastructure Deductions and Stormwater Facilities Analysis Memorandum. AHBL. May 28, 2020.
ECONorthwest Clark County Buildable Lands PAC Report - February 2021 39
percentages identified by AHBL that were calculated as a percentage of total area are not repeated here.)
Impact of Changing Regulations for Managing Stormwater in Wetlands
To isolate the impacts of wetlands on stormwater facility sizing, AHBL used a different sub-set of the plat data that only included plats that did not have any wetland areas present, and removed plats that were part of a larger phased development with a wetland present. Due to sample size issues, this sub-set of the data did not exclude plats by year or location (with respect to stormwater manual adoption by municipalities).
This analysis found a higher percentage of plat area dedicated to stormwater in plats without wetlands, suggesting a need to increase the stormwater set-aside further relative to the percentage observed for plats subject to the current stormwater regulations.
Infrastructure as a Percent of Developable Acres
The methodology used in the DEAB testimony to calculate an infrastructure percentage subtracted the number of acres in a plat that contained critical lands that could not be used for housing in their calculation rather than the full starting acreage of the plat.38
In contrast, the analysis done by staff in the past and initial analysis by AHBL calculated infrastructure as a percentage of the total gross acres platted, rather than excluding critical lands within the plat. This difference in approach results in a different percentage, even when considering the same plats—removing the critical areas from the gross acreage prior to calculating the percentage results in a higher percentage.
AHBL’s detailed review found that infrastructure (streets, storm, and utility/other) represented 31.5% of developable acres—after excluding critical areas, open space, and future development tracts—in the BIA’s identified subdivisions. (See Exhibit 1.) For co-mingled stormwater/wetland facilities, AHBL estimated the share of the facilities that is actually used for stormwater (vs. wetland area) on a tract-by-tract basis, so this number is roughly reflective of the stormwater area that will be required when co-location is more restricted.
AHBL also looked at the Countywide plat data set, overlaying mapped critical lands to identify open space tracts that should be excluded to arrive at developable acres. This analysis focused on recent plats (since 2014) to reduce the impacts of older regulations. However, this subset did not fully address this issue: the prior analysis shows that even the recent plats from jurisdictions not yet subject to the 2005 Stormwater Manual had lower stormwater set-asides on average, and
38 Note that the information submitted listed these acreages as “gross” acres, which usually represents the full starting acreage of the plat, even though they did not include critical land, leading to some initial confusion over differences with the Project Team’s analysis.
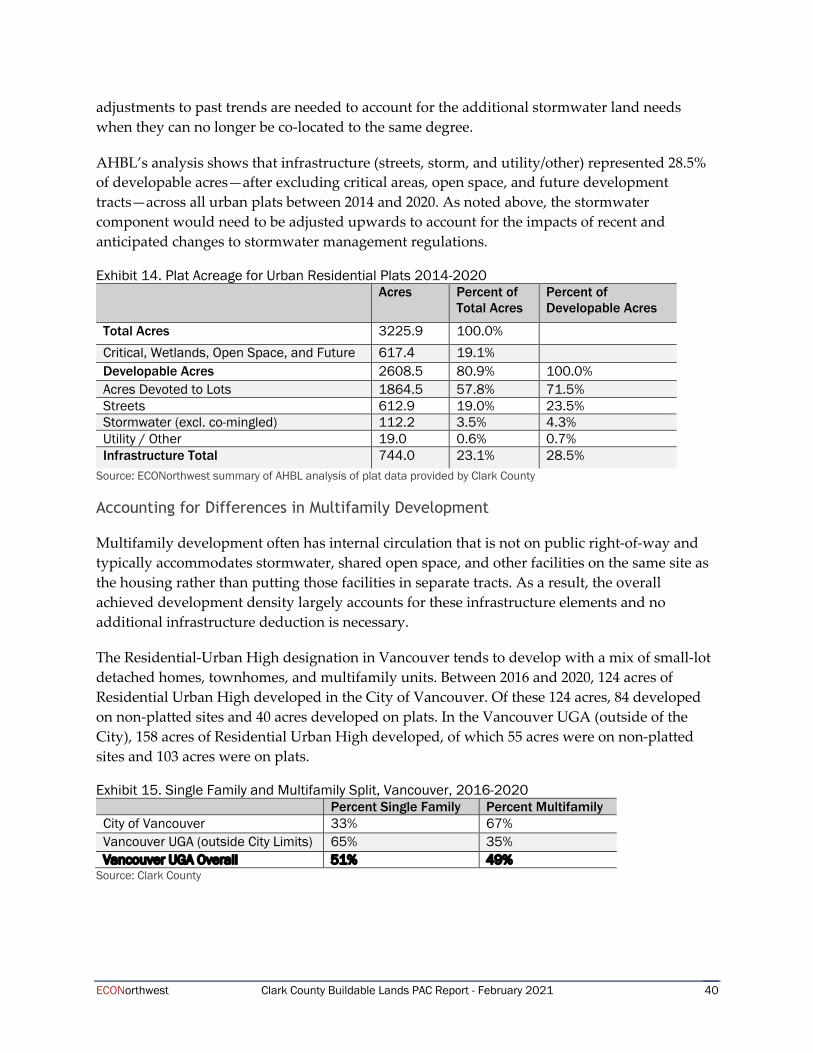
ECONorthwest Clark County Buildable Lands PAC Report - February 2021 40
adjustments to past trends are needed to account for the additional stormwater land needs when they can no longer be co-located to the same degree.
AHBL’s analysis shows that infrastructure (streets, storm, and utility/other) represented 28.5% of developable acres—after excluding critical areas, open space, and future development tracts—across all urban plats between 2014 and 2020. As noted above, the stormwater component would need to be adjusted upwards to account for the impacts of recent and anticipated changes to stormwater management regulations.
Exhibit 14. Plat Acreage for Urban Residential Plats 2014-2020 Acres Percent of
Total Acres Percent of Developable Acres
Total Acres 3225.9 100.0%
Critical, Wetlands, Open Space, and Future 617.4 19.1%
Developable Acres 2608.5 80.9% 100.0% Acres Devoted to Lots 1864.5 57.8% 71.5% Streets 612.9 19.0% 23.5% Stormwater (excl. co-mingled) 112.2 3.5% 4.3% Utility / Other 19.0 0.6% 0.7% Infrastructure Total 744.0 23.1% 28.5%
Source: ECONorthwest summary of AHBL analysis of plat data provided by Clark County
Accounting for Differences in Multifamily Development
Multifamily development often has internal circulation that is not on public right-of-way and typically accommodates stormwater, shared open space, and other facilities on the same site as the housing rather than putting those facilities in separate tracts. As a result, the overall achieved development density largely accounts for these infrastructure elements and no additional infrastructure deduction is necessary.
The Residential-Urban High designation in Vancouver tends to develop with a mix of small-lot detached homes, townhomes, and multifamily units. Between 2016 and 2020, 124 acres of Residential Urban High developed in the City of Vancouver. Of these 124 acres, 84 developed on non-platted sites and 40 acres developed on plats. In the Vancouver UGA (outside of the City), 158 acres of Residential Urban High developed, of which 55 acres were on non-platted sites and 103 acres were on plats.
Exhibit 15. Single Family and Multifamily Split, Vancouver, 2016-2020 Percent Single Family Percent Multifamily
City of Vancouver 33% 67% Vancouver UGA (outside City Limits) 65% 35% Vancouver UGA Overall 51% 49%
Source: Clark County
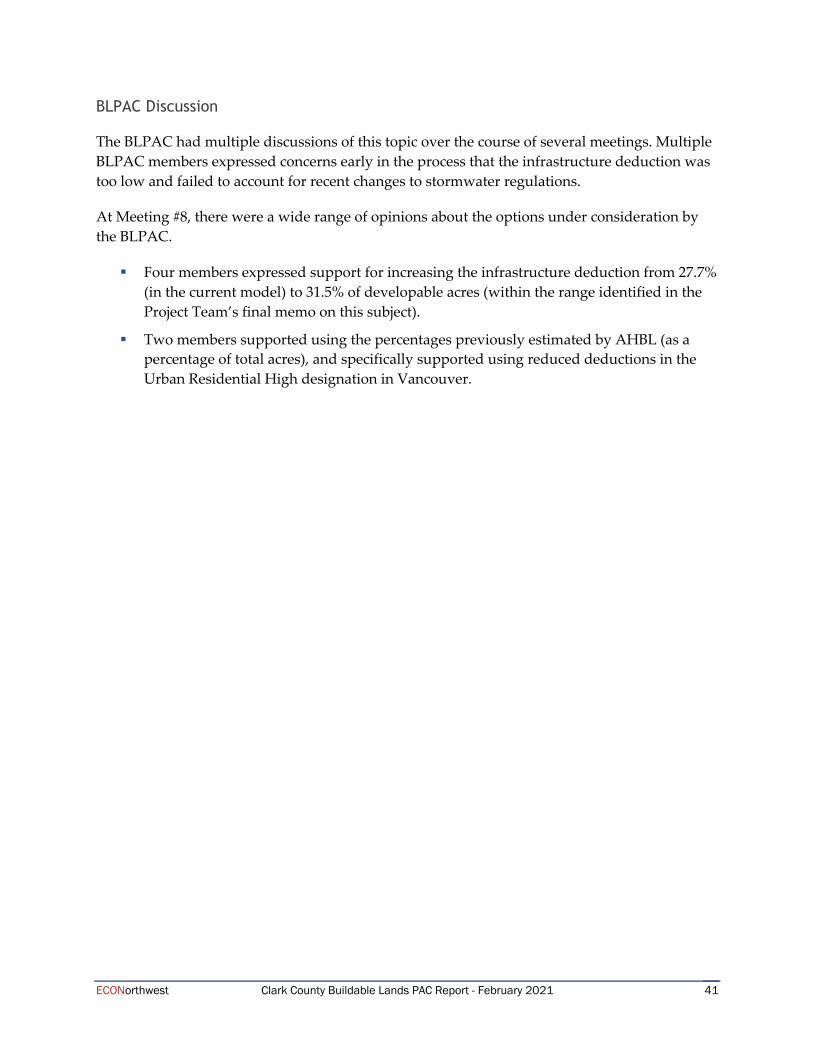
ECONorthwest Clark County Buildable Lands PAC Report - February 2021 41
BLPAC Discussion
The BLPAC had multiple discussions of this topic over the course of several meetings. Multiple BLPAC members expressed concerns early in the process that the infrastructure deduction was too low and failed to account for recent changes to stormwater regulations.
At Meeting #8, there were a wide range of opinions about the options under consideration by the BLPAC.
§ Four members expressed support for increasing the infrastructure deduction from 27.7% (in the current model) to 31.5% of developable acres (within the range identified in the Project Team’s final memo on this subject).
§ Two members supported using the percentages previously estimated by AHBL (as a percentage of total acres), and specifically supported using reduced deductions in the Urban Residential High designation in Vancouver.

ECONorthwest Clark County Buildable Lands PAC Report - February 2021
Attachment A
Buildable Lands Program Advisory Committee Meeting and Decision Protocols

1
Buildable Lands Program Advisory Committee Meeting and Decision Protocols
We will
• Treat everyone with respect. • Listen carefully with the intent of understanding. • Let others finish before speaking. • Share the air – let others speak once before speaking twice. • Raise issues honestly, clearly and early in the process. • Focus questions and comments on the subject at hand and stick to the agenda. • When discussing events or issues of the past, apply them productively to the present discussion
and purpose of the committee. • Seek to find common ground. • Put cell phones on silent mode.
Other meeting protocols • Meetings will end on time. If agenda items cannot be completed on time, the group will decide
if the meeting should be extended or if an additional meeting should be scheduled. • Meetings will be facilitated. • We will make an effort to attend all meetings and will prepare for meetings by reading materials
in advance and arriving on time. • If we have an unavoidable conflict that requires us to be late or absent, we will notify staff in
advance of the meeting, and may send written comments on the materials to staff to share with other members during the meeting. An alternate may attend, observe, and comment as a member of the public, but may not participate as a member of the committee (including for voting).
Accessibility to the public • While the primary purpose of the committee meetings is to provide a forum for deliberation, all
meetings will be open to the public. • Meetings will be documented through summaries and recordings available to committee
members and the public. Summaries will be reviewed and approved by the committee at the following meeting. Draft meeting summaries will be made available to the committee and the public a minimum of one week prior to the following meeting.
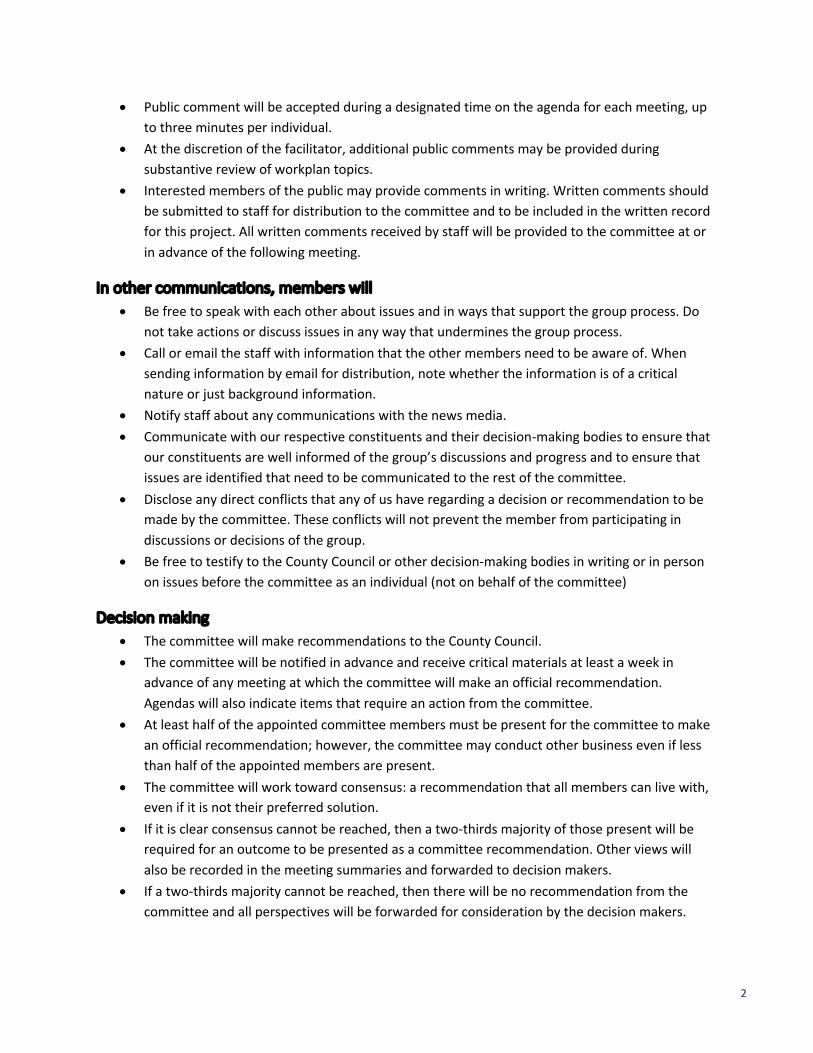
2
• Public comment will be accepted during a designated time on the agenda for each meeting, up to three minutes per individual.
• At the discretion of the facilitator, additional public comments may be provided during substantive review of workplan topics.
• Interested members of the public may provide comments in writing. Written comments should be submitted to staff for distribution to the committee and to be included in the written record for this project. All written comments received by staff will be provided to the committee at or in advance of the following meeting.
In other communications, members will • Be free to speak with each other about issues and in ways that support the group process. Do
not take actions or discuss issues in any way that undermines the group process. • Call or email the staff with information that the other members need to be aware of. When
sending information by email for distribution, note whether the information is of a critical nature or just background information.
• Notify staff about any communications with the news media. • Communicate with our respective constituents and their decision-making bodies to ensure that
our constituents are well informed of the group’s discussions and progress and to ensure that issues are identified that need to be communicated to the rest of the committee.
• Disclose any direct conflicts that any of us have regarding a decision or recommendation to be made by the committee. These conflicts will not prevent the member from participating in discussions or decisions of the group.
• Be free to testify to the County Council or other decision-making bodies in writing or in person on issues before the committee as an individual (not on behalf of the committee)
Decision making • The committee will make recommendations to the County Council. • The committee will be notified in advance and receive critical materials at least a week in
advance of any meeting at which the committee will make an official recommendation. Agendas will also indicate items that require an action from the committee.
• At least half of the appointed committee members must be present for the committee to make an official recommendation; however, the committee may conduct other business even if less than half of the appointed members are present.
• The committee will work toward consensus: a recommendation that all members can live with, even if it is not their preferred solution.
• If it is clear consensus cannot be reached, then a two-thirds majority of those present will be required for an outcome to be presented as a committee recommendation. Other views will also be recorded in the meeting summaries and forwarded to decision makers.
• If a two-thirds majority cannot be reached, then there will be no recommendation from the committee and all perspectives will be forwarded for consideration by the decision makers.

3
• For major committee recommendations, strive to allow additional time for public comment before finalizing a recommendation. For instance, when feasible, this could include forming a preliminary recommendation at one meeting and confirming or revisiting that recommendation at the next meeting.
• Respect group decisions as final unless the group as a whole reaches consensus that a decision needs to be revisited.

ECONorthwest Clark County Buildable Lands PAC Report - February 2021
Attachment B
Rural Land Capacity Estimates Methodology
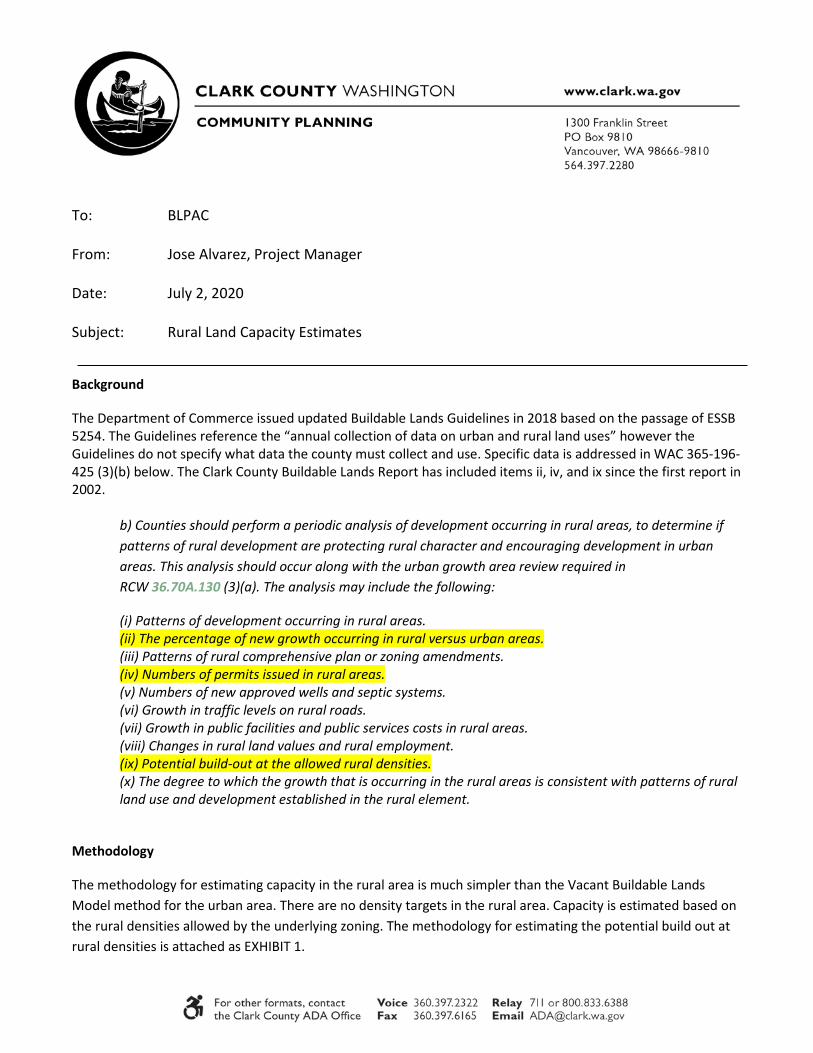
To: BLPAC From: Jose Alvarez, Project Manager Date: July 2, 2020 Subject: Rural Land Capacity Estimates Background
The Department of Commerce issued updated Buildable Lands Guidelines in 2018 based on the passage of ESSB 5254. The Guidelines reference the “annual collection of data on urban and rural land uses” however the Guidelines do not specify what data the county must collect and use. Specific data is addressed in WAC 365-196-425 (3)(b) below. The Clark County Buildable Lands Report has included items ii, iv, and ix since the first report in 2002.
b) Counties should perform a periodic analysis of development occurring in rural areas, to determine if patterns of rural development are protecting rural character and encouraging development in urban areas. This analysis should occur along with the urban growth area review required in RCW 36.70A.130 (3)(a). The analysis may include the following:
(i) Patterns of development occurring in rural areas. (ii) The percentage of new growth occurring in rural versus urban areas. (iii) Patterns of rural comprehensive plan or zoning amendments. (iv) Numbers of permits issued in rural areas. (v) Numbers of new approved wells and septic systems. (vi) Growth in traffic levels on rural roads. (vii) Growth in public facilities and public services costs in rural areas. (viii) Changes in rural land values and rural employment. (ix) Potential build-out at the allowed rural densities. (x) The degree to which the growth that is occurring in the rural areas is consistent with patterns of rural land use and development established in the rural element.
Methodology
The methodology for estimating capacity in the rural area is much simpler than the Vacant Buildable Lands Model method for the urban area. There are no density targets in the rural area. Capacity is estimated based on the rural densities allowed by the underlying zoning. The methodology for estimating the potential build out at rural densities is attached as EXHIBIT 1.
2
There is no infrastructure deduction in the rural area because private roads are being used to serve developments and are also included in lot area calculations. Lots abutting public roads can count up to 30’ of the right-of-way as part of the lot area for the purposes of land division.
Critical areas are not considered a limiting factor in the potential development of land in the rural area. Development envelopes and cluster development standards allow flexibility in site planning to avoid critical areas. Both the habitat and wetland ordinances have a reasonable use provision that states: “This chapter shall not be used to deny or reduce the number of lots of a proposed rural land division allowed under the applicable zoning density.”
Stormwater is typically treated on site through infiltration, low impact development Best Management Practices (BMP’s) such as dispersion or bioretention ponds. Given the larger parcel sizes in the rural area these BMPs can be accommodated with no loss of potential lots.
Employment The Growth Management Act (GMA) allows for the recognition of Limited Areas of More Intensive Rural Development (LAMIRD’S) that existed as commercial nodes in 1990 when the GMA became effective. In Clark County there are seven LAMIRDs, referred to as rural centers.
Commercial and Industrially zoned land in the rural area is concentrated in the rural centers. In addition to commercial businesses to serve the rural residents these rural centers have schools, fire stations and other public facilities. Two of the rural centers, Chelatchie Prairie and Brush Prairie, have land zoned for Heavy Industrial uses.
Forestry, surface mining, agriculture, wineries and equestrian businesses are sources of employment in the rural area that are land dependent.
Home businesses are also allowed on rural residential land on a scale commensurate with parcel size i.e. (a maximum of 6 non-resident employees and up to 5,000 sq. ft. accessory structures are allowed on parcels 20 acres or greater).
Employment data from the Employment Security Department (ESD) has been a challenge to use in the urban areas due to proprietary issues that changed how the ESD can share the data. These proprietary issues are further exacerbated in the rural area due to the limited number of employers, land-based employment and the data limitations, as only employees participating in the unemployment insurance program are counted.
From 1994 through 2016 the County’s comprehensive plans have used employment projections and density assumptions for estimating the amount of land needed to accommodate 20 years of employment growth in the urban areas.
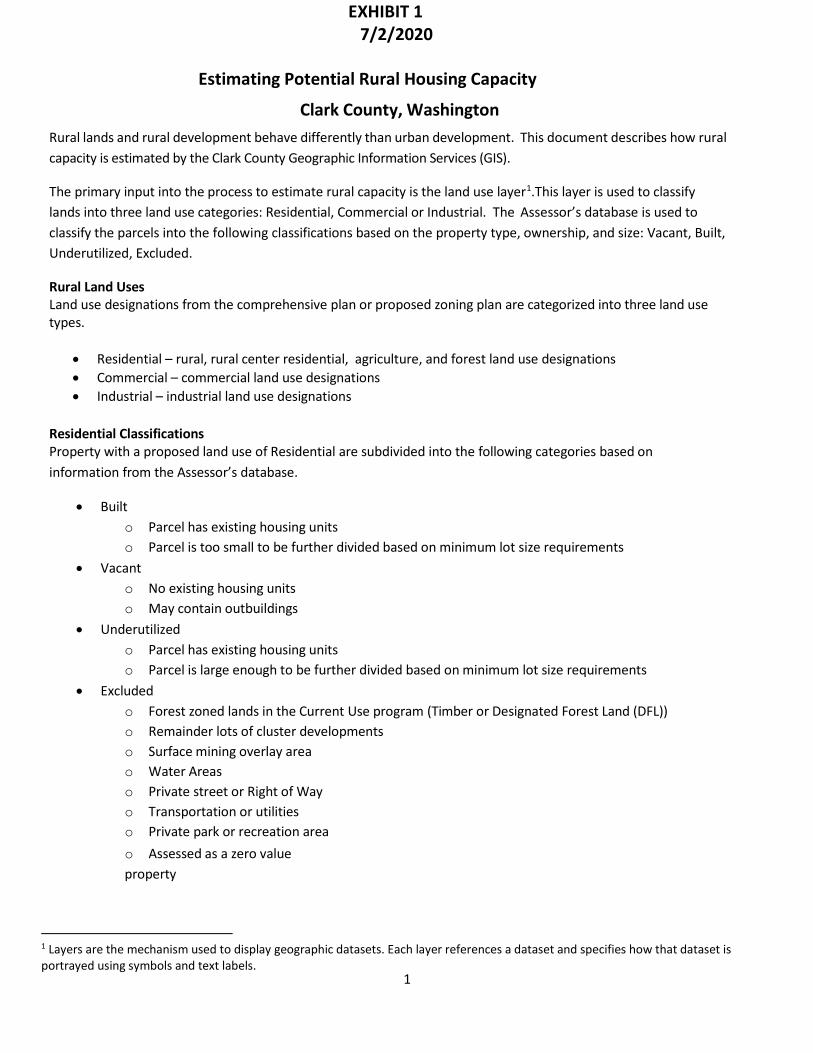
1
EXHIBIT 1 7/2/2020
Estimating Potential Rural Housing Capacity
Clark County, Washington Rural lands and rural development behave differently than urban development. This document describes how rural capacity is estimated by the Clark County Geographic Information Services (GIS).
The primary input into the process to estimate rural capacity is the land use layer1.This layer is used to classify lands into three land use categories: Residential, Commercial or Industrial. The Assessor’s database is used to classify the parcels into the following classifications based on the property type, ownership, and size: Vacant, Built, Underutilized, Excluded.
Rural Land Uses Land use designations from the comprehensive plan or proposed zoning plan are categorized into three land use types.
• Residential – rural, rural center residential, agriculture, and forest land use designations • Commercial – commercial land use designations • Industrial – industrial land use designations
Residential Classifications Property with a proposed land use of Residential are subdivided into the following categories based on information from the Assessor’s database.
• Built o Parcel has existing housing units o Parcel is too small to be further divided based on minimum lot size requirements
• Vacant o No existing housing units o May contain outbuildings
• Underutilized o Parcel has existing housing units o Parcel is large enough to be further divided based on minimum lot size requirements
• Excluded o Forest zoned lands in the Current Use program (Timber or Designated Forest Land (DFL)) o Remainder lots of cluster developments o Surface mining overlay area o Water Areas o Private street or Right of Way o Transportation or utilities o Private park or recreation area o Assessed as a zero value property
1 Layers are the mechanism used to display geographic datasets. Each layer references a dataset and specifies how that dataset is portrayed using symbols and text labels.

2
EXHIBIT 1 7/2/2020
o Size is less than 1 acre o Tax exempt o Mobile Home Parks
• Not a Residential land use
Residential Planning Assumptions: • Housing capacity calculation:
• One housing unit per undersized vacant parcel • Conforming vacant and underutilized parcels
• Housing unit capacity is calculated by dividing the parcel acres by the minimum lot size. • For dividable parcels lots are considered buildable if they are within 10% of the minimum
lot size.
o Population Capacity calculation 2.66 persons per housing unit

ECONorthwest Clark County Buildable Lands PAC Report - February 2021
Attachment C
2015 VBLM Methodology
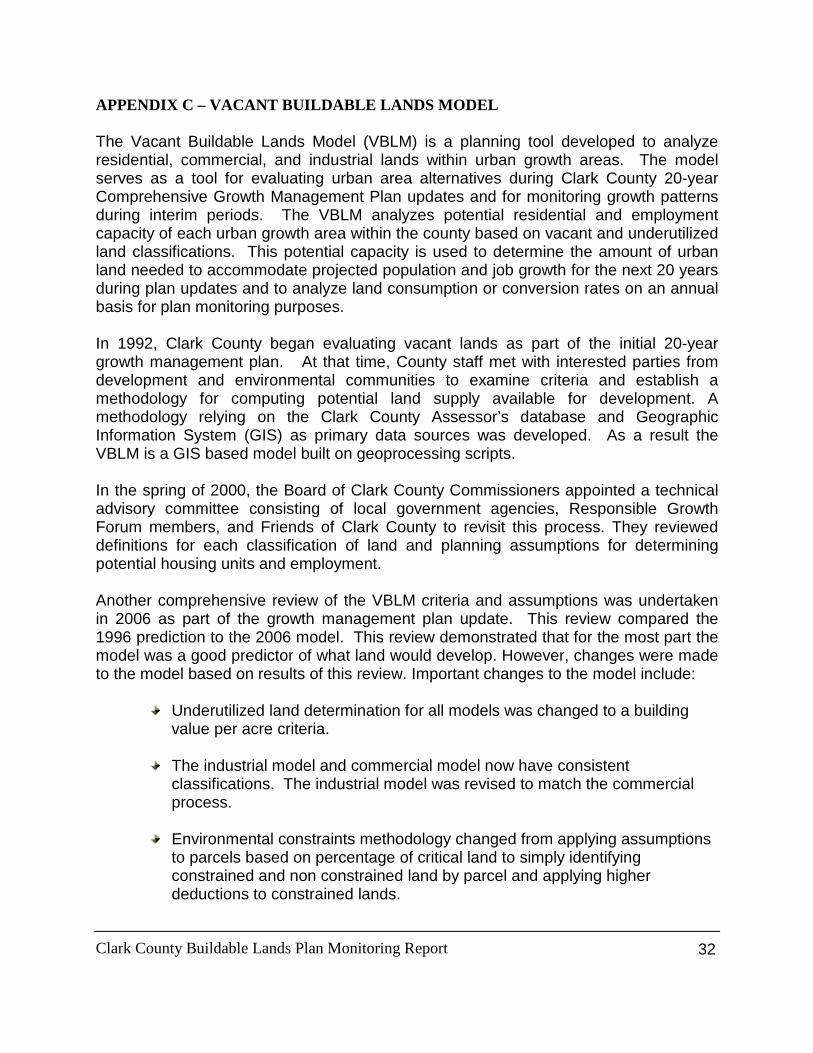
APPENDIX C – VACANT BUILDABLE LANDS MODEL The Vacant Buildable Lands Model (VBLM) is a planning tool developed to analyze residential, commercial, and industrial lands within urban growth areas. The model serves as a tool for evaluating urban area alternatives during Clark County 20-year Comprehensive Growth Management Plan updates and for monitoring growth patterns during interim periods. The VBLM analyzes potential residential and employment capacity of each urban growth area within the county based on vacant and underutilized land classifications. This potential capacity is used to determine the amount of urban land needed to accommodate projected population and job growth for the next 20 years during plan updates and to analyze land consumption or conversion rates on an annual basis for plan monitoring purposes. In 1992, Clark County began evaluating vacant lands as part of the initial 20-year growth management plan. At that time, County staff met with interested parties from development and environmental communities to examine criteria and establish a methodology for computing potential land supply available for development. A methodology relying on the Clark County Assessor’s database and Geographic Information System (GIS) as primary data sources was developed. As a result the VBLM is a GIS based model built on geoprocessing scripts. In the spring of 2000, the Board of Clark County Commissioners appointed a technical advisory committee consisting of local government agencies, Responsible Growth Forum members, and Friends of Clark County to revisit this process. They reviewed definitions for each classification of land and planning assumptions for determining potential housing units and employment. Another comprehensive review of the VBLM criteria and assumptions was undertaken in 2006 as part of the growth management plan update. This review compared the 1996 prediction to the 2006 model. This review demonstrated that for the most part the model was a good predictor of what land would develop. However, changes were made to the model based on results of this review. Important changes to the model include:
Underutilized land determination for all models was changed to a building value per acre criteria.
The industrial model and commercial model now have consistent
classifications. The industrial model was revised to match the commercial process.
Environmental constraints methodology changed from applying assumptions
to parcels based on percentage of critical land to simply identifying constrained and non constrained land by parcel and applying higher deductions to constrained lands.
Clark County Buildable Lands Plan Monitoring Report
32
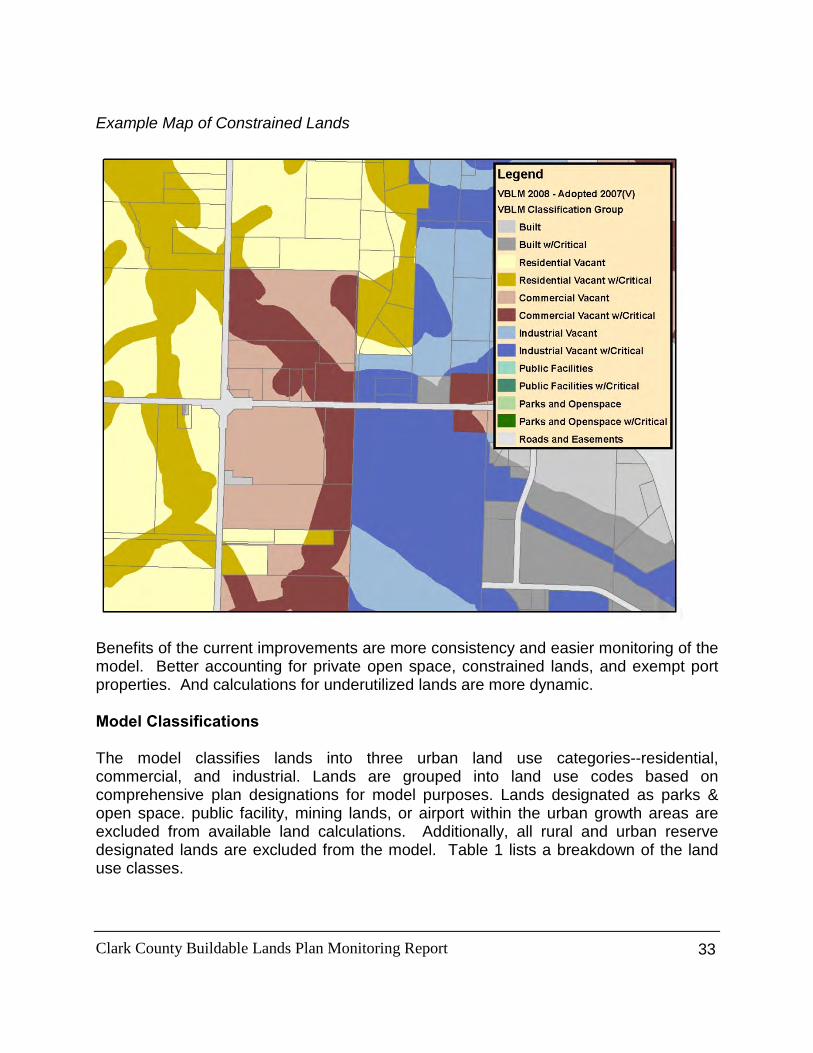
Example Map of Constrained Lands
Benefits of the current improvements are more consistency and easier monitoring of the model. Better accounting for private open space, constrained lands, and exempt port properties. And calculations for underutilized lands are more dynamic. Model Classifications The model classifies lands into three urban land use categories--residential, commercial, and industrial. Lands are grouped into land use codes based on comprehensive plan designations for model purposes. Lands designated as parks & open space. public facility, mining lands, or airport within the urban growth areas are excluded from available land calculations. Additionally, all rural and urban reserve designated lands are excluded from the model. Table 1 lists a breakdown of the land use classes.
Clark County Buildable Lands Plan Monitoring Report
33
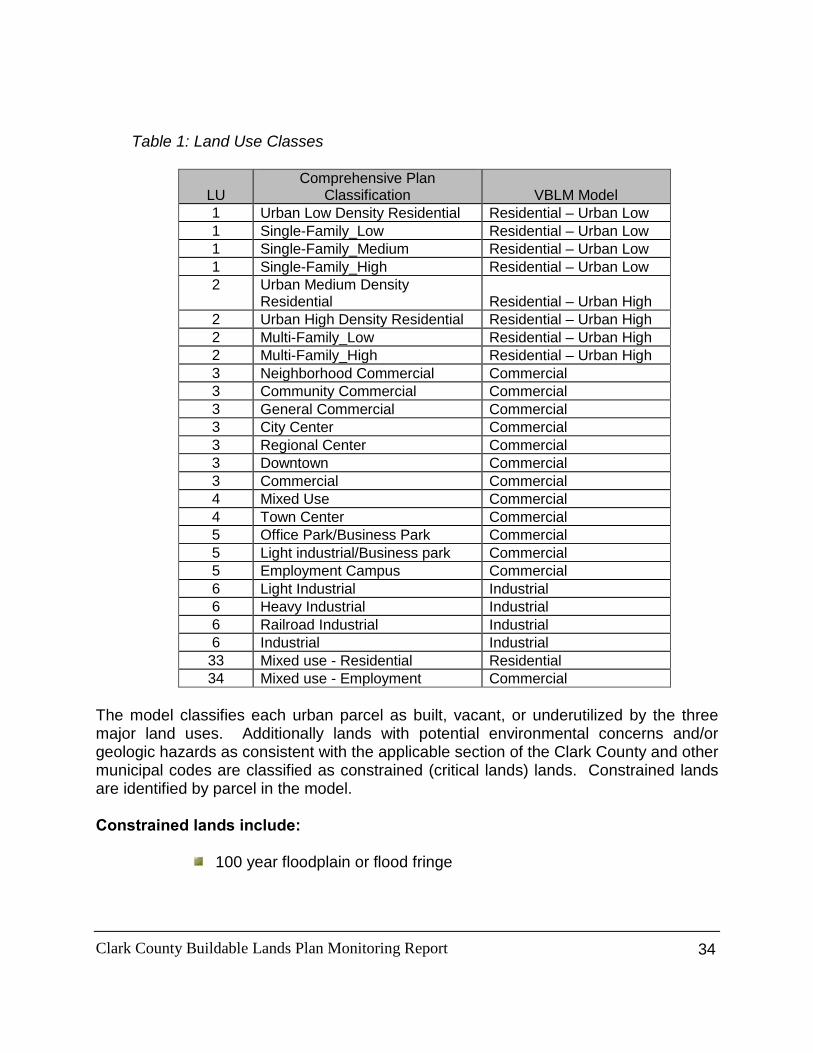
Table 1: Land Use Classes
LU Comprehensive Plan
Classification VBLM Model 1 Urban Low Density Residential Residential – Urban Low 1 Single-Family_Low Residential – Urban Low 1 Single-Family_Medium Residential – Urban Low 1 Single-Family_High Residential – Urban Low 2 Urban Medium Density
Residential Residential – Urban High 2 Urban High Density Residential Residential – Urban High 2 Multi-Family_Low Residential – Urban High 2 Multi-Family_High Residential – Urban High 3 Neighborhood Commercial Commercial 3 Community Commercial Commercial 3 General Commercial Commercial 3 City Center Commercial 3 Regional Center Commercial 3 Downtown Commercial 3 Commercial Commercial 4 Mixed Use Commercial 4 Town Center Commercial 5 Office Park/Business Park Commercial 5 Light industrial/Business park Commercial 5 Employment Campus Commercial 6 Light Industrial Industrial 6 Heavy Industrial Industrial 6 Railroad Industrial Industrial 6 Industrial Industrial
33 Mixed use - Residential Residential 34 Mixed use - Employment Commercial
The model classifies each urban parcel as built, vacant, or underutilized by the three major land uses. Additionally lands with potential environmental concerns and/or geologic hazards as consistent with the applicable section of the Clark County and other municipal codes are classified as constrained (critical lands) lands. Constrained lands are identified by parcel in the model. Constrained lands include:
100 year floodplain or flood fringe
Clark County Buildable Lands Plan Monitoring Report
34
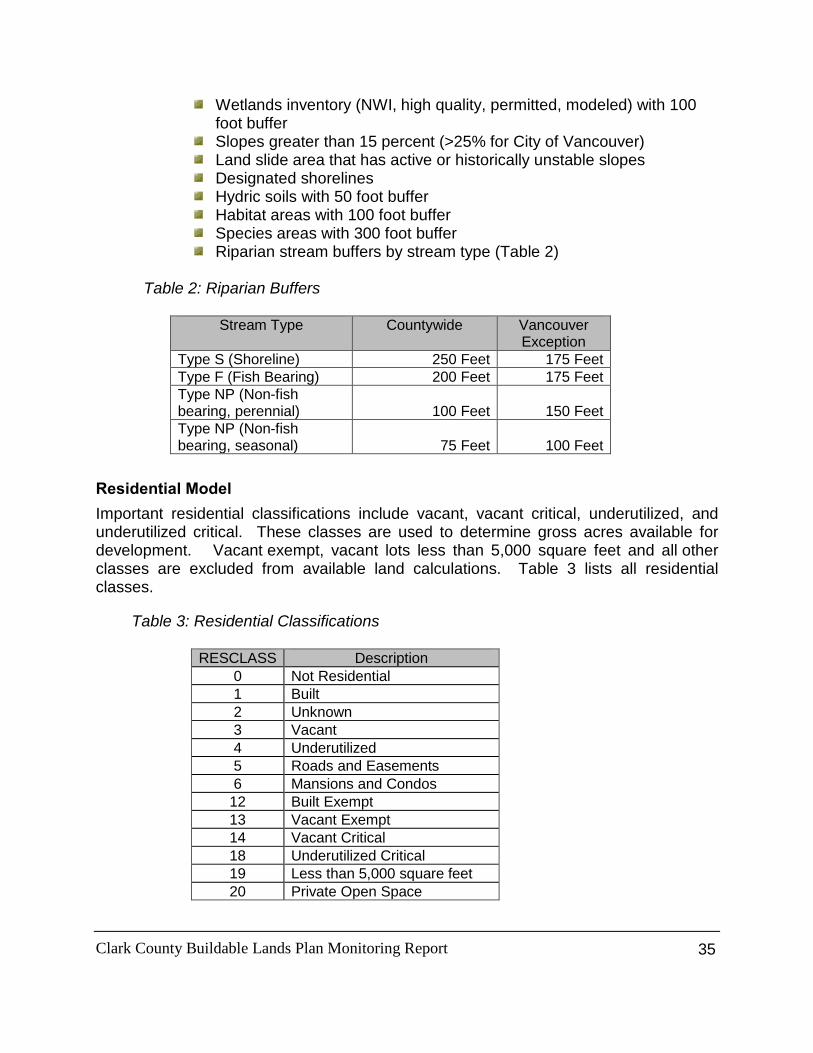
Wetlands inventory (NWI, high quality, permitted, modeled) with 100 foot buffer
Slopes greater than 15 percent (>25% for City of Vancouver) Land slide area that has active or historically unstable slopes Designated shorelines Hydric soils with 50 foot buffer Habitat areas with 100 foot buffer Species areas with 300 foot buffer Riparian stream buffers by stream type (Table 2)
Table 2: Riparian Buffers
Stream Type Countywide Vancouver
Exception Type S (Shoreline) 250 Feet 175 Feet Type F (Fish Bearing) 200 Feet 175 Feet Type NP (Non-fish bearing, perennial) 100 Feet 150 Feet Type NP (Non-fish bearing, seasonal) 75 Feet 100 Feet
Residential Model Important residential classifications include vacant, vacant critical, underutilized, and underutilized critical. These classes are used to determine gross acres available for development. Vacant exempt, vacant lots less than 5,000 square feet and all other classes are excluded from available land calculations. Table 3 lists all residential classes.
Table 3: Residential Classifications RESCLASS Description
0 Not Residential 1 Built 2 Unknown 3 Vacant 4 Underutilized 5 Roads and Easements 6 Mansions and Condos
12 Built Exempt 13 Vacant Exempt 14 Vacant Critical 18 Underutilized Critical 19 Less than 5,000 square feet 20 Private Open Space
Clark County Buildable Lands Plan Monitoring Report
35
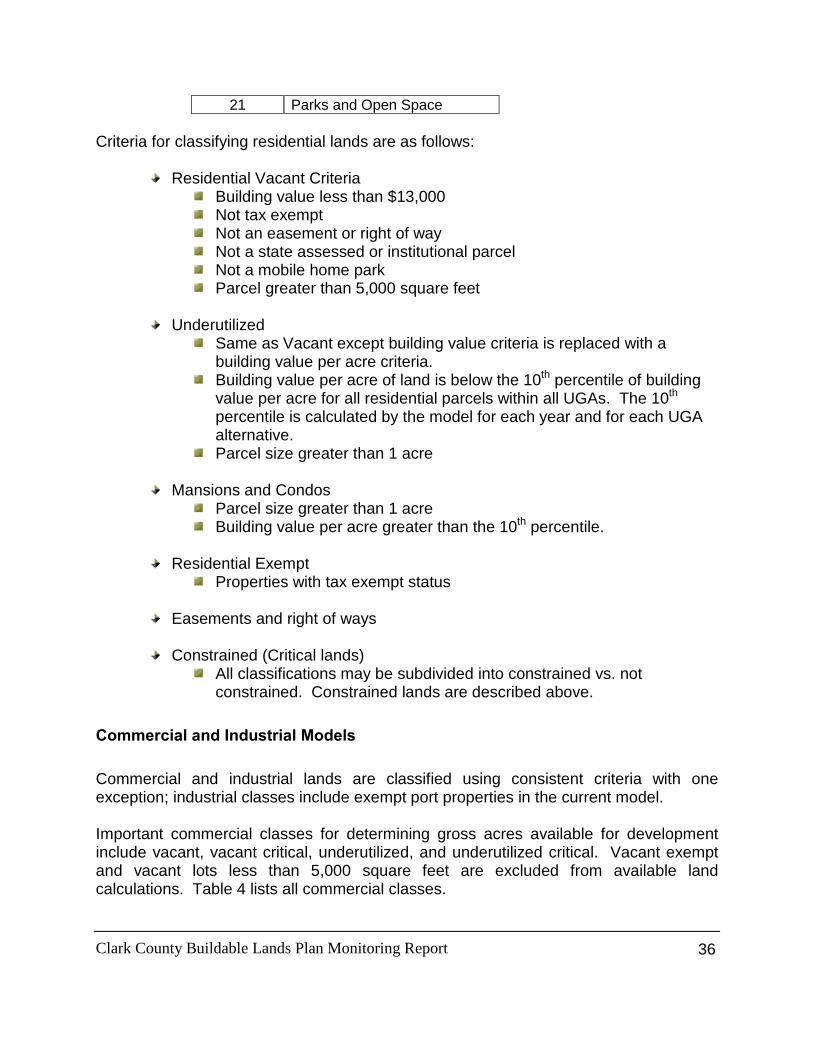
21 Parks and Open Space Criteria for classifying residential lands are as follows:
Residential Vacant Criteria Building value less than $13,000 Not tax exempt Not an easement or right of way Not a state assessed or institutional parcel Not a mobile home park Parcel greater than 5,000 square feet
Underutilized
Same as Vacant except building value criteria is replaced with a building value per acre criteria.
Building value per acre of land is below the 10th percentile of building value per acre for all residential parcels within all UGAs. The 10th percentile is calculated by the model for each year and for each UGA alternative.
Parcel size greater than 1 acre
Mansions and Condos Parcel size greater than 1 acre Building value per acre greater than the 10th percentile.
Residential Exempt
Properties with tax exempt status
Easements and right of ways
Constrained (Critical lands) All classifications may be subdivided into constrained vs. not
constrained. Constrained lands are described above. Commercial and Industrial Models Commercial and industrial lands are classified using consistent criteria with one exception; industrial classes include exempt port properties in the current model. Important commercial classes for determining gross acres available for development include vacant, vacant critical, underutilized, and underutilized critical. Vacant exempt and vacant lots less than 5,000 square feet are excluded from available land calculations. Table 4 lists all commercial classes.
Clark County Buildable Lands Plan Monitoring Report
36
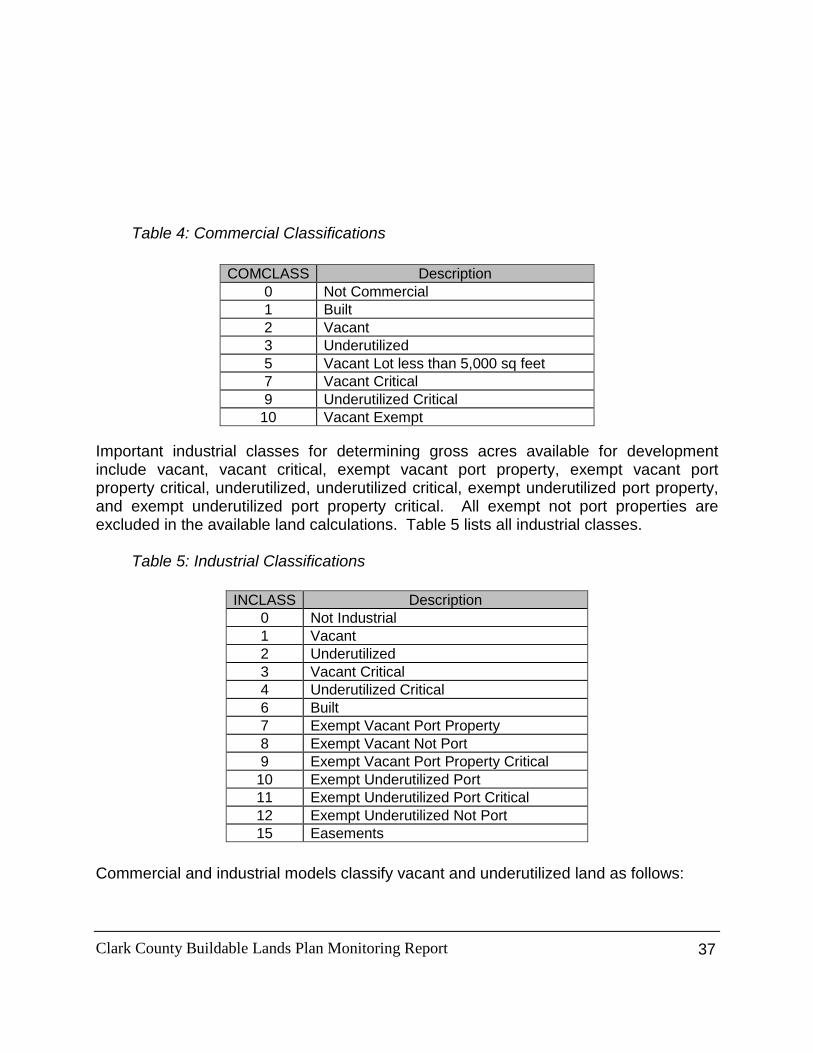
Table 4: Commercial Classifications
Important industrial classes for determining gross acres available for development include vacant, vacant critical, exempt vacant port property, exempt vacant port property critical, underutilized, underutilized critical, exempt underutilized port property, and exempt underutilized port property critical. All exempt not port properties are excluded in the available land calculations. Table 5 lists all industrial classes.
Table 5: Industrial Classifications Commercial and industrial models classify vacant and underutilized land as follows:
COMCLASS Description 0 Not Commercial 1 Built 2 Vacant 3 Underutilized 5 Vacant Lot less than 5,000 sq feet 7 Vacant Critical 9 Underutilized Critical
10 Vacant Exempt
INCLASS Description 0 Not Industrial 1 Vacant 2 Underutilized 3 Vacant Critical 4 Underutilized Critical 6 Built 7 Exempt Vacant Port Property 8 Exempt Vacant Not Port 9 Exempt Vacant Port Property Critical
10 Exempt Underutilized Port 11 Exempt Underutilized Port Critical 12 Exempt Underutilized Not Port 15 Easements
Clark County Buildable Lands Plan Monitoring Report
37
Vacant land Building value less than $67,500 Not “Assessed With”- Some parcels are assessed with other parcels.
These parcels are often parking lots, or multiple parcels comprising a single development. All assessed with parcels are considered built.
Not Exempt. Port property is exempt, and is included as a separate
classification in the Industrial land model. Not an Easement or right of way Parcel greater than 5,000 square feet Not a state assessed or institutional parcel
Underutilized Lands
Same as vacant except building value criteria is replaced with a building value per acre criteria of less than $50,000.
Constrained (Critical lands)
All classifications may be subdivided into constrained vs. not constrained. Commercial and industrial constrained lands are defined the same as residential constrained lands and are listed above.
Exempt Port Properties in the Industrial Model
Includes lands that are under port ownership and available for development. Buildable exempt port properties are included in available land calculations.
Port properties can be classified as vacant, underutilized, or constrained.
The model produces a summary of gross residential, commercial, and industrial acres available for development. Gross acres are defined as the total raw land available for development prior to any deductions for infrastructure, constrained lands, and not to convert factors. Planning Assumptions The next step in the buildable lands process is applying planning assumptions to the inventory of vacant and underutilized gross acres in order to arrive at a net available land supply. These assumptions account for infrastructure, reduced development on constrained land, and never to convert factors. Use factors along with employment and housing units per acre densities are applied to derived net acres to predict future capacities. Residential Model Planning Assumptions:
Clark County Buildable Lands Plan Monitoring Report
38
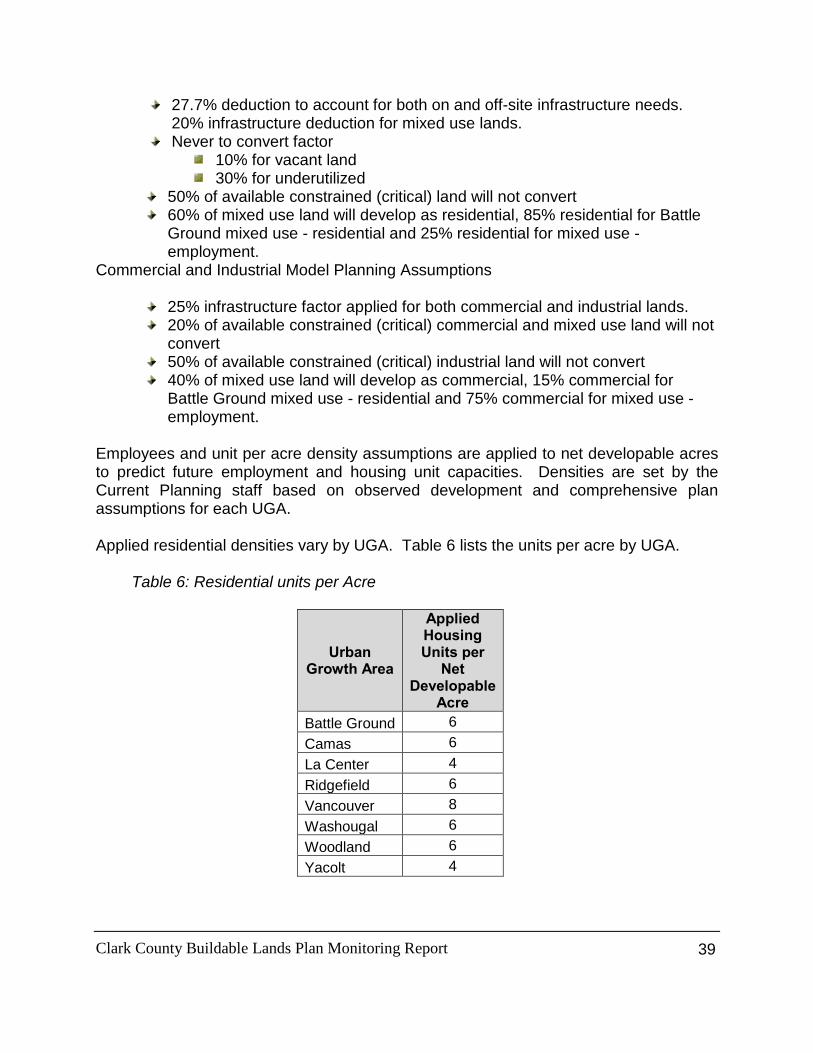
27.7% deduction to account for both on and off-site infrastructure needs. 20% infrastructure deduction for mixed use lands.
Never to convert factor 10% for vacant land 30% for underutilized
50% of available constrained (critical) land will not convert 60% of mixed use land will develop as residential, 85% residential for Battle
Ground mixed use - residential and 25% residential for mixed use - employment.
Commercial and Industrial Model Planning Assumptions
25% infrastructure factor applied for both commercial and industrial lands. 20% of available constrained (critical) commercial and mixed use land will not
convert 50% of available constrained (critical) industrial land will not convert 40% of mixed use land will develop as commercial, 15% commercial for
Battle Ground mixed use - residential and 75% commercial for mixed use - employment.
Employees and unit per acre density assumptions are applied to net developable acres to predict future employment and housing unit capacities. Densities are set by the Current Planning staff based on observed development and comprehensive plan assumptions for each UGA. Applied residential densities vary by UGA. Table 6 lists the units per acre by UGA.
Table 6: Residential units per Acre
Urban Growth Area
Applied Housing Units per
Net Developable
Acre Battle Ground 6 Camas 6 La Center 4 Ridgefield 6 Vancouver 8 Washougal 6 Woodland 6 Yacolt 4
Clark County Buildable Lands Plan Monitoring Report
39
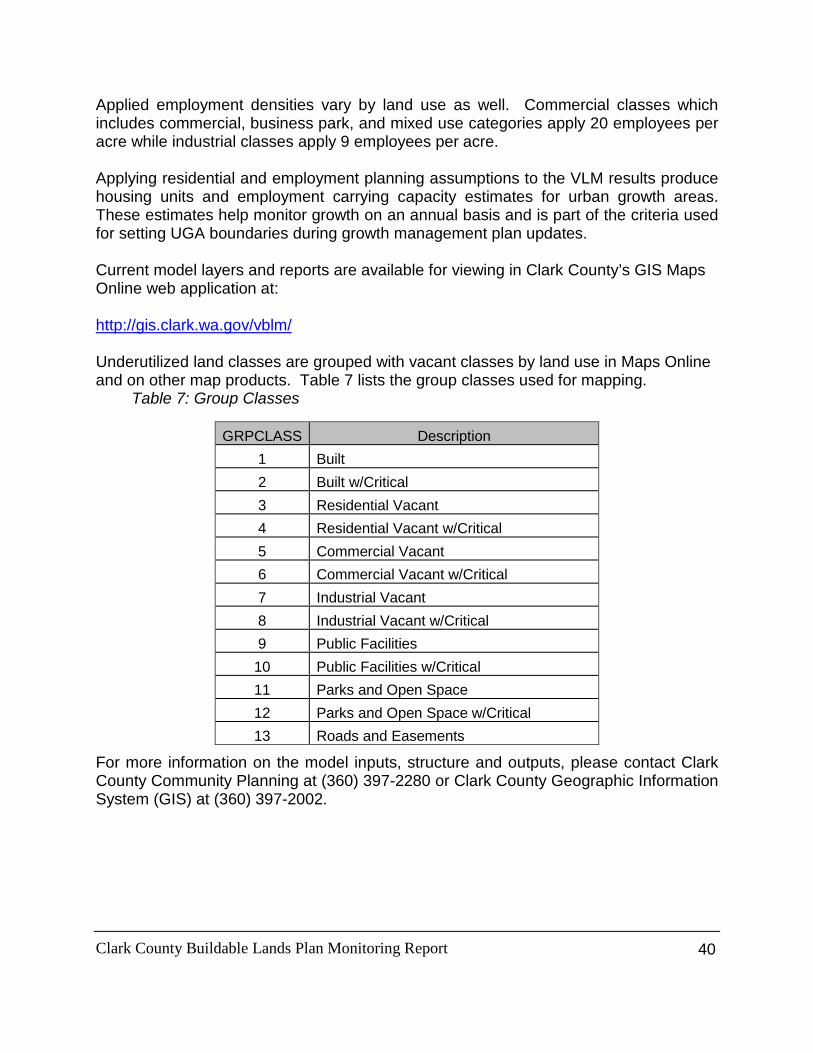
Applied employment densities vary by land use as well. Commercial classes which includes commercial, business park, and mixed use categories apply 20 employees per acre while industrial classes apply 9 employees per acre. Applying residential and employment planning assumptions to the VLM results produce housing units and employment carrying capacity estimates for urban growth areas. These estimates help monitor growth on an annual basis and is part of the criteria used for setting UGA boundaries during growth management plan updates. Current model layers and reports are available for viewing in Clark County’s GIS Maps Online web application at: http://gis.clark.wa.gov/vblm/ Underutilized land classes are grouped with vacant classes by land use in Maps Online and on other map products. Table 7 lists the group classes used for mapping.
Table 7: Group Classes For more information on the model inputs, structure and outputs, please contact Clark County Community Planning at (360) 397-2280 or Clark County Geographic Information System (GIS) at (360) 397-2002.
GRPCLASS Description 1 Built 2 Built w/Critical 3 Residential Vacant 4 Residential Vacant w/Critical 5 Commercial Vacant 6 Commercial Vacant w/Critical 7 Industrial Vacant 8 Industrial Vacant w/Critical 9 Public Facilities 10 Public Facilities w/Critical 11 Parks and Open Space 12 Parks and Open Space w/Critical 13 Roads and Easements
Clark County Buildable Lands Plan Monitoring Report
40