Embed Size (px)
DESCRIPTION
From Knowledge to Action Linking Harvard and Red Cross Work Pablo Suarez Red Cross Red Crescent Climate Centre
Citation preview

From Knowledge to Action: !Linking Harvard and Red Cross Work!
!!!Pablo Suarez!Red Cross / Red Crescent ! ! ! ! ! !
!Climate Centre!!!!!!!!!!!!!!!!

Exciting times: !The world in our hands…!

Challenges of New Science-based Predictions!
A. Patt, with data from IRI!

Information vs. Communication and Use !

Mme. Khin Cho Cho Shein vs Cyclone Nargis (Myanmar)!

Evidence of change: Andean glacier (Yanamarey, Perú)!
1987!1997!
2005!
1987!


Apocalypsis?!
Climate Change is a Humanitarian Problem!


Given what we know as of May 15 2008, we can say that, in the areas of West Africa highlighted in the map, there is an enhanced probability of extreme precipitation for the period June-August 2008. In other words, the probability of seeing precipitation that would rank in the top 15% of the historical record is now enhanced to between 40% and 50%”.

Some are wet!
All are wet!
All drown!
Water level (m)!
Cumulative probability !of water level exceeded!during next rainy season!
0! 100%!
Decision-based forecasts: some key elements!

System dynamics modeling (Source: Quinn & Lee, 2010) !

Sample model (Source: Quinn & Lee, 2010) !


Community-level preparedness for a changing climate Ensuring survival of poultry !

Community-level preparedness for a changing climate Planning access to flood shelters in Bangladesh !

Community-level preparedness for a changing climate Finding your way in the flood !

Community-level preparedness for a changing climate Early warning systems in Argentina !

Community-level preparedness for a changing climate !Water transport in southern Africa!

Community-level preparedness for a changing climate !Crop diversification in Sudan!

Photo: A. Patt
Reaching out: "Parachuting in" with new info?!

Pabloʼs flights - sample 12 months!
Apr 29, 2008 Boston – Washington IAD Apr 30 Washington IAD – Boston May 1 Boston – Louisville KY May 4 Louisville KY – Boston Jun 1 Boston – Miami
Miami – Panama Jun 4 Panama – Miami
Miami – Buenos Aires Jun 13 Buenos Aires – Dallas Jun 14 Dallas – Washington IAD
Washington IAD – Rome Jun 15 Rome – Addis Ababa Jun 23 Addis Ababa – Entebbe Jun 25 Entebbe - Addis Ababa Jun 27 Addis Ababa – Lilongwe Jul 5 Lilongwe - Addis Ababa
Addis Ababa – Rome Jul 6 Rome – Washington IAD
Washington IAD – Boston Jul 16 Boston – Washington IAD Jul 18 Washington BWI – NY LGA
New York LGA – Boston Jul 22 Boston – IAD
IAD – Boston Sep 9 Boston – Miami
Miami – San Salvador Sep 15 San Salvador – Miami
Miami – New York JFK Sep 26 Boston – Dallas
Dallas - Tokyo NRT
Sep 28 Tokyo HND – Hiroshima Oct 4 Hiroshima – Tokyo HND
Tokyo NRT – LosAngeles LosAngeles – Boston
Oct 6 Boston – London LHR Oct 7 London LHR – Nairobi
Nairobi – Mombasa Oct 11 Mombasa – Nairobi
Nairobi – Dakar Oct 15 Dakar – Paris CDG Oct 16 Paris CDG – London City Oct 19 London LHR – Paris CDG
Paris CDG – Johannesburg Oct 22 Johannesburg – Amsterdam Oct 23 Amsterdam – Vienna Oct 27 Vienna – Zurich
Zurich – Delhi Nov 4 Delhi – London LHR
London LHR – Boston Nov 11 New York JFK – Miami
Miami – Mexico Nov 14 San Luis Potosí – Mexico
Mexico – Dallas Dallas – Boston
Nov 30 Boston – London LHR Dec 1 London LHR – Warsaw Dec 9 Poznan – Warsaw
Warsaw – London LHR London– New York JF New York – Buenos Aires
Dec 22 BuenosAires - NewYork JFK Dec 23 New York JFK – Boston Feb 5, 2009 Boston – Washington DCA Feb 7 Washington IAD – Atlanta
Atlanta – FortLauderdale Feb 11 FortLauderdale - Atlanta Feb 12 Atlanta – Boston Feb 20 Boston – London LHR Feb 21 London LHR – Amsterdam Feb 26 Amsterdam – Addis Ababa Mar 6 Addis Ababa – Bahir Dar Mar 8 Bahir Dar– Addis Ababa Mar 10 Addis Ababa - Amsterdam Mar 11 Amsterdam – Copenhagen Mar 13 Copenhagen-Vienna Mar 17 Vienna-Istambul Mar 25 Istambul – London LHR
London LHR – Chicago Chicago - Boston
Apr 2 Boston – Munich Apr 3 Munich – Cologne Apr 5 Cologne – Munich
Munich – Boston Apr 11 Boston – Amsterdam Apr 17 Amsterdam - Boston Apr 18 Hartford – Cincinnati
Cincinnati – Denver Apr 22 Denver – Atlanta
Atlanta – Hartford

CHOICES IN A CHANGING CLIMATE!A Game on pursuing protection under peculiar probabilities!
Designed by Pablo Suarez, Miquel Muñoz and Janot Mendler de Suarez !For the World Bank Social Development Department !

Ideas for discussion
Collaboration!vs.!
Competition Short-term
vs.!Long-term
Incentives &
Disincentives
SURPRISES Local vs National vs
Global!
RISK TAKING STRATEGY
Side effects &
“Cheating the system”
Feedbacks &
Delays

1. Game = simplified representation of reality (No questioning of game rules)
2. Decisions are individual
(But consultation with team is encouraged)
3. You win or lose “performance points” (Points can’t be traded within team - Start with 12)
GROUND RULES

Losing Player(s): All who run out of beans (OUT)
Winning Team:
Most points accumulated collectively
Winning Player:
Most points accumulated individually
WINNERS & LOSERS
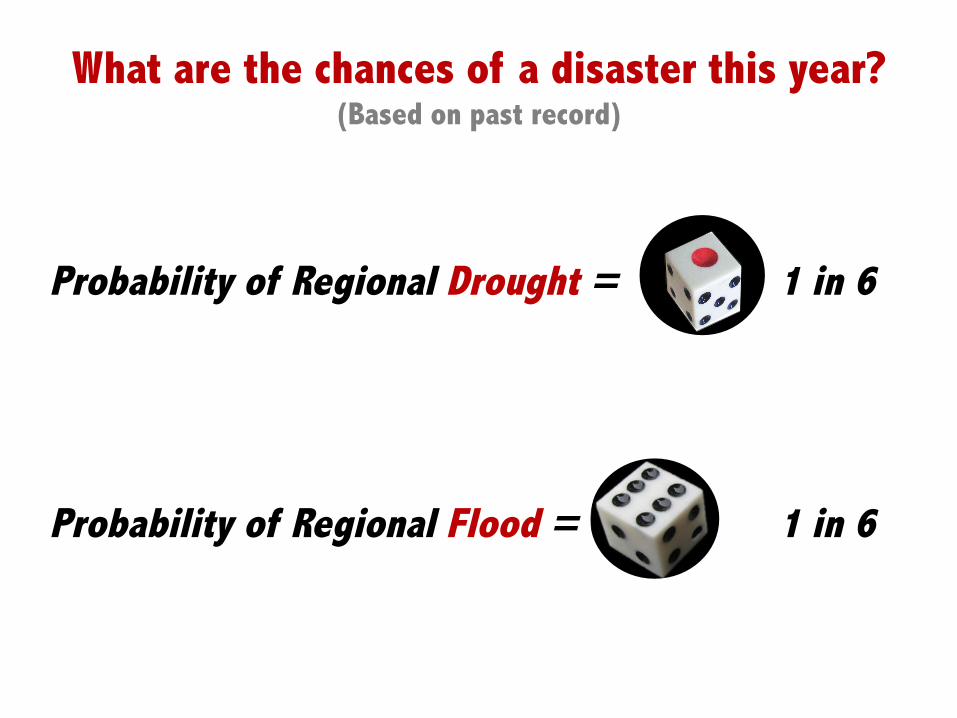
What are the chances of a disaster this year? (Based on past record)
Probability of Regional Drought = 1 in 6
Probability of Regional Flood = 1 in 6

YOU
(RED CROSS WORKER)
Go to umbrella to protect from too much rain (flood preparedness)
Go to bucket to protect from too little rain (drought preparedness)
Cost = 1


If there’s no disaster,
or if there’s a disaster but you are protected:
No problem
If there’s Drought or Flood
and you hadn’t invested in preparedness:
Pay 1 to 5 (magnitude of predicted disaster)
Not enough beans to pay? OUT! practice

Seasonal forecast: “La Niña”! Instead of roll of the die, flip a coin (drought: 50% chance)

LET’S PLAY!

Key elements of West Africa success story!

“Enhanced probability” forecasts:!A Roulette analogy!
Chances of extreme rain during 2008 season: !40 to 50% (like adding 5 to 7 bad outcomes…)!
Chances of “extreme rain”: !usually 15% (3 out of 20 years)!

Examples of forecast-based decisions by IFRC !
1. Strengthen dialogue between Red Cross and forecasters!MOU with ACMAD and IRI!
!2. Strengthen Regional Disaster Response Teams !Visas & health insurance!Five-day training of participants from 12 countries !
!- interpreting forecasts!!- mobilizing and management of human resources !!- dealing with logistics, admin & finances!
3. Launch pre-disaster emergency appeal!Requested US$ 750,000 for regional flood preparedness!Donor response…!Pre-positioning of relief items!!
4. Create or strengthen flood contingency plans!7 new national plans!Community-level early warning systems!

Floods downstream of the Bagre dam (Burkina Faso)!
2007!- Inadequate warnings!- 200,000 affected!- 30+ deaths!
Recovery!- Integrate resilience!- Model flood-resistant homes!- Dialogue with Met Agencies!!2008!- Bi-country mgment of dam!- RC community warnings!- Only 2 deaths!


Recruiting brainpower: “Scholars for humanitarian work”!

How can Harvard help RC use Forecasts?!!
Group Work: Identify possible Red Cross decisions !based on a prediction (location, magnitude, lead time, probability)!
1. Information Flow: What message? ! !To whom? When? Forecast threshold?!!
2. Mobility: Move what? ! ! ! !!From where to where? When? !
!3. Storage: Store what? ! ! ! !
!How much? When? !!
4. Other: Do what? !!With whom & what? When? !
I got the data!!

Conceptual framework for game !
1. Improve understanding of the climate issue!Health! ! ! !Information !!Food Security ! ! !Institutions!Water & Sanitation ! !New tools!Disaster management ! !Decisions!Risk reduction ! ! !Funding!Advocacy ! ! !Other?!
2. Formulate new initiatives!Projects ! ! ! Low hanging fruits!Partnerships ! ! ! Long term !Capacity building (games!)! !Urgent!
3. Help us learn from what we do!Monitor!Evaluate!Document!
4. Nurture ‘new generation’ practitioners!

Task for you: Link forecasts with decisions!
Climate Science
Humanitarian decisions
What matters? Predictable events (mm rain, °C tem, etc)
Avoidable losses (people killed, crops destroyed)
What is done? Information (or silence) Action (or inaction)
Location (where?)
Magnitude (how big?)
Lead time (when?)
Probability (how likely?)
Location (where?) Vulnerability
Magnitude (how big?) Avoidable loss
Lead time (when?) Range of plausible actions
Probability (how likely?) Act or not act?


Thank You!