Embed Size (px)
Citation preview
Firm valuation (1)
Class 6 Financial Management, 15.414
MIT SLOAN SCHOOL OF MANAGEMENT
15.414 Class 6
Today
Firm valuation
• Dividend discount model
• Cashflows, profitability, and growth
Reading
• Brealey and Myers, Chapter 4
MIT SLOAN SCHOOL OF MANAGEMENT
15.414 Class 6
Firm valuation
The WSJ reports that FleetBoston has a DY of 4.6% and a P/E ratio of 16, IBM has a DY of 0.8% and a P/E ratio of 27, and Intel has a DY of 0.3% and a P/E ratio of 46. What explains the differences? What do the financial ratios tell us about the prospects of each firm?
Your firm has the opportunity to acquire a smaller competitor. You forecast that the target will earn $78 million this year, $90 million next year, and $98 million in the following year. The target reinvests 75% of its earnings and long-term growth is expected to be 6% for the foreseeable future. Is the growth rate adequate given its payout policy? How much would you be willing to pay for the firm?
3
MIT SLOAN SCHOOL OF MANAGEMENT
15.414 Class 6
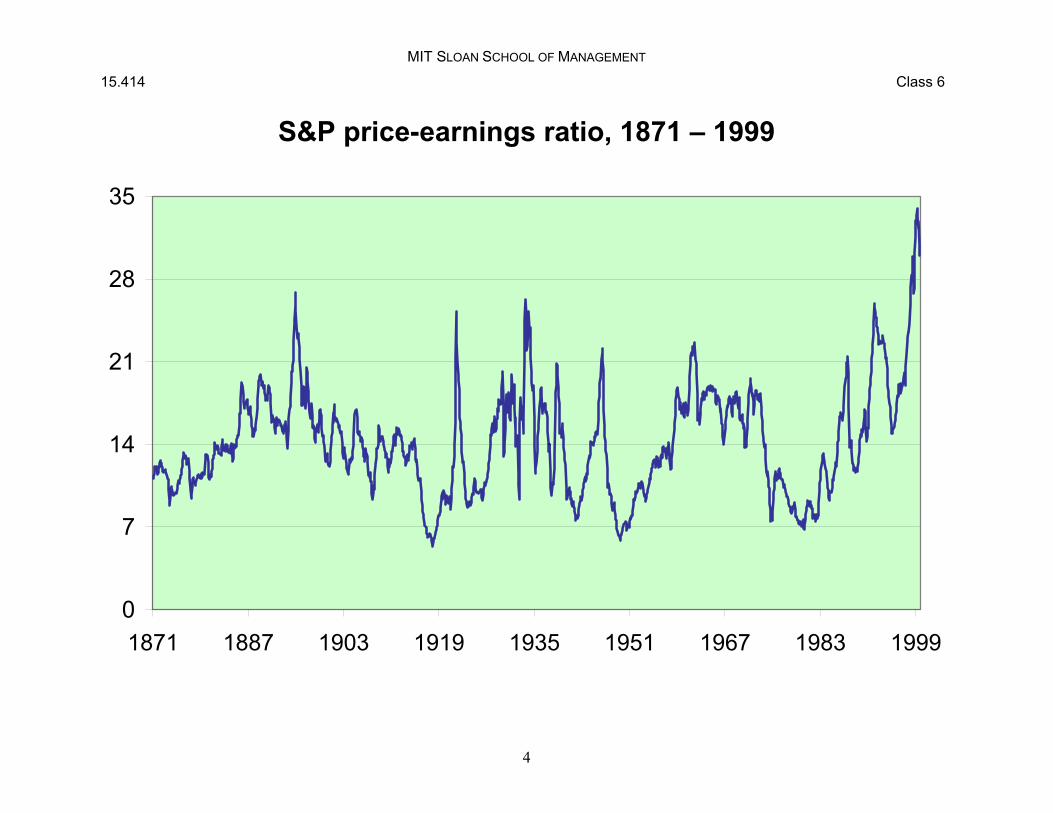
S&P price-earnings ratio, 1871 – 1999
35
28
21
14
7
0 1871 1887 1903 1919 1935 1951 1967 1983 1999
4
MIT SLOAN SCHOOL OF MANAGEMENT
15.414 Class 6
Firm valuation
Similar to projects
DCF analysis
Forecast cashflows (inflation, working capital, taxes, …)
Discount at the opportunity cost of capital
Additional issues
Assets or equity value?
Is growth sustainable? How does growth affect cashflow?
Firms have no end date. Do we have to forecast cashflows forever?
5
MIT SLOAN SCHOOL OF MANAGEMENT
15.414 Class 6
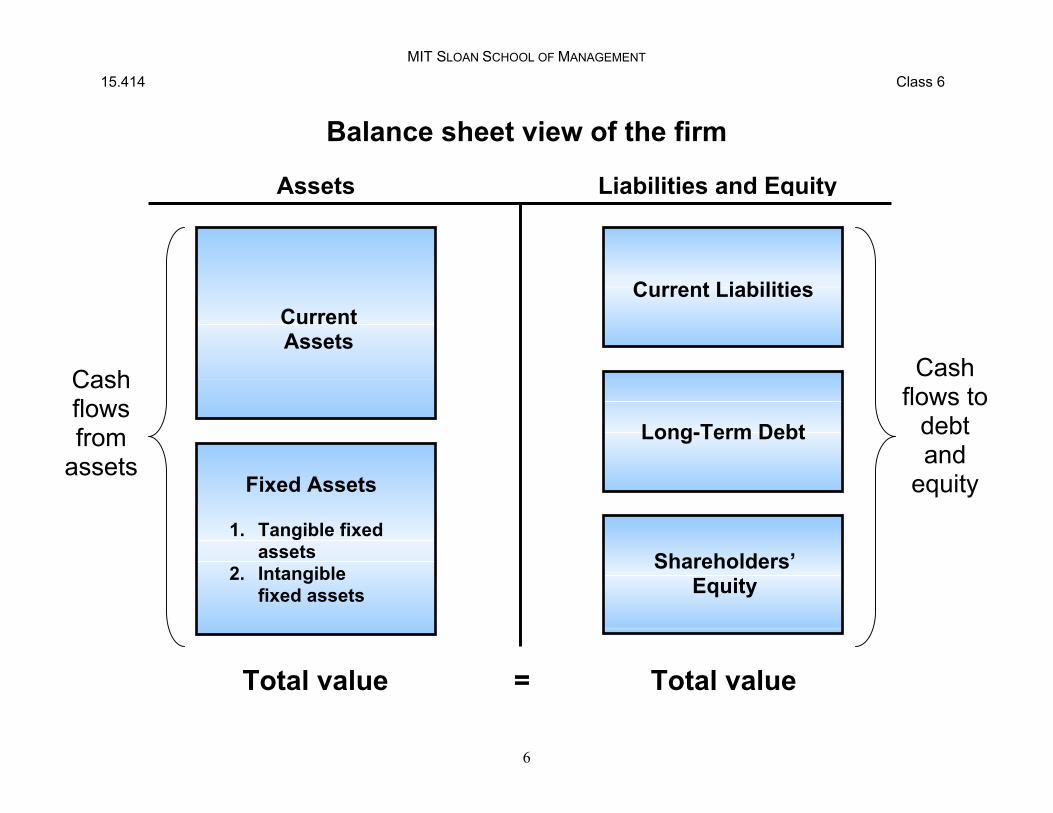
Balance sheet view of the firm
Assets Liabilities and Equity
Cash flows from
assets
Current Assets
Fixed Assets
1. Tangible fixed assets
2. Intangible fixed assets
Current Liabilities
Long-Term Debt
Shareholders’ Equity
Cash flows to
debt and
equity
Total value = Total value
6

MIT SLOAN SCHOOL OF MANAGEMENT
15.414 Class 6
Approach 1
Asset value
PV of assets = HH H
2 21 FCF ... FCF
r1 FCF
+ +
+ ++
+ +
+ r) (1 value Term.
r) (1 r) (1
Free cashflow Cash generated by the assets after all reinvestment FCF = EBIT (1 – τ) + depreciation – ∆NWC – CAPX
Terminal value Firm value at the end of the forecast horizon
Equity Equity value = Assets – Debt
7
MIT SLOAN SCHOOL OF MANAGEMENT
15.414 Class 6
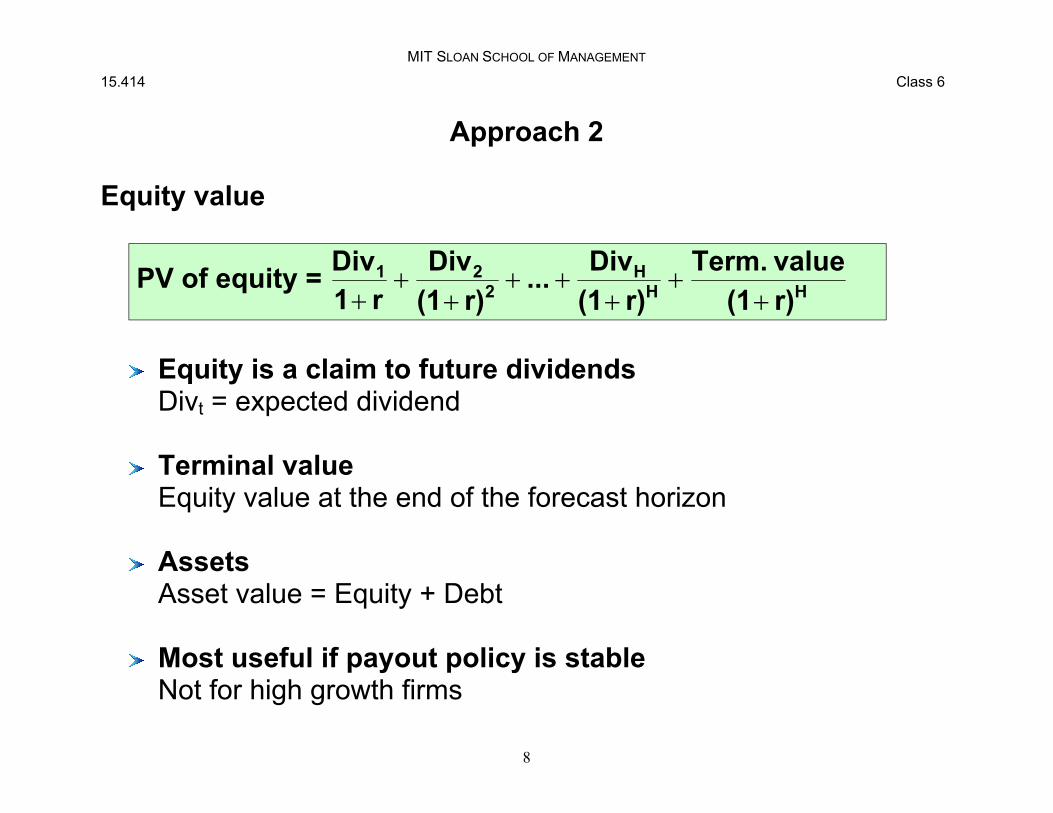
Approach 2
Equity value
PV of equity = HH H
2 21 Div ... Div
r1 Div
+ +
+ ++
+ +
+ r) (1 value Term.
r) (1 r) (1
Equity is a claim to future dividends Divt = expected dividend
Terminal value Equity value at the end of the forecast horizon
Assets Asset value = Equity + Debt
Most useful if payout policy is stable Not for high growth firms
8
MIT SLOAN SCHOOL OF MANAGEMENT
15.414 Class 6
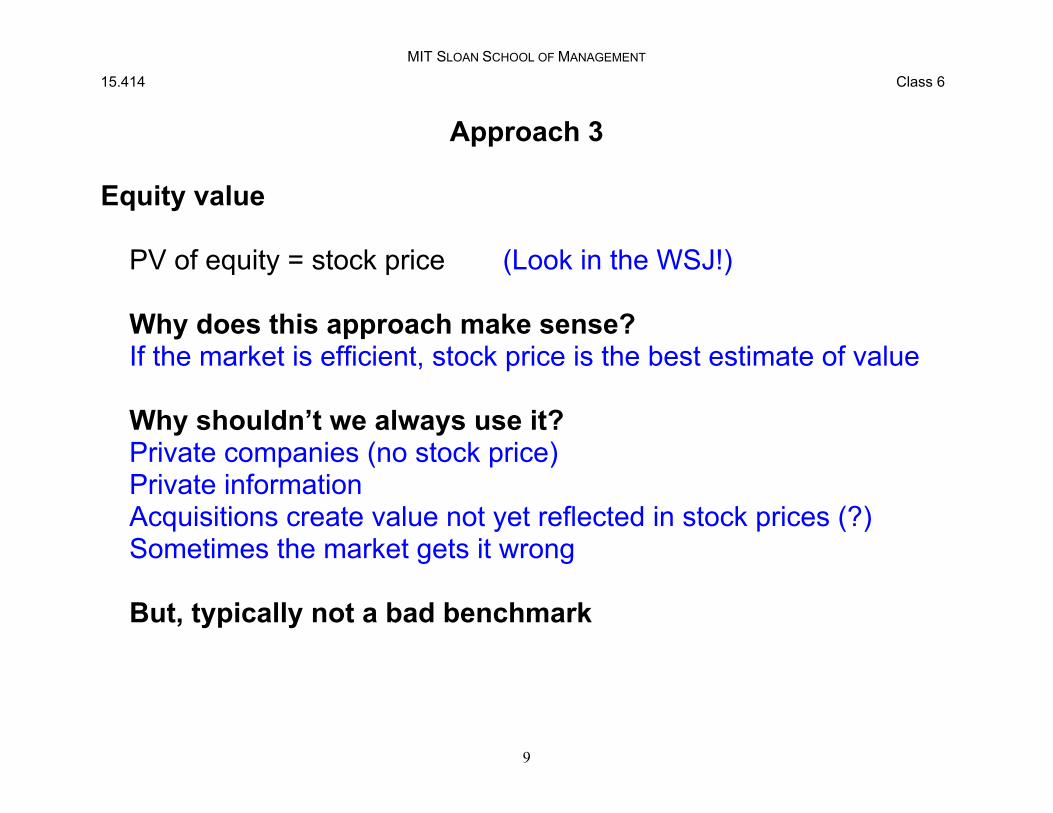
Approach 3
Equity value
PV of equity = stock price (Look in the WSJ!)
Why does this approach make sense? If the market is efficient, stock price is the best estimate of value
Why shouldn’t we always use it? Private companies (no stock price) Private information Acquisitions create value not yet reflected in stock prices (?) Sometimes the market gets it wrong
But, typically not a bad benchmark
9
MIT SLOAN SCHOOL OF MANAGEMENT
15.414 Class 6
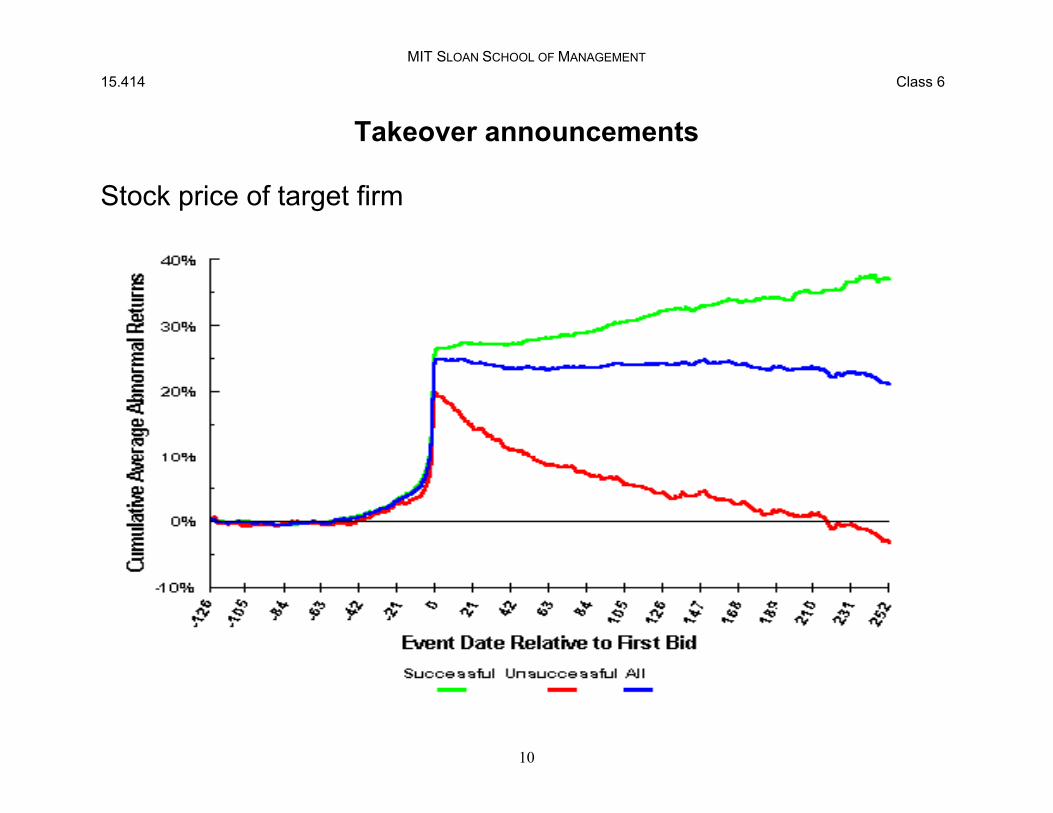
Takeover announcements
Stock price of target firm
10
MIT SLOAN SCHOOL OF MANAGEMENT
15.414 Class 6
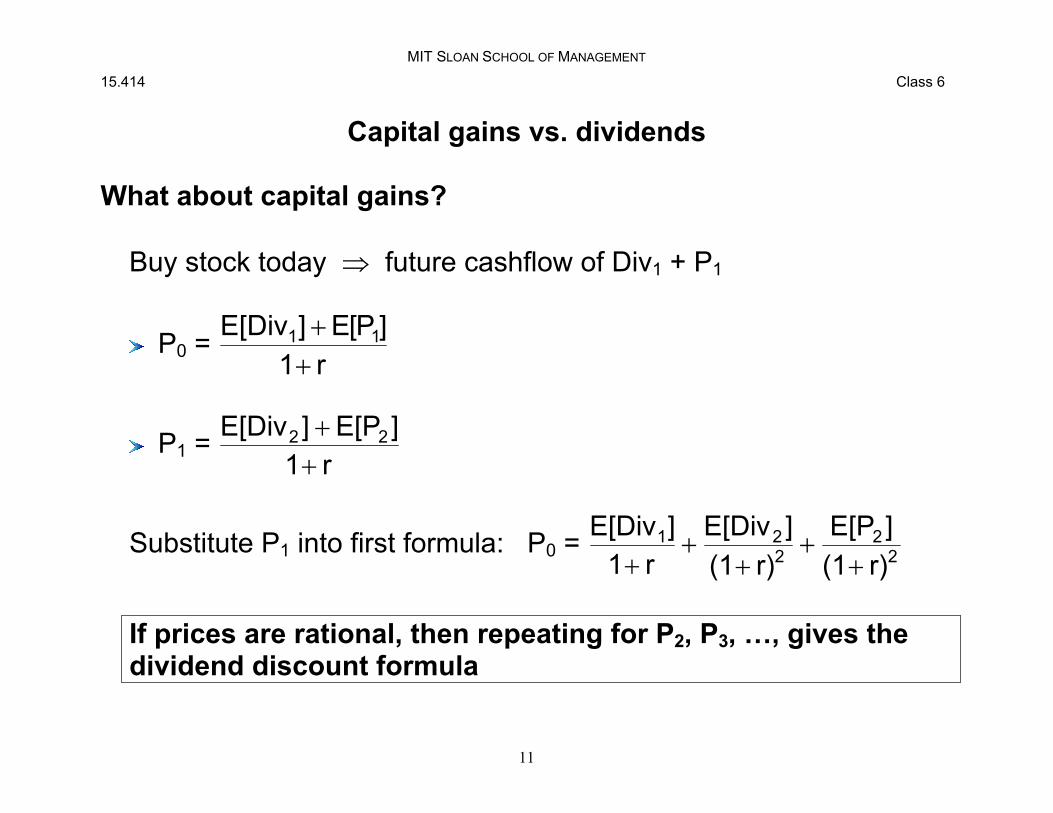
Capital gains vs. dividends
What about capital gains?
Buy stock today ⇒ future cashflow of Div1 + P1
P0 = E[Div ] + E[P ]1 1
1+ r
P1 = E[Div ] + E[P2]2
1+ r
E[Div2 ] E[P2 ]Substitute P1 into first formula: P0 = E[Div1] + +1+ r r) (1 2 r) (1 2+ +
If prices are rational, then repeating for P2, P3, …, gives the dividend discount formula
11
MIT SLOAN SCHOOL OF MANAGEMENT
15.414 Class 6
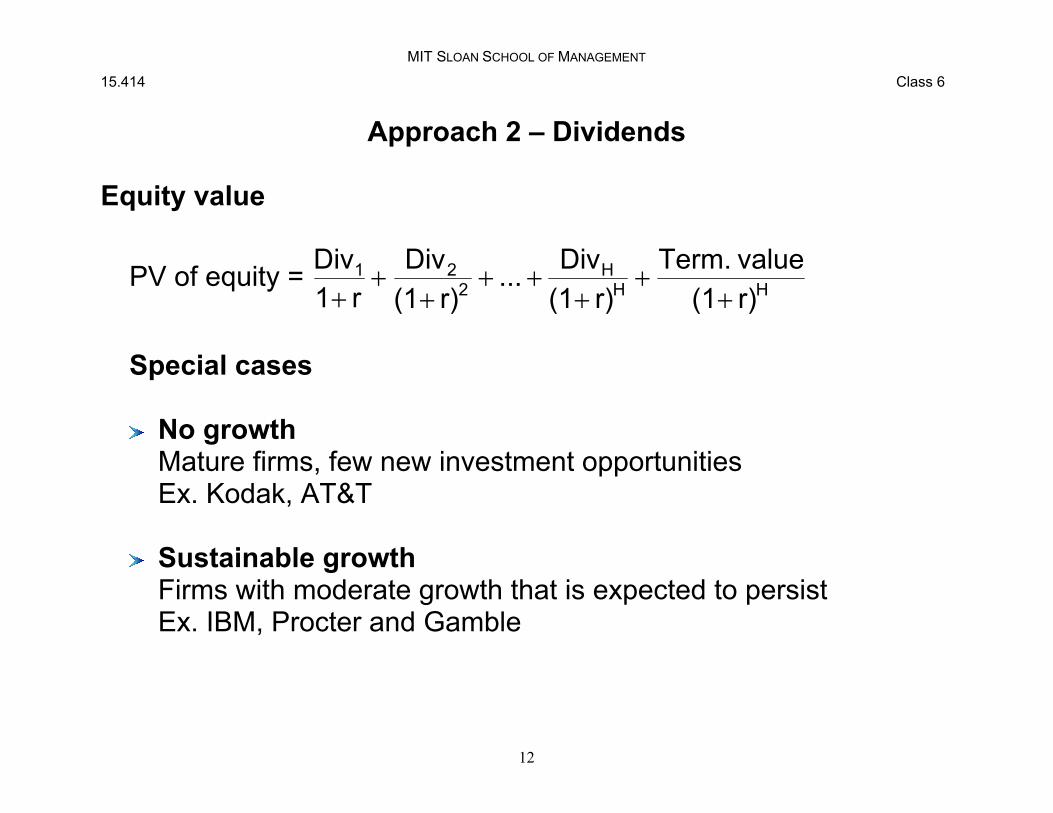
Approach 2 – Dividends
Equity value
PV of equity = Div1 + Div2 DivH value Term.
+ ... + +1+ r r) (1 2 r) (1 H r) (1 H+ + +
Special cases
No growth Mature firms, few new investment opportunities
Ex. Kodak, AT&T
Sustainable growth Firms with moderate growth that is expected to persist Ex. IBM, Procter and Gamble
12
MIT SLOAN SCHOOL OF MANAGEMENT
15.414 Class 6
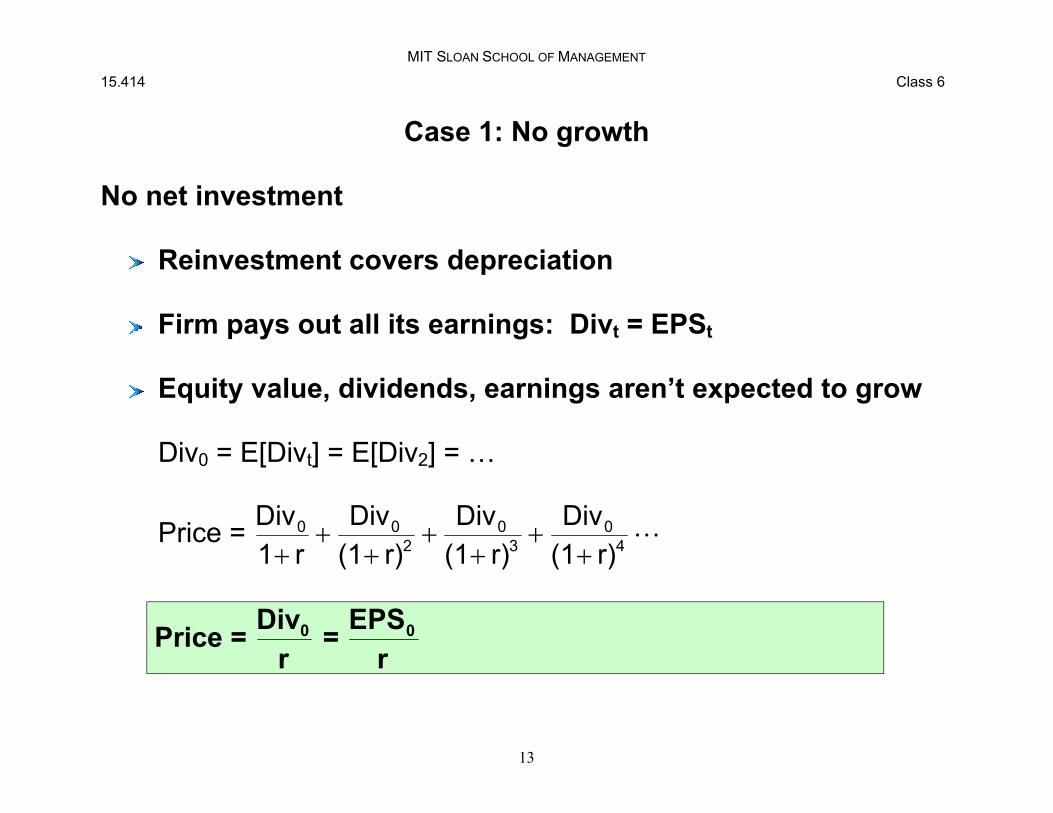
Case 1: No growth
No net investment
Reinvestment covers depreciation
Firm pays out all its earnings: Divt = EPSt
Equity value, dividends, earnings aren’t expected to grow
Div0 = E[Divt] = E[Div2] = …
Div0 Div0 Div0 Div0 Price = + + + L1+ r r) (1 2 r) (1 3 r) (1 4+ + +
Price = r
Div0 = r
EPS0
13

MIT SLOAN SCHOOL OF MANAGEMENT
15.414 Class 6
Example
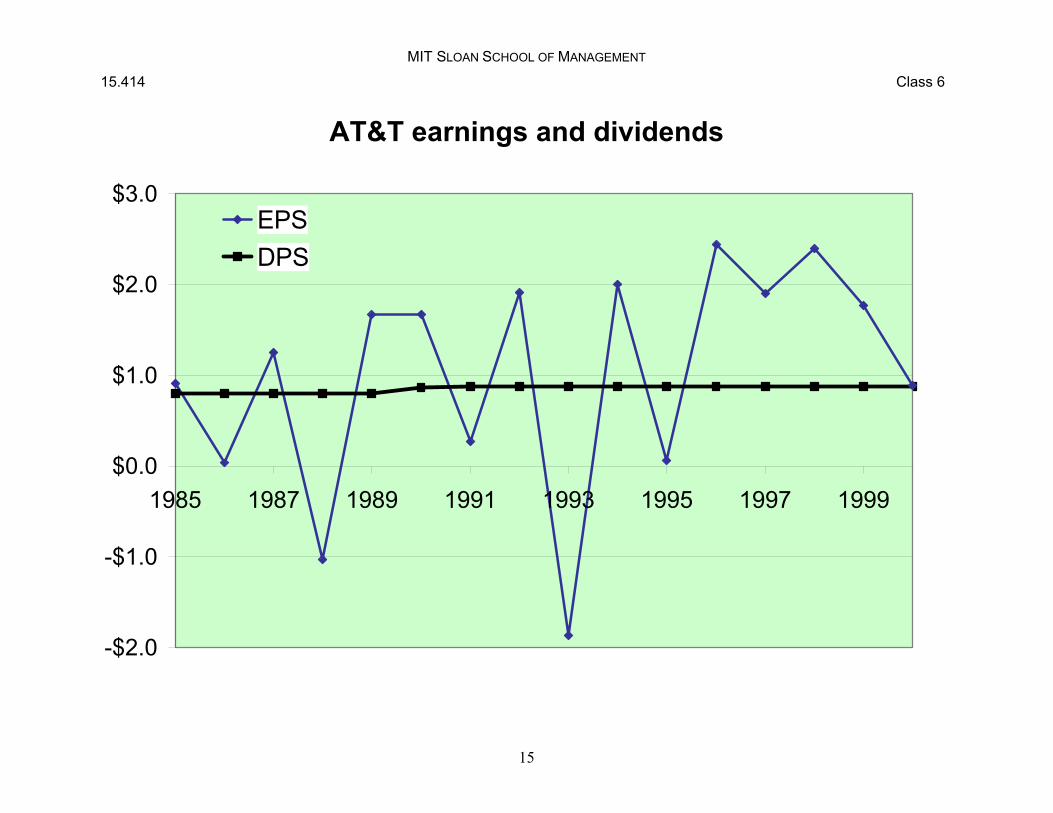
It’s 2001 and you’re attempting to value AT&T’s equity. The long-distance market is mature and new competition makes growth difficult. In fact, AT&T has experienced little growth over the last few years, which you believe will continue.
Dividends Year 1996 1997 1998 1999 2000 DPS 0.88 0.88 0.88 0.88 0.88
No growth formula:
If r = 7%: price = 0.88 / 0.07 = $12.57 (actual price = $17.25)
If r = 5%: price = 0.88 / 0.05 = $17.60
14
MIT SLOAN SCHOOL OF MANAGEMENT
15.414 Class 6
AT&T earnings and dividends
-$2.0
-$1.0
$0.0
$1.0
$2.0
$3.0
1985 1987 1989 1991 1993 1995 1997 1999
EPS DPS
15
MIT SLOAN SCHOOL OF MANAGEMENT
15.414 Class 6
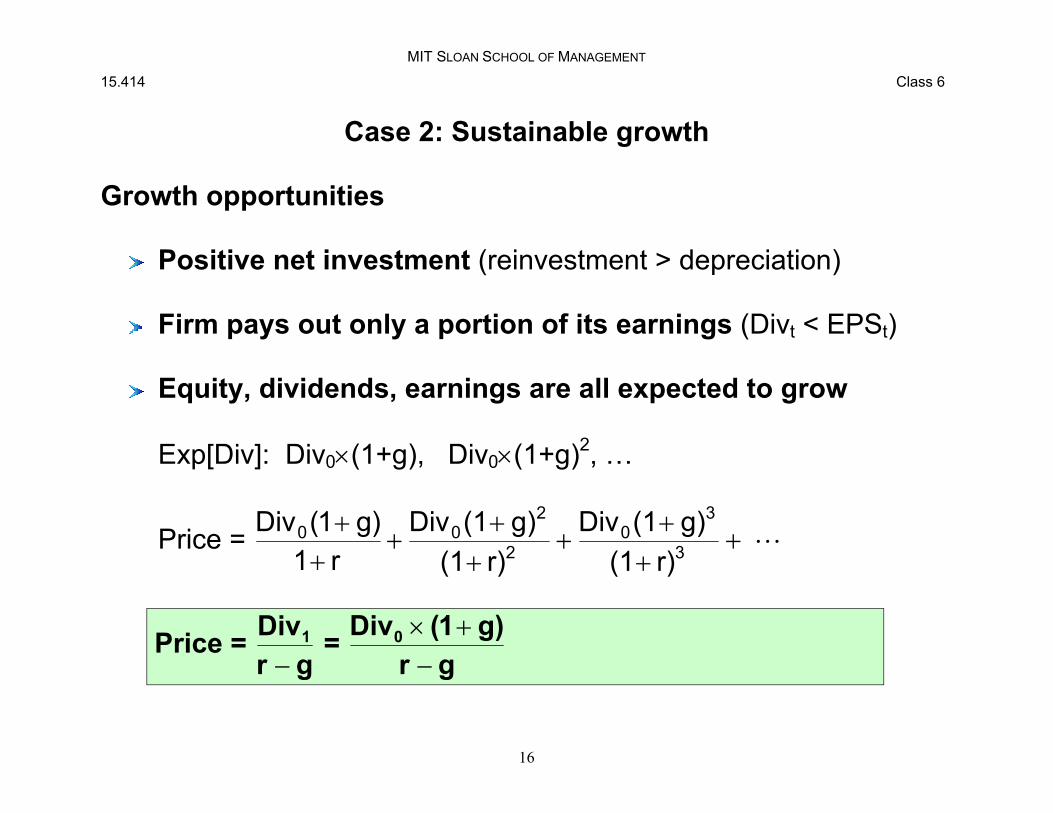
Case 2: Sustainable growth
Growth opportunities
Positive net investment (reinvestment > depreciation)
Firm pays out only a portion of its earnings (Divt < EPSt)
Equity, dividends, earnings are all expected to grow
Exp[Div]: Div0×(1+g), Div0×(1+g)2, …
Div0(1+ g) g) (1 Div 2 g) (1 Div 3
+ L Price = + 0 ++ 0 +
1+ r r) (1 2 r) (1 3+ +
Price = gr
Div1
− =
gr g)1(Div0
− +×
16
MIT SLOAN SCHOOL OF MANAGEMENT
15.414 Class 6
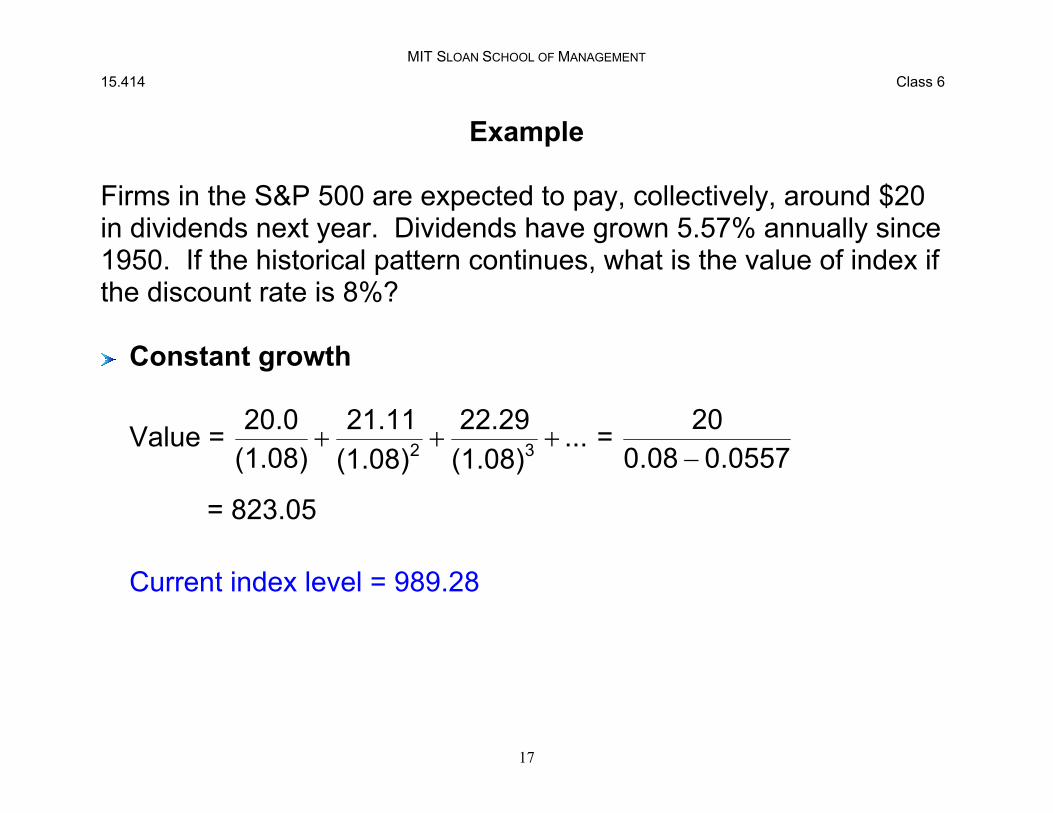
Example
Firms in the S&P 500 are expected to pay, collectively, around $20 in dividends next year. Dividends have grown 5.57% annually since 1950. If the historical pattern continues, what is the value of index if the discount rate is 8%?
Constant growth
20.0 21.11 22.29 20 Value = + + + ... = (1.08) (1.08)2 (1.08)3 08 . 0 − 0557. 0
= 823.05
Current index level = 989.28
17
MIT SLOAN SCHOOL OF MANAGEMENT
15.414 Class 6
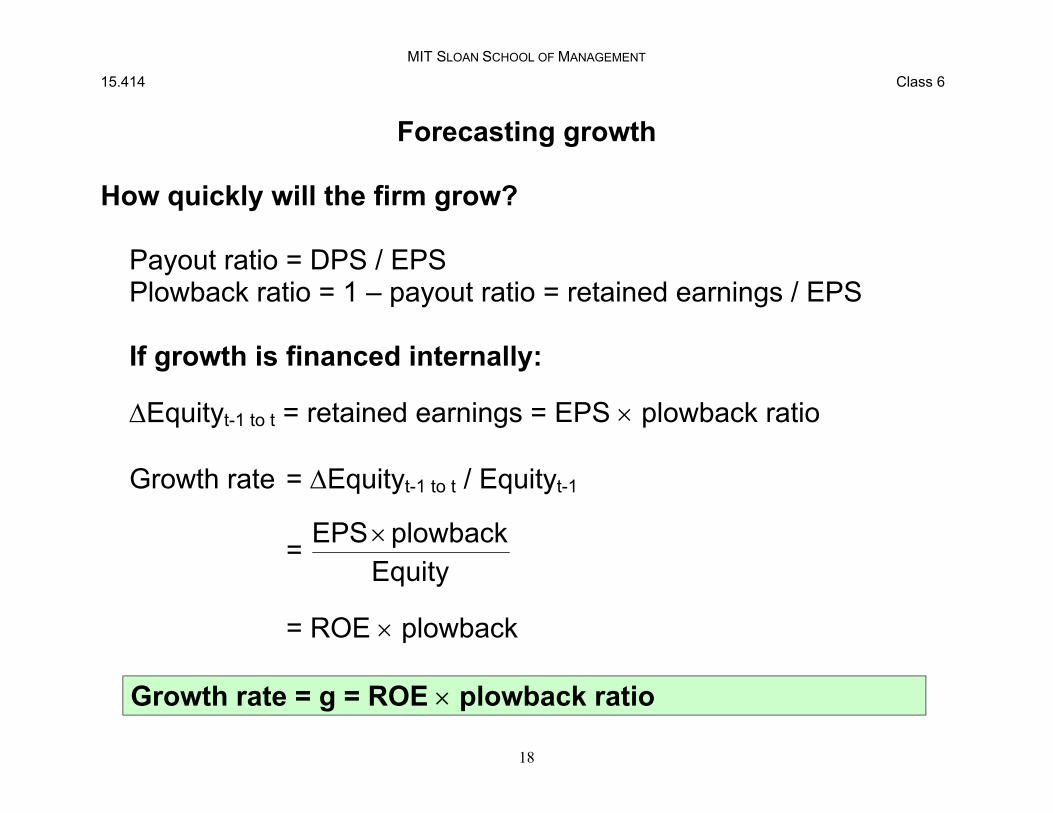
Forecasting growth
How quickly will the firm grow?
Payout ratio = DPS / EPS Plowback ratio = 1 – payout ratio = retained earnings / EPS
If growth is financed internally:
∆Equityt-1 to t = retained earnings = EPS × plowback ratio
Growth rate = ∆Equityt-1 to t / Equityt-1
EPS × plowback= Equity
= ROE × plowback
Growth rate = g = ROE × plowback ratio
18
MIT SLOAN SCHOOL OF MANAGEMENT
15.414 Class 6
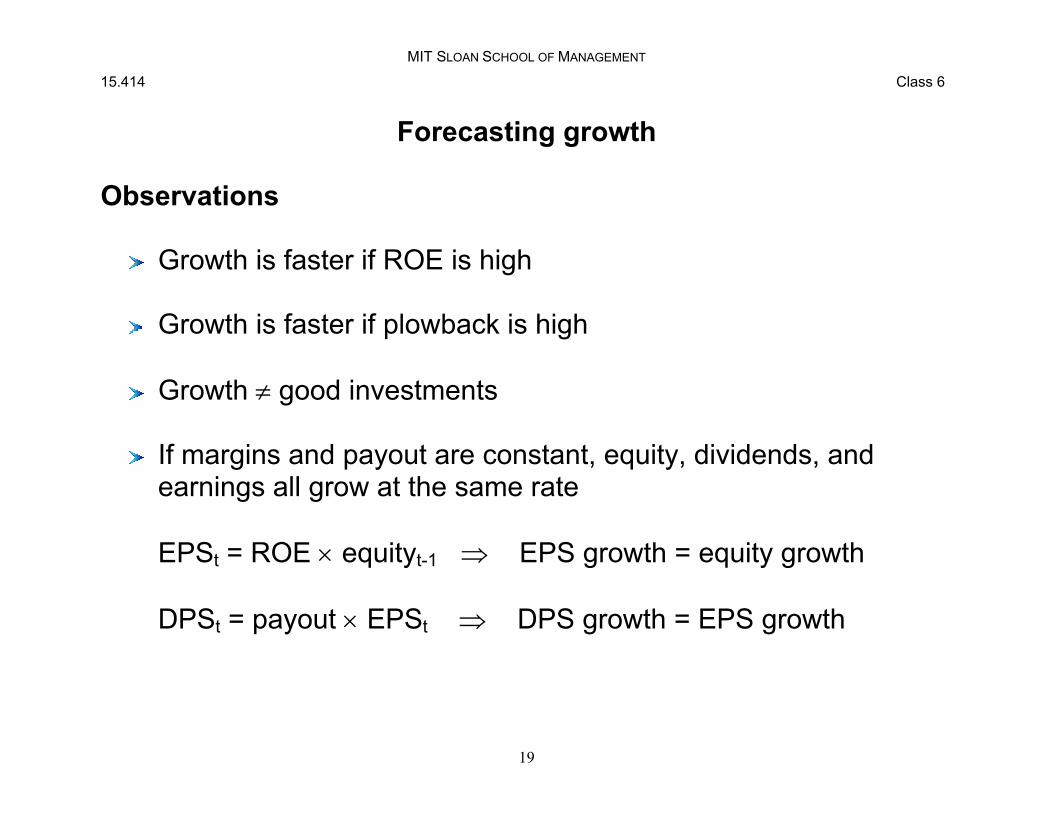
Forecasting growth
Observations
Growth is faster if ROE is high
Growth is faster if plowback is high
Growth ≠ good investments
If margins and payout are constant, equity, dividends, and earnings all grow at the same rate
EPSt = ROE × equityt-1 ⇒ EPS growth = equity growth
DPSt = payout × EPSt ⇒ DPS growth = EPS growth
19
MIT SLOAN SCHOOL OF MANAGEMENT
15.414 Class 6
Example
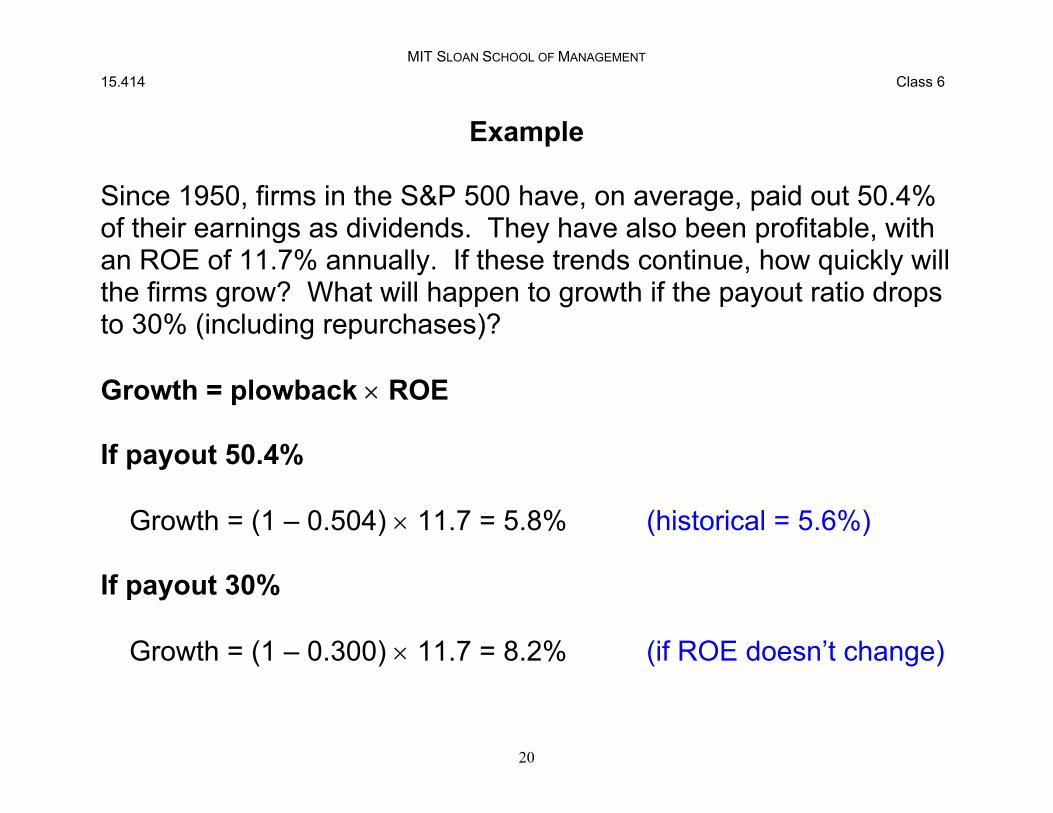
Since 1950, firms in the S&P 500 have, on average, paid out 50.4% of their earnings as dividends. They have also been profitable, with an ROE of 11.7% annually. If these trends continue, how quickly will the firms grow? What will happen to growth if the payout ratio drops to 30% (including repurchases)?
Growth = plowback × ROE
If payout 50.4%
Growth = (1 – 0.504) × 11.7 = 5.8% (historical = 5.6%)
If payout 30%
Growth = (1 – 0.300) × 11.7 = 8.2% (if ROE doesn’t change)
20

MIT SLOAN SCHOOL OF MANAGEMENT
15.414 Class 6
Example
By 2003, AT&T’s situation had changed. Demand for long-distance and broadband is expanding. AT&T decides to reinvest half its earnings, equal to $1.50 / share in 2002. Analysts forecast that AT&T would earn an ROE of 15% on its investments. If investors required a 10% rate of return, what is the value of AT&T’s stock at the end of 2002?
What information do we need?
ROE = 15% g = 7.5%
Plowback ratio = 50% Div2002 = 0.75
EPS2002 = 1.50
21

MIT SLOAN SCHOOL OF MANAGEMENT
15.414 Class 6
Example, cont.
Equity value
Div2002 = 0.75 → Div2003 = 0.75 × 1.075 = 0.806
Price = $0.806 / (0.10 – 0.075) = $32.24
Growth opportunities increase AT&T’s stock price from $15.00 to $32.24, or 215%.
AT&T No growth Growth EPS $1.50 $1.50 Div $1.50 $0.75 Plowback 0% 50% Growth 0% 7.5% Price $15.00 $32.24
22

MIT SLOAN SCHOOL OF MANAGEMENT
15.414 Class 6
AT&T, forecasted dividends
$4
$3
$2
$1
$0 0 2 4 6 8 10 12 14 16 18 20
No growth Growth = 7.5%
Years in the future
23
MIT SLOAN SCHOOL OF MANAGEMENT
15.414 Class 6
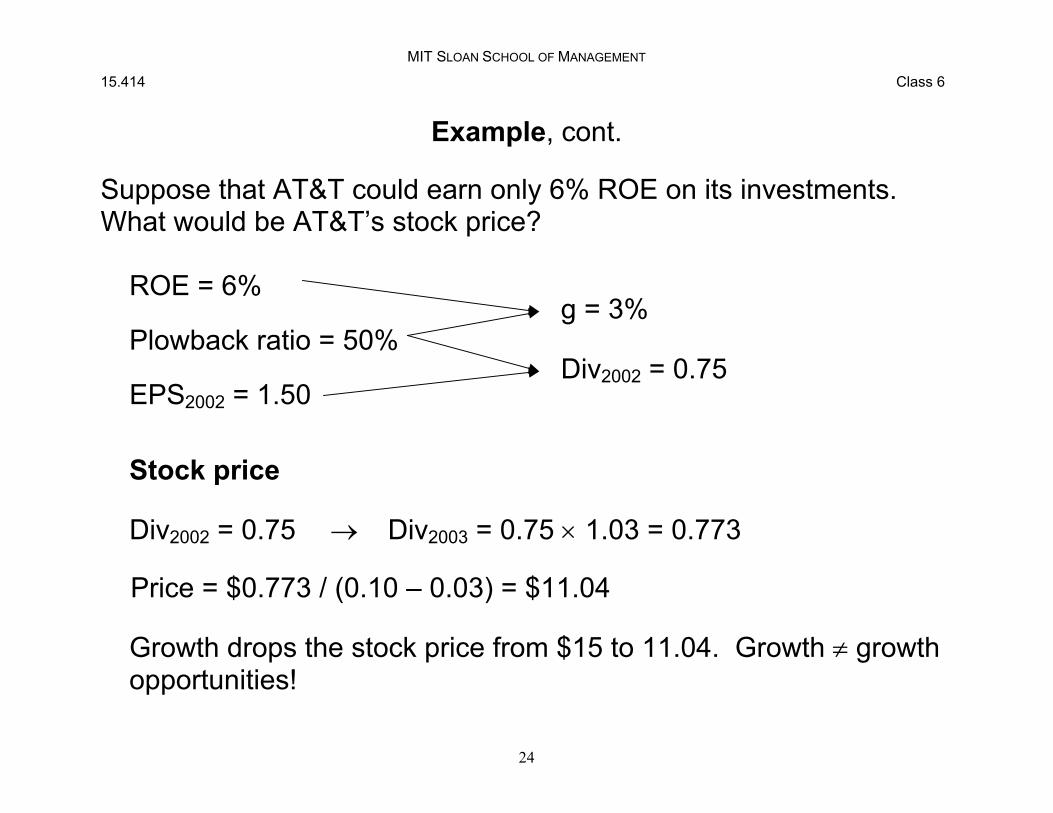
Example, cont.
Suppose that AT&T could earn only 6% ROE on its investments. What would be AT&T’s stock price?
ROE = 6% g = 3%
Plowback ratio = 50% Div2002 = 0.75
EPS2002 = 1.50
Stock price
Div2002 = 0.75 → Div2003 = 0.75 × 1.03 = 0.773
Price = $0.773 / (0.10 – 0.03) = $11.04
Growth drops the stock price from $15 to 11.04. Growth ≠ growth opportunities!
24
MIT SLOAN SCHOOL OF MANAGEMENT
15.414 Class 6
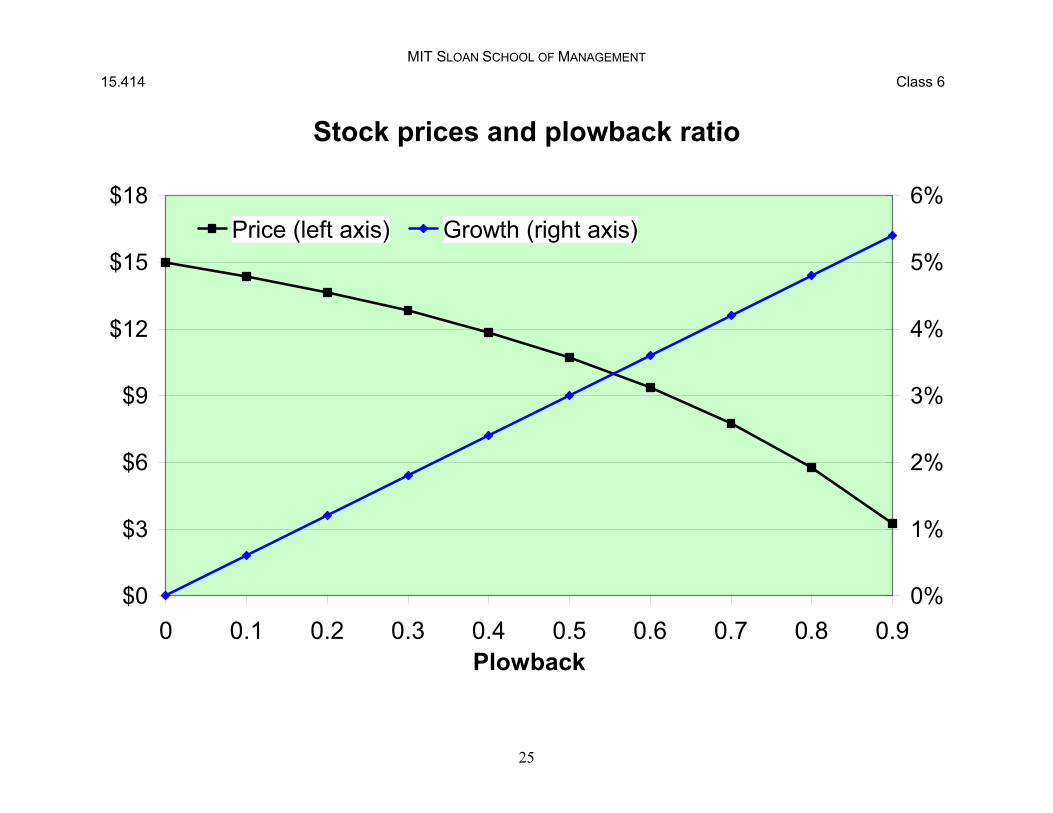
Stock prices and plowback ratio
$18 Price (left axis) Growth (right axis)
6%
$15 5%
$12 4%
$9 3%
$6 2%
$3 1%
$0 0% 0 0.1 0.2 0.3 0.4 0.5 0.6 0.7 0.8 0.9
Plowback
25
MIT SLOAN SCHOOL OF MANAGEMENT
15.414 Class 6
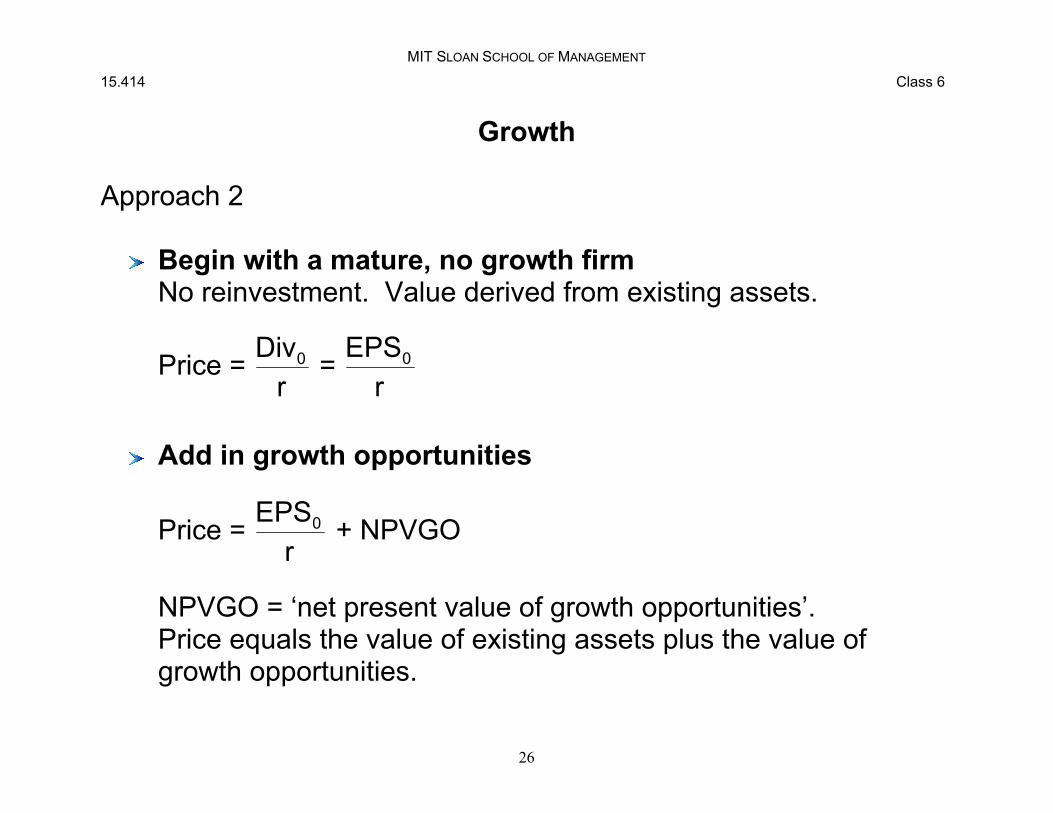
Growth
Approach 2
Begin with a mature, no growth firm No reinvestment. Value derived from existing assets.
Div0 EPS0Price = = r r
Add in growth opportunities
EPS0Price = + NPVGO r
NPVGO = ‘net present value of growth opportunities’. Price equals the value of existing assets plus the value of growth opportunities.
26
MIT SLOAN SCHOOL OF MANAGEMENT
15.414 Class 6
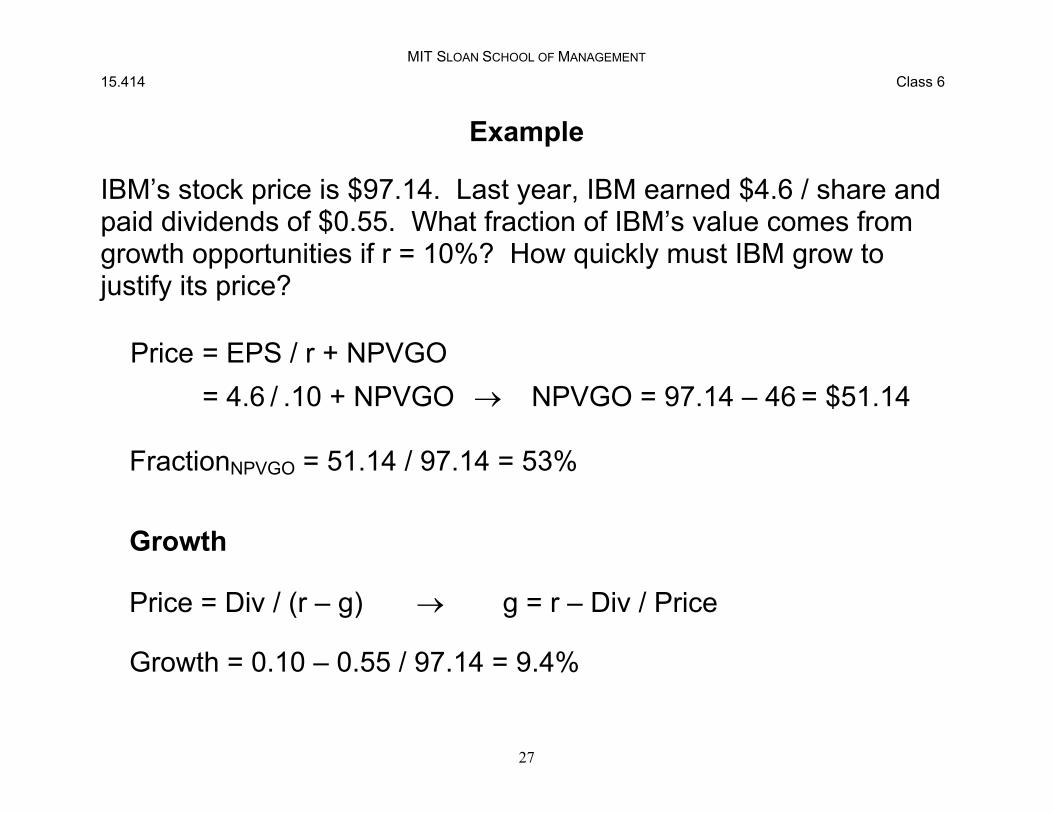
Example
IBM’s stock price is $97.14. Last year, IBM earned $4.6 / share and paid dividends of $0.55. What fraction of IBM’s value comes from growth opportunities if r = 10%? How quickly must IBM grow to justify its price?
Price = EPS / r + NPVGO = 4.6 / .10 + NPVGO → NPVGO = 97.14 – 46 = $51.14
FractionNPVGO = 51.14 / 97.14 = 53%
Growth
Price = Div / (r – g) → g = r – Div / Price
Growth = 0.10 – 0.55 / 97.14 = 9.4%
27