Embed Size (px)
Citation preview

An Impact BriefMay 2018
The Class of 2008Insights from 983 tech companies founded in 5 countries in 2008
CLASS OF
2008-20182008

The Class of 2008 | Impact Centre | University of Toronto 2
Contents
Summary 3The Class of 2008 5Average Funding Obtained 9Frequency of Funding 13Initial Capitalization 15Exits 16The Remaining Class of 2008 18Potential Implications for Business and Policy Makers 21Methodology 22About the Impact Centre 23

The Class of 2008 | Impact Centre | University of Toronto 3
The objective of this report was to analyze the ten-year trajectory of tech companies launched in 2008 in select jurisdictions around the world. Our current findings build on several other studies we conducted in the past and provide further insight into the challenges faced in the development of Canadian firms.
We looked at 2,429 companies created in 2008 in Canada, the US, France, Germany, and the UK; 983 were recorded by Crunchbase as having obtained capital of over $100,000 to fuel their growth. We analyzed this subset in more detail.
Based on our analysis of the Class of 2008, we found the following:
• The average funding received by Canadian companies in the last ten years is in second place behind the US,
• Canada is strongest in funding technology companies (eg. software, hardware and mobile), but lags the US in the number of healthcare companies created. Our average funding per healthcare company is weak.
• Our companies go through fewer rounds of financing.• Our average time to first funding is longer than that in the US.
Funding: US vs Canada (Class of 2008)Exhibit 1
Summary
“If we want to create more world-class companies, we will need to ensure that our tech companies get funding sooner and in larger amounts to be able to drive growth.”
$30 M
$25 M
$20 M
$15 M
$10 M
$5 M
$0 M Canada US
Average funding raised per company
2.7
3.1
Canada
US
2.7
2.7
3.6
Canada
US
4.4
Number of funding rounds
Years to first funding
Unless otherwise noted, all data are from Crunchbase and are reported in US$ millions.
The Class of 2008 | Impact Centre | University of Toronto 4
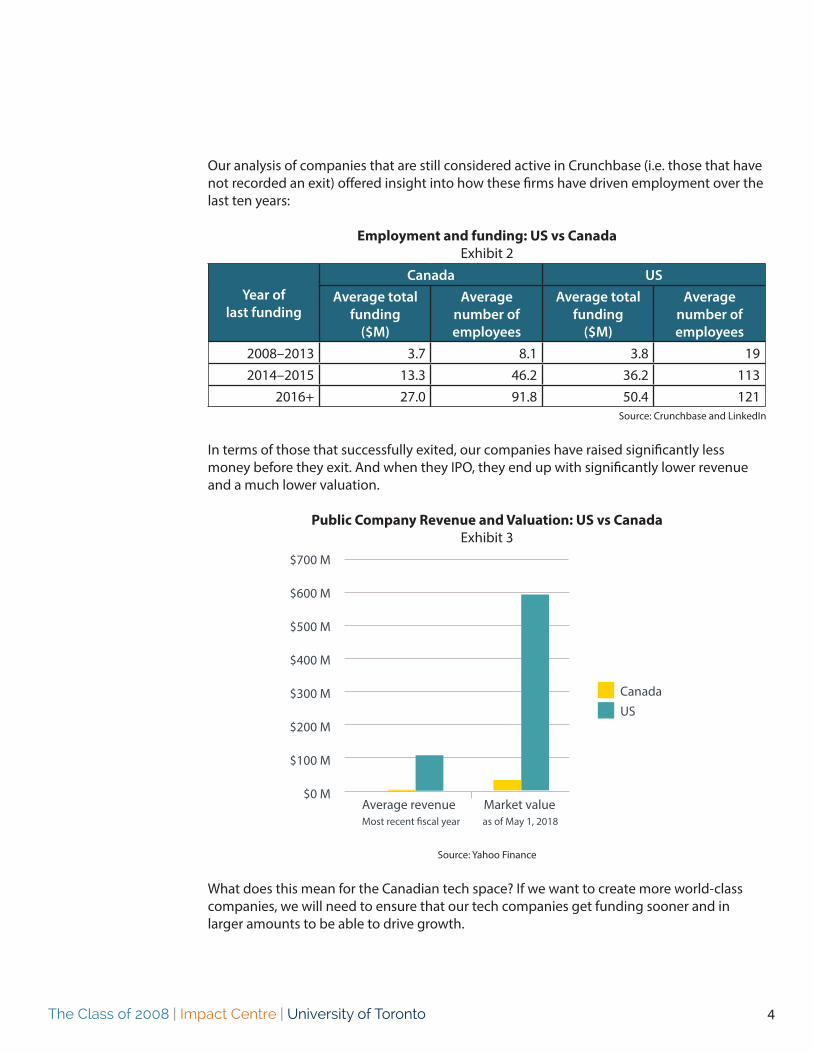
Our analysis of companies that are still considered active in Crunchbase (i.e. those that have not recorded an exit) offered insight into how these firms have driven employment over the last ten years:
Employment and funding: US vs CanadaExhibit 2
Year of last funding
Canada USAverage total
funding ($M)
Average number of employees
Average total funding
($M)
Average number of employees
2008–2013 3.7 8.1 3.8 192014–2015 13.3 46.2 36.2 113
2016+ 27.0 91.8 50.4 121Source: Crunchbase and LinkedIn
In terms of those that successfully exited, our companies have raised significantly less money before they exit. And when they IPO, they end up with significantly lower revenue and a much lower valuation.
Public Company Revenue and Valuation: US vs CanadaExhibit 3
Source: Yahoo Finance
What does this mean for the Canadian tech space? If we want to create more world-class companies, we will need to ensure that our tech companies get funding sooner and in larger amounts to be able to drive growth.
$700 M
$600 M
$500 M
$400 M
$300 M
$200 M
$100 M
$0 MAverage revenue Market valueMost recent fiscal year as of May 1, 2018
CanadaUS
The Class of 2008 | Impact Centre | University of Toronto 5
The Class of 2008
The year 2008 was filled with moments that captured the world’s attention. Beijing was the first Chinese city to host the Summer Olympics, and Barack Obama became the first African-American US President. On September 29, 2008, the Dow Jones Industrial Average fell 777 points following the bankruptcies of Lehman Brothers and Washington Mutual. October 24, 2008 was coined ‘Bloody Friday’, a day that marked the worst decline in history for many of the world’s stock exchanges.
But once the dust settled, it was also the beginning of a very long and strong bull market from which we continue to benefit today. Entrepreneurs started companies in that tumultuous and uncertain economic environment. But what happened to the startup ‘Class of 2008’? Where have they gone since their founding? What can we learn from their history and progress over the last 10 years?
We set out to answer these questions by analyzing data for 2,429 healthcare and computer technology businesses launched in 2008 in Canada, the US, the UK, France, and Germany (Source: Crunchbase). Revenue numbers would be the ideal metric on which to judge the relative development of these startups. However, since over 90% of the companies have remained private and have not reported financial information, we are somewhat limited in our ability to track their growth based on income. Instead, we use employment and capital raised as proxies for revenue. (For justification, please refer to our past report A Failure to Scale: February 2017).
Crunchbase data suggest that of the 2,429 companies launched in 2008, 983 have obtained capital of over $100,000 to fuel their growth. Please note that the private fundraising activities of these businesses are not reflected in this database. However, we have assumed that these gaps are most likely an issue across all countries, thus making the data sets relatively comparable.
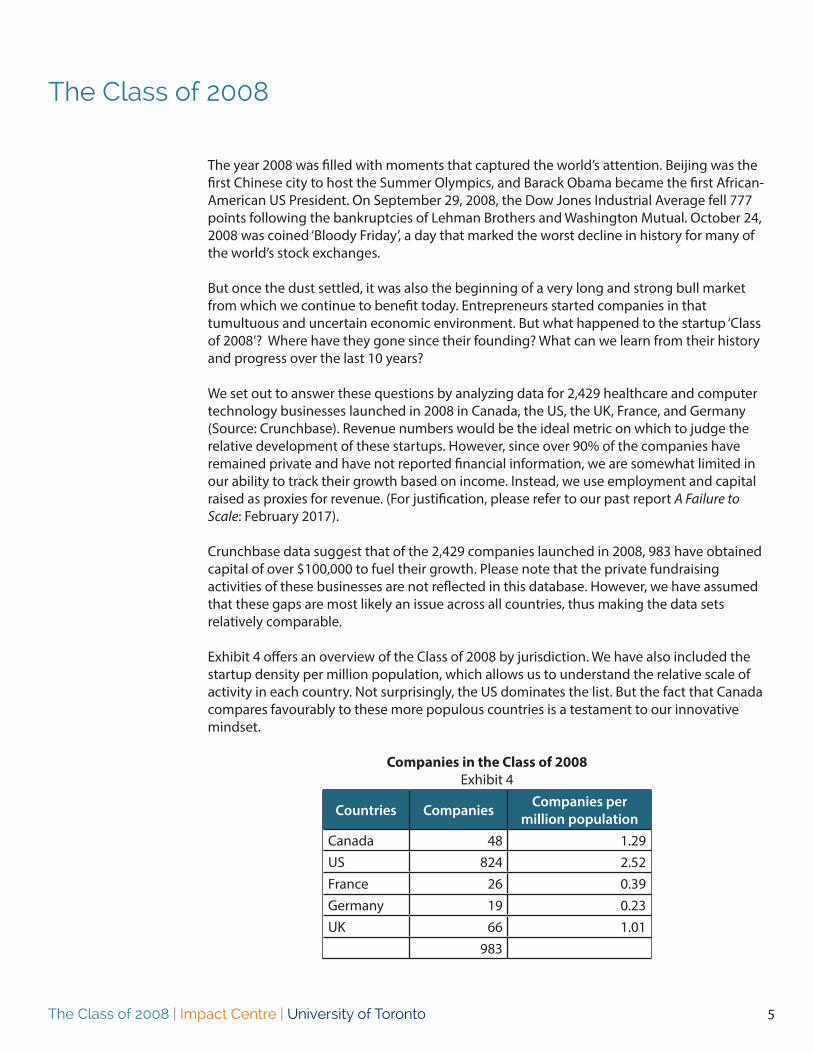
Exhibit 4 offers an overview of the Class of 2008 by jurisdiction. We have also included the startup density per million population, which allows us to understand the relative scale of activity in each country. Not surprisingly, the US dominates the list. But the fact that Canada compares favourably to these more populous countries is a testament to our innovative mindset.
Companies in the Class of 2008Exhibit 4
Countries Companies Companies per million population
Canada 48 1.29US 824 2.52France 26 0.39Germany 19 0.23UK 66 1.01 983
The Class of 2008 | Impact Centre | University of Toronto 6
When we first reviewed these statistics, we were concerned that US firms may be overrepresented due to the availability of data and the location of the firm coordinating the database. Headquartered in San Francisco, Crunchbase may be more likely to cover activities of US-based firms. If this were indeed a factor, we would see a greater percentage of larger deals in countries outside the US as smaller deals would likely be missed during data gathering. We tested for this by mapping out the distribution of deals for our data set over the last ten years.
We found that, with the exception of France, the distribution of deals in all jurisdictions was quite similar. If there were a regional misrepresentation in the data, there would be a significantly higher percentage of investments under $1 M in the US than in other places. However, this is not the case. We are confident that, despite some gaps, the data are comparable between countries.
Industry Breakdown
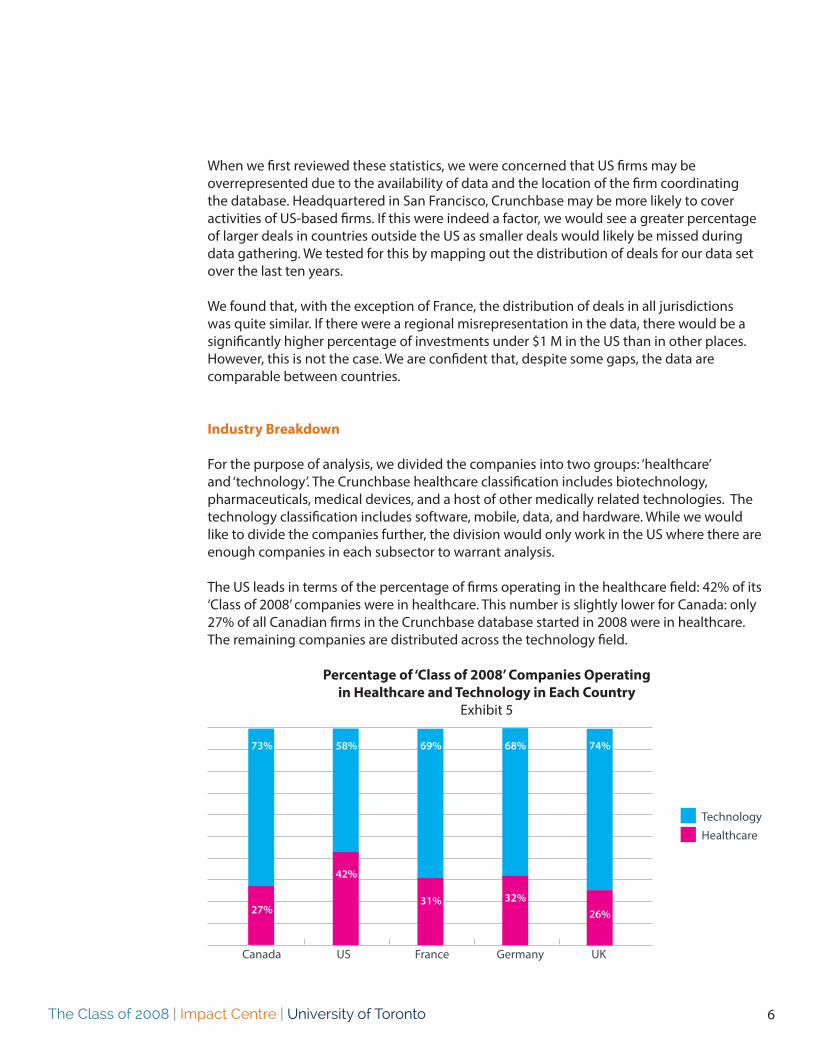
For the purpose of analysis, we divided the companies into two groups: ‘healthcare’ and ‘technology’. The Crunchbase healthcare classification includes biotechnology, pharmaceuticals, medical devices, and a host of other medically related technologies. The technology classification includes software, mobile, data, and hardware. While we would like to divide the companies further, the division would only work in the US where there are enough companies in each subsector to warrant analysis.
The US leads in terms of the percentage of firms operating in the healthcare field: 42% of its ‘Class of 2008’ companies were in healthcare. This number is slightly lower for Canada: only 27% of all Canadian firms in the Crunchbase database started in 2008 were in healthcare. The remaining companies are distributed across the technology field.
Percentage of ‘Class of 2008’ Companies Operating in Healthcare and Technology in Each Country
Exhibit 5
Canada US France Germany UK
73%
27%
58%
42%
69%
31%
68%
32%
74%
26%
TechnologyHealthcare

The Class of 2008 | Impact Centre | University of Toronto 7
Companies with the Highest Total Capital Raised
The Class of 2008 does not include any of the world’s most famous companies such as Uber, Alibaba or AirBnB. At the top, the list is largely populated by US firms. Exhibit 6 shows the top three firms from each country. (Canada is shown separately in the next section.)
Leading International Companies Exhibit 6
Company Country
Total capital raised
since 2008 ($M)
Funding Rounds
Years to 1st
Funding
Employees(LinkedIn) Exit
Stemcentrx US 515.5 4 3 166 M&AGinkgo Bioworks US 429.1 6 6 157 -Sentient US 324.3 7 1 97 -
CARMAT France 66.9 2 - - IPOLucibel France 32.3 9 - - IPOGlobal Bioenergies France 23.0 1 - - IPO
BioNTech AG Germany 270.0 1 - - -Blue Yonder Germany 75.0 3 - - -AMW GmbH Germany 47.1 5 - - -
Farfetch UK 721.5 8 - - -Immunocore UK 360.0 2 - - -Adaptimmune UK 149.5 4 - - IPO
Canadian Companies
The following exhibit is a list of the top ten Canadian companies from the Class of 2008, ordered by the total amount of capital raised as recorded by Crunchbase.

The Class of 2008 | Impact Centre | University of Toronto 8
Leading Canadian CompaniesExhibit 7
CompanyTotal capital
raised since 2008 ($M)
Funding Rounds
Years to 1st
Funding
Employees (LinkedIn) Exit
Neovasc 98.9 3 1 85 IPOSecureKey Technologies 91.8 9 2 83 -ScribbleLive 50.0 5 2 128 -360insights 47.6 3 5 222 -Dejero Labs 43.4 5 1 101 -Dayforce 40.0 3 1 144 M&ACarta Worldwide 39.2 5 0 103 -Peraso Technologies 37.3 3 1 85 -GenomeDx Biosciences 31.6 5 4 32 -Profound 26.9 3 3 60 -

The Class of 2008 | Impact Centre | University of Toronto 9
We reviewed in detail all financing transactions reported by Crunchbase for these companies. We computed both the average funding per firm as well as the average funding with statistical outliers removed from the sets (i.e. the ‘adjusted average’). These ‘statistical outliers’ represent firms that have raised exceptional or record-level amounts of money, well above the market average. Since the US, Canada, and France had no statistical outliers, no companies were removed from the data. The UK had two outliers, and Germany had one as explained below.
We were surprised to find that German and UK companies obtained more funding, on average, than the average business in the US. However, when the outliers were removed, the adjusted average is more in line with expected levels of funding per firm. In fact, when exceptions are removed, the average funding raised by Canadian companies is second behind the US.
Average Funding Per CompanyExhibit 8
When outliers are taken into consideration, Germany’s success was due to funding in healthcare. Their average is influenced significantly by the inclusion of BioNTech AG, which received $270 M of funding in 2018. Without this single business, the average funding per healthcare company in Germany would only be $10.3 M. (See Exhibit 9) The UK’s results are heavily influenced by the inclusion of Immunocore, a biotechnology firm that smashed European biotech records when they received $320 M of funding in 2015. Without this company, the UK average for healthcare businesses would be only $26.3 M. (Exhibit 9)
Canada’s funding of healthcare companies is well below all other jurisdictions, even on an adjusted basis. This is the second statistic that points directly at healthcare funding challenges as an issue in Canada. Exhibit 5 shows that the percentages of companies started in 2008 in Canada in healthcare was only slightly above that of the UK.
Average Funding Obtained
Canada US France Germany UK
$30 M
$25 M
$20 M
$15 M
$10 M
$5 M
$0 M

The Class of 2008 | Impact Centre | University of Toronto 10
Average Healthcare Funding Per CompanyExhibit 9
In the broader technology sector, Canada’s ‘adjusted’ funding is only slightly behind the US. The UK results are once again dominated by one company called Farfetch that has received a total of $721 M in funding.
Average Technology Funding Per CompanyExhibit 10
Given their capacity to skew the data, these ‘outliers’ (three firms in total) were removed from the analysis in the remainder of our Impact Brief.
Canada US France Germany UK
$35 M
$30 M
$25 M
$20 M
$15 M
$10 M
$5 M
$0 M
Canada US France Germany UK
$25 M
$20 M
$15 M
$10 M
$5 M
$0 M

The Class of 2008 | Impact Centre | University of Toronto 11
Subnational Comparison
One can also compare subnational jurisdictions by looking at companies in various states and provinces. Exhibit 11 shows that Ontario is in the middle of the pack on this measure, but the remaining Canadian provinces trail individual states by a wide margin.
Average Subnational Funding Per CompanyExhibit 11
Although the average funding raised by Ontario’s technology firms is comparable to the capital raised in California, Ontario lags the leaders’ pack (Exhibit 12).
Illinois
Massachusetts
Georgia
California
New York
Texas
Ontario
Other US States
Pennsylvania
British Columbia
Quebec
Other Canadian Provinces
Alberta
$0 M $10 M $20 M $30 M $40 M $50 M $60 M $70 M
The Class of 2008 | Impact Centre | University of Toronto 12
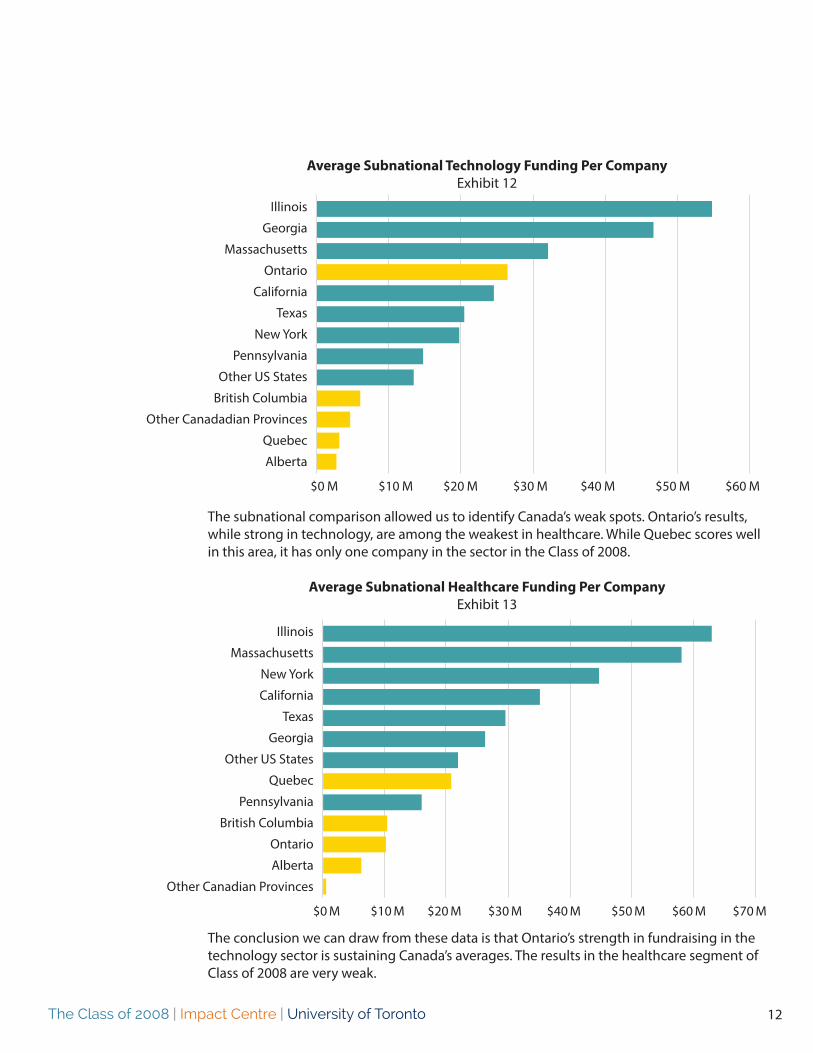
Average Subnational Technology Funding Per CompanyExhibit 12
The subnational comparison allowed us to identify Canada’s weak spots. Ontario’s results, while strong in technology, are among the weakest in healthcare. While Quebec scores well in this area, it has only one company in the sector in the Class of 2008.
Average Subnational Healthcare Funding Per CompanyExhibit 13
The conclusion we can draw from these data is that Ontario’s strength in fundraising in the technology sector is sustaining Canada’s averages. The results in the healthcare segment of Class of 2008 are very weak.
Illinois
Georgia
Massachusetts
Ontario
California
Texas
New York
Pennsylvania
Other US States
British Columbia
Other Canadadian Provinces
Quebec
Alberta
$0 M $10 M $20 M $30 M $40 M $50 M $60 M
Illinois
Massachusetts
New York
California
Texas
Georgia
Other US States
Quebec
Pennsylvania
British Columbia
Ontario
Alberta
Other Canadian Provinces
$0 M $10 M $20 M $30 M $40 M $50 M $60 M $70 M

The Class of 2008 | Impact Centre | University of Toronto 13
In order to evaluate the frequency of funding, we looked at the number of financing rounds per company in each country. As expected, the US leads the pack with firms moving, on average, through 3.1 rounds of funding. Canada was a close second.
Average Rounds of Funding Per CompanyExhibit 14
In healthcare, however, Canada does not fare as well. We are situated in the middle of the pack. We perform significantly better in the technology domain with more rounds of financing than all other countries. However, this may speak more to the common practice of Canadian funders who tend to provide smaller financing, thus necessitating more rounds to achieve similar levels of funding.
We can gauge the availability of late-stage funding (or the quality of late-stage companies) by looking at the percentage of companies in a country that receive one, two, three or more rounds of funding (Exhibit 15). The US and Canada perform similarly in this regard; they lead the pack in terms of late-stage financing. In fact, nearly half of the companies founded in 2008 went through three or more financing rounds. When it comes to six or more rounds, however, the US is the clear leader: 16% of US firms in the Class of 2008 reached six or more stages, relative to 4% for Canada.
Percentage of Companies Getting 3+ Rounds of FundingExhibit 15
Frequency of Funding
3.1
Canada
US
France
Germany
UK
Number of rounds(2008-2018)
2.7
2.2
2.1
2.5
Canada US France Germany UK
50%
40%
30%
20%
10%
0%

The Class of 2008 | Impact Centre | University of Toronto 14
In terms of how that funding arrives over time, Exhibit 16 shows that Canadian funding is slow off the mark but picks up over time and eventually exceeds many other jurisdictions. What this means is that Canadian firms will have a much slower start and will struggle to grow in their earlier years relative to other regions around the world.
Dollars Received by Companies getting 3+ Rounds of FundingExhibit 16
In addition, the average funding per round in Canada is lower than in the US.
Average Funding Per RoundExhibit 17
Canada US France Germany UK
$50 M
$45 M
$40 M
$35 M
$30 M
$25 M
$20 M
$15 M
$10 M
$5 M
$0 M
Canada US France Germany UK
$9 M
$8 M
$7 M
$6 M
$5 M
$4 M
$3 M
$2 M
$1 M
$0 M

The Class of 2008 | Impact Centre | University of Toronto 15
In past Impact Briefs, we determined that Canadian companies are funded later, less often, and in lower amounts (refer to our report entitled A Failure to Scale, February 2017). These findings are also supported by our analysis of the Class of 2008:
• Canadian companies in this study received an average of 2.7 rounds of financing versus 3.1 in the US,
• they received an average of $15.5 M versus $25.2 M in the US, and • the average funding per round is substantially lower than the US.
But when does the initial capitalization occur? To do this analysis, we looked at all companies that had received only one round of funding (Exhibit 18). The data suggest that Canadian companies take longer to secure their first funding, and typically, the amount raised is smaller than in other jurisdictions.
Years to First FundingExhibit 18
Of particular concern behind these numbers is the fact that Canadian healthcare companies commonly receive their first funding after 6.5 years versus 3.9 years for an average US healthcare business.
Initial Capitalization
Canada
US
France
Germany
UK
3.6
4.4
5.6
2.7
4.8
The Class of 2008 | Impact Centre | University of Toronto 16
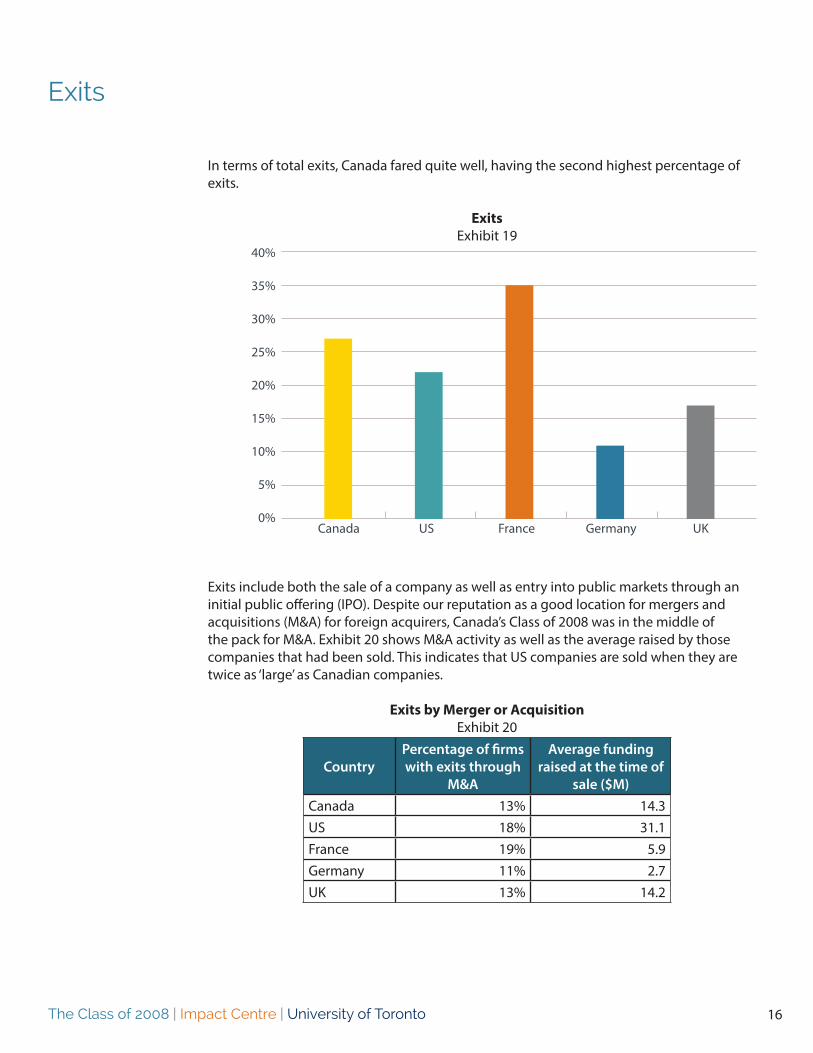
In terms of total exits, Canada fared quite well, having the second highest percentage of exits.
ExitsExhibit 19
Exits include both the sale of a company as well as entry into public markets through an initial public offering (IPO). Despite our reputation as a good location for mergers and acquisitions (M&A) for foreign acquirers, Canada’s Class of 2008 was in the middle of the pack for M&A. Exhibit 20 shows M&A activity as well as the average raised by those companies that had been sold. This indicates that US companies are sold when they are twice as ‘large’ as Canadian companies.
Exits by Merger or AcquisitionExhibit 20
CountryPercentage of firms with exits through
M&A
Average funding raised at the time of
sale ($M)Canada 13% 14.3US 18% 31.1France 19% 5.9Germany 11% 2.7UK 13% 14.2
Exits
Canada US France Germany UK
40%
35%
30%
25%
20%
15%
10%
5%
0%

The Class of 2008 | Impact Centre | University of Toronto 17
Surprisingly, Canada leads the pack in terms of IPOs in the Class of 2008 (Exhibit 21). This may not be a good thing, however. While we had a greater percentage of IPOs, the average raised by those companies that went public was the lowest of the group, with less than one quarter of the amount that had been raised by US firms. This may indicate either a lack of late-stage capital that forces companies to access public markets to fuel their growth or the ready availability of capital on the TSX Venture Exchange where many of these companies were listed.
Exits by Initial Public OfferingExhibit 21
CountryPercentage of firms with exits through
IPO
Average funding raised by companies
before IPO ($M)Canada 15% 21.9US 5% 88.6France 15% 30.9Germany 0% 0.0UK 5% 55.6
We looked in more detail at the progress that the Canadian and US companies had made since their IPOs. While it may look good that we have so many companies with an IPO, the results show that these companies have not succeeded in spite of going public. From this group, the average Canadian company went public in 2015 and the average US company in 2014. The revenue levels and market values of Canadian public companies started in 2008 is substantially lower than for their American counterparts.
Average Results for Public CompaniesExhibit 22
$700 M
$600 M
$500 M
$400 M
$300 M
$200 M
$100 M
$0 MAverage revenue Market valueMost recent fiscal year as of May 1, 2018
CanadaUS

The Class of 2008 | Impact Centre | University of Toronto 18
For those companies that had not been sold or gone public, we looked at when they had last received funding. Our theory was that the more recent the funding, the more successful the company, at least from the perspective of venture capitalists who are supporting the company. We used ‘year of last funding’ to divide companies according to results and potential.
Exhibit 23 shows the most recent year of funding and the average funding for those companies. The data show that 63% of Canadian companies that are still in business (i.e. have not been acquired or experienced an IPO) received more than one round of funding. The next Exhibit shows that the US deserves its reputation for letting companies fail fast. For US-based companies, only 54% of the firms that remain from the Class of 2008 were able to get funding after 2013. The ones that were funded more recently had an average funding of almost $40M.
Average Total Funding by Last Funding Year: US vs CanadaExhibit 23
One can also look at Exhibit 24 as a measure of firms remaining whose funding was cut off after 2013. It is interesting to note that all other countries cut funding off for what we presume to be underperforming firms earlier than Canada does.
The Remaining Class of 2008
$45 M
$40 M
$35 M
$30 M
$25 M
$20 M
$15 M
$10 M
$ 5 M
$0 M 2008 - 2013 2014 - 2015 2016+
CanadaUS
The Class of 2008 | Impact Centre | University of Toronto 19
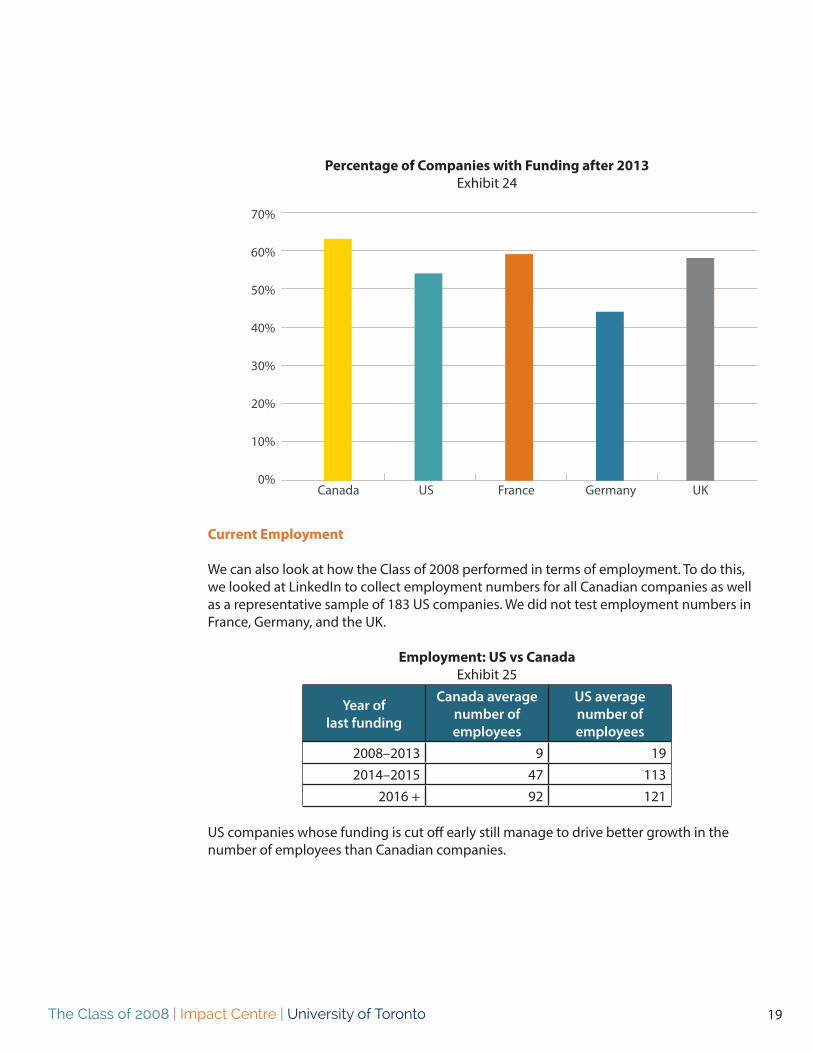
Percentage of Companies with Funding after 2013Exhibit 24
Current Employment
We can also look at how the Class of 2008 performed in terms of employment. To do this, we looked at LinkedIn to collect employment numbers for all Canadian companies as well as a representative sample of 183 US companies. We did not test employment numbers in France, Germany, and the UK.
Employment: US vs CanadaExhibit 25
Year of last funding
Canada average number of employees
US average number of employees
2008–2013 9 192014–2015 47 113
2016 + 92 121
US companies whose funding is cut off early still manage to drive better growth in the number of employees than Canadian companies.
Canada US France Germany UK
70%
60%
50%
40%
30%
20%
10%
0%

The Class of 2008 | Impact Centre | University of Toronto 20
Employee Growth
Finally, as probably the best measurement of progress, we can look at employment growth for firms with 30 or more employees. The data are clear in that US employment growth far outstrips Canadian employment growth for all firms, regardless of most recent date of funding.
Employee GrowthExhibit 26
Year of last funding
Canada employee growth
US employee growth
2008–2013 N/A 11.3%2014–2015 -1.0% 7.4%
2016 + 7.0% 12.9%
The Class of 2008 | Impact Centre | University of Toronto 21
Potential Implications for Business and Policy Makers
A careful analysis of the 2008 Class reveals a number of interesting trends in growth, exits, employment, and pre- and post-IPO revenue. In summary, what we found was that in comparison to the US, Canadian companies not only wait longer to get funding, but also raise fewer rounds with less money per round. The end result is that:
• Those that are sold, are sold when they are smaller than equivalent firms in the US.• The ones that elect an IPO in Canada have a very low level of success.• The remaining companies do not perform to the same extent as equivalent US ones.
What does this mean for the Canadian tech space?
We can take a three-level strategy to solving the problem of scale, and this must drive the fundraising and investment patterns right from the beginning of a company’s existence:
1. To create world-class companies capable of scaling, we need to help them access capital much sooner than what is currently done.
2. We then need to ensure that they seek and raise capital more frequently. 3. And if we are successful at speeding up their growth, we may be able to attract enough
late-stage capital to turn them into world-class companies.
Instead of focusing solely on late-stage companies, we need to continue our emphasis on early-stage companies and help them attain a velocity that makes them attractive to potential investors and funders. Canadian companies and researchers have the potential to develop world-leading technologies, products, and services, but the challenge ahead is to support them in attracting the capital necessary to propel them to the next stage of growth.
In this report we have attempted to show how Canada’s activities and results compare with other jurisdictions. In doing this we are challenged by access to data as without revenue numbers, we must use proxies to measure success. We are also constrained by the low number of Canadian companies available to study. Over time as we study more cohorts, this can be rectified.
The ‘Class of 2008’ analysis offered a number of insights into the trajectory and history of firms launched in 2008. The Impact Centre will continue to conduct this type of analysis on an annual basis. We also hoped that in doing so, we will be able to determine over a long time frame whether we are making progress at developing the technology sector in Canada.
Our next two reports on the health tech industry and on software company growth will attempt to further understand causal factors in company growth.
The Class of 2008 | Impact Centre | University of Toronto 22
This study looked at the results for all companies in the healthcare and technology fields founded in Canada, the US, Germany, France, and the United Kingdom in 2008. Data were obtained from Crunchbase, Yahoo Finance and LinkedIn. All data were collected in March 2018. All amounts are in US dollars.
This study was not intended to be academically rigorous, nor was it intended to be all-encompassing about the topic. It was designed only to add to the conversation on innovation and highlight areas worthy of future research by looking at data available from publicly available sources. We plan to complete further research on this subject in the future.
Methodology

The Class of 2008 | Impact Centre | University of Toronto 23
About the Impact Centre
We generate impact through industry projects and partnerships, entrepreneurial companies, training and research.
We bridge the gap between the university and industry to accelerate the development of new or improved products and services based on physical technologies. We work with graduate students and researchers to help them commercialize their discoveries. We provide undergraduate education and training for students at all levels to ease their transition into future careers.
The Impact Centre conducts research on all aspects of innovation, from ideation and commercialization to government policy and broader themes such as the connection between science and international development. We study how companies of all sizes navigate the complex path between a discovery and its market and how their collective innovations add up to create a larger socioeconomic impact.
Our objective is to understand how we can improve our ability to create world-class technology companies, how governments, companies, and academia can identify and adopt best practices in technology commercialization.
Science to Society
Impact Briefs
Charles PlantAuthorSenior [email protected]@cplant
Emina VeletanlićEditorManager, Strategic [email protected]
Lidia [email protected]
James Li
Harim Ulfig
Contributors
Read our collection of Impact Briefs: www.impactbriefs.ca
MaRS Data Catalysthttps://www.marsdd.com/systems-change/data-catalyst/
Sponsor

The Class of 2008 | Impact Centre | University of Toronto 24
Impact CentreSuite 411 - 112 College StreetToronto, OntarioCanada M5G 1L6
Tel: [email protected]