Embed Size (px)
Citation preview
High-Field MR CenterMax Planck Institute for Biological Cybernetics
Tuebingen. Germany
Aneta Keliris
November 8th, Cologne
Classes of MR Imaging Contrast Agents and
Chemical ModificationsEnabling Functional Neuroimaging
Outline
•Different types of MR imaging probes
• How to design responsive MR imaging probes for molecular neuroimaging?
•„Smart“ MR imaging agents for molecular neuroimaging applications
Magnetic Resonance Imaging
http://www.mr-tip.com
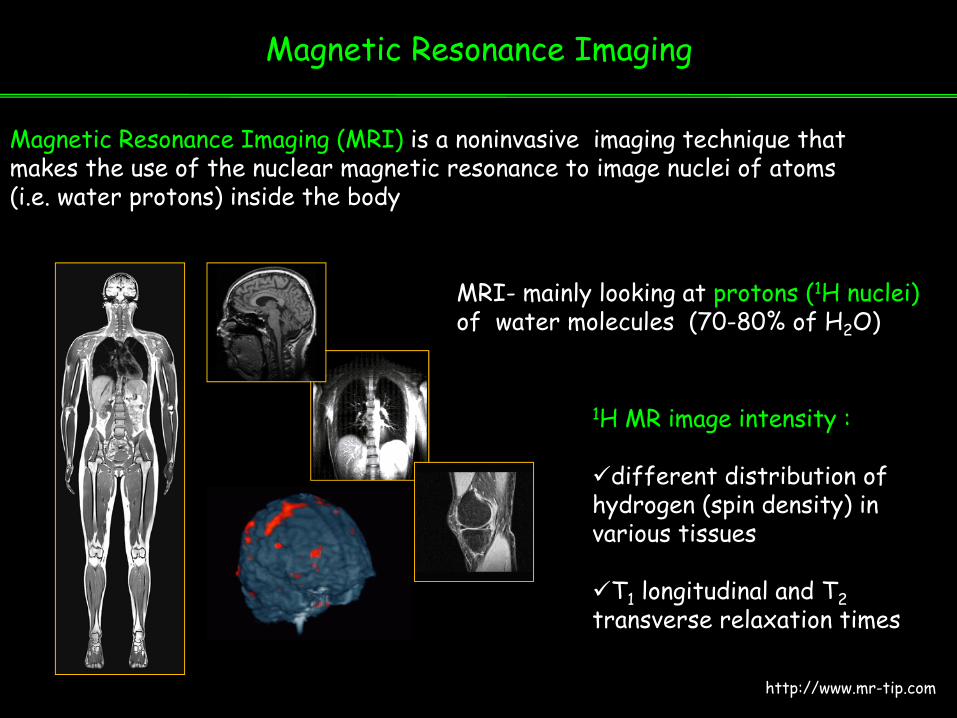
1H MR image intensity :
different distribution of hydrogen (spin density) in various tissues
T1 longitudinal and T2transverse relaxation times
Magnetic Resonance Imaging (MRI) is a noninvasive imaging technique that makes the use of the nuclear magnetic resonance to image nuclei of atoms (i.e. water protons) inside the body
MRI- mainly looking at protons (1H nuclei)of water molecules (70-80% of H2O)
Funtional Magnetic Resonance Imaging (fMRI)
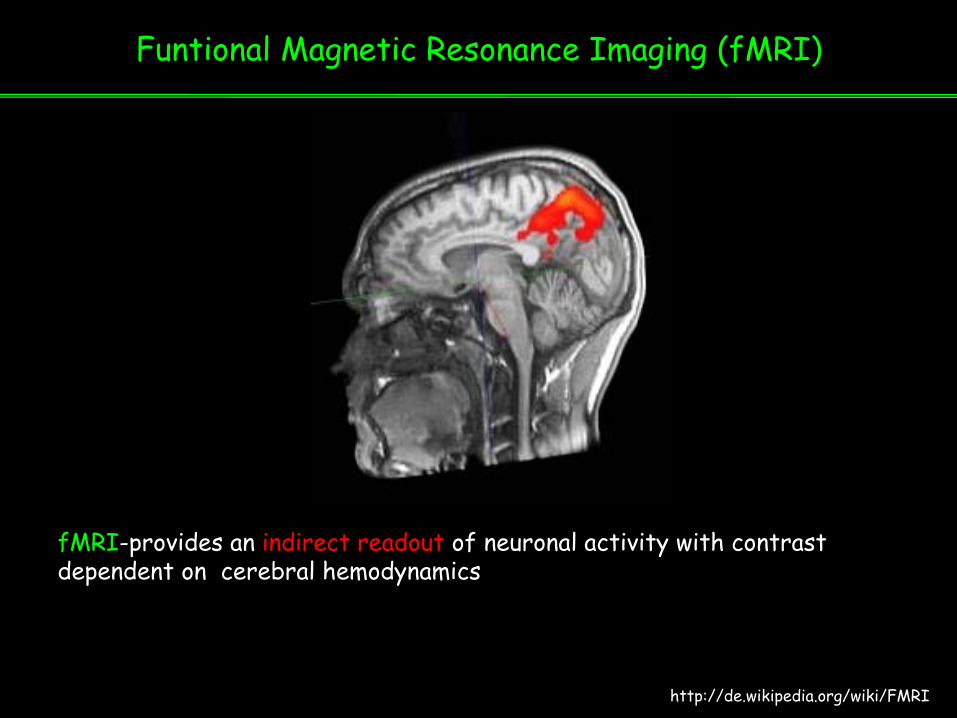
fMRI-provides an indirect readout of neuronal activity with contrast dependent on cerebral hemodynamics
http://de.wikipedia.org/wiki/FMRI
MRI Neuroimaging
How can we get a more direct readout of neuronal activity?
With using molecular MRI probes sensitive to aspects of neuronal physiology...
Metal ion concentration changes
pH changes
Gene expression
Neurotransmitters
Changes in membrane potential........
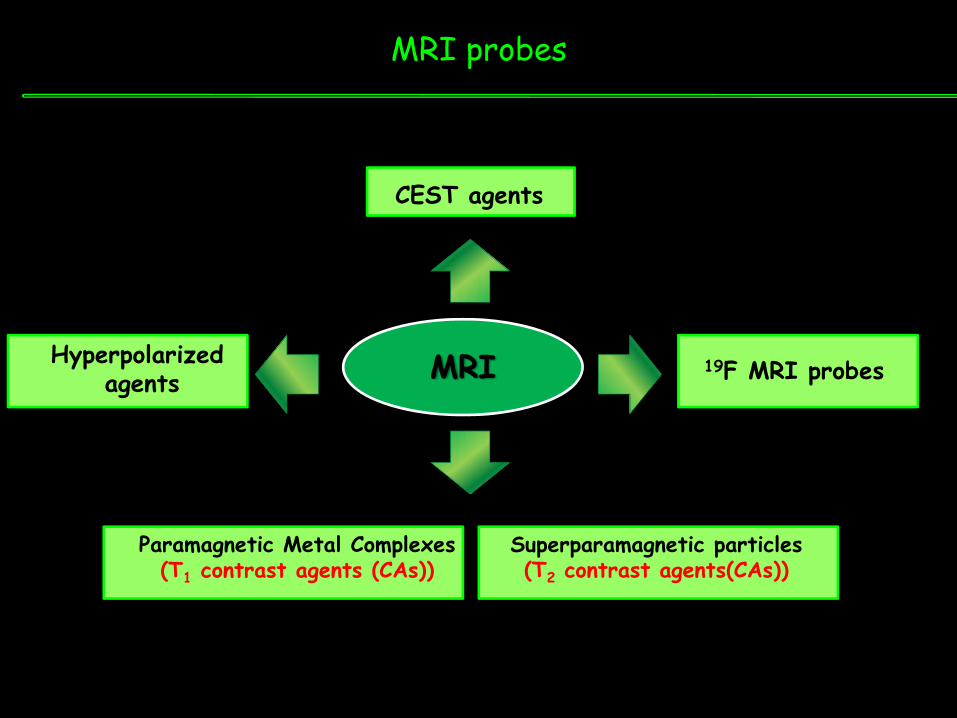
MRI probes
MRI 19F MRI probes
CEST agents
Hyperpolarizedagents
Paramagnetic Metal Complexes(T1 contrast agents (CAs))
Superparamagnetic particles(T2 contrast agents(CAs))
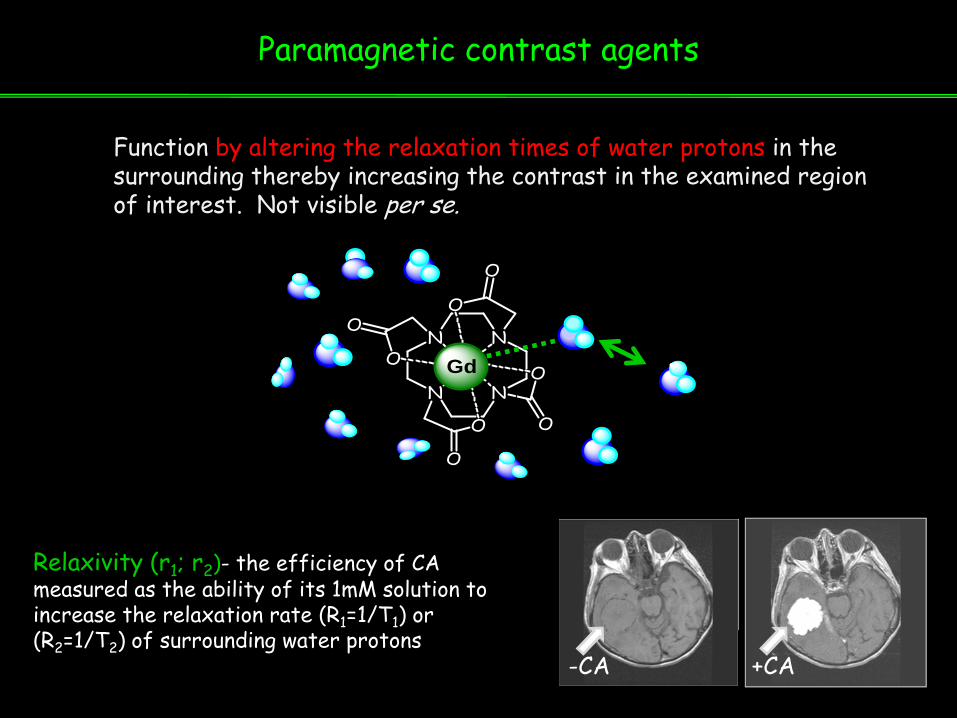
Paramagnetic contrast agents
Function by altering the relaxation times of water protons in the surrounding thereby increasing the contrast in the examined region of interest. Not visible per se.
N N
NN
O
O
O
O
O
O
O
O
Gd
Relaxivity (r1; r2)- the efficiency of CA measured as the ability of its 1mM solution to increase the relaxation rate (R1=1/T1) or (R2=1/T2) of surrounding water protons
-CA +CA
N N
NN
O
O
O
O
O
O
O
O
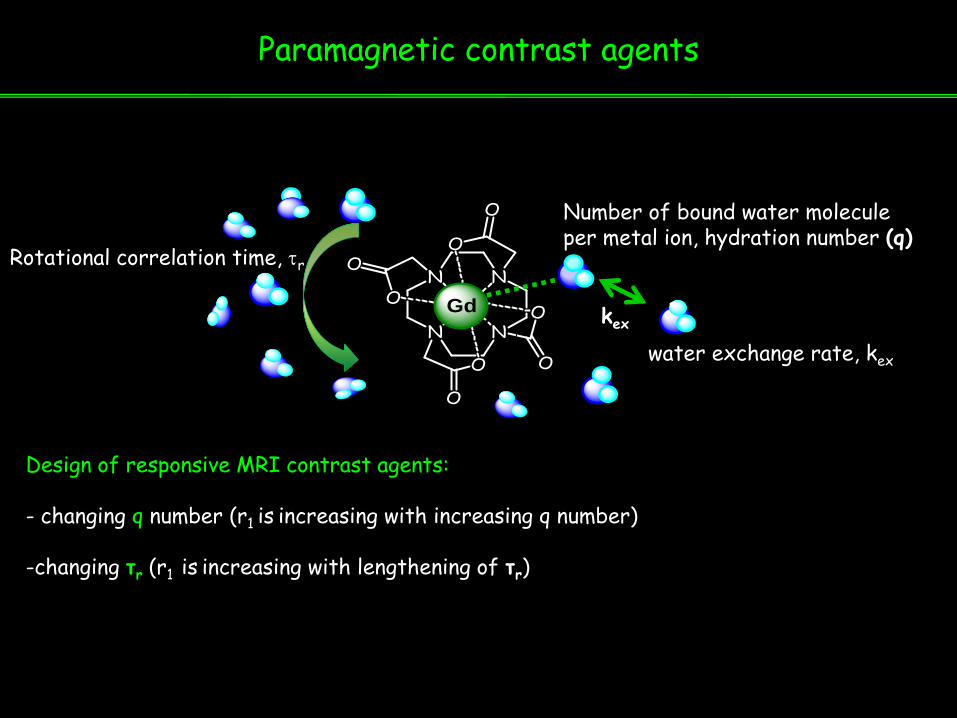
Gd
Number of bound water molecule per metal ion, hydration number (q)
water exchange rate, kex
Rotational correlation time, τr
kex
Design of responsive MRI contrast agents:
- changing q number (r1 is increasing with increasing q number)
-changing τr (r1 is increasing with lengthening of τr)
Paramagnetic contrast agents
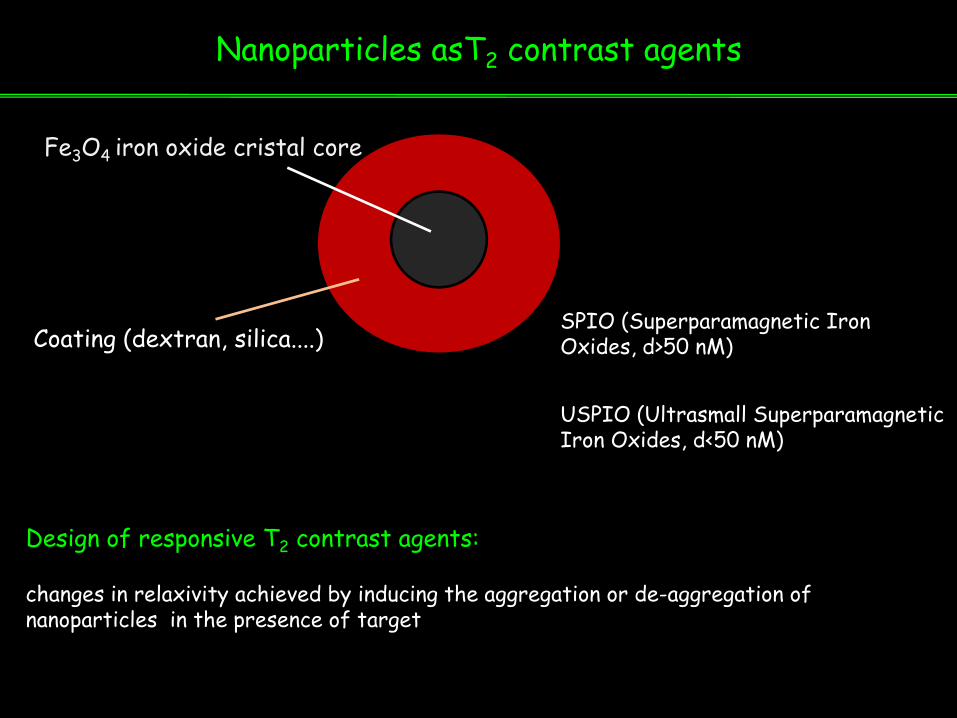
Nanoparticles asT2 contrast agents
Fe3O4 iron oxide cristal core
Coating (dextran, silica....) SPIO (Superparamagnetic Iron Oxides, d>50 nM)
USPIO (Ultrasmall Superparamagnetic Iron Oxides, d<50 nM)
Design of responsive T2 contrast agents:
changes in relaxivity achieved by inducing the aggregation or de-aggregation of nanoparticles in the presence of target

Chemical Exchange Saturation Transfer (CEST) agents
Bulk water
Saturationrf puls
Saturation transfer
Bulk water
CEST agent mobile protons
CEST agents are able to generate a „frequency-encoded“ MR contrast
Aime et al., Angew.Chem.Int.Ed., 2005
A) Unlabeled cells; B) Tb-labeled cells; C) Eu-labeled cells; D) Tb- and Eu-labeled cells
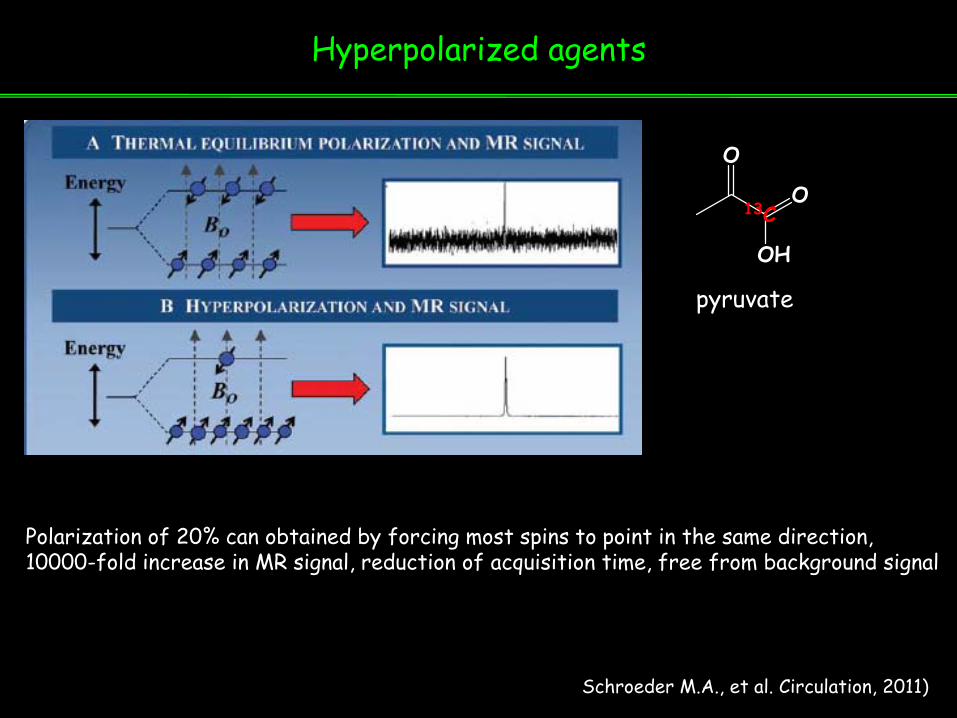
Hyperpolarized agents
Polarization of 20% can obtained by forcing most spins to point in the same direction, 10000-fold increase in MR signal, reduction of acquisition time, free from background signal
OH
O
O
13C
pyruvate
Schroeder M.A., et al. Circulation, 2011)
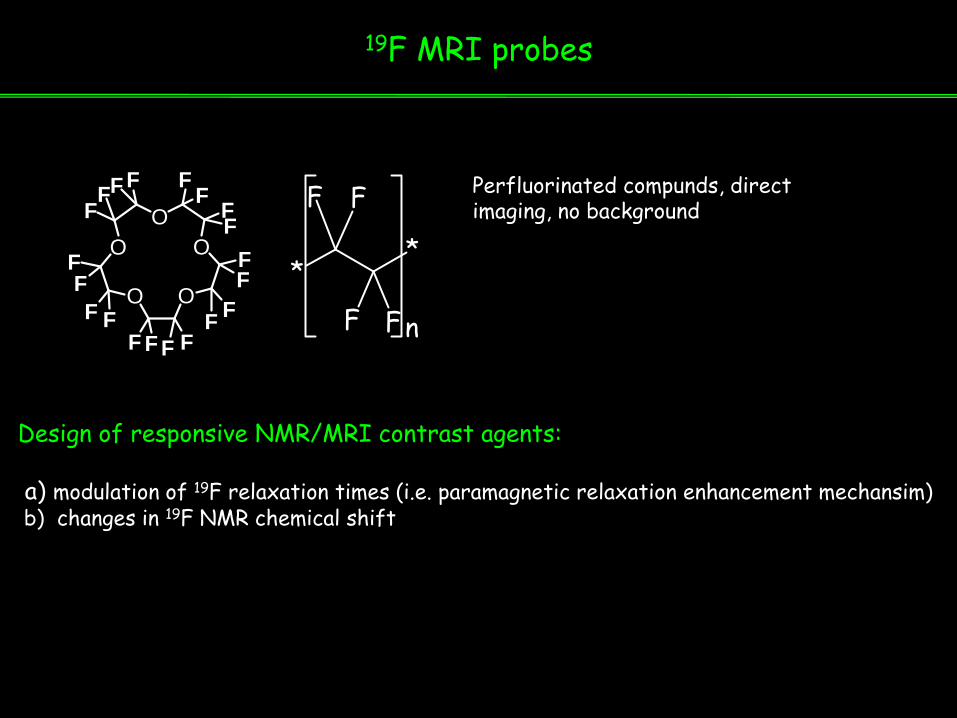
19F MRI probes
O O
OO
O
FF
F
F
F F
F
F
FF
F
F
FFF
FF
FF
F
**
F F
F Fn
Design of responsive NMR/MRI contrast agents:
a) modulation of 19F relaxation times (i.e. paramagnetic relaxation enhancement mechansim)b) changes in 19F NMR chemical shift
Perfluorinated compunds, direct imaging, no background
MRI probes for Neuroimaging:practical applications
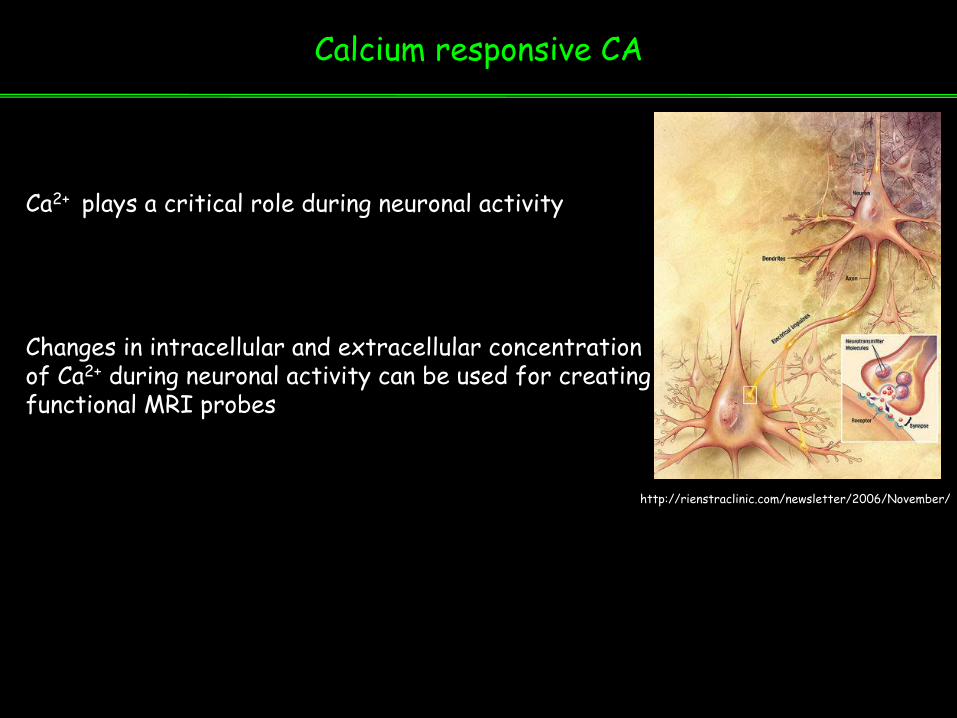
Calcium responsive CA
Ca2+ plays a critical role during neuronal activity
Changes in intracellular and extracellular concentration of Ca2+ during neuronal activity can be used for creating functional MRI probes
http://rienstraclinic.com/newsletter/2006/November/

Eschenko O. et al., Neuroimage, 2010
Mapping of functional brain activity
Mn2+ enhanced MRI (MEMRI)
Characteristics :
- Mn2+ is a paramagnetic analog of Ca2+, thus can enter voltage gated calcium ion channels
-MEMRI has specificity to image small neuronal representation that would be to small for BOLD based fMRI
- used for brain connectivty studies
but.....
toxicity concerns as Mn2+ leaves the brain on the scale of weeks
Regions of brain activation related to movements in the running-wheel as revealed by increased intensity of T1-weighted images due to Mn2+ accumulation in runners (n = 6) compared to sedentary (n = 6) rats. Right column: corresponding sections from the rat atlas with highlighted primary and secondary motor (red) and sensory (green) cortices
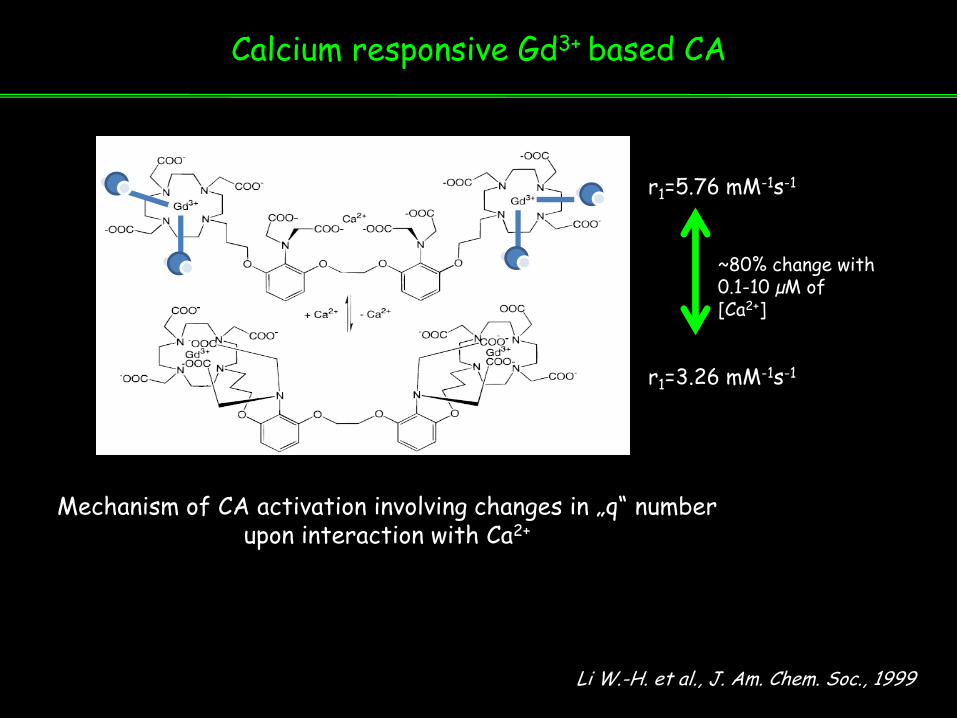
Calcium responsive Gd3+ based CA
Li W.-H. et al., J. Am. Chem. Soc., 1999
r1=3.26 mM-1s-1
r1=5.76 mM-1s-1
~80% change with 0.1-10 µM of [Ca2+]
Mechanism of CA activation involving changes in „q“ number upon interaction with Ca2+
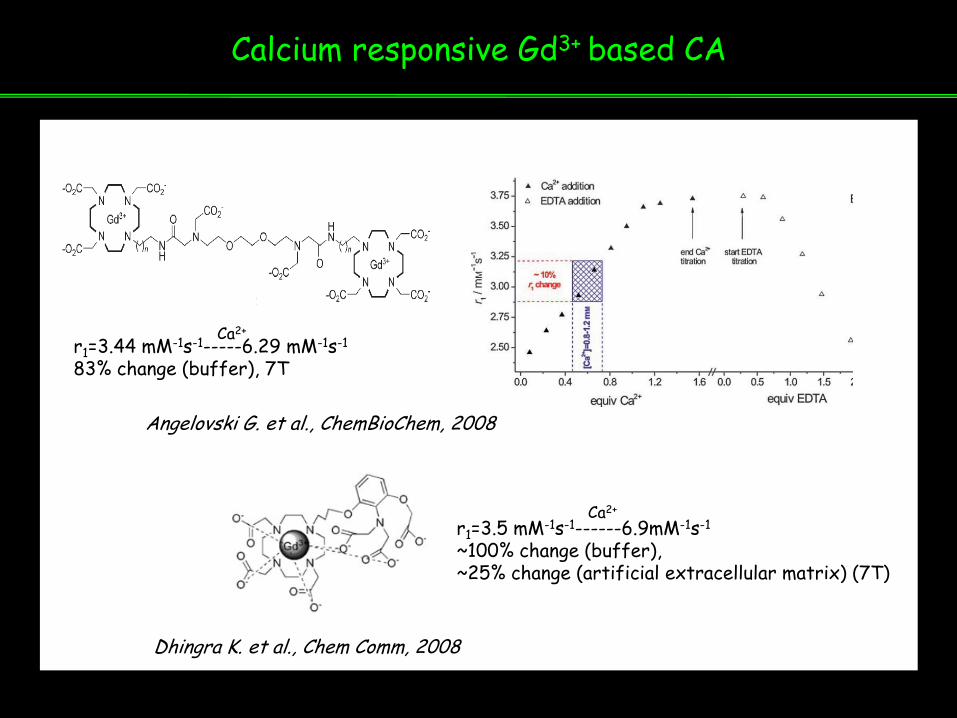
Calcium responsive Gd3+ based CA
Dhingra K. et al., Chem Comm, 2008
r1=3.44 mM-1s-1-----6.29 mM-1s-1
83% change (buffer), 7T
Ca2+
r1=3.5 mM-1s-1------6.9mM-1s-1
~100% change (buffer),~25% change (artificial extracellular matrix) (7T) modulation of
Ca2+
Angelovski G. et al., ChemBioChem, 2008
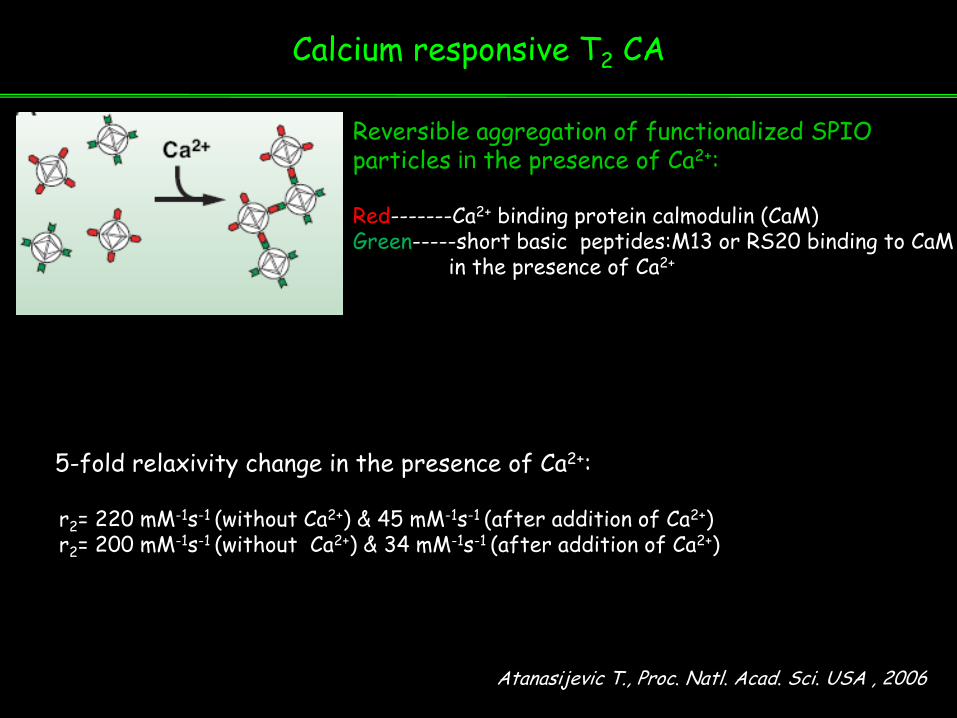
Atanasijevic T., Proc. Natl. Acad. Sci. USA , 2006
Calcium responsive T2 CA
5-fold relaxivity change in the presence of Ca2+:
r2= 220 mM-1s-1 (without Ca2+) & 45 mM-1s-1 (after addition of Ca2+)r2= 200 mM-1s-1 (without Ca2+) & 34 mM-1s-1 (after addition of Ca2+)
Reversible aggregation of functionalized SPIO particles in the presence of Ca2+:
Red-------Ca2+ binding protein calmodulin (CaM)Green-----short basic peptides:M13 or RS20 binding to CaM
in the presence of Ca2+

Calcium responsive MRI agents
Smith G.A. et al., Proc. Natl. Acad. Sci. USA , 1983
Ligand:Ca2+(2:1)
Angelovski G. et al., Bioorg. & Med. Chem, 2011
The CEST images represent the intensity difference between the spin-echo images for saturation at δ = 11 ppm and δ = +11 ppm (20 mM YbL1) or at δ = +41 ppm and δ = +26 ppm (20 mM EuL1), 23 C, 9.4 T
19F chemical shift agent PARACEST agent
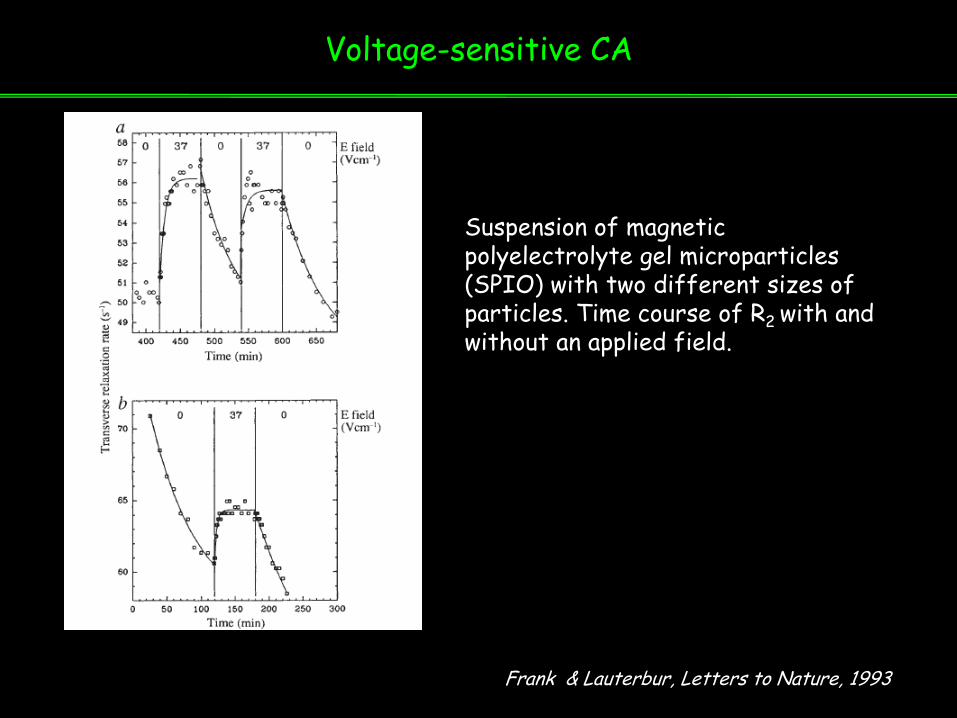
Voltage-sensitive CA
Frank & Lauterbur, Letters to Nature, 1993
Suspension of magnetic polyelectrolyte gel microparticles (SPIO) with two different sizes of particles. Time course of R2 with and without an applied field.

Neurotransmitter responsive CA
Receptor imaging
Neurotransmitter imaging
Dopamine (DA)Noradrenaline (NA)
Serotonine (SE)Glutamate
γ-aminobutyric acid (GABA)Histamine (5-HT)
Acetocholine (Ach)........
http://rienstraclinic.com/newsletter/2006/November/
Neurotransmitters: endogenous brain chemicals that allow transmission of signal from neuron to target cell across synapses
Neurotransmitter responsive CA
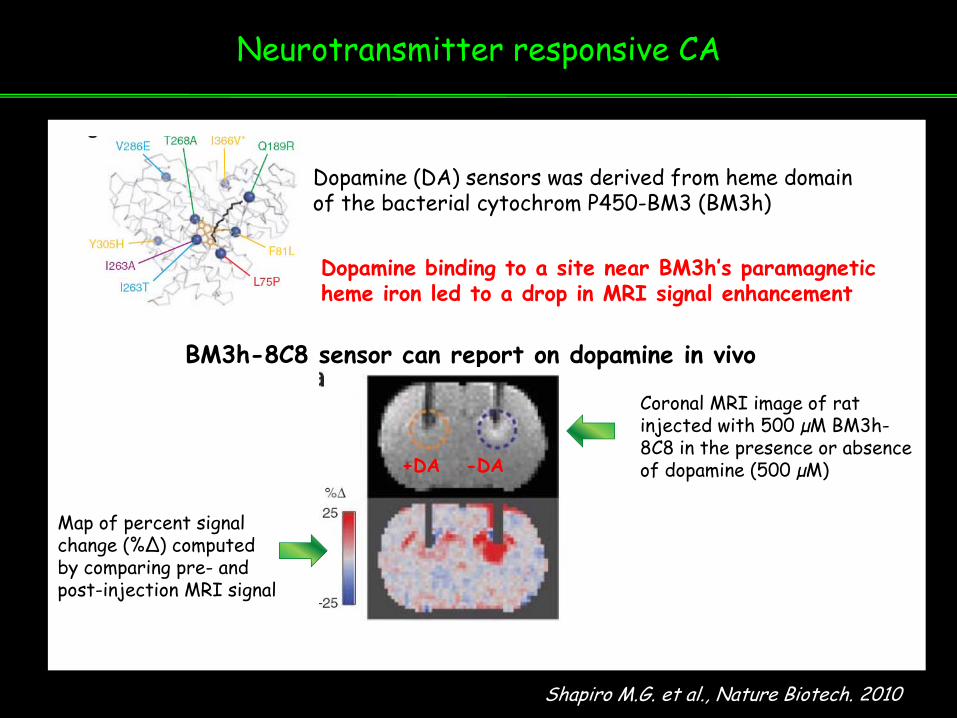
Shapiro M.G. et al., Nature Biotech. 2010
Dopamine (DA) sensors was derived from heme domain of the bacterial cytochrom P450-BM3 (BM3h)
BM3h-8C8 sensor can report on dopamine in vivo
Dopamine binding to a site near BM3h’s paramagnetic heme iron led to a drop in MRI signal enhancement
-DA+DA
Coronal MRI image of rat injected with 500 µM BM3h-8C8 in the presence or absence of dopamine (500 µM)
Map of percent signal change (%∆) computed by comparing pre- and post-injection MRI signal
Neuroreceptor targeting
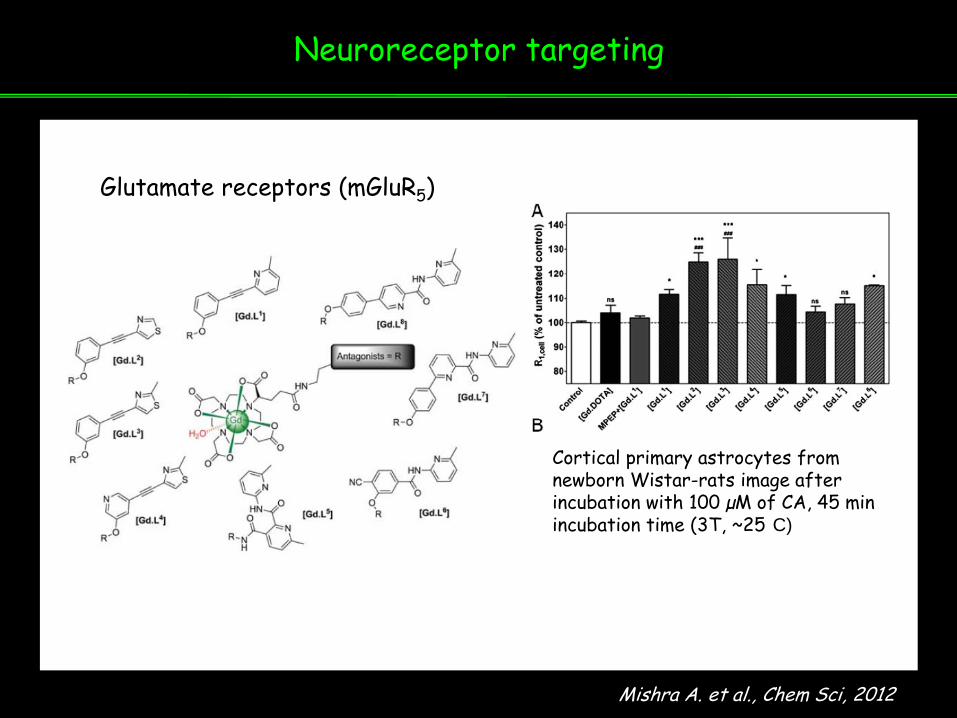
Mishra A. et al., Chem Sci, 2012
Glutamate receptors (mGluR5)
Cortical primary astrocytes from newborn Wistar-rats image after incubation with 100 µM of CA, 45 min incubation time (3T, ~25 C)
Genetically controlled CAs
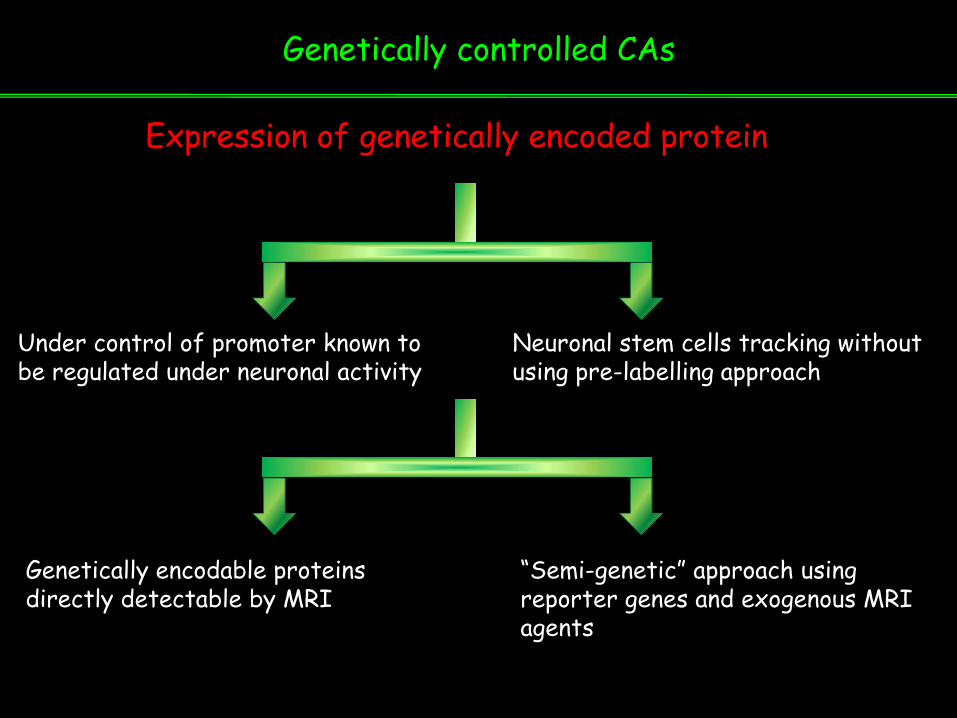
Expression of genetically encoded protein
Under control of promoter known to be regulated under neuronal activity
Neuronal stem cells tracking without using pre-labelling approach
Genetically encodable proteins directly detectable by MRI
“Semi-genetic” approach using reporter genes and exogenous MRI agents
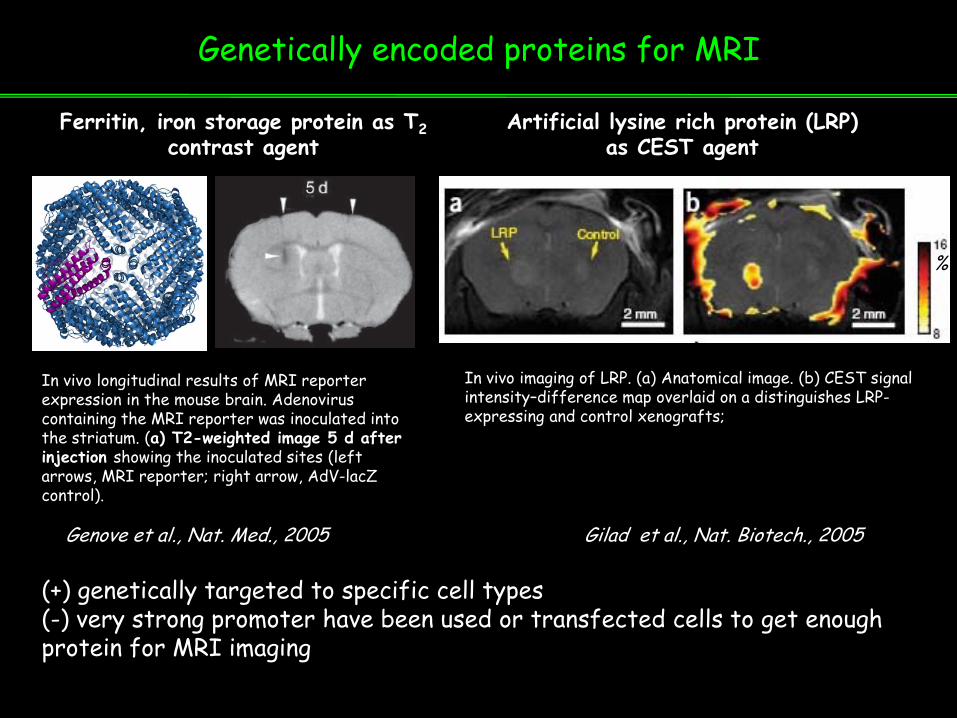
Genetically encoded proteins for MRI
Artificial lysine rich protein (LRP) as CEST agent
(+) genetically targeted to specific cell types(-) very strong promoter have been used or transfected cells to get enough protein for MRI imaging
Genove et al., Nat. Med., 2005 Gilad et al., Nat. Biotech., 2005
In vivo imaging of LRP. (a) Anatomical image. (b) CEST signal intensity–difference map overlaid on a distinguishes LRP-expressing and control xenografts;
Ferritin, iron storage protein as T2 contrast agent
%
In vivo longitudinal results of MRI reporter expression in the mouse brain. Adenovirus containing the MRI reporter was inoculated into the striatum. (a) T2-weighted image 5 d after injection showing the inoculated sites (left arrows, MRI reporter; right arrow, AdV-lacZ control).
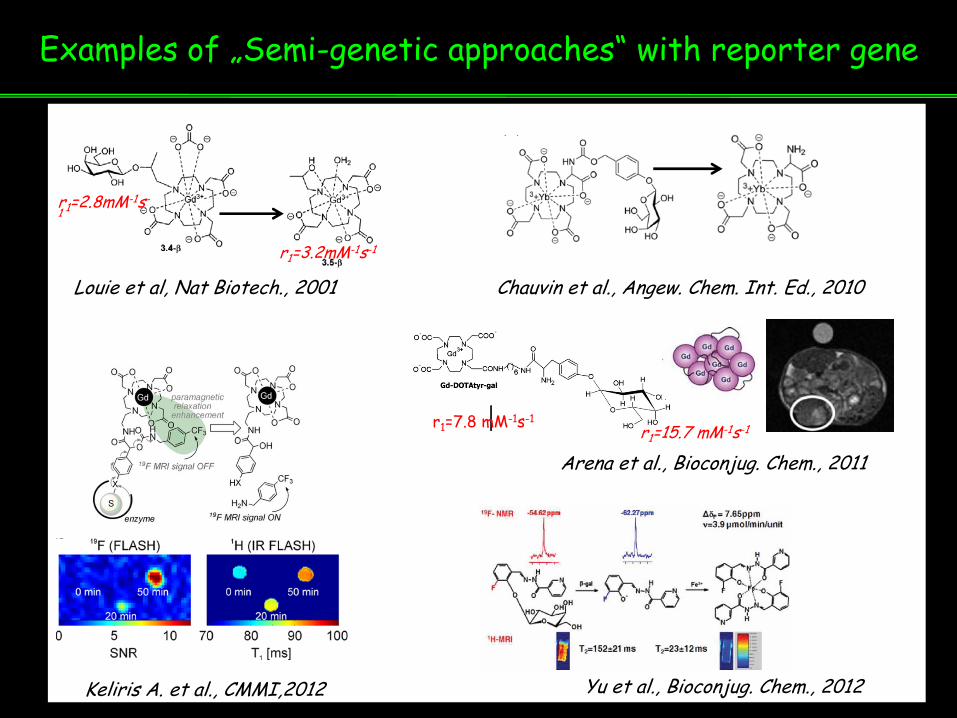
Examples of „Semi-genetic approaches“ with reporter gene
Louie et al, Nat Biotech., 2001 Chauvin et al., Angew. Chem. Int. Ed., 2010
Keliris A. et al., CMMI,2012
r1=3.2mM-1s-1
r1=2.8mM-1s-1
Arena et al., Bioconjug. Chem., 2011
r1=7.8 mM-1s-1r1=15.7 mM-1s-1
Yu et al., Bioconjug. Chem., 2012

Imaging of GABArgenic neurons
Aswendt et al., Neuroimage, 2012
Tissue cell lysates containing GAD
Implanted native and differentiated cells in the mouse brain. A) Representative T1 weighted image at 0.5 h after implantation of labeled differentiated cells (right striatum) and labeled undifferentiated cells (left striatum). B) Corresponding T1 map revealing distinct lower relaxation rate for the differentiated cell graft.
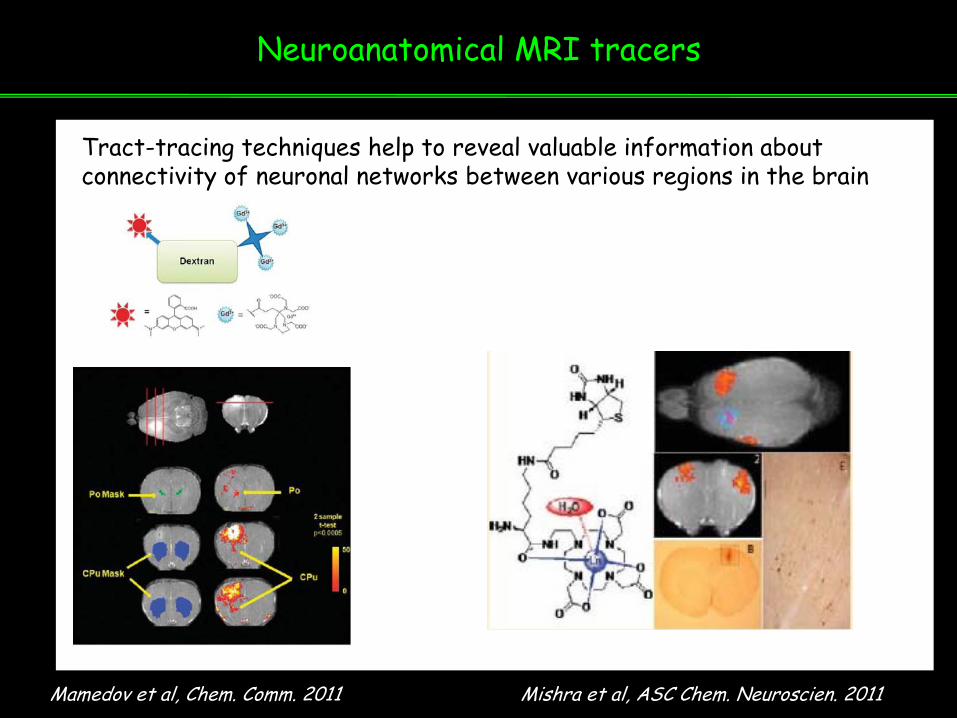
Neuroanatomical MRI tracers
Mamedov et al, Chem. Comm. 2011
Tract-tracing techniques help to reveal valuable information about connectivity of neuronal networks between various regions in the brain
Mishra et al, ASC Chem. Neuroscien. 2011