Embed Size (px)
Citation preview

Classical Item Analysis
Test Theory
Lecture 17
Chapter 11

2
Today’s Class
Building a test from item and test
statistics.
Tetrachoric correlations.

3
Introduction to Classical Item Analysis

4
Classical Item Analysis
Classical item analysis uses
conventional parameters of general
statistical theory to characterize:
Items.
Relations between items and test scores.
Relations between pairs of items.

5
Classical Item Analysis Goals
The usual intention is to use these as aids in
making a choice of best subset of items
A test of suitable length for general application
With items are homogenous with satisfactory:
Reliability.
Validity.
Predictive utility.

6
Item-Test Relations
7
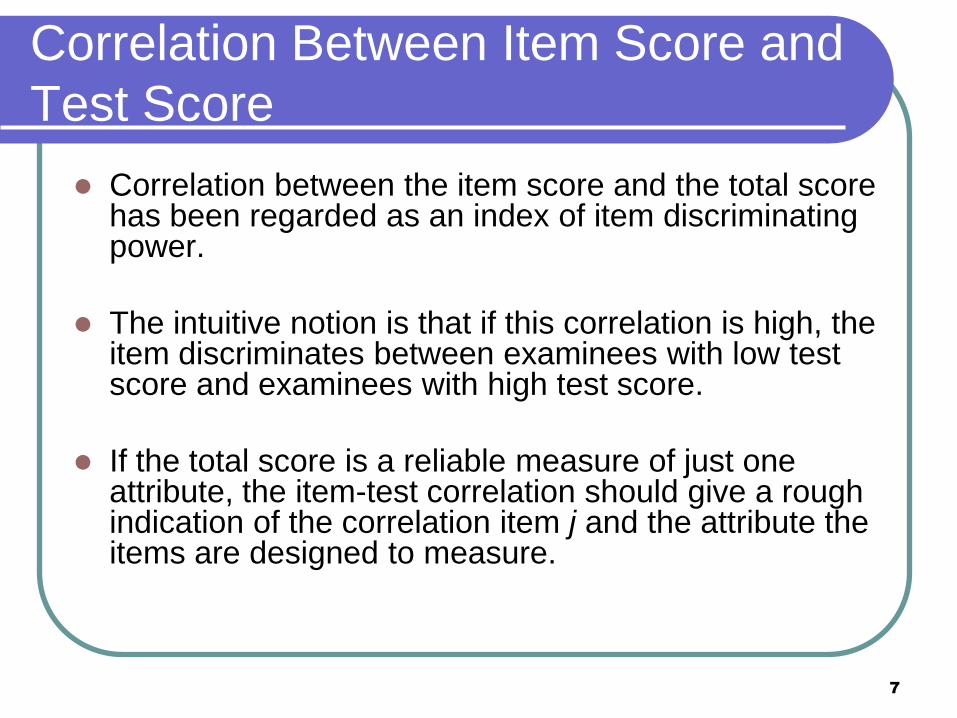
Correlation Between Item Score and
Test Score
Correlation between the item score and the total score has been regarded as an index of item discriminating power.
The intuitive notion is that if this correlation is high, the item discriminates between examinees with low test score and examinees with high test score.
If the total score is a reliable measure of just one attribute, the item-test correlation should give a rough indication of the correlation item j and the attribute the items are designed to measure.

8
Types of Correlations Used
Two alternatives in computing the
covariance or correlation between Xj
(score of item j) and Y (total test score)
as a measure for item discrimination:
1. Item-total score.
2. Item reminder score (correlation between
item j and (Y – Xj), Y-Xj is the item sum
with item j omitted).

9
Details About Correlations
The first coefficient is larger than the second one because item j is included in computing the item sum.
The first coefficient may be spuriously increased but same quantity, Y, is the criterion for "discriminating power" for every item.
The second coefficient eliminates the spurious increase of the obtained parameter, but the criterion is different for each item.
For sufficiently large item number of items, the effect of omitting or not omitting the item score will become negligible.

10
Possible Measures of Item
Discrimination
Some possible measures of item discriminating power include: The covariance between the j th item score and the
test score.
The covariance of each item (unstandardized) with the standardized test score.
The item-test correlation.
Each of the above measures (a), (b) and (c) has a counterpart in which the total test score is replaced by the reminder score.

11
Additional Details
1. These measures are applicable for
both quantitative and binary items.
2. Correlation between a binary variable
(e.g. a binary item score) and a
quantitative variable (e.g. test score) is
called point-biserial correlation.

12
Biserial Correlations
3. An alternative measure for correlation
between binary (X) and quantitative (Y)
variables is biserial correlation.
• The binary score (X) is postulated coming from a
quantitative variable (X*) which is jointly normally
distributed with Y.
• If a respondent's X* value above a certain
threshold, , the response is coded as a one.
• Otherwise, response is coded zero.

13
Details about Biserial
Correlations
4. There is a direct relationship between
the point-biserial correlation and
biserial correlation, which depends only
on item difficulty [see formula (11.6a)
and (11.6b)].
The point-biserial correlation is never
greater than .798 x biserial, and it has this
ratio at (item difficulty) equal to .5.

14
Assumptions Behind
Correlations
5. The implicit assumptions behind these
traditional devices of measuring the
"discriminating power" of an item is:
That the test score is approximately
unidimensional.
That the test score is sufficiently reliable for the
test score to serve as a good approximation to
the general attribute measured by most of the
items if not all of them.

15
Convergence, Part 1
6. If the item actually fits the single factor model, then as the number of items becomes large, the semi-standardized covariances will both converge on the factor loadings of the unstandardized items.
The semi-standardized covariances are the covariances of item j with the standardized test score or the covariance of item j with the standardized reminder score.
That is, in a large set of items, the loading – the expected increase in item score corresponding to a unit increase in the (standardized) true score/factor attribute – is closely approximated by the covariance of the unstandardized item score with the standardized test score.
In the case of binary items, this is the increase in probability of the keyed response per unit factor-score increase.

16
Convergence, Part 2
Similarly, as the number of items
become large, the item-test correlations
converge on the factor loadings of the
standardized items.

17
Test Statistics

18
How to Choose Items to Make a
Good Test
Some criteria for choosing items to make a "good" test from an item pool are:
1. To minimize ratio of the sum of the variances of the item scores of the m items to the variance of the test score, which will maximize Guttman-Cronbach alpha;
This procedure rests on the assumption that the item pools fits the single-factor model.

19
Choosing Items Under a Factor
Model
If factor analysis is allowed, choose items so
to:
2. Maximize coefficient omega (which in turn
maximizes construct validity).
3. Keep items with the largest information values
(ratio of squared factor loading of an item to its
uniqueness).
– Note that in our lab example this actually hurt us.
We had two items that were essentially the same – but
dropping one changed everything.

20
Maximizing Predictive Utility and
Concurrent Validity
To maximize prediction utility and
concurrent validity (i.e. correlation
between the test score and an external
criterion score), we can maximize the
ratio of covariance of item j with
standardized criterion score to
covariance of item j with standardized
test score.

21
Reliability-Validity Paradox

22
Reliability-Validity Paradox
A classical result from true-score theory
produces a paradox concerning the
relation between reliability and validity
The validity of a test with respect to any
criterion cannot exceed the index of
reliability.
VTYVTYV yy

23
Contradiction
This leads to contradiction in choosing items from an item pool by:
1. maximizing reliability by choosing items with high covariance between an item and the standardized test score.
2. maximize concurrent validity/predictive utility by choosing items with high covariance between an item and the standardized criterion score.

24
Paradox Resolution
This paradox is resolved by denying that the equation from Slide 22 is generally true.
Here, Y is a sum of item scores that fit a common factor model and their "error items" are their unique parts.
By definition, these error terms are mutually uncorrelated, but the truth of the equation rests on the additional assumption that they are uncorrelated with all other variables.
Such as assumption is extremely strong, and generally false.

25
Recommendations for Good
Tests
To make a good predictor, it is appropriate to choose an item set with good predictive utility, with no concern for its reliability/construct validity as measured by omega or bounded by alpha.
Rod's recommendation to resolve the contradiction between construct validity and predictive utility
"It is probably better to select the items on internal criterion only (i.e. maximize construct validity or coefficient omega) and then check the resulting test for its convergent validity, and also, if appropriate, its discriminant validity (p.243)."
26
Item Correlations and
Tetrachoric Correlations

27
Correlations Between Items
Because correlations are independent of the units of
measurement of the variables, there is strong
traditional tendency in psychometric theory to treat
correlations as somehow the fundamental quantities.
For analyzing correlation between binary items (which
then used in factor analysis), Pearson product-
moment correlation (also known as phi correlation) is
not a good measure because it cannot reach unity
when items have different difficulty level.

28
Tetrachoric Correlations
An alternative measure of association is the
tetrachoric correlation which can attain values of one
or minus one even when items have different difficulty
parameters.
Each of the two binary variables are assumed to
associate with a quantitative "response tendency" –
which are jointly normally distributed.
Tetrachoric correlation is the correlation between these two
quantitative response tendencies.

29
How Tetrachoric Correlations Work
The way we arrive at a tetrachoric correlation
is to try to match the probabilities of a 2x2
contingency table with that of the probabilities
found from a bivariate normal distribution.
The bivariate normal distribution has:
Both means set to zero.
Both variances set to one.
Only the correlation can change.
The limits of integration are set by the
marginal probabilities of the binary items.

30
Wrapping Up
Item analysis is something that is as old as test theory.
This chapter served to demonstrate the types of information that could be attained from item and test statistics.
Such information is useful when constructing tests.

31
Next Time
Chapter 12 – Item Response Theory