Embed Size (px)
Citation preview

International Journal of Applied Engineering Research ISSN 0973-4562 Volume 13, Number 6 (2018) pp. 4219-4226
© Research India Publications. http://www.ripublication.com
4219
Classification and Detection of Plant Disease using Feature Extraction
Methods
Dr. Shaik Asif Hussain 1, Raza Hasan2, Dr. Shaik Javeed Hussain3
1Assistant Professor/ Middle East College, 2Senior Lecturer Middle East College, 3Assistant professor, Global college of Engineering, Muscat, Sultanate of Oman.
Abstract
Today scientific knowledge relentlessly bringing change and
comfort in day to day life. With this goal in mind plant disease
identification and management is projected in carried work to
prevent the plants from many diseases. Every country has
prominent place for agricultural productivity and hence it is
required to take care of plants for the sustainable growth of the
country. To detect plant diseases Image processing steps are
used to extract features from the images of plant leaves. The
images are classified to define the disease detected through
Graphical user interface (GUI) and it also calculates the
affected region and it is shown as percentage of disease
detection. The algorithms used are K-means clustering and
Support vector machine for comparison and percentage of
disease detection. The analysis of the work is carried through
objective values such as mean, Entropy, variance, kurtosis,
skewness, contrast and homogeneity. However contrast
enhancement is also done for low intensity images. The
resultant values are future enhanced with a hardware placed to
monitor the status and update the information in Internet of
things (IOT) for effective management of the plant disease
detection.
Keywords: clustering; Detection; Hardware; Feature;
extraction;
INTRODUCTION
The word disease is classified as Dis means reverse, negative
or opposite and ease means is to relieve pain or provide
comfort. A plant disease is an indication of harmful deviation
of abnormal functioning of physiological process. Usually it
can be clarified as malfunctioning in the process cycle. When
there is abnormality in the functioning the reproductive
structures of plant leaves is changed. There are many tragic
events related to the plant diseases happened in the history of
human life. The science of plant pathology defines the diseases
in plants cause damage in the leaves and yield into fungi by
taking the energy from the plants. There are many common
diseases from plants like blights, phytophthora blight, cankers,
rots, rusts, wilts these diseases provides symptoms to become
alert of malfunctioning. But if the problem persists then it
yields into Anthracnose, club root, Damping-off, downy
mildew, leaf blisters, molds, black spots, scabs and viruses.
One of the technique used in management of plant diseases is
integrated pest management techniques. The methods used to
control and manage the diseases is through identifying the
plant condition through visual manner. The pests and damage
can be monitored to describe the information through knowing
the defect from leaves and nutritional deficiency. The disease
cycle and pathogens are identified through the images
captured. These images are processed with clustering
techniques to define the affected region of the plants.
Graphical user interface (GUI) is designed through visually by
obtaining the result of affected region in the plant leaves. The
disease occurs over the time and instantly it results in injury of
plant. The process affects the plant functions through
physiological process and results in abnormal condition. The
symptoms are visible by detecting the changes in shape and
color. The signs of plant disease should be identified early for
avoiding various consequences later. The plant pathology was
identified by a scientist named Speerschneider in 1857 who
originated the disease on plant leaves.
LITERATURE SURVEY
There are four types of plant diseases which are classified as
Anthracnose, Alternaria Alternata, Bacterial Blight and
Cercospora leaf spot
A. Bacterial blight
Figure 1: Bacterial blight
The basic symptoms of the disease can be observed as leaves
become pale green and lesions in the leaves expand and appear
as dead spots. The elongation of lesions extent into the full
leaf and in between they can be seen as linear streaks. The
infections of the disease are severe and exudate as milky gray
at end of the leaf. The life cycle of Bacteria blight first spread
through soil and water and then through driven rains. These
bacteria occurs usually in winters and subsequently the
infections spread through the rain drops and also with contact
of insects. The wet weather and bacteria occurs at the
temperatures of 15-25 C. The emerging leaves are avoided by
infection bacteria due to warm and dry weather. The
agriculture productivity losses damage the yield to 10-15% by
this disease. The disease can be managed by using free seed

International Journal of Applied Engineering Research ISSN 0973-4562 Volume 13, Number 6 (2018) pp. 4219-4226
© Research India Publications. http://www.ripublication.com
4220
and rotating non grain crops. These management incidents will
somehow reduce the effect of this disease[6].
B. Anthracnose
Figure 2. Anthracnose
This disease is caused due to fungi in the genus
collectotrichum and happen in many species of plant. It
develops dark and soaked lesions on stems and fruits.
Harvesting with cleanliness and avoiding the rotted waste will
somehow will avoid this disease for few days. The disease
with fungus appears more in winters and continues the growth
of spores in the leaves for a temperature of 75-85 F. Usually
this disease spreads from plant to other in the form of insects,
rain and wind. The dead tissue in diseases appear more in
cankers and anthracnose. So the importance of horticulture is
important to avoid such causes. The organisms are fungi,
mycoplasms and virus reflects to various causes and affect to
major species [1]. Canker disease also affect unique species of
plants and cause endangered bactericides for a plant. Hence
there is a need to find the diseases in earlier stage to avoid
hazards in agricultural productivity.
C. Alternaria alternate
It is a fungus that is observed on the leaf spot and over 380
host species of plants. This disease appears in major parts of
the plants such as blights, rots and leaf spots. The infections
are so immune that it cause health effects on human life [4].
Hence there should be appropriate monitoring to the disease
for avoiding future consequences. The spores on the leaves are
due to asexual situations known as conidia. The lesions or
drying and they appear from 10 to 50 days if proper care is not
taken and it is also known as alternate.
Figure 3: Alternaria alternata
The disease cycle is triggered majorly due to rainfall and
humidity. But as the condition deteriorates the germination is
in night time and also penetrates from the top of the leaf. The
affected region in the leaf can be observed within 12 hours.
D. Conidiophore
Conidiophore is a disease that appears in the form of pale
brown to olive brown. This disease spread from 25-60 or 3-3-5
µm. These conditions are varied from straight or flexuous and
appear in the form of bushy heads arising from substrate.
These are very short and I ceiled for plant disease[3].
E. Cercospora leaf spot
Figure 4. Cercospora leaf spot
This disease is also a genus of fungi and these species do not
have a sexual stage and the genus is mycospharella. The
diseases leave spots on the plants and this appears in well-
known species and information is the best known of it. These
well-known diseases studied can be easily monitored and
verified through image processing. The images of plant leaves
are acquired and they are being processed to known the
disease for early prediction and treatment of diseases. Hence it
has been required now to give attention to the plant diseases
for better agriculture yield and productivity. Regular
inspection and monitoring of the crop avoids losses in the field
and better productivity [2].
Hence the productivity of the fruits from plants gives a good
income to the crop and also avoids any health hazards to
human life. It has been seen that there is a need to bridge the
gap between productivity of plant and diseases through
technological barriers. The details of plant diseases should be
known for pathology plants. The science today has been
increase to a stage where every details of diseases can be
found by doing a small search so hence this work gives a good
hand to help the society and human life for better yield in
future.
PROPOSED WORK
The Basic steps involved in for plant disease detection are
shown in the below process of detection and classification
using image processing is shown in Figure 5.

International Journal of Applied Engineering Research ISSN 0973-4562 Volume 13, Number 6 (2018) pp. 4219-4226
© Research India Publications. http://www.ripublication.com
4221
Figure 5. Basic steps for plant disease detection and
classification
A. Image Acquisition
The plant leaves are captured by using a camera and the form
of images are color images. The basic image colors are Red,
Green and Blue. The image transformation of RGB image is
device independent structure and can be converted in to any
domain for clarity of the image.
B. Image Pre-processing
Preprocessing techniques are used to remove noise and crop
the region selected. The region of interest in image is applied
with smoothening filter and thereby it is enhanced in to stretch
contrast. The enhancement in the image is carried out by the
conversion of RGB in to gray scale which is carried out by the
below equation.
f(x)=0.2989*R+0.5870*G+0.114.*B
Histogram equalization technique is used to equalize
the intensities and distribute the values in the function. The
enhancement of the images is carried out cumulatively over the
distributed intensity values.
C. Image Segmentation
The image is portioned in to various parts based on the
similarity. The segmentation methods used are otsu and k-
means clustering for each clusters of the similar image. Later
the image can be converted in to HIS model for signifying
each portion of the image
D. Boundary and spot detection algorithm
The HIS model of the image is used in segmenting the portion
of the image and spot is detected for the infected part. The 8-
connectivity of pixels are clustered for defined features with
number of classes of K. These features are classified by
minimizing the distance between corresponding cluster and
object.
Heuristic approach is done by defining the K cluster
and pick the value from the center or randomly.
The pixels in the image are calculated to find the
distance between cluster center and pixel.
The averaging of cluster center is computed from all
pixel values
Hence the steps are repeated again and again to obtain
the selected feature
E. Otsu Threshold Algorithm:
The gray level images and binary images are created using
thresholding. The threshold value starts with zero and reaches
one for binary images but for threshold it starts form zero to
two fifty five. The otsu’s algorithm used for thresholding is
defined in the following steps
Pixels are classified into two based on the threshold.
Mean of the cluster and means of square difference
is calculated
The obtained pixels are multiplied to one another to
define the cluster times.
The symptoms of the diseases are observed for changing
color of the leaf. The infected portion of the leaves are
classified based on the RGB imges. The otsu’s threshold is
observed and calculated based on the intensities and threshold
values.
F. Feature Extraction
The process of feature selection and extraction is very
important in this application as it relates with texture, color and
morphology. The disease can be detected and better result can
be observed with respect to the features. The detection of
disease is shown with color distribution in the image like
hardness and roughness in the texture of the image. This shows
the infected plant areas of the leaves.
G. Color co-occurrence Method
The texture and color are the unique features in this method
which can be classified for translation of RGB to HIS
…….….. (1)
…… (2)
……………………..….. (3)
The computation statistics are evaluated using SGDM matrix
and GLCM function and later can be used in objective analysis
of image processing.

International Journal of Applied Engineering Research ISSN 0973-4562 Volume 13, Number 6 (2018) pp. 4219-4226
© Research India Publications. http://www.ripublication.com
4222
H. Leaf color extraction using H and B components:
The images are enhanced with anistropic diffusion and defines
the effected region by separating the color from the
background. The B and H components of color space can also
use anisotropic diffusion for recognizing the colors in the leaf.
The methods are diffused in every region for representing each
cluster and identifying the disease pathology.
IMPLEMENTATION
A. GUI Development Environment
The GUI-Graphical user interface involves two basic tasks
such as
GUI components layout
GUI components programming
The layout tools are primarily set with preferences. These
files are called as M-files and initialization of this tasks are
launched back in to a framework to execute users and activate
the components of GUI.
Hence this GUI helps in easy interaction to the user and
changes can be easily reflected in implementing the tools.
B. GUI Implementation
The M-file works with the commands and layout can be
actively defined with files to save and launch in GUI in
interactive manner.
C. A FIG-file and M-File
The M-file an FIG- file is used with Ui control and axes and
the object properties are used to launch and control GUI. The
call backs are the functions used to work with M-file. The M-
file has a documentation and procedure to follow with steps.
The blocks of M-file has user controls and axes for
visualization of the results. The below figure shows the GUI is
implemented in the Matlab software with two illustrative
tasks.
Figure 6. Graphical user blocks
EXPERIMENTAL RESULTS
The results for the project is as follows
In a GUI there are 6 virtual buttons appeared on the screen for
Loading an image, Enhancing, Segmenting, Classification
result, Affected region, Accuracy.
1. The first step is loading an image as shown in figure 7
below
Figure 7. Load input image
The next step is enhancing an image, the image is enhanced by
pressing enhance button on the screen and the image is shown
in below figure 5.2
Figure 8. Enhance image
The next step is to segment an image, the segmentation is done
by using k-means clustering method. By pressing the segment
image button three clusters appear on the screen. We need to
select a cluster which is closely related to the original image.
The clusters formed are shown 9 below
International Journal of Applied Engineering Research ISSN 0973-4562 Volume 13, Number 6 (2018) pp. 4219-4226
© Research India Publications. http://www.ripublication.com
4223
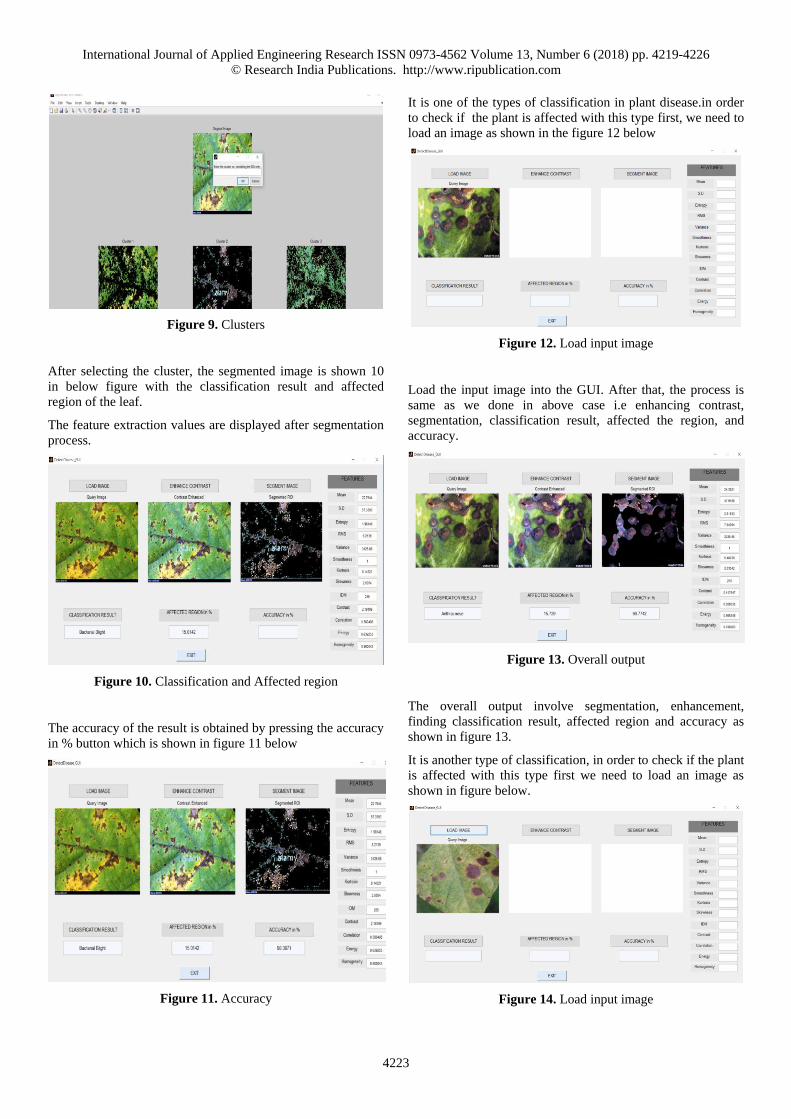
Figure 9. Clusters
After selecting the cluster, the segmented image is shown 10
in below figure with the classification result and affected
region of the leaf.
The feature extraction values are displayed after segmentation
process.
Figure 10. Classification and Affected region
The accuracy of the result is obtained by pressing the accuracy
in % button which is shown in figure 11 below
Figure 11. Accuracy
It is one of the types of classification in plant disease.in order
to check if the plant is affected with this type first, we need to
load an image as shown in the figure 12 below
Figure 12. Load input image
Load the input image into the GUI. After that, the process is
same as we done in above case i.e enhancing contrast,
segmentation, classification result, affected the region, and
accuracy.
Figure 13. Overall output
The overall output involve segmentation, enhancement,
finding classification result, affected region and accuracy as
shown in figure 13.
It is another type of classification, in order to check if the plant
is affected with this type first we need to load an image as
shown in figure below.
Figure 14. Load input image

International Journal of Applied Engineering Research ISSN 0973-4562 Volume 13, Number 6 (2018) pp. 4219-4226
© Research India Publications. http://www.ripublication.com
4224
Figure 15. Enhance contrast
For proper segmentation of an image, we need to select an
approximated cluster related to the original image and the
clusters for the image is shown as follows
Figure 16. Clusters
After cluster selection for an image, the segmented Image is
appeared as below
Figure 17. Segment image
For classification result, we need to click on classification
result virtual button then it shows about the classification of
the plant disease which is shown below.
Figure 18. Classification result and affected region
After that for accuracy calculation click on virtual button
accuracy in % then it shows how much accuracy the result
obtained.
Figure 19. Accuracy
It is another type of classification, in order to check if the plant
is affected with this type first we need to load an image as
shown in figure below
Figure 20 load image
International Journal of Applied Engineering Research ISSN 0973-4562 Volume 13, Number 6 (2018) pp. 4219-4226
© Research India Publications. http://www.ripublication.com
4225
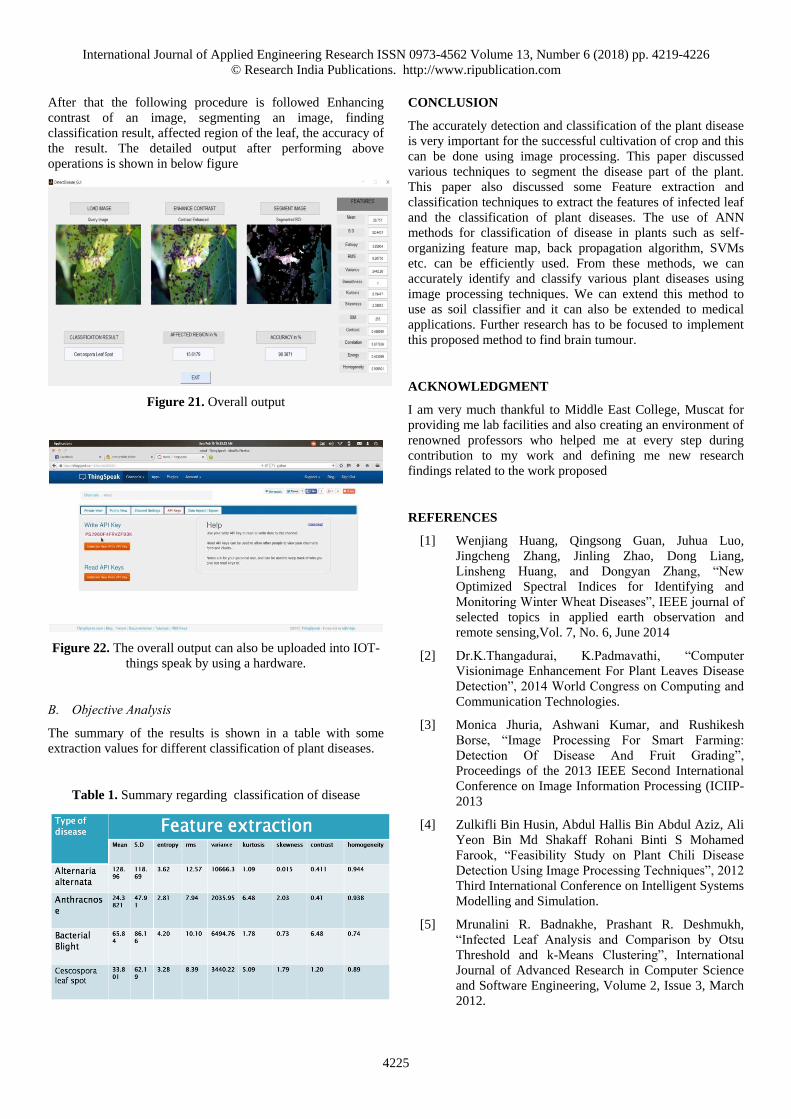
After that the following procedure is followed Enhancing
contrast of an image, segmenting an image, finding
classification result, affected region of the leaf, the accuracy of
the result. The detailed output after performing above
operations is shown in below figure
Figure 21. Overall output
Figure 22. The overall output can also be uploaded into IOT-
things speak by using a hardware.
B. Objective Analysis
The summary of the results is shown in a table with some
extraction values for different classification of plant diseases.
Table 1. Summary regarding classification of disease
CONCLUSION
The accurately detection and classification of the plant disease
is very important for the successful cultivation of crop and this
can be done using image processing. This paper discussed
various techniques to segment the disease part of the plant.
This paper also discussed some Feature extraction and
classification techniques to extract the features of infected leaf
and the classification of plant diseases. The use of ANN
methods for classification of disease in plants such as self-
organizing feature map, back propagation algorithm, SVMs
etc. can be efficiently used. From these methods, we can
accurately identify and classify various plant diseases using
image processing techniques. We can extend this method to
use as soil classifier and it can also be extended to medical
applications. Further research has to be focused to implement
this proposed method to find brain tumour.
ACKNOWLEDGMENT
I am very much thankful to Middle East College, Muscat for
providing me lab facilities and also creating an environment of
renowned professors who helped me at every step during
contribution to my work and defining me new research
findings related to the work proposed
REFERENCES
[1] Wenjiang Huang, Qingsong Guan, Juhua Luo,
Jingcheng Zhang, Jinling Zhao, Dong Liang,
Linsheng Huang, and Dongyan Zhang, “New
Optimized Spectral Indices for Identifying and
Monitoring Winter Wheat Diseases”, IEEE journal of
selected topics in applied earth observation and
remote sensing,Vol. 7, No. 6, June 2014
[2] Dr.K.Thangadurai, K.Padmavathi, “Computer
Visionimage Enhancement For Plant Leaves Disease
Detection”, 2014 World Congress on Computing and
Communication Technologies.
[3] Monica Jhuria, Ashwani Kumar, and Rushikesh
Borse, “Image Processing For Smart Farming:
Detection Of Disease And Fruit Grading”,
Proceedings of the 2013 IEEE Second International
Conference on Image Information Processing (ICIIP-
2013
[4] Zulkifli Bin Husin, Abdul Hallis Bin Abdul Aziz, Ali
Yeon Bin Md Shakaff Rohani Binti S Mohamed
Farook, “Feasibility Study on Plant Chili Disease
Detection Using Image Processing Techniques”, 2012
Third International Conference on Intelligent Systems
Modelling and Simulation.
[5] Mrunalini R. Badnakhe, Prashant R. Deshmukh,
“Infected Leaf Analysis and Comparison by Otsu
Threshold and k-Means Clustering”, International
Journal of Advanced Research in Computer Science
and Software Engineering, Volume 2, Issue 3, March
2012.

International Journal of Applied Engineering Research ISSN 0973-4562 Volume 13, Number 6 (2018) pp. 4219-4226
© Research India Publications. http://www.ripublication.com
4226
[6] H. Al-Hiary, S. Bani-Ahmad, M. Reyalat, M. Braik
and Z. ALRahamneh, “Fast and Accurate Detection
and Classification of Plant Diseases”, International
Journal of Computer Applications (0975 –
8887)Volume 17– No.1, March 2011
[7] Chunxia Zhang, Xiuqing Wang, Xudong Li, “Design
of Monitoring and Control Plant Disease System
Based on DSP&FPGA”, 2010 Second International
Conference on Networks Security, Wireless
Communications and Trusted Computing.
[8] A.Meunkaewjinda,P. Kumsawat, K. Attakitmongcol
and A. Srikaew, “Grape leaf disease detection from
color imagery using hybrid intelligent system”,
Proceedings of ECTI-CON 2008.