Embed Size (px)
Citation preview
PCF XXX PRODUCT NAME | VERSION 1.0 | 25 SEPTEMBER 2013 | 5124654
[Scheme Name] [Scheme Number TR100xx]
1.3 Introduction to the Application APFP Regulation 5(2)(q)
Planning Act 2008
Infrastructure Planning (Applications: Prescribed Forms and Procedure)
Regulations 2009
Volume [x]
[M th/ ]
Regulation 5(2)(a)
Planning Act 2008
Infrastructure Planning (Applications: Prescribed Forms and Procedure) Regulations 2009
January 2019
M42 Junction 6 Improvement Scheme Number TR010027
Volume 6 6.3 Environmental Statement
Appendix 10.2 Agricultural Land Classification and Impact Assessment
M42 Junction 6 Improvement Environmental Statement
Planning Inspectorate Scheme Ref: TR010027 Application Document Ref: TR010027/APP/6.3
Infrastructure Planning
Planning Act 2008
The Infrastructure Planning (Applications: Prescribed Forms and Procedure) Regulations 2009
M42 Junction 6 ImprovementDevelopment Consent Order 202[ ]
6.3 Environmental Statement
Appendix 10.2 Agricultural Land Classification and Impact Assessment
Regulation Number Regulation 5(2)(a) Planning Inspectorate Scheme Reference
TR010027
Application Document Reference 6.3 Author M42 Junction 6 Improvement Project Team and
Highways England
Version Date Status of Version 1 January 2019 DCO Application

Soil Environment Services Ltd
AGRICULTURAL LAND CLASSIFICATION AND IMPACT
ASSESSMENT
AECOM
M42
Junction 6
Soil Environment Services Ltd
October 2018
Our Ref: SES/A/M42J6/#1 Date: 26th October 2018
Client:
AECOM
2 City Walk
Leeds
LS11 9AR
AGRICULTURAL LAND CLASSIFICATION AND IMPACT
ASSESSMENT
M42
Junction 6
A report prepared on behalf of Soil Environment Services by:
Rebecca Jordan BSc (Hons) MEnv
Environmental Consultant
Approved by:
Dr Robin S Davies BSc PhD MISoilSci
Managing Director
This report has been prepared by Soil Environment Services with
all reasonable skill, care and diligence, within the terms of The
Contract with The Client. The report is the property of The Client who can assign this report to any third party who will then be
afforded the same assurances as detailed within the terms of the
original Contract with The Client.
Soil Environment Services Agricultural Land Classification, Contaminated Land Risk Assessment, Mineral Extraction Soil PlanningUnit 8, Stocksfield Hall, Stocksfield, Northumberland, NE43 7TN
Tel: 01661 844 827, Email: [email protected]
www.soilenvironmentservices.co.uk
CONTENTS
Page
1. INTRODUCTION 4
2. METHODOLOGY 5
3. BASELINE CONDITIONS 6
3.1. Climate and flooding 6
3.2. Soils, geology and topography 8
4. FIELDWORK RESULTS 10
4.1. Description of soil types 10
4.2. Field study photographs 11
4.3. In-field wetness class assessment 12
5. AGRICULTURAL LAND CLASSIFICATION (ALC) 13
5.1. National 1:250 000 map ALC grading 13
5.2. Current ALC grading 13
6. IMPACT ASSESSMENT 14
6.1. Agricultural Land Significance Criteria 14
6.2. Soil Resources Significance Criteria 16
6.3. Assessment of Effects 16
6.4. Conclusion 18
DRAWINGS
ALC/1 ALC Grade and Borehole Locations
APPENDIX A Climatological data for agricultural land classification
APPENDIX B Survey profile data sheet
INFORMATION SOURCES

AECOM Agricultural Land Classification M42, Junction 6
Soil Environment Services Page 4 26/10/2018
1. INTRODUCTION
An Agricultural Land Classification Study (ALC)1,2 has been carried out on a maximum general
area of 125.1 ha of land adjacent to the M42 which is proposed to be developed as part of the
Junction 6 project (Drawing ALC/1). The area surveyed is positioned around the existing M42
and is centred on OS Grid Ref. 419454, 281640.
Agricultural land is classified into the following grades according to the 1988 guidelines1 and
the 1996 draft guidelines2:
Grade Description
1 Excellent quality agricultural land with no or very minor limitations to
agricultural use.
2 Very good quality agricultural land with minor limitations which affect crop
yield, cultivation or harvesting.
3a
3b
Good quality agricultural land capable of producing moderate to high yields
of a narrow range of arable crops or moderate yields of a wider range of crops.
Moderate quality agricultural land capable of producing moderate yields of a
narrow range of crops or lower yields of a wider range of crops.
4 Poor quality agricultural land with severe limitations which significantly
restrict the range of crops and/or level of yields.
5
Very poor quality agricultural land with very severe limitations which restrict
use to permanent pasture or rough grazing, except for occasional pioneer forage
crops.
The survey was conducted on the 9th and 10th October 2018 and classifies the land into one or
more of the above grades.
On the survey date the majority of the fields were in rough pasture. Fields on the south of the
site were in an arable crop.
AECOM Agricultural Land Classification M42, Junction 6
Soil Environment Services Page 5 26/10/2018
2. METHODOLOGY
The classification includes an initial desktop investigation to examine previously mapped soil
types and to note the drift and solid geology. This included consultation from:
Soil Survey of England and Wales 1:250 000
British Geological Survey 1:50 000 solid and drift map.
The field survey consisted of a number of hand auger borings to a depth of 1.2 m (where possible)
to examine soil profiles, using standard soil survey methods3. Pit excavations were conducted to
determine sub soil structure where necessary. This data was used to map the principal soil types
for determining the ALC. The soil removed during augering and pit excavations was examined
in accordance with:
Soil Survey Field Handbook
Describing and Sampling Soil Profiles
Soil Survey of England and Wales, Technical Monograph No. 5, 1976
Soil Classification for Soil Survey
Monographs on Soil Survey
Butler, B E (1980) Clarendon Press, Oxford
Climatological data4 was used to determine the overriding site limitation and for interaction with
soil parameters (Appendix A). The above information was cross referenced with geological
surveys8, previous soil surveys and the national 1:250 000 series ALC survey7 relevant for this
site to substantiate the findings. The ALC grade was then determined for this site and for the
current survey and is detailed on Drawing ALC/2.
Other factors used for ALC grading, but which give no limitation at this site, are not discussed.
AECOM Agricultural Land Classification M42, Junction 6
Soil Environment Services Page 6 26/10/2018
3. BASELINE CONDITIONS
3.1. Climate and flooding
The climatological data (Table 1a) indicates average temperature, average rainfall and an
average number of field capacity days for the region.
Table 1a
Climatological information4
Factor Units Value
Altitude AOD m 102
Accumulated temperature dayC (Jan-June) 1371.6
Average Annual Rainfall mm 703.8
Field Capacity Days days 165.0
Moisture Deficit Wheat mm 96.2
Moisture Deficit Potatoes mm 84.5
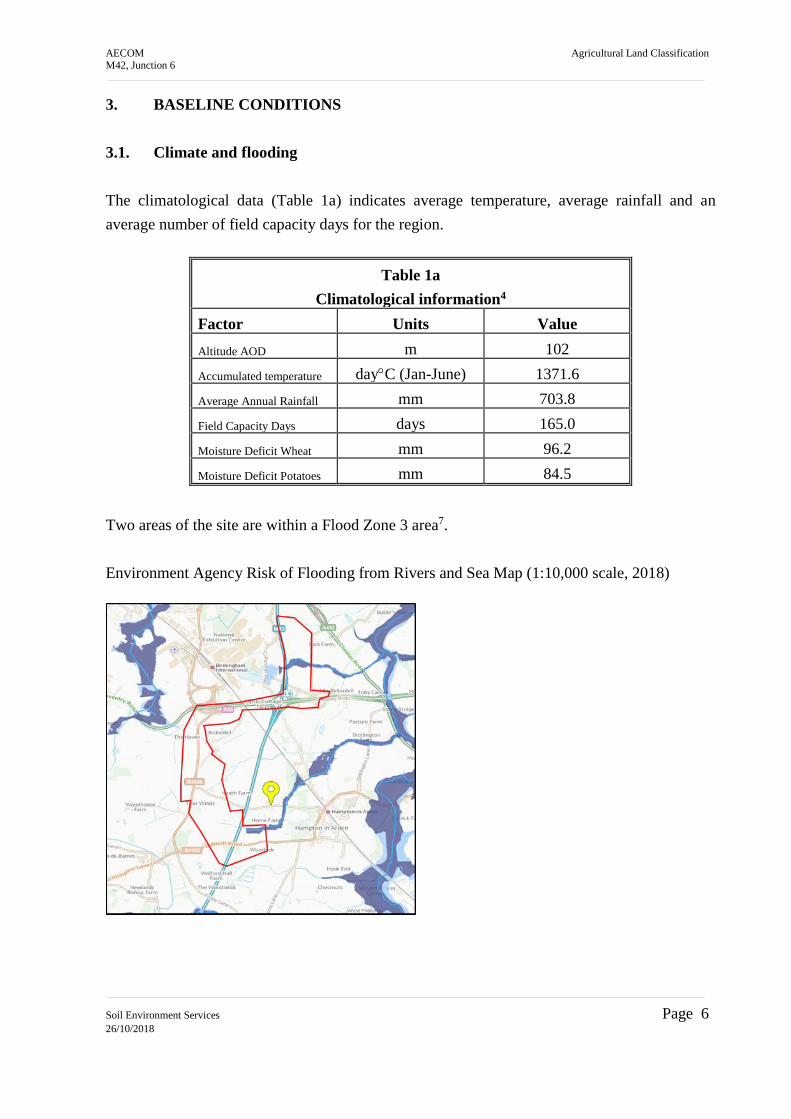
Two areas of the site are within a Flood Zone 3 area7.
Environment Agency Risk of Flooding from Rivers and Sea Map (1:10,000 scale, 2018)
AECOM Agricultural Land Classification M42, Junction 6
Soil Environment Services Page 7 26/10/2018
For the purpose of this report, the terms used by the Environment Agency to categorise flood
risk have been changed to match terms used by MAFF. This is to allow an agricultural
classification grade to be determined for the site based on flood risk. The classifications have
been found to correspond as follows:
- Environment Agency Zone 3a High Probability – MAFF Frequent
- Environment Agency Zone 3b Functional Floodplain – MAFF Frequent
- Environment Agency Zone 2 Medium Probability – MAFF Occasional
- Environment Agency Zone 1 Low Probability – MAFF Rare to Very Rare
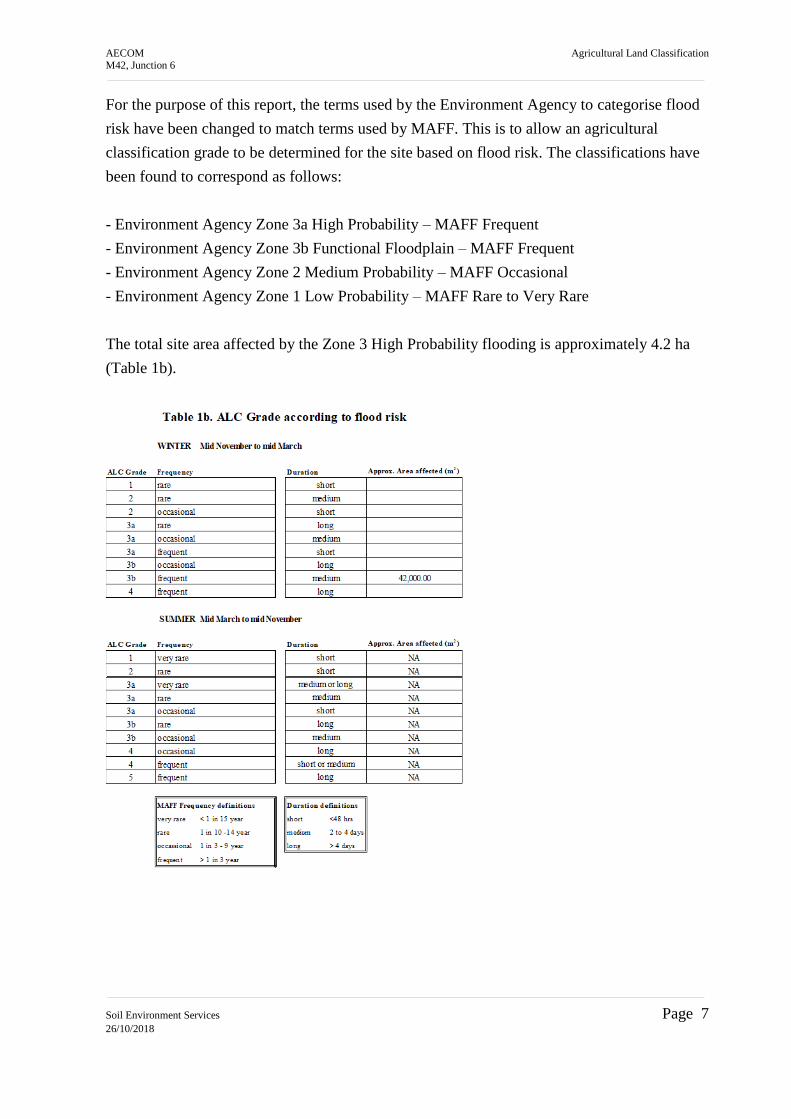
The total site area affected by the Zone 3 High Probability flooding is approximately 4.2 ha
(Table 1b).
AECOM Agricultural Land Classification M42, Junction 6
Soil Environment Services Page 8 26/10/2018
3.2. Soils, geology and topography
3.2.1. Soils
The site has previously been mapped as having soils of the Rockhurst 1 association4, 5.
Two general soil types were noted for the purposes of ALC grading.
This study has identified the soils to be:
1. Disturbed medium clay loams over mudstone at an average depth of 60 cm bgl.
2. Clay loam over clay to depth.
3.2.2. Geology8
Superficial Geology
Majority of site
None recorded.
Band to the south and north
1:50 000 scale superficial deposits description: Alluvium - Clay, Silt, Sand And Gravel.
Superficial Deposits formed up to 2 million years ago in the Quaternary Period. Local
environment previously dominated by rivers (U).
Pockets across the site
1:50 000 scale superficial deposits description: Glaciofluvial Deposits, Mid Pleistocene -
Sand And Gravel. Superficial Deposits formed up to 2 million years ago in the Quaternary
Period. Local environment previously dominated by ice age conditions (UGF).
Bedrock Geology
South and centre
1:50 000 scale bedrock geology description: Sidmouth Mudstone Formation - Mudstone.
Sedimentary Bedrock formed approximately 228 to 250 million years ago in the Triassic
Period. Local environment previously dominated by hot deserts.

AECOM Agricultural Land Classification M42, Junction 6
Soil Environment Services Page 9 26/10/2018
North
1:50 000 scale bedrock geology description: Branscombe Mudstone Formation - Mudstone.
Sedimentary Bedrock formed approximately 201 to 228 million years ago in the Triassic
Period. Local environment previously dominated by hot deserts.
Band towards north
1:50 000 scale bedrock geology description: Arden Sandstone Formation - Sandstone,
Siltstone And Mudstone. Sedimentary Bedrock formed approximately 228 to 237 million years
ago in the Triassic Period. Local environment previously dominated by rivers.
3.2.3. Topography
The site has little to no slope and hence gradient will not limit the ALC Grade across the site.

AECOM Agricultural Land Classification M42, Junction 6
Soil Environment Services Page 10 26/10/2018
4. FIELDWORK RESULTS
4.1. Descriptions of soil types
The soils across the site were disturbed medium clay loams over mudstone at an average depth
of 60 cm bgl or clay loam over clay to depth. (Table 2). Full profile data is listed in Appendix
B.
A summary of the features of the soil type/s are listed in Table 2.
Table 2. Soil Type descriptions
Profile
Description
Soil types
Type 1 (Disturbed) Type 2 Type 3
Horizon 1
(topsoil)
0-35 cm
Dark brown (10YR 3/3) slightly
stony medium clay loam, few fine
ochreous mottles; weak medium
subangular blocky structure.
Some brick, coal, tile and stone
pieces were encountered.
0-50 cm
Dark brown (10YR 3/3)
slightly stony clay loam, no
mottles; weak medium
subangular blocky structure.
Horizon 2
(subsoil 1)
35-55 cm
Brown (7.5YR 4/4) moderately
stony clay loam, few medium
ochreous and greyish mottles;
weak coarse angular blocky
structure.
50-120 cm
Dark yellowish brown (10YR
4/4) slightly stony clay, few
fine ochreous mottles; weak
medium angular blocky
structure.
Horizon 3
(subsoil 2)
55 cm
Strong brown (7.5YR 5/6) bedded
mudstone, fine angular blocky
rock structure.
Survey points (Drawing ALC/1) and soil types:
BHs/ TPs
Type 1 soil = 4, 5, 8, 10, 11, 14, 18, 19, 20, 21, 23, 25, 29, 31, 35, 36, 37, 38, 39, 40, 41, 42, 43
Type 2 soil =1, 2, 3, 6, 7, 9, 12, 13, 15, 16
Not surveyed – 17, 22, 24, 26, 27, 28, 30, 32, 33, 34
Notes:
AECOM Agricultural Land Classification M42, Junction 6
Soil Environment Services Page 11 26/10/2018
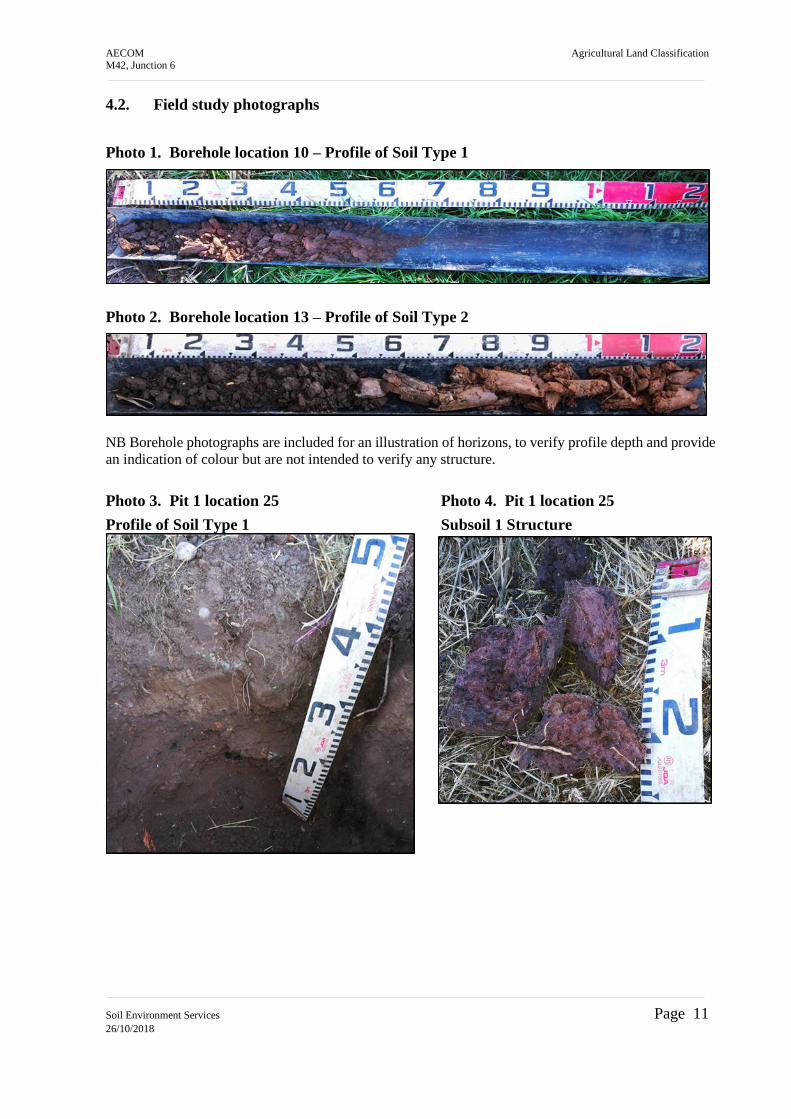
4.2. Field study photographs
Photo 1. Borehole location 10 – Profile of Soil Type 1
Photo 2. Borehole location 13 – Profile of Soil Type 2
NB Borehole photographs are included for an illustration of horizons, to verify profile depth and provide
an indication of colour but are not intended to verify any structure.
Photo 3. Pit 1 location 25 Photo 4. Pit 1 location 25
Profile of Soil Type 1 Subsoil 1 Structure
AECOM Agricultural Land Classification M42, Junction 6
Soil Environment Services Page 12 26/10/2018
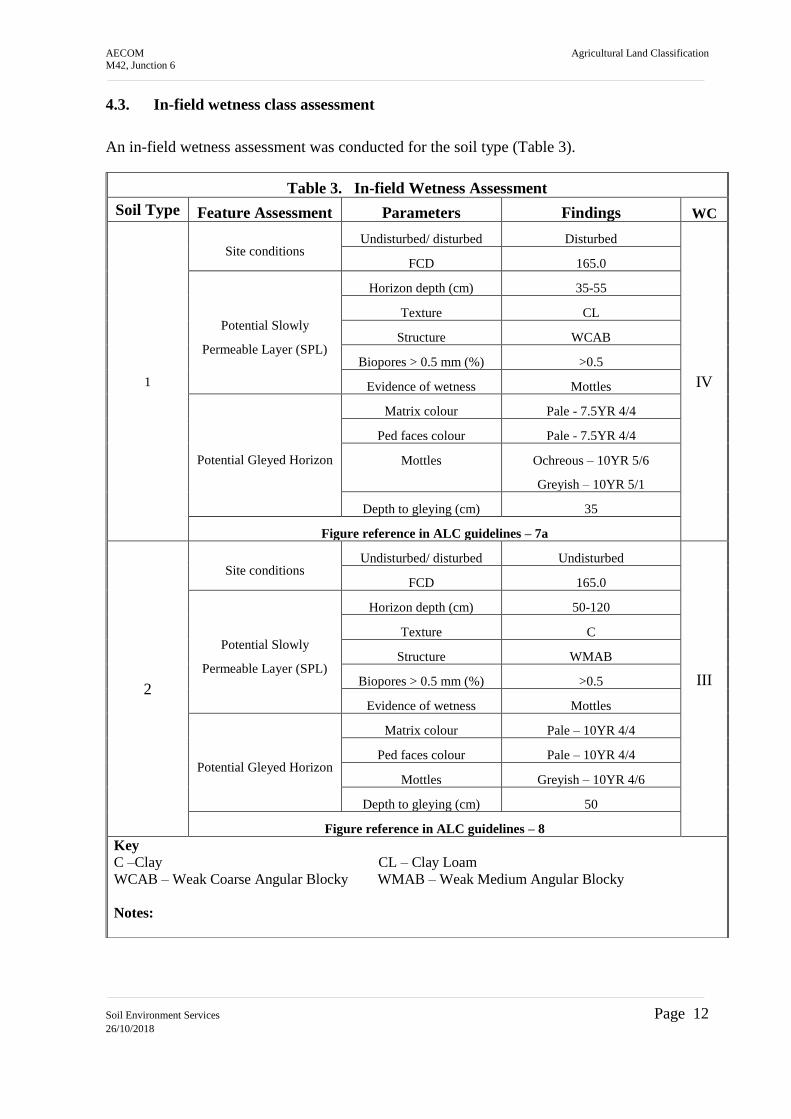
4.3. In-field wetness class assessment
An in-field wetness assessment was conducted for the soil type (Table 3).
Table 3. In-field Wetness Assessment
Soil Type Feature Assessment Parameters Findings WC
1
Site conditions Undisturbed/ disturbed Disturbed
IV
FCD 165.0
Potential Slowly
Permeable Layer (SPL)
Horizon depth (cm) 35-55
Texture CL
Structure WCAB
Biopores > 0.5 mm (%) >0.5
Evidence of wetness Mottles
Potential Gleyed Horizon
Matrix colour Pale - 7.5YR 4/4
Ped faces colour Pale - 7.5YR 4/4
Mottles Ochreous – 10YR 5/6
Greyish – 10YR 5/1
Depth to gleying (cm) 35
Figure reference in ALC guidelines – 7a
2
Site conditions Undisturbed/ disturbed Undisturbed
III
FCD 165.0
Potential Slowly
Permeable Layer (SPL)
Horizon depth (cm) 50-120
Texture C
Structure WMAB
Biopores > 0.5 mm (%) >0.5
Evidence of wetness Mottles
Potential Gleyed Horizon
Matrix colour Pale – 10YR 4/4
Ped faces colour Pale – 10YR 4/4
Mottles Greyish – 10YR 4/6
Depth to gleying (cm) 50
Figure reference in ALC guidelines – 8
Key
C –Clay CL – Clay Loam
WCAB – Weak Coarse Angular Blocky WMAB – Weak Medium Angular Blocky
Notes:

AECOM Agricultural Land Classification M42, Junction 6
Soil Environment Services Page 13 26/10/2018
5. AGRICULTURAL LAND CLASSIFICATION
5.1. National 1:250 000 map grading
Grading on the MAFF (1983) 1: 250 000 map6 indicated ALC Grade 2 across the site, with
areas of Grade 3 mapped to the south.
5.2. Current grading
This survey has resulted in an Agricultural Land Classification of the following grades (Drawing
ALC/1):
*Area is maximum general area calculated form the boreholes undertaken on site (Drawings
ALC/1 and ALC/2)
Type 1 soils –Wetness limitation
The combination of the topsoil texture (disturbed medium clay loam), Wetness Class (IV) and
the number of Field Capacity Days (165.0) results in ALC Grade 3b for Type 1 soils.
Type 2 soils –Wetness limitation
The combination of the topsoil texture (medium clay loam), Wetness Class (IV) and the number
of Field Capacity Days (165.0) results in ALC Grade 3b for Type 2 soils.
Site – Flood Risk
A Zone 3 High Probability of flooding is mapped on 4.2 ha of land resulting in ALC Grade 3b
within the Flood Risk area.
Table 4. ALC gradings and limitations
Grade Area (ha)* Limitation
1
2
3a 21.4 Type 2 soils – Wetness
3b 77.8
4.2
Type 1 soils – Wetness
Site – Flood Risk
4
5
Unsurveyed land 21.7 No access was available on site dates
AECOM Agricultural Land Classification M42, Junction 6
Soil Environment Services Page 14 26/10/2018
6. IMPACT ASSESSMENT
6.1. Agricultural Land Significance Criteria
There is no nationally agreed methodology for determining the effects of a development on the
loss of agricultural land or soils. The approach outlined below has therefore been developed
through the preparation of other Environmental Statements, having regard to guidance
available9, 10.
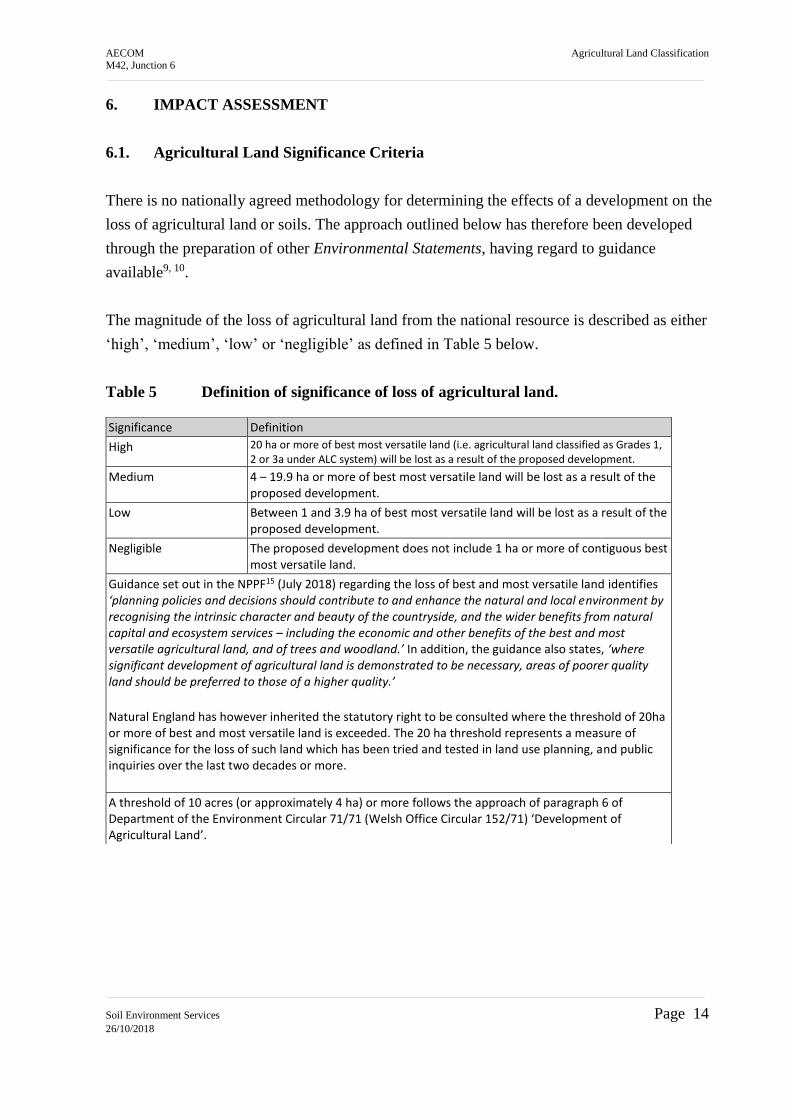
The magnitude of the loss of agricultural land from the national resource is described as either
‘high’, ‘medium’, ‘low’ or ‘negligible’ as defined in Table 5 below.
Table 5 Definition of significance of loss of agricultural land.
Significance Definition
High 20 ha or more of best most versatile land (i.e. agricultural land classified as Grades 1, 2 or 3a under ALC system) will be lost as a result of the proposed development.
Medium 4 – 19.9 ha or more of best most versatile land will be lost as a result of the proposed development.
Low Between 1 and 3.9 ha of best most versatile land will be lost as a result of the proposed development.
Negligible The proposed development does not include 1 ha or more of contiguous best most versatile land.
Guidance set out in the NPPF15 (July 2018) regarding the loss of best and most versatile land identifies ‘planning policies and decisions should contribute to and enhance the natural and local environment by recognising the intrinsic character and beauty of the countryside, and the wider benefits from natural capital and ecosystem services – including the economic and other benefits of the best and most versatile agricultural land, and of trees and woodland.’ In addition, the guidance also states, ‘where significant development of agricultural land is demonstrated to be necessary, areas of poorer quality land should be preferred to those of a higher quality.’
Natural England has however inherited the statutory right to be consulted where the threshold of 20ha or more of best and most versatile land is exceeded. The 20 ha threshold represents a measure of significance for the loss of such land which has been tried and tested in land use planning, and public inquiries over the last two decades or more.
A threshold of 10 acres (or approximately 4 ha) or more follows the approach of paragraph 6 of Department of the Environment Circular 71/71 (Welsh Office Circular 152/71) ‘Development of Agricultural Land’.
AECOM Agricultural Land Classification M42, Junction 6
Soil Environment Services Page 15 26/10/2018
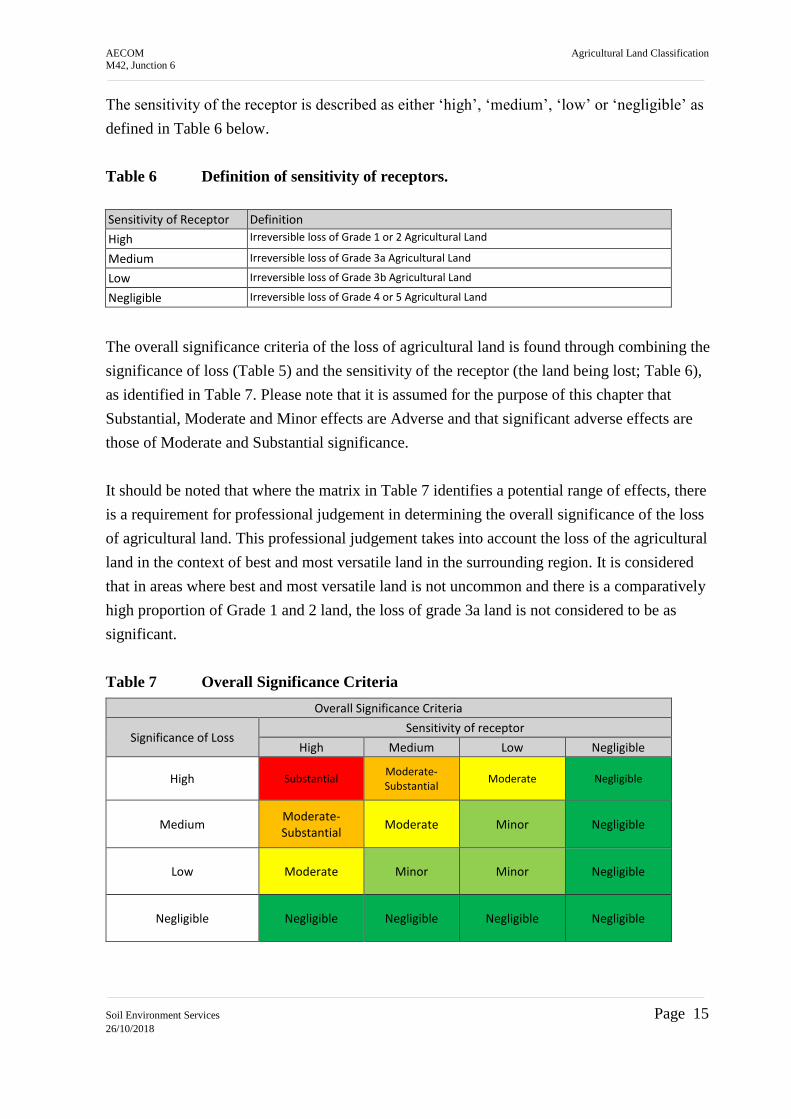
The sensitivity of the receptor is described as either ‘high’, ‘medium’, ‘low’ or ‘negligible’ as
defined in Table 6 below.
Table 6 Definition of sensitivity of receptors.
Sensitivity of Receptor Definition
High Irreversible loss of Grade 1 or 2 Agricultural Land
Medium Irreversible loss of Grade 3a Agricultural Land
Low Irreversible loss of Grade 3b Agricultural Land
Negligible Irreversible loss of Grade 4 or 5 Agricultural Land
The overall significance criteria of the loss of agricultural land is found through combining the
significance of loss (Table 5) and the sensitivity of the receptor (the land being lost; Table 6),
as identified in Table 7. Please note that it is assumed for the purpose of this chapter that
Substantial, Moderate and Minor effects are Adverse and that significant adverse effects are
those of Moderate and Substantial significance.
It should be noted that where the matrix in Table 7 identifies a potential range of effects, there
is a requirement for professional judgement in determining the overall significance of the loss
of agricultural land. This professional judgement takes into account the loss of the agricultural
land in the context of best and most versatile land in the surrounding region. It is considered
that in areas where best and most versatile land is not uncommon and there is a comparatively
high proportion of Grade 1 and 2 land, the loss of grade 3a land is not considered to be as
significant.
Table 7 Overall Significance Criteria
Overall Significance Criteria
Significance of Loss Sensitivity of receptor
High Medium Low Negligible
High Substantial Moderate-Substantial
Moderate Negligible
Medium Moderate-Substantial
Moderate Minor Negligible
Low Moderate Minor Minor Negligible
Negligible Negligible Negligible Negligible Negligible
AECOM Agricultural Land Classification M42, Junction 6
Soil Environment Services Page 16 26/10/2018
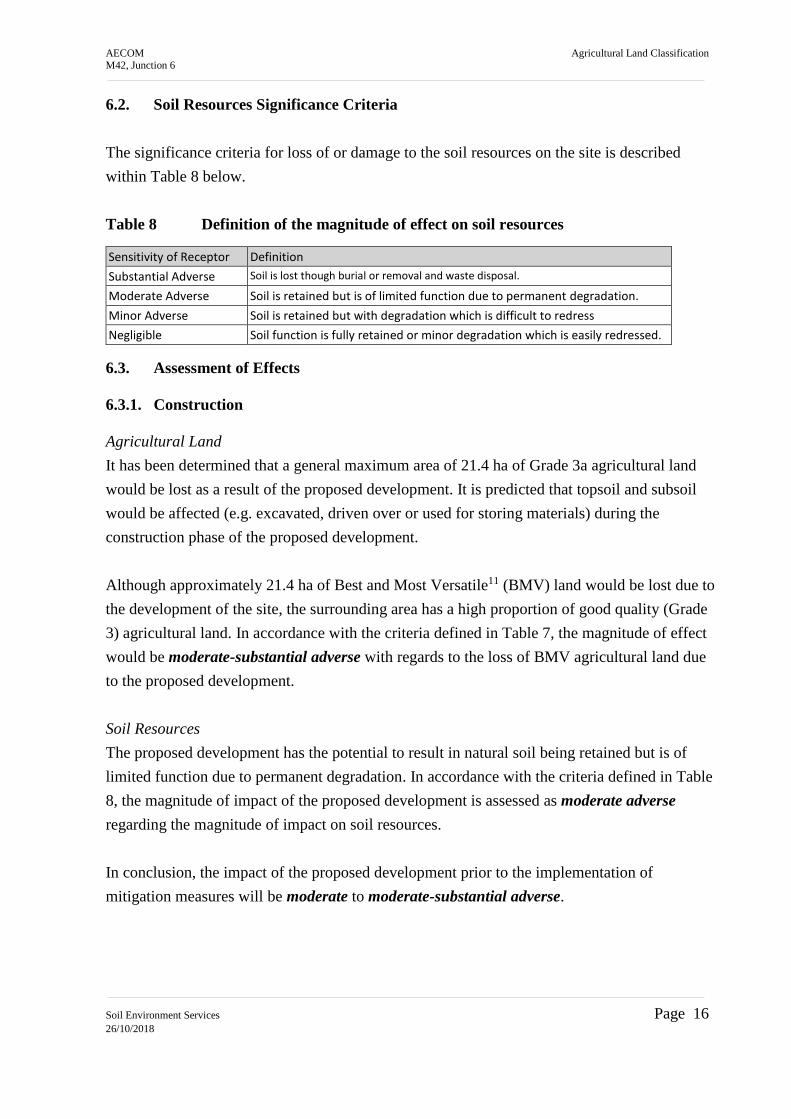
6.2. Soil Resources Significance Criteria
The significance criteria for loss of or damage to the soil resources on the site is described
within Table 8 below.
Table 8 Definition of the magnitude of effect on soil resources
6.3. Assessment of Effects
6.3.1. Construction
Agricultural Land
It has been determined that a general maximum area of 21.4 ha of Grade 3a agricultural land
would be lost as a result of the proposed development. It is predicted that topsoil and subsoil
would be affected (e.g. excavated, driven over or used for storing materials) during the
construction phase of the proposed development.
Although approximately 21.4 ha of Best and Most Versatile11 (BMV) land would be lost due to
the development of the site, the surrounding area has a high proportion of good quality (Grade
3) agricultural land. In accordance with the criteria defined in Table 7, the magnitude of effect
would be moderate-substantial adverse with regards to the loss of BMV agricultural land due
to the proposed development.
Soil Resources
The proposed development has the potential to result in natural soil being retained but is of
limited function due to permanent degradation. In accordance with the criteria defined in Table
8, the magnitude of impact of the proposed development is assessed as moderate adverse
regarding the magnitude of impact on soil resources.
In conclusion, the impact of the proposed development prior to the implementation of
mitigation measures will be moderate to moderate-substantial adverse.
Sensitivity of Receptor Definition
Substantial Adverse Soil is lost though burial or removal and waste disposal.
Moderate Adverse Soil is retained but is of limited function due to permanent degradation.
Minor Adverse Soil is retained but with degradation which is difficult to redress
Negligible Soil function is fully retained or minor degradation which is easily redressed.
AECOM Agricultural Land Classification M42, Junction 6
Soil Environment Services Page 17 26/10/2018
6.3.2. Operational Phase
Agricultural Land
Some agricultural land would be lost during the construction phase of the proposed
development. As such there will be no further effects on the agricultural land during the
operation of the development.
Soil Resources
The effect on soil resources will be moderate adverse during the operational period, as
although soil is retained on the site it is of limited function due to permanent degradation
caused by the soil movement operations (heavy machinery causing compaction and removal of
soil structure).
6.3.3 Mitigation
Agricultural Land
The development will result in the permanent loss of some agricultural land and therefore no
further mitigation is possible.
Soil Resources
The potential damage to soil resources during excavation requires that appropriate soil
handling strategies are employed as mitigation12, 13.
The soil over the site is likely to be of ‘multi-purpose’ grade in terms of BS388210 (subject to
appropriate laboratory certification). In such cases, it could be suitable for re-use on other
projects and for a landscaping scheme, for example, provided it is handled appropriately.
The quality and quantity of soil within the site should be maintained by implementing
appropriate techniques for stripping, storing and re-use12, 13, 14. This approach should be
adopted in a Soil Management Strategy (SMS) to be prepared as part of the proposed
development. This is consistent with the findings and recommendations of recent research
carried out on behalf of DEFRA14, including the development of a code of practice.

AECOM Agricultural Land Classification M42, Junction 6
Soil Environment Services Page 18 26/10/2018
6.3.4. Residual Effects
Agricultural Land
The development will result in the permanent loss of some agricultural land and therefore no
further mitigation is possible.
Soil Resource
The Soil Management Strategy will ensure that any areas of soil remaining on the site will be
adequately managed. The residual effect on soil resource during the operation phase is
therefore negligible.
6.4. Conclusion
The loss of a general maximum area of 21.4 ha of BMV agricultural land as part of this
proposed development is identified as a moderate-substantial adverse effect. However, the site
is positioned within an area abundant with BMV land, therefore the effect of the loss of this
area of Grade 3a land, will be of a lesser effect in comparison to other areas not surrounded by
BMV land.
The magnitude of effect on soil resources has been identified as moderate adverse, however with
the implementation of a suitable SMS the residual effects of the proposed development on soil
resources are of negligible significance.
DRAWING ALC/1
Soil Types and Sample Locations
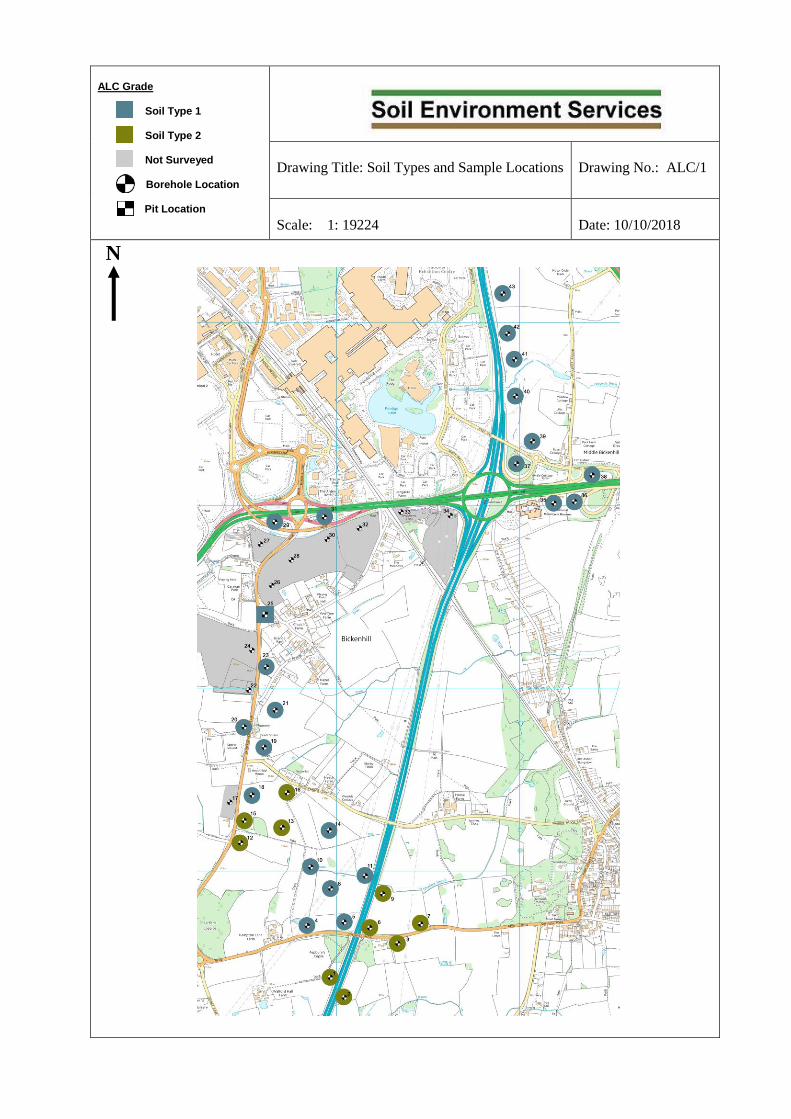
ALC Grade Soil Type 1 Soil Type 2 Not Surveyed
Borehole Location Pit Location
Drawing Title: Soil Types and Sample Locations
Drawing No.: ALC/1
Scale: 1: 19224
Date: 10/10/2018
N
DRAWING ALC/2
ALC Grade

ALC Grade
Good quality – 3a
Moderate quality – 3b
Not Surveyed
Borehole Location Pit Location
Drawing Title: ALC Grade
Drawing No.: ALC/2
Scale: 1: 19224
Date: 10/10/2018
N

APPENDIX A
Climatological data for
Agricultural Land Classification
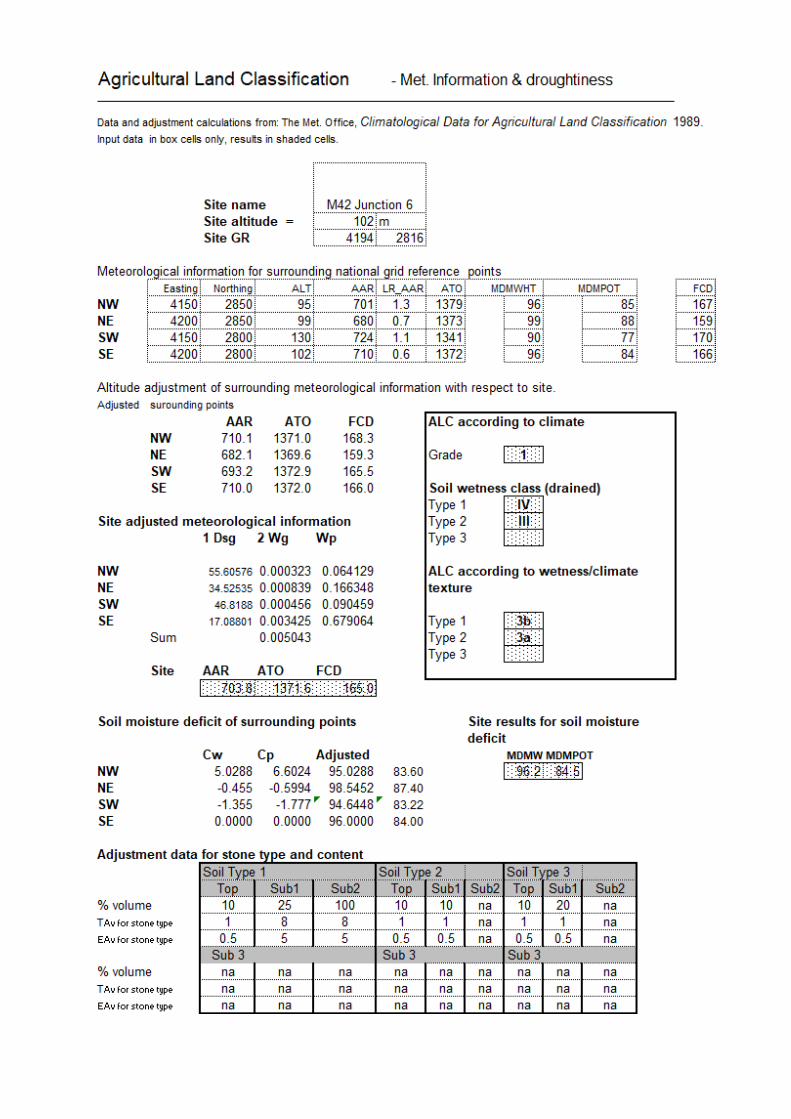

Droughtiness (moisture balance) determination for each soil type and restored profile
Moisture availability data for each texture from MAFF ALC Guidelines 1988
Moisture Balance (MB) = AP - MD for wheat and potatoes (adjusted for stones)
Type 1 Type 2 Type 3
Horizon texture w ater texture w ater texture w ater
TAvt - Topsoil w ater available (mm) CL 16.30 CL 16.30 0 0.00
LTt - Topsoil thickness (cm) 0 35.00 0 30.00 0 0.00
TAvs - Subsoil total available 1 CL 14.00 C 14.50 0 0.00
2 MS 8.00 0 0.00 0 0.00
3 0 0.00 0 0.00 0 0.00
EAvs - 1 CL 8.75 C 7.25 0 0.00
Subsoil (SS) easily available 2 MS 5.00 0 0.00 0 0.00
3 0 0.00 0 0.00 0 0.00
LT50 - 1 CL 15.00 C 20.00 0 0.00
Thickness ss layers to 50cm 2 MS 0.00 0 0.00 0 0.00
3 0 0.00 0 0.00 0 0.00
LT120 - 1 CL 10.00 C 70.00 0 0.00
Thickness ss layers 50 to 120cm 2 MS 60.00 0 0.00 0 0.00
3 0 0.00 0 0.00 0 0.00
LT0 - 1 CL 25.00 C 40.00 0 0.00
Thickness ss layers to 70cm 2 MS 10.00 0 0.00 0 0.00
3 0 0.00 0 0.00 0 0.00
Total profile thickness for soil type cm 0 120 120 0 0
SOIL Droughtiness (moisture balance) results
2 NotesType 1 Grade 2
Results 3a
AP wheat = 116.8 3b
Moisture balance wheat = 20.6 2 1
AP potatoes = 106.1 2
Moisture balance potatoes = 21.6 1 3a
3b
Type 2 1
Results 2
AP wheat = 128.7 3a
Moisture balance wheat = 32.4 1 3b
AP potatoes = 106.9 1
Moisture balance potatoes = 22.4 1 2
3a
Type 3 3b
Results
AP wheat = 0.0 4
Moisture balance wheat = -96.2 4 4
AP potatoes = 0.0 4
Moisture balance potatoes = -84.5 4 4
4 ALC Moisture Balance Limits
4 Grade wheat potatoes
4 1 30 10
4 2 5 -10
4 3a -20 -30
4 3b -50 -55
4 4 <-50 <-55

APPENDIX B
Site Survey Field Notes

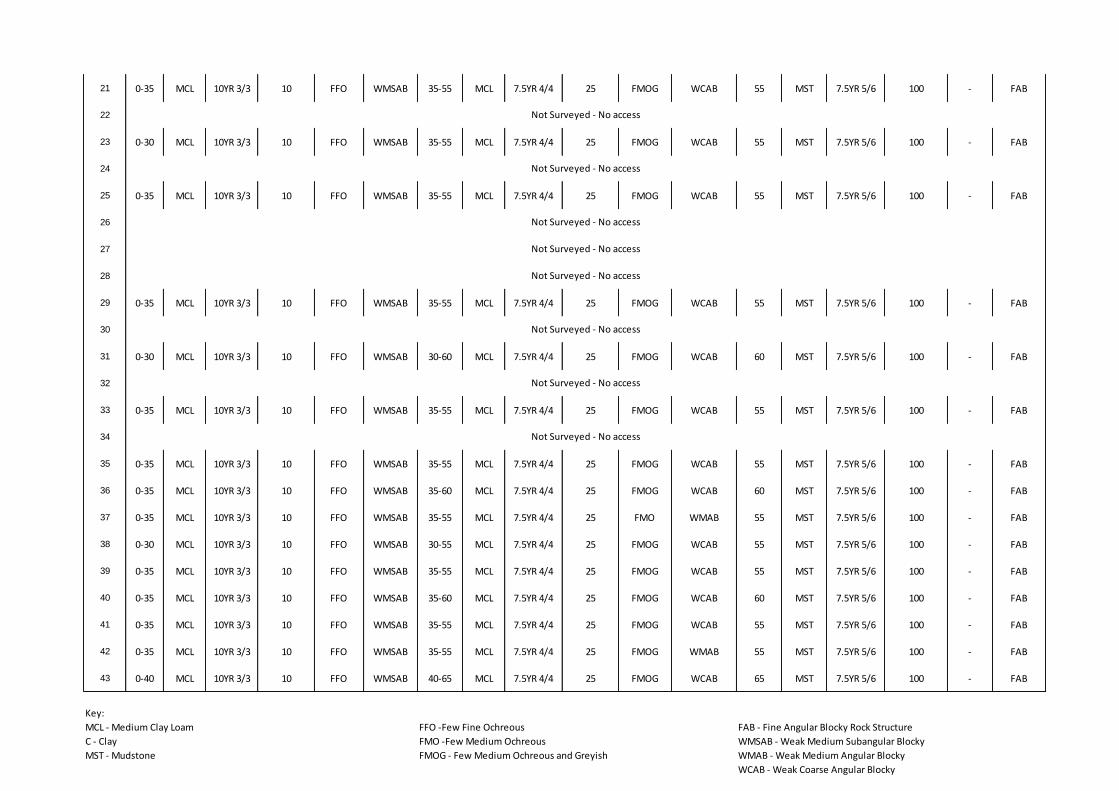
21 0-35 MCL 10YR 3/3 10 FFO WMSAB 35-55 MCL 7.5YR 4/4 25 FMOG WCAB 55 MST 7.5YR 5/6 100 - FAB
22
23 0-30 MCL 10YR 3/3 10 FFO WMSAB 35-55 MCL 7.5YR 4/4 25 FMOG WCAB 55 MST 7.5YR 5/6 100 - FAB
24
25 0-35 MCL 10YR 3/3 10 FFO WMSAB 35-55 MCL 7.5YR 4/4 25 FMOG WCAB 55 MST 7.5YR 5/6 100 - FAB
26
27
28
29 0-35 MCL 10YR 3/3 10 FFO WMSAB 35-55 MCL 7.5YR 4/4 25 FMOG WCAB 55 MST 7.5YR 5/6 100 - FAB
30
31 0-30 MCL 10YR 3/3 10 FFO WMSAB 30-60 MCL 7.5YR 4/4 25 FMOG WCAB 60 MST 7.5YR 5/6 100 - FAB
32
33 0-35 MCL 10YR 3/3 10 FFO WMSAB 35-55 MCL 7.5YR 4/4 25 FMOG WCAB 55 MST 7.5YR 5/6 100 - FAB
34
35 0-35 MCL 10YR 3/3 10 FFO WMSAB 35-55 MCL 7.5YR 4/4 25 FMOG WCAB 55 MST 7.5YR 5/6 100 - FAB
36 0-35 MCL 10YR 3/3 10 FFO WMSAB 35-60 MCL 7.5YR 4/4 25 FMOG WCAB 60 MST 7.5YR 5/6 100 - FAB
37 0-35 MCL 10YR 3/3 10 FFO WMSAB 35-55 MCL 7.5YR 4/4 25 FMO WMAB 55 MST 7.5YR 5/6 100 - FAB
38 0-30 MCL 10YR 3/3 10 FFO WMSAB 30-55 MCL 7.5YR 4/4 25 FMOG WCAB 55 MST 7.5YR 5/6 100 - FAB
39 0-35 MCL 10YR 3/3 10 FFO WMSAB 35-55 MCL 7.5YR 4/4 25 FMOG WCAB 55 MST 7.5YR 5/6 100 - FAB
40 0-35 MCL 10YR 3/3 10 FFO WMSAB 35-60 MCL 7.5YR 4/4 25 FMOG WCAB 60 MST 7.5YR 5/6 100 - FAB
41 0-35 MCL 10YR 3/3 10 FFO WMSAB 35-55 MCL 7.5YR 4/4 25 FMOG WCAB 55 MST 7.5YR 5/6 100 - FAB
42 0-35 MCL 10YR 3/3 10 FFO WMSAB 35-55 MCL 7.5YR 4/4 25 FMOG WMAB 55 MST 7.5YR 5/6 100 - FAB
43 0-40 MCL 10YR 3/3 10 FFO WMSAB 40-65 MCL 7.5YR 4/4 25 FMOG WCAB 65 MST 7.5YR 5/6 100 - FAB
Key:
MCL - Medium Clay Loam FFO -Few Fine Ochreous FAB - Fine Angular Blocky Rock Structure
C - Clay FMO -Few Medium Ochreous WMSAB - Weak Medium Subangular Blocky
MST - Mudstone FMOG - Few Medium Ochreous and Greyish WMAB - Weak Medium Angular Blocky
WCAB - Weak Coarse Angular Blocky
Not Surveyed - No access
Not Surveyed - No access
Not Surveyed - No access
Not Surveyed - No access
Not Surveyed - No access
Not Surveyed - No access
Not Surveyed - No access
Not Surveyed - No access

INFORMATION SOURCES
1. Agricultural Land Classification of England and Wales. Guidance and criteria for
grading the quality of agricultural land. MAFF. 1988.
2. Agricultural Land Classification of England and Wales. Guidance and criteria for
grading the quality of agricultural land. Second Revision MAFF. DRAFT May 1996.
3. Soil Survey Field Handbook. Technical Monograph No.5. Soil Survey of England
and Wales.1976.
4. Soil Map of England and Wales: 1:250 000. Soil Survey of England and Wales,
Harpenden.
5. Soils and Their Use in Midland and Western England. Soil Survey of England and
Wales, Harpenden.
6. Agricultural Land Classification Map 1:250 000. MAFF 1983.
7. Risk of Flooding from Rivers and Sea: 1:15 000. Environment Agency
8. Geology of Britain Viewer. Reproduced with the permission of the British Geological
Survey ©NERC. All rights Reserved
9. National Planning Policy Framework (NPPF) Department for Communities and Local
Government March 2012
10. Planning Policy Statement 7 (PPS7)
11. Agricultural Land Classification: protecting the best and most versatile agricultural
land. Natural England, December 2012
12. BS3882: 2007 Specification for Topsoil and Requirements for Use.
13. MAFF 2000 Good practice guide for handling soils
14. Code of Practice for the Sustainable Management and Use of Soil on Construction
Sites. DEFRA, (September 2009), available at:
https://www.gov.uk/government/uploads/system/uploads/attachment_data/file/69308/pb
13298-code-of-practice-090910.pdf

15. National Planning Policy Framework (NPPF) Ministry of Housing, Communities and
Local Government July 2018