Embed Size (px)
Citation preview
proteinsSTRUCTURE O FUNCTION O BIOINFORMATICS
Classification of conformational stability ofprotein mutants from 3D pseudo-foldinggraph representation of protein sequencesusing support vector machinesMichael Fernandez,1* Julio Caballero,1,2 Leyden Fernandez,1 Jose Ignacio Abreu,1,3
and Gianco Acosta4
1Molecular Modeling Group, Center for Biotechnological Studies, Faculty of Agronomy, University of Matanzas,
44740 Matanzas, Cuba
2 Centro de Bioinformatica y Simulacion Molecular, Universidad de Talca, 2 Norte 685, Casilla 721, Talca, Chile
3 Artificial Intelligence Lab, Faculty of Informatics, University of Matanzas, 44740 Matanzas, Cuba
4National Bioinformatics Center, 10200, Havana, Cuba
INTRODUCTION
Evidence is accumulated that many disease-causing mutations exert their
effects by altering protein folding. Predicting proteins structures and stabilities
are fundamental goals in molecular biology. Therefore predicting changes in
structure and stability, induced by point mutations, has immediate application
in computational protein design.1–4 Despite free energy simulations have accu-
rately predicted relative stabilities of point mutants,5 the computational costs
that most of the methods actually demand, are extremely high to test the large
number of mutations studied in protein design applications.
Fast algorithms for protein energy calculations are being developed today for
intending the translation of structural data into energetic parameters. However, the
development of fast and reliable protein force-fields is a complex task due to the del-
icate balance between the different energy terms that contribute to protein stability.
Force-fields for predicting protein stability can be divided into three main groups:
physical effective energy function (PEEF), statistical potential-based effective energy
function (SEEF),6 and empirical data-based effective energy function (EEEF).
A simplified energy function with only Van der Waals and side chain torsion
potentials,7 a PEEF approach, has been used to predict the stabilities of the krepressor protein for mutations involving only hydrophobic residues. In addition,
an improved optimization method including continuously flexible side chain
angles also demonstrated better prediction accuracy as compared with discrete
side chain angles from a rotamer library.8 In turn, SEEF method includes statisti-
cal potentials derived from geometric and environmental propensities and corre-
lations of residues in X-ray crystal structures.6,9,10 On the other hand, EEEF
approach combines a physical description of the interactions with some data
obtained from experiments previously ran on proteins. Examples of such algo-
rithms are the helix/coil transition algorithm AGADIR11 or FOLDEF,12 a fast
and accurate EEEF approach based on AGADIR algorithm that uses a full atomic
The Supplementary Material referred to in this article can be found online at http://www.interscience.wiley.com/jpages/
0887-3585/suppmat/
*Correspondence to: M. Fernandez, Molecular Modeling Group, Center for Biotechnological Studies, Faculty of
Agronomy, University of Matanzas, 44740 Matanzas, Cuba. E-mail: [email protected]
Received 6 December 2006; Revised 9 March 2007; Accepted 20 March 2007
Published online 24 July 2007 in Wiley InterScience (www.interscience.wiley.com). DOI: 10.1002/prot.21524
ABSTRACT
This work reports a novel 3D pseudo-
folding graph representation of pro-
tein sequences for modeling purposes.
Amino acids euclidean distances mat-
rices (EDMs) encode primary struc-
tural information. Amino Acid
Pseudo-Folding 3D Distances Count
(AAp3DC) descriptors, calculated
from the EDMs of a large data set of
1363 single protein mutants of 64
proteins, were tested for building a
classifier for the signs of the change
of thermal unfolding Gibbs free
energy change (DDG) upon single
mutations. An optimum support vec-
tor machine (SVM) with a radial ba-
sis function (RBF) kernel well recog-
nized stable and unstable mutants
with accuracies over 70% in crossva-
lidation test. To the best of our
knowledge, this result for stable mu-
tant recognition is the highest ever
reported for a sequence-based predic-
tor with more than 1000 mutants.
Furthermore, the model adequately
classified mutations associated to dis-
eases of human prion protein and
human transthyretin.
Proteins 2008; 70:167–175.VVC 2007 Wiley-Liss, Inc.
Key words: protein stability predic-
tion; point mutations; kernel-based
methods; graph similarity.
VVC 2007 WILEY-LISS, INC. PROTEINS 167
description of the structure of the proteins was reported
by Guerois et al.13 for predicting conformational stability
of more than 1000 mutants.
Gromiha et al.14–16 reported stability prediction stud-
ies not based on protein force-field calculations but
focused on correlations of free energy change with 3D
structure, sequence information, and amino acid proper-
ties such as hydrophobicity, accessible surface area, and
so forth. On the other hand, empirical equations involv-
ing physical properties calculated from mutant structures
have been reported. Zhou and Zhou17 developed a broad
study regarding 35 proteins and 1023 mutants from
which they derived a new stability scale.
Machine learning algorithms have been also applied to
the protein stability prediction problem. In this connec-
tion, outstanding reports of Capriotti et al.18–20 describe
the implementation of neural network and support vec-
tor machine models for predicting the change of thermal
unfolding Gibbs free energy change (DDG) by using
sequence and 3D structure information. This approach
used a dataset of more than 2000 mutations. Network
and vector machine were trained with a combination of
experimental condition data (pH and temperature), spe-
cific mutated residue information, and environmental
residues information.
Furthermore, recent reports refer the novel extensions
of different structure–property relationships approaches
to the prediction of protein stability using both
sequence-21–24 and structure-based information.25 In
such reports, descriptors are calculated over the protein
sequences or 3D structures in such a way that several
variables are computed considering the protein structure
as a simplified molecular pseudo-graph of Ca atoms.
In this work, an optimum classification model for the
conformational stability of protein mutants was success-
fully built from protein sequences. A novel 3D pseudo-
folding graph representation of protein sequence was used
in order to enrich the information from the protein pri-
mary structure. A total of 35 amino acid pseudo-folding
3D distances count (AAp3DC) descriptors were calculated
from the amino acids euclidean distance matrices from the
protein 3D graphs. We tested a large set of 1363 mutants of
64 proteins for deriving a general protein predictor for sta-
ble and unstable mutant recognition. Prediction of the
signs of change of thermal unfolding Gibbs DDG upon sin-
gle mutations was accomplished by support vector
machine (SVM) classification. In addition to AAp3DC
descriptors, we also trained the SVMs with temperature
and pH values of the DDG experimental measurements.
MATERIALS AND METHODS
Single point mutant dataset
The mutant dataset was obtained by filtering the data
previously collected by Capriotti et al. in Ref. 19 from
the Protherm database26 according to the following con-
strains:
1. DDG values have been experimentally determined and
reported in the data base.
2. The data are related to single point mutations (non
multiple mutations were taken into account).
After the filtering they gathered 2048 single point
mutants obtained from 64 proteins. However, since
some entries in the data collected by Capriotti et al.19
refer different measurements on same mutants, we
added an extra constrain.
3. Only one reported DDG value per annotated mutant
in the database was selected.
In this way, a dataset of 1383 mutants (see Supplemen-
tary Material) was gathered and used for testing the abil-
ity of the 3D pseudo-folding graph representation of pro-
tein sequence for discriminating between stable and
unstable mutants.
3D pseudo-folding representations ofprotein sequences and amino acid pseudo-folding 3D distances count descriptors
In addition to the intensive computation required for
predicting protein stability by the free energy function
methods, another limitation arises when considering nec-
essary X-ray crystal structures of mutants.1–12 Despite
protein crystallographic database continuously grow,
crystal structures are not always available for proteins of
interest. In this regard, some X-ray structural-independ-
ent protein stability prediction methods have gained
attention. The main advantages of such methods are the
use of amino acids sequence information for predicting
protein stability and their extremely less computational
cost in comparison with free energy function-based
methods.
Exploitation of protein sequences for prediction and
similarity studies have been extended by developing
2D27,28 and 3D29,30 graph representations of sequences
as well as weighted linear graph representations 21–24,31.
The first of these approaches intended to enrich the pri-
mary structure information by mapping sequence resi-
dues in a higher dimensional space. Among these reports,
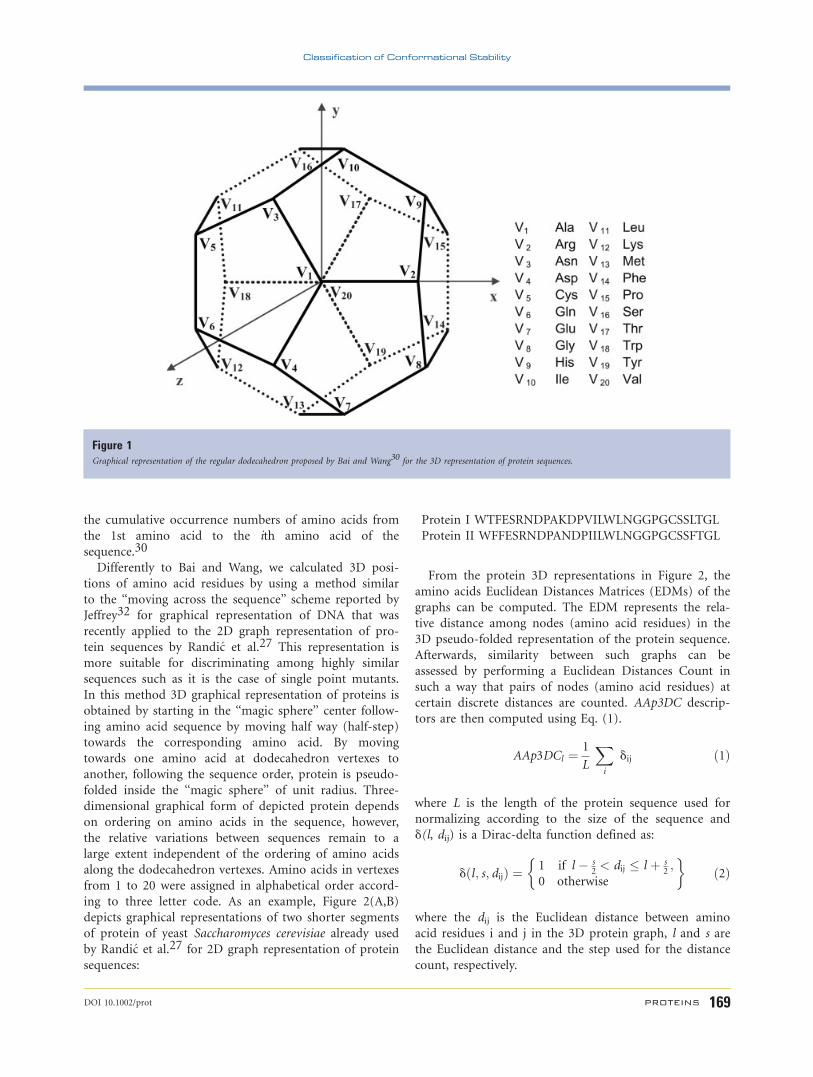
Bai and Wang30 referred a new approach to represent
protein sequences with a 3D Cartesian coordinate system.
Protein representations are constructed in the interior of
a regular dodecahedron centered at origin of the Carte-
sian coordinate system and one vertex at the point
(0,0,1) that is circumscribed inside a unit ‘‘magic sphere’’
(Fig. 1). At the dodecahedron vertexes are positioned 20
amino acids. For calculating 3D position (xi, yi, zi) of
amino acid i in a given sequence Bai and Wang multi-
plied the 3 3 20 matrix of Cartesian coordinates of
dodecahedron vertexes by a 1 3 20 vector representing
M. Fernandez et al.
168 PROTEINS DOI 10.1002/prot
the cumulative occurrence numbers of amino acids from
the 1st amino acid to the ith amino acid of the
sequence.30
Differently to Bai and Wang, we calculated 3D posi-
tions of amino acid residues by using a method similar
to the ‘‘moving across the sequence’’ scheme reported by
Jeffrey32 for graphical representation of DNA that was
recently applied to the 2D graph representation of pro-
tein sequences by Randic et al.27 This representation is
more suitable for discriminating among highly similar
sequences such as it is the case of single point mutants.
In this method 3D graphical representation of proteins is
obtained by starting in the ‘‘magic sphere’’ center follow-
ing amino acid sequence by moving half way (half-step)
towards the corresponding amino acid. By moving
towards one amino acid at dodecahedron vertexes to
another, following the sequence order, protein is pseudo-
folded inside the ‘‘magic sphere’’ of unit radius. Three-
dimensional graphical form of depicted protein depends
on ordering on amino acids in the sequence, however,
the relative variations between sequences remain to a
large extent independent of the ordering of amino acids
along the dodecahedron vertexes. Amino acids in vertexes
from 1 to 20 were assigned in alphabetical order accord-
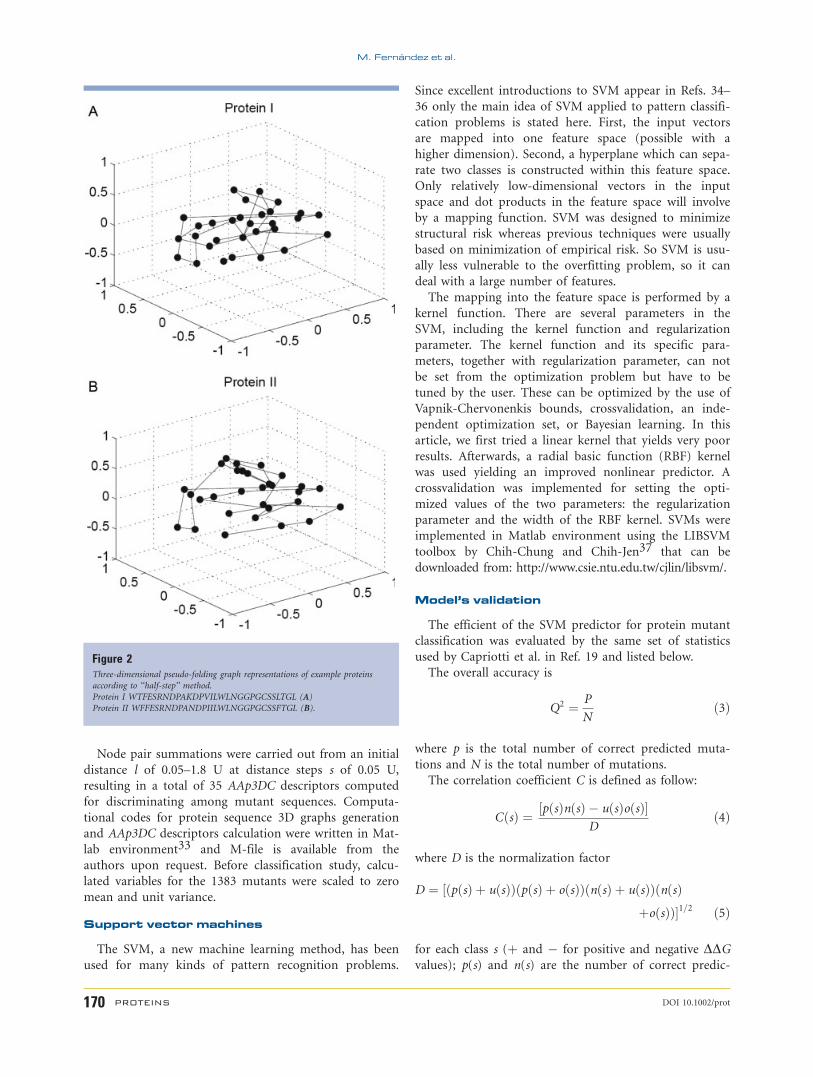
ing to three letter code. As an example, Figure 2(A,B)
depicts graphical representations of two shorter segments
of protein of yeast Saccharomyces cerevisiae already used
by Randic et al.27 for 2D graph representation of protein
sequences:
Protein I WTFESRNDPAKDPVILWLNGGPGCSSLTGL
Protein II WFFESRNDPANDPIILWLNGGPGCSSFTGL
From the protein 3D representations in Figure 2, the
amino acids Euclidean Distances Matrices (EDMs) of the
graphs can be computed. The EDM represents the rela-
tive distance among nodes (amino acid residues) in the
3D pseudo-folded representation of the protein sequence.
Afterwards, similarity between such graphs can be
assessed by performing a Euclidean Distances Count in
such a way that pairs of nodes (amino acid residues) at
certain discrete distances are counted. AAp3DC descrip-
tors are then computed using Eq. (1).
AAp3DCl ¼ 1
L
Xi
dij ð1Þ
where L is the length of the protein sequence used for
normalizing according to the size of the sequence and
d(l, dij) is a Dirac-delta function defined as:
dðl; s; dijÞ ¼ 1 if l � s2< dij � l þ s
2;
0 otherwise
� �ð2Þ
where the dij is the Euclidean distance between amino
acid residues i and j in the 3D protein graph, l and s are
the Euclidean distance and the step used for the distance
count, respectively.
Figure 1Graphical representation of the regular dodecahedron proposed by Bai and Wang30 for the 3D representation of protein sequences.
Classification of Conformational Stability
DOI 10.1002/prot PROTEINS 169
Node pair summations were carried out from an initial
distance l of 0.05–1.8 U at distance steps s of 0.05 U,
resulting in a total of 35 AAp3DC descriptors computed
for discriminating among mutant sequences. Computa-
tional codes for protein sequence 3D graphs generation
and AAp3DC descriptors calculation were written in Mat-
lab environment33 and M-file is available from the
authors upon request. Before classification study, calcu-
lated variables for the 1383 mutants were scaled to zero
mean and unit variance.
Support vector machines
The SVM, a new machine learning method, has been
used for many kinds of pattern recognition problems.
Since excellent introductions to SVM appear in Refs. 34–
36 only the main idea of SVM applied to pattern classifi-
cation problems is stated here. First, the input vectors
are mapped into one feature space (possible with a
higher dimension). Second, a hyperplane which can sepa-
rate two classes is constructed within this feature space.
Only relatively low-dimensional vectors in the input
space and dot products in the feature space will involve
by a mapping function. SVM was designed to minimize
structural risk whereas previous techniques were usually
based on minimization of empirical risk. So SVM is usu-
ally less vulnerable to the overfitting problem, so it can
deal with a large number of features.
The mapping into the feature space is performed by a
kernel function. There are several parameters in the
SVM, including the kernel function and regularization
parameter. The kernel function and its specific para-
meters, together with regularization parameter, can not
be set from the optimization problem but have to be
tuned by the user. These can be optimized by the use of
Vapnik-Chervonenkis bounds, crossvalidation, an inde-
pendent optimization set, or Bayesian learning. In this
article, we first tried a linear kernel that yields very poor
results. Afterwards, a radial basic function (RBF) kernel
was used yielding an improved nonlinear predictor. A
crossvalidation was implemented for setting the opti-
mized values of the two parameters: the regularization
parameter and the width of the RBF kernel. SVMs were
implemented in Matlab environment using the LIBSVM
toolbox by Chih-Chung and Chih-Jen37 that can be
downloaded from: http://www.csie.ntu.edu.tw/cjlin/libsvm/.
Model’s validation
The efficient of the SVM predictor for protein mutant
classification was evaluated by the same set of statistics
used by Capriotti et al. in Ref. 19 and listed below.
The overall accuracy is
Q2 ¼ P
Nð3Þ
where p is the total number of correct predicted muta-
tions and N is the total number of mutations.
The correlation coefficient C is defined as follow:
CðsÞ ¼ ½pðsÞnðsÞ � uðsÞoðsÞ�D
ð4Þ
where D is the normalization factor
D ¼ ðpðsÞ þ uðsÞÞðpðsÞ þ oðsÞÞðnðsÞ þ uðsÞÞðnðsÞ½þoðsÞÞ�1=2 ð5Þ
for each class s (þ and � for positive and negative DDGvalues); p(s) and n(s) are the number of correct predic-
Figure 2Three-dimensional pseudo-folding graph representations of example proteins
according to ‘‘half-step’’ method.
Protein I WTFESRNDPAKDPVILWLNGGPGCSSLTGL (A)
Protein II WFFESRNDPANDPIILWLNGGPGCSSFTGL (B).
M. Fernandez et al.
170 PROTEINS DOI 10.1002/prot
tions and correctly rejected assignments, respectively and
u(s) and o(s) are the number or under- and over-predic-
tions.
The coverage for each discriminant structure s is eval-
uated as
QS ¼ pðsÞpðsÞ þ uðsÞ ð6Þ
The accuracy for s is computed as
PS ¼ pðsÞpðsÞ þ oðsÞ ð7Þ
where p(s) and u(s) are the same as in Eq. (7)
RESULTS AND DISCUSSION
Three-dimensional graph representation of proteins
attempts to discriminate among protein sequences
according to a differentiated 3D spatial distribution of
residues in a 3D map. Thus, the unidimensional space of
protein primary structure is then translated to a 3D one.
Consequently, sequence information is converted into a
more easily readable format in order to compute some
descriptors for statistical pattern recognition studies.
After 3D pseudo-folding graph representation of protein
sequences, we applied graph similarity measurements for
obtaining a feature data matrix for SVM training. SVM
predictor was trained with 35 AAp3DC descriptors calcu-
lated over the 3D graph representations of the 1383
mutants studied (see Support Vector Machines, 3D
pseudo-folding representations of protein sequences and
AAp3DC descriptors). Temperature and pH values of the
experimental DDG measurements were also used for
training the predictor. Since the dataset is about threefold
unbalanced towards unstable mutants, a threefold higher
penalty for stable mutant misclassification was established
inside the SVM framework for obtaining a classifier not
biased to the most represented class. In a first attempt,
we implemented the simplest linear kernel but the higher
crossvalidation accuracy was only about 0.6. Then, a
nonlinear SVM classifier was optimized by adjusting the
value of a RBF kernel width and regularization parameter
throughout a 20-fold out crossvalidation test. Optimum
values of RBF kernel width and regularization parameter
were 0.033 and 10, respectively, yielding training and
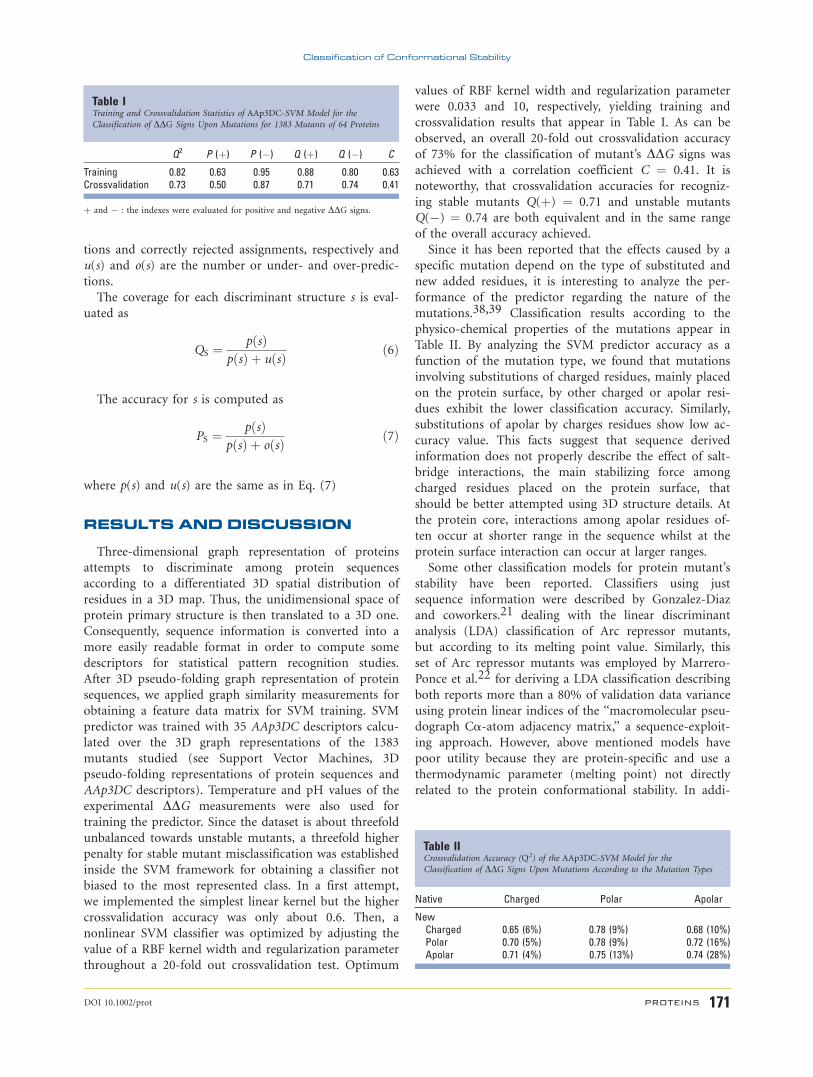
crossvalidation results that appear in Table I. As can be
observed, an overall 20-fold out crossvalidation accuracy
of 73% for the classification of mutant’s DDG signs was
achieved with a correlation coefficient C ¼ 0.41. It is
noteworthy, that crossvalidation accuracies for recogniz-
ing stable mutants Q(þ) ¼ 0.71 and unstable mutants
Q(�) ¼ 0.74 are both equivalent and in the same range
of the overall accuracy achieved.
Since it has been reported that the effects caused by a
specific mutation depend on the type of substituted and
new added residues, it is interesting to analyze the per-
formance of the predictor regarding the nature of the
mutations.38,39 Classification results according to the
physico-chemical properties of the mutations appear in
Table II. By analyzing the SVM predictor accuracy as a
function of the mutation type, we found that mutations
involving substitutions of charged residues, mainly placed
on the protein surface, by other charged or apolar resi-
dues exhibit the lower classification accuracy. Similarly,
substitutions of apolar by charges residues show low ac-
curacy value. This facts suggest that sequence derived
information does not properly describe the effect of salt-
bridge interactions, the main stabilizing force among
charged residues placed on the protein surface, that
should be better attempted using 3D structure details. At
the protein core, interactions among apolar residues of-
ten occur at shorter range in the sequence whilst at the
protein surface interaction can occur at larger ranges.
Some other classification models for protein mutant’s
stability have been reported. Classifiers using just
sequence information were described by Gonzalez-Diaz
and coworkers.21 dealing with the linear discriminant
analysis (LDA) classification of Arc repressor mutants,
but according to its melting point value. Similarly, this
set of Arc repressor mutants was employed by Marrero-
Ponce et al.22 for deriving a LDA classification describing
both reports more than a 80% of validation data variance
using protein linear indices of the ‘‘macromolecular pseu-
dograph Ca-atom adjacency matrix,’’ a sequence-exploit-
ing approach. However, above mentioned models have
poor utility because they are protein-specific and use a
thermodynamic parameter (melting point) not directly
related to the protein conformational stability. In addi-
Table ITraining and Crossvalidation Statistics of AAp3DC-SVM Model for the
Classification of DDG Signs Upon Mutations for 1383 Mutants of 64 Proteins
Q2 P (þ) P (�) Q (þ) Q (�) C
Training 0.82 0.63 0.95 0.88 0.80 0.63Crossvalidation 0.73 0.50 0.87 0.71 0.74 0.41
þ and � : the indexes were evaluated for positive and negative DDG signs.
Table IICrossvalidation Accuracy (Q2) of the AAp3DC-SVM Model for the
Classification of DDG Signs Upon Mutations According to the Mutation Types
Native Charged Polar Apolar
NewCharged 0.65 (6%) 0.78 (9%) 0.68 (10%)Polar 0.70 (5%) 0.78 (9%) 0.72 (16%)Apolar 0.71 (4%) 0.75 (13%) 0.74 (28%)
Classification of Conformational Stability
DOI 10.1002/prot PROTEINS 171
tion, other single-protein models, previously developed
by us, built with amino acids sequence autocorrelation
vectors and Bayesian Regularized Neural Networks, suc-
cessfully mapped lysozymes23 and gene V protein24
mutants in self-organizing maps according to mutant’s
DDG levels.
On the other hand, taking into account classification
models of protein stability change upon mutations using
large and diverse mutant data, our classification model
shows to overcome the optimum reported by Capriotti
et al.19 using only sequence information. Despite they
reported an overall accuracy about 77%, the correct pre-
dictions were drastically shifted towards unstable mutants
with a value about 91% whilst for recognizing stable
mutants it was reported a very low value about 46%.
Such statistics reflect that their model almost recognized
all mutants as unstable yielding and overall adequate ac-
curacy but with very low discriminating ability. In turn,
our predictor recognized both stable and unstable mutants
with identical good accuracy about 70% due to the higher
penalty imposed to stable mutant misclassification during
SVM training. To the best of our knowledge, this is the
highest accuracy reported for positive DDG signs recogni-
tion by a model with more than 1000 mutations and only
exploiting sequence information. Interestingly, when Cap-
riotti et al.20 used 3D structure information the highest
overall classification accuracy achieved was about 80%
but stable mutants were poorly recognized with and accu-
racy of 56% supporting the fact that our AAp3DC-SVM
predictor, although its primary sequence nature, is more
adequate for the mutant stability recognition task. Simi-
larly, Gonzalez-Diaz et al.25 reported a LDA model for
recognizing stable mutants using 3D stochastic average
electrostatic potentials derived from protein 3D structure
with validation accuracy nearly 90% for all the dataset
and for each class separately. However, instead of discri-
minated between stable or unstable mutants according to
wild-type protein they classified the mutants in higher
stable and near-wild-type stable.
Since we used a whole sequence representation for
studying mutation effect on stability rather than a muta-
tion location-dependent representation such as other
reports,15–20 it could be obtained as undesirable pro-
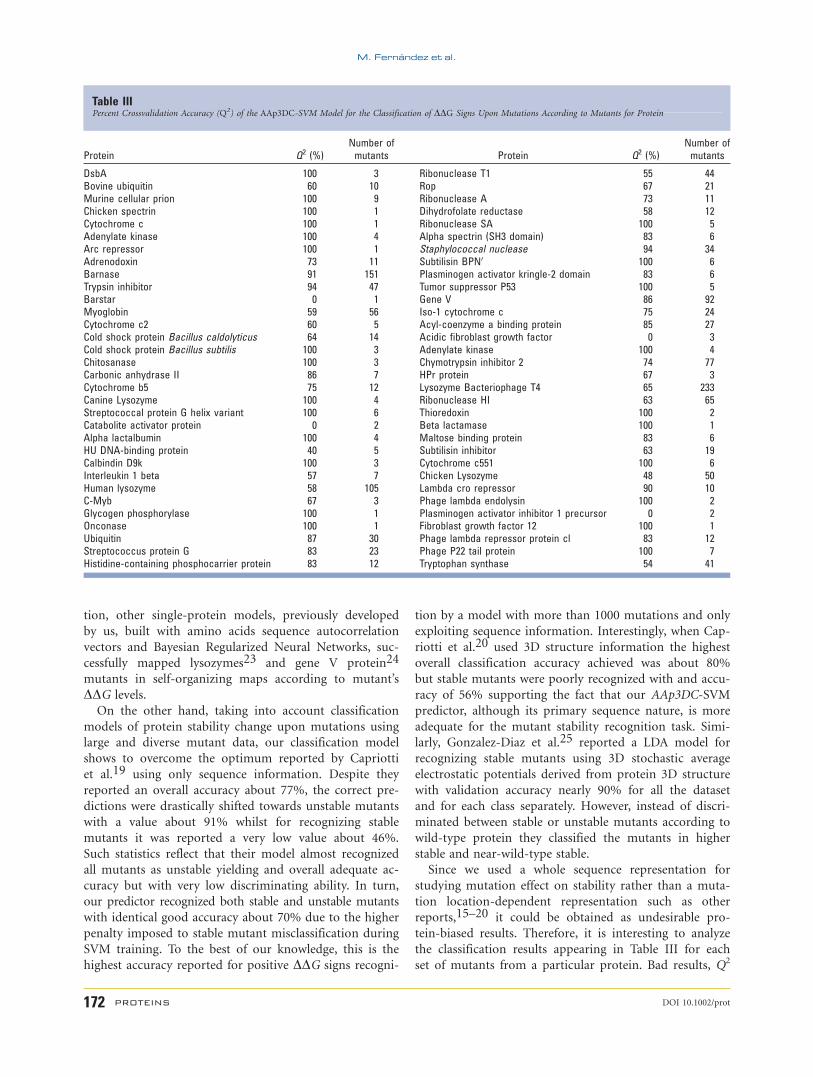
tein-biased results. Therefore, it is interesting to analyze
the classification results appearing in Table III for each
set of mutants from a particular protein. Bad results, Q2
Table IIIPercent Crossvalidation Accuracy (Q2) of the AAp3DC-SVM Model for the Classification of DDG Signs Upon Mutations According to Mutants for Protein
Protein Q2 (%)Number ofmutants Protein Q2 (%)
Number ofmutants
DsbA 100 3 Ribonuclease T1 55 44Bovine ubiquitin 60 10 Rop 67 21Murine cellular prion 100 9 Ribonuclease A 73 11Chicken spectrin 100 1 Dihydrofolate reductase 58 12Cytochrome c 100 1 Ribonuclease SA 100 5Adenylate kinase 100 4 Alpha spectrin (SH3 domain) 83 6Arc repressor 100 1 Staphylococcal nuclease 94 34Adrenodoxin 73 11 Subtilisin BPN0 100 6Barnase 91 151 Plasminogen activator kringle-2 domain 83 6Trypsin inhibitor 94 47 Tumor suppressor P53 100 5Barstar 0 1 Gene V 86 92Myoglobin 59 56 Iso-1 cytochrome c 75 24Cytochrome c2 60 5 Acyl-coenzyme a binding protein 85 27Cold shock protein Bacillus caldolyticus 64 14 Acidic fibroblast growth factor 0 3Cold shock protein Bacillus subtilis 100 3 Adenylate kinase 100 4Chitosanase 100 3 Chymotrypsin inhibitor 2 74 77Carbonic anhydrase II 86 7 HPr protein 67 3Cytochrome b5 75 12 Lysozyme Bacteriophage T4 65 233Canine Lysozyme 100 4 Ribonuclease HI 63 65Streptococcal protein G helix variant 100 6 Thioredoxin 100 2Catabolite activator protein 0 2 Beta lactamase 100 1Alpha lactalbumin 100 4 Maltose binding protein 83 6HU DNA-binding protein 40 5 Subtilisin inhibitor 63 19Calbindin D9k 100 3 Cytochrome c551 100 6Interleukin 1 beta 57 7 Chicken Lysozyme 48 50Human lysozyme 58 105 Lambda cro repressor 90 10C-Myb 67 3 Phage lambda endolysin 100 2Glycogen phosphorylase 100 1 Plasminogen activator inhibitor 1 precursor 0 2Onconase 100 1 Fibroblast growth factor 12 100 1Ubiquitin 87 30 Phage lambda repressor protein cl 83 12Streptococcus protein G 83 23 Phage P22 tail protein 100 7Histidine-containing phosphocarrier protein 83 12 Tryptophan synthase 54 41
M. Fernandez et al.
172 PROTEINS DOI 10.1002/prot
values significantly lower than 0.5, are only obtained in
five cases but for five proteins with no more than five
mutants, thus having low statistical weight on the whole
classification model. This analysis reflects the robustness
of our predictor.
An interesting application of our classifier is to recog-
nize unstable mutations when mutations have been
reported to correlate to diseases. Indeed, many disease-
causing mutations exert their effects by altering protein
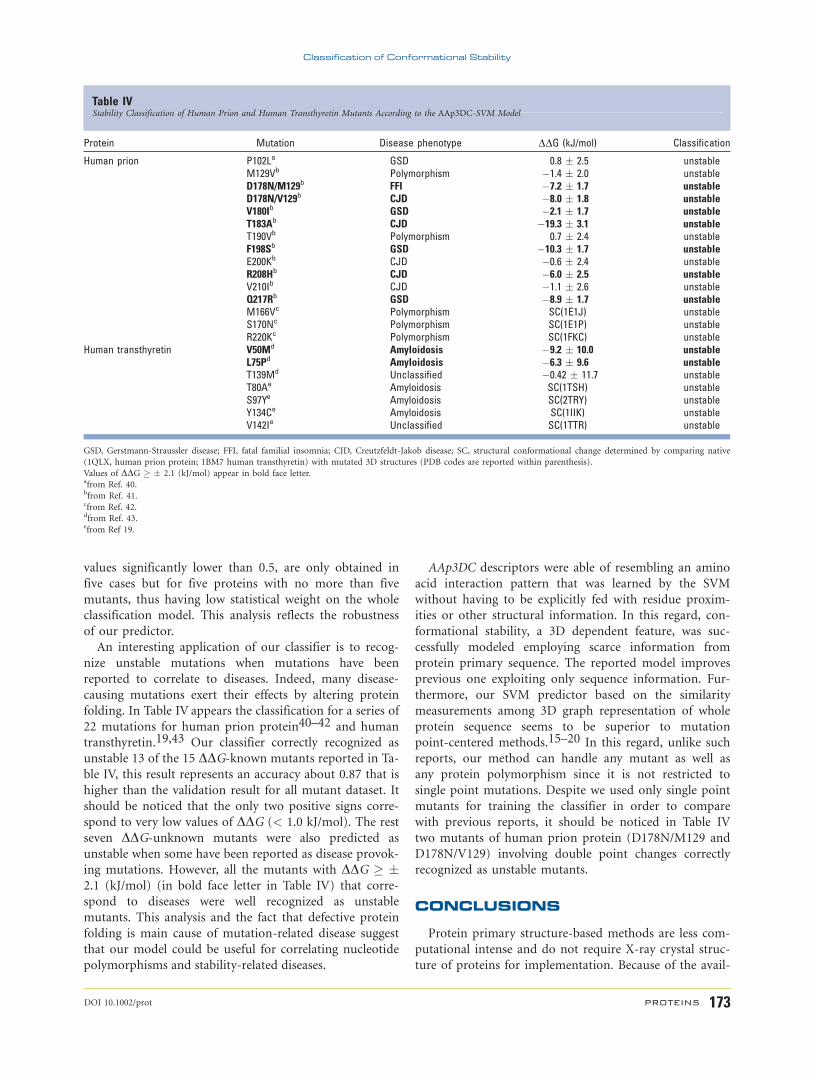
folding. In Table IV appears the classification for a series of
22 mutations for human prion protein40–42 and human
transthyretin.19,43 Our classifier correctly recognized as
unstable 13 of the 15 DDG-known mutants reported in Ta-
ble IV, this result represents an accuracy about 0.87 that is
higher than the validation result for all mutant dataset. It
should be noticed that the only two positive signs corre-
spond to very low values of DDG (< 1.0 kJ/mol). The rest
seven DDG-unknown mutants were also predicted as
unstable when some have been reported as disease provok-
ing mutations. However, all the mutants with DDG � �2.1 (kJ/mol) (in bold face letter in Table IV) that corre-
spond to diseases were well recognized as unstable
mutants. This analysis and the fact that defective protein
folding is main cause of mutation-related disease suggest
that our model could be useful for correlating nucleotide
polymorphisms and stability-related diseases.
AAp3DC descriptors were able of resembling an amino
acid interaction pattern that was learned by the SVM
without having to be explicitly fed with residue proxim-
ities or other structural information. In this regard, con-
formational stability, a 3D dependent feature, was suc-
cessfully modeled employing scarce information from
protein primary sequence. The reported model improves
previous one exploiting only sequence information. Fur-
thermore, our SVM predictor based on the similarity
measurements among 3D graph representation of whole
protein sequence seems to be superior to mutation
point-centered methods.15–20 In this regard, unlike such
reports, our method can handle any mutant as well as
any protein polymorphism since it is not restricted to
single point mutations. Despite we used only single point
mutants for training the classifier in order to compare
with previous reports, it should be noticed in Table IV
two mutants of human prion protein (D178N/M129 and
D178N/V129) involving double point changes correctly
recognized as unstable mutants.
CONCLUSIONS
Protein primary structure-based methods are less com-
putational intense and do not require X-ray crystal struc-
ture of proteins for implementation. Because of the avail-
Table IVStability Classification of Human Prion and Human Transthyretin Mutants According to the AAp3DC-SVM Model
Protein Mutation Disease phenotype DDG (kJ/mol) Classification
Human prion P102La GSD 0.8 � 2.5 unstableM129Vb Polymorphism �1.4 � 2.0 unstableD178N/M129b FFI �7.2 � 1.7 unstableD178N/V129b CJD �8.0 � 1.8 unstableV180Ib GSD �2.1 � 1.7 unstableT183Ab CJD �19.3 � 3.1 unstableT190Vb Polymorphism 0.7 � 2.4 unstableF198Sb GSD �10.3 � 1.7 unstableE200Kb CJD �0.6 � 2.4 unstableR208Hb CJD �6.0 � 2.5 unstableV210Ib CJD �1.1 � 2.6 unstableQ217Rb GSD �8.9 � 1.7 unstableM166Vc Polymorphism SC(1E1J) unstableS170Nc Polymorphism SC(1E1P) unstableR220Kc Polymorphism SC(1FKC) unstable
Human transthyretin V50Md Amyloidosis �9.2 � 10.0 unstableL75Pd Amyloidosis �6.3 � 9.6 unstableT139Md Unclassified �0.42 � 11.7 unstableT80Ae Amyloidosis SC(1TSH) unstableS97Ye Amyloidosis SC(2TRY) unstableY134Ce Amyloidosis SC(1IIK) unstableV142Ie Unclassified SC(1TTR) unstable
GSD, Gerstmann-Straussler disease; FFI, fatal familial insomnia; CJD, Creutzfeldt-Jakob disease; SC, structural conformational change determined by comparing native
(1QLX, human prion protein; 1BM7 human transthyretin) with mutated 3D structures (PDB codes are reported within parenthesis).
Values of DDG � � 2.1 (kJ/mol) appear in bold face letter.afrom Ref. 40.bfrom Ref. 41.cfrom Ref. 42.dfrom Ref. 43.efrom Ref 19.
Classification of Conformational Stability
DOI 10.1002/prot PROTEINS 173
ability of an enormous amount of thermodynamic data
on protein stability it is possible to use structure–pro-
perty relationship approach for protein stability modeling.
We reported a novel 3D pseudo-folding graph representa-
tion of protein sequence and calculated protein descrip-
tors for training a SVM classifier of mutant stability. The
model well recognized over 70% of stable and unstable
mutants in crossvalidation test. To the best of our knowl-
edge, the accuracy for stable mutant recognition over
70% is the highest ever reported for a model with a large
mutant dataset (>1000) exploiting only sequence infor-
mation. Furthermore, the classifier adequately recognized
some disease-related unstable mutants of human prion
protein and human transthyretin.
Three-dimensional pseudo-folding graph representa-
tion of protein sequence in combination with SVMs
could be very useful in protein prediction studies. De-
spite the disadvantage of requiring some previous ther-
modynamic experimental data for generating a training
set, our stability prediction technique is an alternative
approach for proteins whose sequences are known but X-
ray structures are unsolved.
REFERENCES
1. Saven J. Combinatorial protein design. Curr Opin Struct Biol 2002;
12:453–458.
2. Mendes J, Guerois R, Serrano L. Energy estimation in protein
design. Curr Opin Struct Biol 2002;12:441–446.
3. Bolon DN, Marcus JS, Ross SA, Mayo SL. Prudent modeling of
core polar residues in computational protein design. J Mol Biol
2003;329:611–622.
4. Looger LL, Dwyer MA, Smith JJ, Helling HW. Computational
design of receptor and sensor proteins with novel functions. Nature
2003;423:185–190.
5. Dang LX, Merz KM, Kollman PA. Free-energy calculations on pro-
tein stability: thr-1573val-157 mutation of t4 lysozyme. J Am Chem
Soc 1989;111:8505–8508.
6. Lazaridis T, Karplus M. Effective energy functions for protein struc-
ture prediction. Curr Opin Struct Biol 2000;10:139–145.
7. Lee C, Levitt M. Accurate prediction of the stability and activity
effects of site-directed mutagenesis on a protein core. Nature
1991;352:448–451.
8. Lee C. Testing homology modeling on mutant proteins: predicting
structural and thermodynamic effects in the Ala98-Val mutants of
T4 lysozyme. Fold Des 1995;1:1–12.
9. Topham CM, Srinivasan N, Blundell TL. Prediction of the stability
of protein mutants based on structural environment-dependent
amino acid substitution and propensity tables. Protein Eng
1997;10:7–21.
10. Gilis D, Rooman M. Prediction of stability changes upon single site
mutations using database-derived potentials. Theor Chem Acc
1999;101:46–50.
11. Lacroix E, Viguera AR, Serrano L. Elucidating the folding problem
of alpha-helices: local motifs, long-range electrostatics, ionic-
strength dependence and prediction of NMR parameters. J Mol
Biol 1998;284:173–191.
12. Munoz V, Serrano L. Development of the multiple sequence
approximation within the AGADIR model of alpha-helix formation:
comparison with Zimm-Bragg and Lifson-Roig formalisms. Biopoly-
mers 1997;41:495–509.
13. Guerois R, Nielsen JE, Serrano L. Predicting changes in the stability
of proteins and protein complexes: a study of more than 1000
mutations. J Mol Biol 2002;320:369–387.
14. Gromiha MM, Oobatake M, Kono H, Uedaira H, Sarai A. Relation-
ship between amino acid properties and protein stability: buried
mutations. J Protein Chem 1999;18:565–578.
15. Gromiha MM, Oobatake M, Kono H, Uedaira H, Sarai A. Role of
structural and sequence information in the prediction of protein
stability changes: comparison between buried and partially buried
mutations. Protein Eng 1999;12:549–555.
16. Gromiha MM, Oobatake M, Kono H, Uedaira H, Sarai A. Impor-
tance of surrounding residues for protein stability of partially bur-
ied mutations. J Biomol Struct Dyn 2000;18:1–16.
17. Zhou H, Zhou Y. Stability scale and atomic solvation parameters ex-
tracted from 1023 mutation experiment. Proteins 2002;49:483–492.
18. Capriotti E, Fariselli P, Casadio R. A neural-network-based method
for predicting protein stability changes upon single mutations. Bio-
informatics 2004;20:63–68.
19. Capriotti E, Fariselli P, Calabrese R, Casadio R. Prediction of pro-
tein stability changes from sequences using support vector
machines. Bioinformatics 2005;21:54–58.
20. Capriotti E, Fariselli P, Casadio R. I-Mutant2.0: predicting stability
changes upon mutation from the protein sequence or structure.
Nucleic Acids Res 2005;33:306–310.
21. Ramos de Armas R, Gonzalez-Dıaz H, Molina R, Uriarte E.
Markovian backbone negentropies: molecular descriptors for pro-
tein research. i. predicting protein stability in arc repressor mutants.
Proteins 2004;56:715–723.
22. Marrero-Ponce Y, Medina-Marrero R, Castillo-Garit JA, Romero-
Zaldivar V, Torrens F, Castro EA. Protein linear indices of the
‘macromolecular pseudograph a-carbon atom adjacency matrix’ in
bioinformatics. Part 1: prediction of protein stability effects of a
complete set of alanine substitutions in arc represor. Bioorg Med
Chem 2005;13:3003–3015.
23. Caballero J, Fernandez L, Abreu JI, Fernandez M. Amino acid
sequence autocorrelation vectors and ensembles of bayesian-regular-
ized genetic neural networks for prediction of conformational stability
of human lysozyme mutants. J Chem Inf Model 2006;46:1255–1268.
24. Fernandez L, Caballero J, Abreu JI, Fernandez, M. Amino acid
sequence autocorrelation vectors and bayesian-regularized genetic
neural networks for modeling protein conformational stability: gene
V protein mutants. Proteins 2007;67:834–852.
25. Gonzalez-Dıaz H, Molina R, Uriarte E. Recognition of stable pro-
tein mutants with 3D stochastic average electrostatic potentials.
FEBS Lett 2005;579:4297–4301.
26. Bava KA, Gromiha MM, Uedaira H, Kitajima K, Sarai A. ProTherm
version 4.0: thermodynamic database for proteins and mutants.
Nucleic Acids Res 2004;32:120–121. http://gibk26.bse.kyutech.ac.jp/
jouhou/protherm/protherm.html.
27. Randic M, Butina D, Zupan J. Novel 2D graphical representation of
proteins. Chem Phys Lett 2006;419:528–532.
28. Aguero-Chapin G, Gonzalez-Dıaz H, Molina R, Varona-Santos J,
Uriarte E, Gonzalez-Dıaz Y. Novel 2D maps and coupling numbers
for protein sequences. The first QSAR study of polygalacturonases;
isolation and prediction of a novel sequence from Psidium guajava
L. FEBS Lett 2006;580:723–730.
29. Randic M, Krilov G. Characterization of 3-D sequences of proteins.
Chem Phys Lett 1997;272:115–119.
30. Bai F, Wang T. On graphical and numerical representation of pro-
tein sequences. J Biomol Struct Dyn 2006;23:537–545.
31. Caballero J, Fernandez L, Garriga M, Abreu JI, Collina S, Fernandez
M. Proteometric study of ghrelin receptor function variations upon
mutations using amino acid sequence autocorrelation vectors and
genetic algorithm-based least square support vector machines.
J Mol Graph Model 2006 doi:10.1016/j.jmgm.2006.11.002.
32. Jeffrey HI. Chaos game representation of gene structure. Nucleic
Acid Res 1990;18:2163–2170.
M. Fernandez et al.
174 PROTEINS DOI 10.1002/prot
33. MATLAB 7.0. program, available from The Mathworks Inc., Natick,
MA. http://www.mathworks.com.
34. Cortes C, Vapnik V. Support-vector networks. Mach Learn 1995;20:
273–297.
35. Burges CJC. A tutorial on support vector machines for pattern rec-
ognition. Data Min Knowledge Discov 1998;2:1–47.
36. Vapnik V. Statistical learning theory. New York: Wiley; 1998.
37. Chih-Chung C, Chih-Jen L. LIBSVM: a library for support vec-
tor machines. 2001; Software available at http://www.csie.ntu.edu.
tw/�cjlin/libsvm.
38. Sandberg WS, Terwilliger TC. Energetics of repacking a protein in-
terior. Proc Natl Acad Sci USA 1991;88:1706–1710.
39. Sandberg WS, Terwilliger TC. Engineering multiple properties of a
protein by combinatorial mutagenesis. Proc Natl Acad Sci USA
1993;90:8367–8371.
40. Apetri AC, Surewicz K, Surewicz WK. The effect of disease-associ-
ated mutations on the folding pathway of human prion protein.
J Biol Chem 2004;279:18008–18014.
41. Liemann S, Glockshuber R. Influence of amino acid substitutions
related to inherited human prion diseases on the thermodynamic
stability of the cellular prion protein. Biochemistry 1999;38:3258–
3267.
42. Calzolai L, Lysek DA, Guntert P, Schroetter C, Riek R, Zahn R,
Wuthrich K. NMR structures of three single-residue variants of
the human prion protein. Proc Natl Acad Sci USA 2000;97:8340–
8345.
43. Shnyrova VL, Villar E, Zhadana GG, Sanchez-Ruiz JM, Quintas A,
Saraiva MJM, Brito RMM. Comparative calorimetric study of non-
amyloidogenic and amyloidogenic variants of the homotetrameric
protein transthyretin. Biophys Chem 2000;88:61–67.
Classification of Conformational Stability
DOI 10.1002/prot PROTEINS 175