Embed Size (px)
Citation preview
67
This is an Open Access article distributed under the terms of
the Creative Commons Attribution Non-Commercial License (http: //creativecommons.org/licenses/by-nc/4.0/) which permits unrestricted non-commercial use, distribution, and reproduction in any medium, provided the original work is properly cited.
Copyright: © 2020 Korean Journal of Agrcultural Science
Korean Journal of Agricultural Science 47(1) March 2020
ANIMAL
Classification of honeydew and blossom honeys by principal component analysis of physicochemical parametersSuk-Ho Choi1,*, Myoung Soo Nam2,*
1Department of Animal Biotechnology, Sangji University, Wonju 26339, Korea2Division of Animal Resource Science, Chungnam National University, Daejeon 34134, Korea
*Corresponding author: [email protected], [email protected]
AbstractThe physicochemical parameters of honey are used to determine the botanic origin of honey and to specify the composition criteria for honey in regulations and standards. The parameters of honeydew and blossom honeys from Korean beekeepers were determined to investigate whether they complied with the composition criteria for honey in the food code legislated by Korean authority and to establish the parameters which should be subjected to principal component analysis for improved differentiation of honeys. The fructose and glucose contents of the honeydew honey did not comply with the composition criteria. The ash content of the honey was closely correlated with CIE a* and CIE L* The principal component analysis of fructose to glucose ratio, CIE a*, CIE L*, ash content, free acidity, and fructose and glucose contents enabled classification of honeydew, chestnut, multifloral, and acacia honeys. Additional advantage of the principal component analysis (PCA) is that the physicochemical parameters, such as fructose to glucose ratio (F/G) and color, can be determined using the analytical instruments for composition criteria and quality control of honey. This study suggested that composition criteria for honeydew honey should be established in the food code in accordance with international standards. The principal component analysis reported in this study resulted in improved classification of the honeys from Korean beekeepers.
Keywords: composition criteria, honey, physicochemical parameter, principal component analysis
IntroductionHoney is a natural sweet substance which is produced by honey bee from various origins,
e.g. nectars of blossoms, secretion of living plants, and excretions of plant sucking insects,
and thus shows diverse physicochemical parameters, e.g. sugars, ash, free acidity, colors,
polyphenols, vitamins, and amino acids. The international standard by Codex Alimentarius
(2001) and the council directive by EU (2002) were established to specify honey type
and composition criteria for honey, which can be sold under given names and the rules
OPEN ACCESS
Accepted: December 24, 2019
Revised: December 10, 2019
Received: November 04, 2019
Citation: Choi SH, Nam MS. 2020. Classification of honeydew and blossom honeys by principal component analysis of physicochemical parameters. Korean Journal of Agricultural Science 47:67-81. https://doi.org/10.7744/kjoas.20190088
pISSN : 2466-2402eISSN : 2466-2410
Korean Journal of Agricultural Science 47(1) March 2020 68
Classification of honeys by principal component analysis
on labeling, presentation, and information on origins. The food code legislated by Ministry of Food and Drug
Safety of Korea (MFDSK, 2019) includes definition, classification, and physicochemical parameters of honey
products. The standards and regulations were established to prevent adulteration and mislabeling of honey and
to protect its safety and quality. However, there are discrepancies between the standards and regulations in the
type of honey and its physicochemical parameters due to different beekeeping conditions among the countries.
Legislations cannot always follow the complexity of honey variations, so there are cases where the parameters of
authentic and unprocessed honey fail to comply with the composition criteria of regulations, so beekeepers are
subject to financial loss in distribution of their products (Thrasyvoulou et al., 2018).
Codex Alimentarius (2001) and EU (2002) classified the types of honeys according to origin into blossom
honey from nectars of plants and into honeydew honey from excretions of plant sucking insects (Hemiptera)
on the living part of plants or from secretions of living parts of plants. Honeydew honey gets attention from
consumers and beekeepers, because of its potential therapeutic potential and claims high market price in Europe
and Asia. However, distribution of honeydew honey in the Korean market may be hindered, because the fructose
and glucose content (F + G) of the honeydew honey has been known to be lower than blossom honey. The food
code established by MFDSK (2019) specifies that the F + G of honey should not be less than 60% regardless
botanic origin. However, Codex Alimentarius (2001) and EU (2002) required that the F + G of blossom honey
and honeydew honey should not be less than 60 and 45%, respectively. Blossom honeys such as chestnut, acacia,
and multifloral honeys are currently distributed and sold at the commercial markets in Korea. Production of
honeydew honey, which has been negligent before, is recently increasing because of longer period of hot dry
weather during summer.
Multivariate analysis of physicochemical parameters has been used widely as alternative criteria to pollen
analysis for classification of honeydew and blossom honeys. Honeydew and chestnut honeys are characterized
with dark color, high values of electrical conductivity, pH, and acidity, and high contents of ash, raffinose,
melezitose, phenolic, and flavonoid. Acacia honey is light colored honey with the physicochemical parameters
opposite to the honeydew and chestnut honeys (Devillers et al., 2004; Pichichero et al., 2009; Kropf et al., 2010;
Pita-Calvo and Vázquez, 2017). Mutifloral honeys show diverse colors from yellow to brown and various
physicochemical parameters depending on the plant species (Bertoncelj et al., 2011).
The objectives of this study were to characterize physicochemical parameters of the honeydew, chestnut,
multifloral, and acacia honeys and to investigate whether the parameters corresponded with the composition
criteria for honeys in the related regulations and whether the principal component analysis of the parameters
differentiated the four types of honeys.
Materials and Methods
Honey sampleThe honey samples used in this study were 10 honeydew, 10 chestnut, 10 multifloral, and 5 acacia honeys
which were produced throughout the regions of South Korea during the years from 2016 to 2017. The samples
Korean Journal of Agricultural Science 47(1) March 2020 69
Classification of honeys by principal component analysis
were the reference honeys purchased from the beekeepers and stored by Korea Beekeeping Agricultural
Cooperative. Their botanic origins were specified by the beekeepers regarding floral sources and were confirmed
by means of sensory analysis including aroma, taste, and, color and carbohydrate composition analysis at the
research laboratory of the cooperative. The honey samples were stored at 4℃. The sugar crystals, if found in the
honey, were solubilized at 40℃.
Moisture contentThe moisture content of honey was determined by using the refractometer for honey moisture (Master-honey,
Atago, Japan).
Free acidityTen grams of honey sample were dissolved in 75 mL of distilled water and titrated with 0.1 N sodium
hydroxide using phenolphthalein as acid base indicator. The free acidity was calculated using the equation 1 as
follows.
Free acidity (meq kg-1) = 0.1 N sodium hydroxide (mL) × factor × 100/10 g (1)
Carbohydrate compositionApproximately one gram of honey was accurately weighed, dissolved in 25 mL of distilled water, and put
into 100 mL volumetric flask. Distilled water was added to the graduation mark. The diluted honey solution was
analyzed using HPLC to determine contents of fructose, glucose, and sucrose. The HPLC system (1200 series,
Agilent, Santa Clara, USA) which was equipped with the carbohydrate column (Waters, Milford, USA) was used
to deliver the elution solvent of acetonitrile and water (75 : 25) with the flow rate of 1 mL/min. The sugars in the
elution solvent were detected using the refractive index detector.
Ash contentApproximately 3 g of honey were accurately put into porcelain crucible vessel and carbonized at 145℃ for 3
h and at 165℃ for 9 h and then ashed at 550℃ for 15 h. The weight of ash was divided with the weight of the
honey to calculate the percentage of ash.
Color analysisThe colors of the honeys were quantified with CIE L * a* b*, which was defined by the Commission
Internationale de l'Eclairage (CIE, International Commission on Illumination) in Robertson (1976). It expresses
color as three values: L* for the lightness from black (0) to white (100), a* from green (-) to red (+), and b* from
blue (-) to yellow (+). The CIE L* a* b* and absorbance of honey were determined following the procedure
described by Bertoncelj et al. (2007). Forty-five gram of honey was placed on a disposable plastic petri dish
with the diameter of 9 cm. The petri dish with the plastic cover was placed on a white paper. The CIE L* a* b*
Korean Journal of Agricultural Science 47(1) March 2020 70
Classification of honeys by principal component analysis
were determined by using the colorimeter (CR-200B, Minolta, Tokyo, Japan). The net absorbance of honey, the
difference between absorbances at 450 nm and 270 nm was measured to determine color spectrophotometrically
following the procedure of Bertoncelj et al. (2007). 50% (w/v) honey solution was centrifuged at 10,000 × g
for 15 min and filtered to remove any coarseㄴ particle and the supernatant was used to measure absorbance at
the wavelength of 450 nm and 270 nm. The net absorbance was calculated by subtracting absorbance at 450 nm
from absorbance at 720 nm. The results were expressed as mAU.
Statistical analysisThe physicochemical parameters of honeys were determined in duplicate. The mean values of the duplicate
measurements were used for statistical analysis. The physicochemical parameters were compared between
honeydew, chestnut, multifloral, and acacia honeys by performing one-way analysis of variance followed by
Duncan�s multiple range test. The Pearson�s correlation coefficients between the parameters were calculated by
performing Pearson product moment coefficient analysis. Honeydew, chestnut, multifloral, and acacia honeys
were differentiated by performing principal component analysis of the physicochemical parameters of the honeys.
The above statistical analyses were performed by using Sigmaplot (version 13, Systat Software, Chicago, USA).
Results and DiscussionThe honeys examined in this study were 10 honeydew, 10 chestnut, 10 multifloral, and 5 acacia honeys which
were selected as reference honeys based on beekeeper�s claim, organoleptic testing, and carbohydrate analysis by
the research laboratory of the Korea Beekeeping Agricultural Cooperative. The fructose and glucose content (F +
G) and fructose to glucose ratio (F/G) were used as key parameters to determine the botanic origins.
Composition criteria for honeyThe composition criteria for honeys were established by the related agencies (Codex Alimentarius, 2001;
EU, 2002; MFDSK, 2019) to facilitate distribution of the honey products without misleading consumers. The
hydroxymethylfurfural (HMF) contents, and stable carbon isotope ratios of all the honeys in this study were less
than 5 mg/kg and - 24 per mille, respectively (results not shown), which indicated that the honeys were fresh
with minimal heat treatment and not adulterated with cane sugar. Codex Alimentarius (2001) and EU (2002)
limited HMF content to 40 mg/kg, whereas MFDSK (2019) limited it to 80 mg/kg. The stable carbon isotope
ratio was determined to detect adulteration of honey with cane sugar. The food code from MFDSK (2019)
specifies that the stable carbon isotope ratio of honey shall not be more than - 22.5 per mille, but there is no limit
set by Codex Alimentarius (2001) and EU (2002).
Table 1 showed that the values of moisture contents and sucrose contents of all the honeys were not more than
20 and 7%, respectively, which indicated that all the honeys were properly concentrated and aged to maintain
shelf stability and acceptable quality. The composition criteria of moisture content and sucrose content for the
honeys specified in the council directive (EU, 2002) are not more than 20 and 5 - 10%, respectively, whereas
Korean Journal of Agricultural Science 47(1) March 2020 71
Classification of honeys by principal component analysis
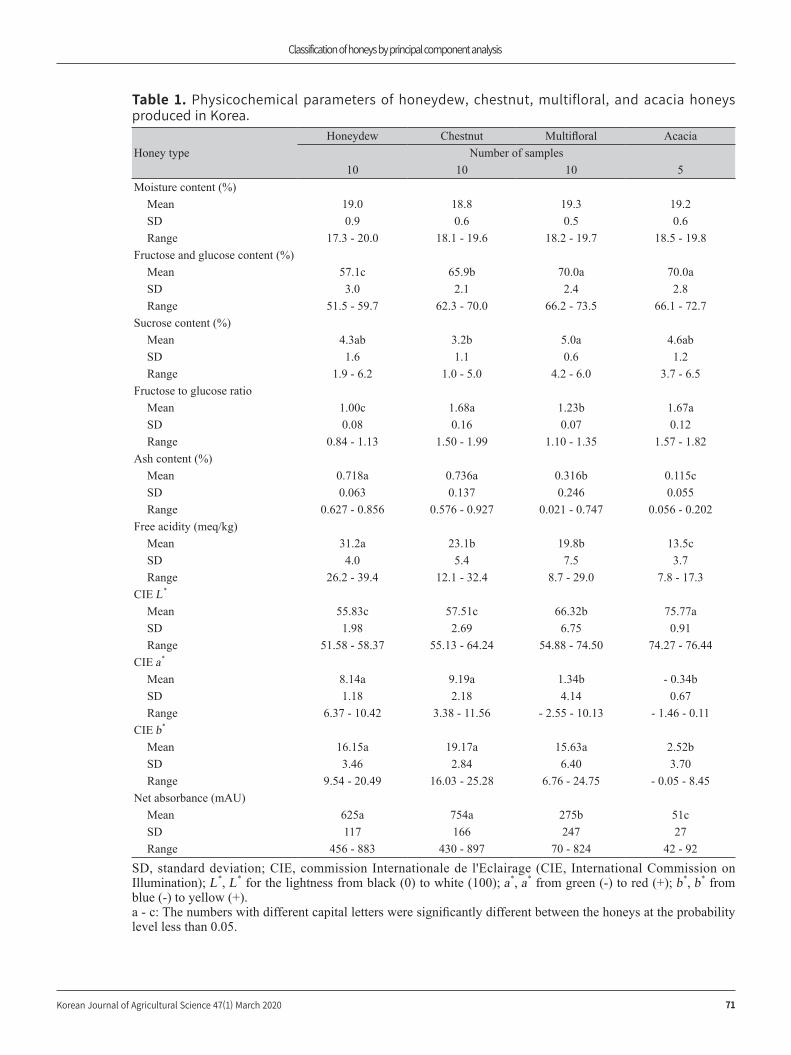
Table 1. Physicochemical parameters of honeydew, chestnut, multifloral, and acacia honeys produced in Korea.
Honey typeHoneydew Chestnut Multifloral Acacia
Number of samples10 10 10 5
Moisture content (%)Mean 19.0 18.8 19.3 19.2SD 0.9 0.6 0.5 0.6Range 17.3 - 20.0 18.1 - 19.6 18.2 - 19.7 18.5 - 19.8
Fructose and glucose content (%)Mean 57.1c 65.9b 70.0a 70.0aSD 3.0 2.1 2.4 2.8Range 51.5 - 59.7 62.3 - 70.0 66.2 - 73.5 66.1 - 72.7
Sucrose content (%)Mean 4.3ab 3.2b 5.0a 4.6abSD 1.6 1.1 0.6 1.2Range 1.9 - 6.2 1.0 - 5.0 4.2 - 6.0 3.7 - 6.5
Fructose to glucose ratioMean 1.00c 1.68a 1.23b 1.67aSD 0.08 0.16 0.07 0.12Range 0.84 - 1.13 1.50 - 1.99 1.10 - 1.35 1.57 - 1.82
Ash content (%)Mean 0.718a 0.736a 0.316b 0.115cSD 0.063 0.137 0.246 0.055Range 0.627 - 0.856 0.576 - 0.927 0.021 - 0.747 0.056 - 0.202
Free acidity (meq/kg)Mean 31.2a 23.1b 19.8b 13.5cSD 4.0 5.4 7.5 3.7Range 26.2 - 39.4 12.1 - 32.4 8.7 - 29.0 7.8 - 17.3
CIE L*
Mean 55.83c 57.51c 66.32b 75.77aSD 1.98 2.69 6.75 0.91Range 51.58 - 58.37 55.13 - 64.24 54.88 - 74.50 74.27 - 76.44
CIE a*
Mean 8.14a 9.19a 1.34b - 0.34bSD 1.18 2.18 4.14 0.67Range 6.37 - 10.42 3.38 - 11.56 - 2.55 - 10.13 - 1.46 - 0.11
CIE b*
Mean 16.15a 19.17a 15.63a 2.52bSD 3.46 2.84 6.40 3.70Range 9.54 - 20.49 16.03 - 25.28 6.76 - 24.75 - 0.05 - 8.45
Net absorbance (mAU)Mean 625a 754a 275b 51cSD 117 166 247 27Range 456 - 883 430 - 897 70 - 824 42 - 92
SD, standard deviation; CIE, commission Internationale de l'Eclairage (CIE, International Commission on Illumination); L*, L* for the lightness from black (0) to white (100); a*, a* from green (-) to red (+); b*, b* from blue (-) to yellow (+).a - c: The numbers with different capital letters were significantly different between the honeys at the probability level less than 0.05.
Korean Journal of Agricultural Science 47(1) March 2020 72
Classification of honeys by principal component analysis
those in the food code (MFDSK, 2019) are not more than 20 and 7%, respectively. The moisture content of more
than 20% may cause microbial growth during distribution and storage of honey. The sucrose content more than
7% may indicate a premature honey in which sucrose from the nectar is not converted properly into fructose and
glucose during aging or reveal possible adulteration with commercial sugar syrup during its production.
The free acidity of honey is a parameter that can assist in assessing deterioration level of honey. Table 1
showed that the mean values of free acidities of the honeydew, chestnut, multifloral, and acacia honeys were
31.2, 23.1, 19.8, and 13.5 meq/kg, respectively. The highest value of free acidity of all the honeydew honeys
was 39.4 meq/kg, which was close to 40 meq/kg, the maximum limit in the food code (MFDSK, 2019). Krauze
and Zalewski (1991) reported that the free acidities of honeydew, multifloral, and acacia honeys from Poland
were 33.12, 27.99, and 15.16 meq/kg, respectively. Devillers et al. (2004) reported that the free acidities of
fir honeydew, chestnut, and acacia honeys were 24.24, 12.20, and 8.954 meq/kg, respectively. Bertoncelj et
al. (2011) reported that the free acidities of honeydew honeys from fir and spruce, forest honeydew honey,
chestnut honey, and acacia honey were 20.1, 30.9, 28.5, 13.3, and 14.4 meq/kg, respectively. These results
as well as our results showed that honeydew honeys generally had higher free acidities than blossom honeys.
Considering high free acidity of honeydew honey, the maximum limit of free acidity established at 40 meq/kg by
MFDSK (2019) shall be changed to 50 meq/kg, which is specified for honeydew honey by Codex Alimentarius
(2001) and EU (2002).
Carbohydrate compositionThe composition of carbohydrate differs between blossom honey and honeydew honey and is a valuable
parameter to differentiate the honeys. Table 1 showed that the mean values of F + G of the acacia, multifloral,
chestnut, and honeydew honeys were 70.0, 70.0, 65.9, and 57.1%, respectively. The mean values of F/G, 1.68
and 1.67, of the chestnut and acacia honeys, respectively, were significantly at the probability level less than
0.05 higher than 1.23 of the multifloral honey, which was then higher than 1.00 of the honeydew honey. It
was noticeable that the standard deviations of F + G and F/G of the multifloral honey were 2.4% and 0.07,
respectively, which were similar with those of the other honeys, even though the multifloral honeys of diverse
colors originated from various plants. These results indicated that the honeydew honey produced in Korea was
not eligible for domestic sale, because its F + G was lower than 60% which is specified in the food code.
Seraglio et al. (2019) reported in their review that the F + G and F/G of honeydew honeys from various
geographical origins and botanical origins ranged from 59.9 to 79.7% and from 1.1 to 2.8, respectively. Rybak-
Chmielewska et al. (2013) reported that the F + G and F/G of Abis alba honeydew honeys from Poland ranged
58.2 - 67.4% and 1.1 - 1.5. The Abis alba honeydew honeys originated from aphids, mainly Cinara pectinatae
(Nordil.), which occurs in temperatures from 25 to 30℃ under favourable weather condition in July and August.
Devillers et al. (2004) reported that the F + G and F/G of the fir honey (n = 57) produced in France was 59.00%
and 1.302, respectively, and the F + G was lower than the other monofloral blossom honeys. Krauze and
Zalewski (1991) reported that the F + G and F/G of honeydew, multifloral, and acacia honeys from Poland were
64.97, 72.60, and 69.09% and 1.101, 1.080, and 1.552, respectively. Ozkok and Sorkun (2018) reported that the
Korean Journal of Agricultural Science 47(1) March 2020 73
Classification of honeys by principal component analysis
F + G and F/G of oak (Quercus frainetto, Ten.) honeydew honey from Turkey ranged from 40.5 to 48.2% and 1.01
to 1.23, respectively. These reports showed that the F + G and F/G of many honeydew honeys were generally
lower than those of blossom honeys.
Several studies (Kim et al., 2014; Jang et al. 2016; Jung and Chon, 2016) showed the carbohydrate
compositions of acacia, chestnut, and multifloral honeys produced in Korea, but there has been no report on
honeydew honey. Jang et al. (2016) analyzed 15 acacia honeys, 15 multifloral honeys, 10 chestnut honeys from
beekeepers and commercial markets in Korea. The F + G and F/G of acacia, multifloral, and chestnut honeys
were 71.2, 71.2, and 63.2% and 1.59, 1.45, and 1.90, respectively. Kim et al. (2014) analyzed honeys from
Korean commercial markets and reported that the F + G and F/G of 10 acacia, 10 multifloral, and 10 chestnut
honeys were 72.79, 67.32, and 65.79% and 1.53, 1.47, and 1.95, respectively. Jung and Chon (2016) analyzed
2,987 acacia, 712 multifloral, and 97 chestnut honeys from Korean beekeepers and reported that the F + G and F/
G of acacia, multifloral, and chestnut honeys were 71.0, 67.5, and 65.9% and 1.49, 1.34, and 1.75, respectively.
These studies as well as our study showed that the F + G of chestnut honeys were consistently lower than acacia
and multifloral honeys and the F/G of chestnut and acacia honey were higher than that of multifloral honeys.
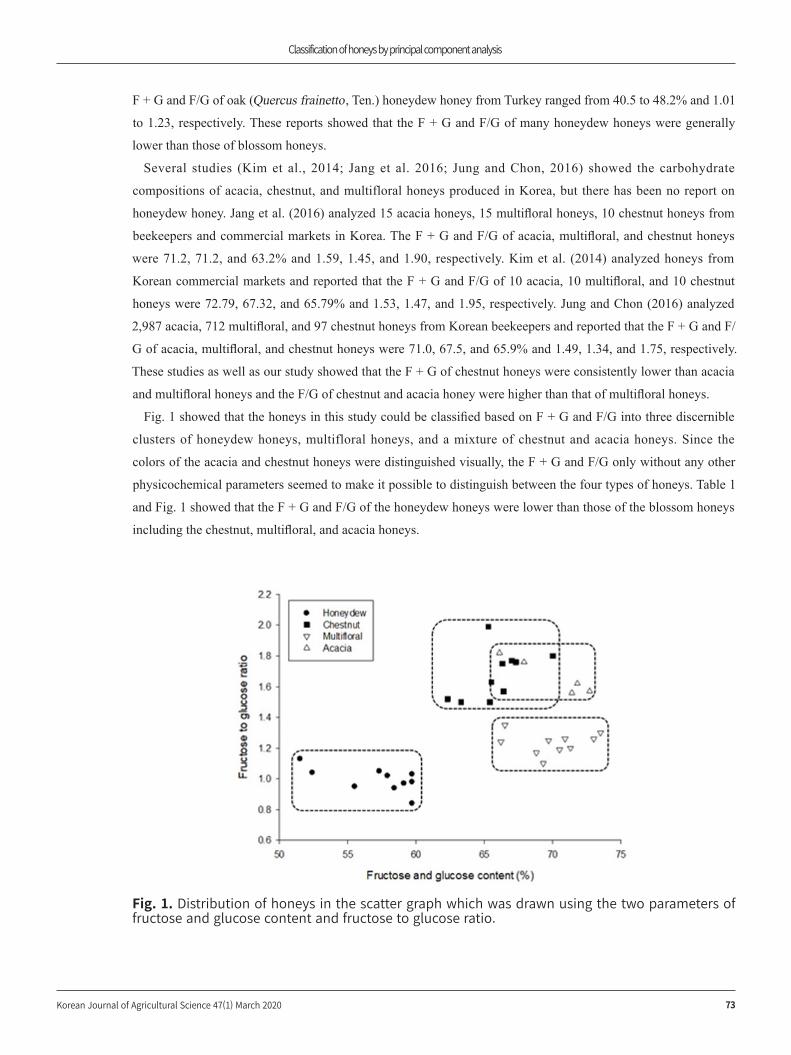
Fig. 1 showed that the honeys in this study could be classified based on F + G and F/G into three discernible
clusters of honeydew honeys, multifloral honeys, and a mixture of chestnut and acacia honeys. Since the
colors of the acacia and chestnut honeys were distinguished visually, the F + G and F/G only without any other
physicochemical parameters seemed to make it possible to distinguish between the four types of honeys. Table 1
and Fig. 1 showed that the F + G and F/G of the honeydew honeys were lower than those of the blossom honeys
including the chestnut, multifloral, and acacia honeys.
Fig. 1. Distribution of honeys in the scatter graph which was drawn using the two parameters of fructose and glucose content and fructose to glucose ratio.
Korean Journal of Agricultural Science 47(1) March 2020 74
Classification of honeys by principal component analysis
The Korea Institute of Animal Products Quality Evaluation (KAPE, 2013) runs the honey grading exhibition
program for improving honey quality and distribution. One of the composition criteria for grading of honey
in the program is F/G. According to the criteria of the program, the F/G of acacia and chestnut honeys and
multifloral honey of premium grade should not be less than 1.5 and 1.3, respectively. It seems that the F/G may
be an indicator for detecting mixing of the blossom honeys with honeydew honeys.
The F/G may also affect the physical characteristics of honeys (Seraglio et al., 2019). In general, crystallization
of honey is slow when F/G is higher than 1.3 and is fast when the ratio is less than 1.0. Thus, the acacia and
chestnut honeys in this study shall be resistant to crystallization and may remain liquid during storage, whereas
the honeydew honey may become solid quickly due to crystallization.
Ash contentAsh content is considered as a quality criterion for botanic origin of honey. The blossom honeys have lower
ash content than honeydew honeys. The ash content of blossom honey is ≤ 0.6%; the value of honeydew or
blend of honeydew and blossom honey or chestnut honey is ≤ 1.2%. Since the ash content is related closely with
electrical conductivity, it is generally replaced by the measurement of electrical conductivity (Ouchemoukh et al.,
2007). The mean values of the ash contents of honeydew, chestnut, multifloral, and acacia honeys in this study
were 0.718, 0.736, 0.316, and 0.115%, respectively (Table 1). Krauze and Zalewski (1991) reported that the ash
contents of honeydew, multifloral, and acacia honeys from Poland were 0.449, 0.226, and 0.033%, respectively.
Kropf et al. (2010) reported that the ash contents of chestnut and acacia honeys from Slovenia were 0.66 - 0.72%
and 0.05 - 0.06%, respectively.
Color analysisVisual comparison, spectrophotometric measurement, and color space, such as CIE L* a* b*, can be useful
complementary tools for determining the botanic origin of honey (Bertoncelj et al., 2007) and for assess mixing
light honey, e.g. acacia honey, with dark honey and vice versa in the honey grading program by KAPE (2013).
The colors of the honeys described by visual observation in this study ranged from pale yellow to dark brown.
The honeydew and chestnut honeys had dark brown color with different level of lightness. The multifloral
honeys had various colors from pale yellow to dark brown. The acacia honeys had various levels of yellow
colors. In this study, the mean value of CIE L* for acacia honey was 75.77 indicating light honey. The honeydew
and chestnut honeys were dark honeys with CIE L* values of 55.83 and 57.51, respectively. The mean value of
CIE a* of the acacia honey were - 0.34 indicating slight greenness. The mean value of CIE a* of the honeydew
and chestnut honey were 8.14 and 9.19, respectively, indicating strong redness. The mean value of CIE b* of
the acacia honey was 2.52 indicating weak yellowness and those of the honeydew and chestnut honey were
16.15 and 19.17, respectively, indicating strong yellowness. The standard deviations and ranges of the CIE color
parameters of the multifloral honey were higher than those of the other honeys. These results indicated that the
color of the acacia honey was light yellow with greenish tinge and those of the honeydew and chestnut honeys
were dark brown with reddish tinge. The multifloral honey had various colors ranging from light yellow with
Korean Journal of Agricultural Science 47(1) March 2020 75
Classification of honeys by principal component analysis
green tinge to dark brown with reddish tinge.
Honey color was also determined by spectrophotometric measurement and net absorbance was calculated by
subtracting absorbance at 450 nm from absorbance at 720 nm. The colors of lights with wavelength at 720 nm
and 450 nm are red and blue, respectively. The net absorbance may indicate level of redness. The mean values
of net absorbance of the honeydew, chestnut, multiflora, and acacia honeys were 625, 754, 275, and 51 mAU,
respectively, meaning that the colors of the honeydew and chestnut honeys had strong redness and the color
of the acacia honeys had slight redness. The high standard deviation and range of the net absorbance for the
multifloral honeys indicated various levels of redness.
Pearson’s correlation coefficientPearson product moment correlation analysis was performed between the parameters shown in Table 1. Several
Pearson�s correlation coefficients in bold letters in Table 2, which were either higher than 0.9 or lower than - 0.9
and also significant at the probability level less than 0.01, were found between the physicochemical parameters,
such as ash content, CIE L*, CIE a*, and net absorbance. The ash content of the honey was strongly correlated
positively with CIE a* and net absorbance and negatively with CIE L*. The results indicated that the honeys with
higher ash contents had darker red colors than those with lower ash contents. These results suggested that either
mineral ion itself or complexes of mineral ion and organic compounds might be responsible for the honey colors,
particularly redness.
The Pearson�s correlation coefficient between CIE a* and CIE L* which was higher than that between CIE b*
and CIE L* suggested that CIE a* might be a better parameter than CIE b* for differentiating the honeys. The
results indicated that color variation from redness to weak greenness was related closely with lightness variation
from black to light. The high correlation coefficients between the net absorbance and the CIE color parameters
indicated that the net absorbance of the honeys might be an alternative parameter to measure honey color.
However, CIE Lab system have advantage to measure a color to get three CIE color parameters of L*, a*, and b*,
which may make it possible to express more accurate color than a single spectrophotometric absorbance value.
Table 2. Pearson’s correlation coefficients among the physicochemical parameters of honeydew (n = 10), chestnut (n = 10), multifloral (n = 10), and acacia (n = 5) honeys.Parameters F + G Sucrose F/G Ash Free acidity CIE L* CIE a* CIE b*
Sucrose 0.166F/G 0.500 ** - 0.384Ash - 0.649 ** - 0.359 - 0.094Free acidity - 0.608 ** - 0.153 - 0.519 ** 0.703 **
CIE L* 0.684 ** 0.358 0.256 - 0.935 ** - 0.780 **
CIE a* - 0.635 ** - 0.380 0.018 0.949 ** 0.637 ** - 0.917 **
CIE b* - 0.199 - 0.251 - 0.143 0.638 ** 0.561 ** - 0.642 ** 0.528 **
Net absorbance - 0.539 ** - 0.479 ** 0.059 0.906 ** 0.583 ** - 0.904 ** 0.939 ** 0.583 **
F + G, fructose and glucose content; F/G, fructose to glucose ratio; CIE, commission Internationale de l'Eclairage (CIE, International Commission on Illumination); L*, L* for the lightness from black (0) to white (100); a*, a* from green (-) to red (+); b*, b* from blue (-) to yellow (+).** significant at the probability level less than 0.01.
Korean Journal of Agricultural Science 47(1) March 2020 76
Classification of honeys by principal component analysis
Principal component analysisPrincipal component analysis (PCA) was performed to evaluate physicochemical parameters for differentiating
the honeydew, chestnut, multifloral, and acacia honeys. Since the moisture contents were not significantly
different between the honeys and the net absorbance was an inferior alternative to the CIE color parameters,
we disregarded the two parameters of moisture content and net absorbance from the PCA. Table 3 showed the
percentages of the total variance which the principal component 1 (PC1) and the principal component 2 (PC2)
accounted for, when the various parameters were subjected to PCA. We screened the parameters which yielded
more than 90% of total variance which the PC1 and PC2 accounted for to obtain accurate distribution of the
data, as described in the manual of the PCA in Sigmaplot. When the three parameters of F/G, CIE a*, and CIE
L* were subjected to PCA, the PC1 and PC2 accounted for 98.56% of the total variance which was the highest of
all the combinations of three parameters (Table 3). The PC1 and PC2 which was obtained from the PCA of six
parameters of F/G, CIE a*, CIE L*, ash content, free acidity, and F + G accounted for 89.38% of the total variance
(Table 3). When the other six parameters which included either sucrose content or CIE b* were subjected to PCA,
the PC1 and PC2 accounted for less than 85% of the total variance and the resultant PCA graph did not show
good separation of the honey clusters (results not shown). Thus, the sucrose content and CIE b* were not used
further for the PCA. The results in Table 3 indicated that F/G, CIE a*, CIE L*, ash content, free acidity, and F + G
were in order of importance as parameters for accurate principal component analysis.
The PCA graph in Fig. 2 showed good separation of the four types of honeys, when the three parameters of F/
G, CIE a*, and CIE L* shown in Table 3 were subjected to PCA. The PC1 had component loadings of 0.250, 0.989,
and - 0.952 of F/G, CIE a*, and CIE L*, respectively, which indicated that the PC1 related weakly positively with
F/G, strongly positively with redness, and strongly negatively with lightness. The PC2 had component loadings
of 0.967, 0.0159, and 0.270 of F/G, CIE a*, and CIE L*, respectively, which indicated that the PC2 related
strongly positively with F/G, very weakly positively with redness, and weakly positively with lightness.
Table 3. The percentages of the total variance for principal component 1 and principal component 2 obtained from the principal component analysis of the physicochemical parameters of the honeys in this study.
Physicochemical parametersPC1 PC2 PC1 + PC2
Percent of the total varianceF/G, CIE a*, CIE L* 64.92 33.64 98.56F/G, CIE a*, ash content 65.08 33.45 98.53F/G, CIE a*, free acidity 60.45 33.91 94.36F/G, CIE a*, F + G 59.98 33.90 93.88F/G, CIE a*, CIE L*, ash content 72.19 25.52 97.71F/G, CIE a*, CIE L*, ash content, free acidity 70.80 23.55 94.15F/G, CIE a*, CIE L*, ash content, free acidity, F + G 68.83 20.55 89.38
PC1, principal component 1; PC2, principal component 2; PC1 + PC2, principal component 1 and principal component 2; F/G, fructose to glucose ratio; F + G, fructose and glucose content; CIE, commission Internationale de l'Eclairage (CIE, International Commission on Illumination); L*, L* for the lightness from black (0) to white (100); a*, a* from green (-) to red (+).
Korean Journal of Agricultural Science 47(1) March 2020 77
Classification of honeys by principal component analysis
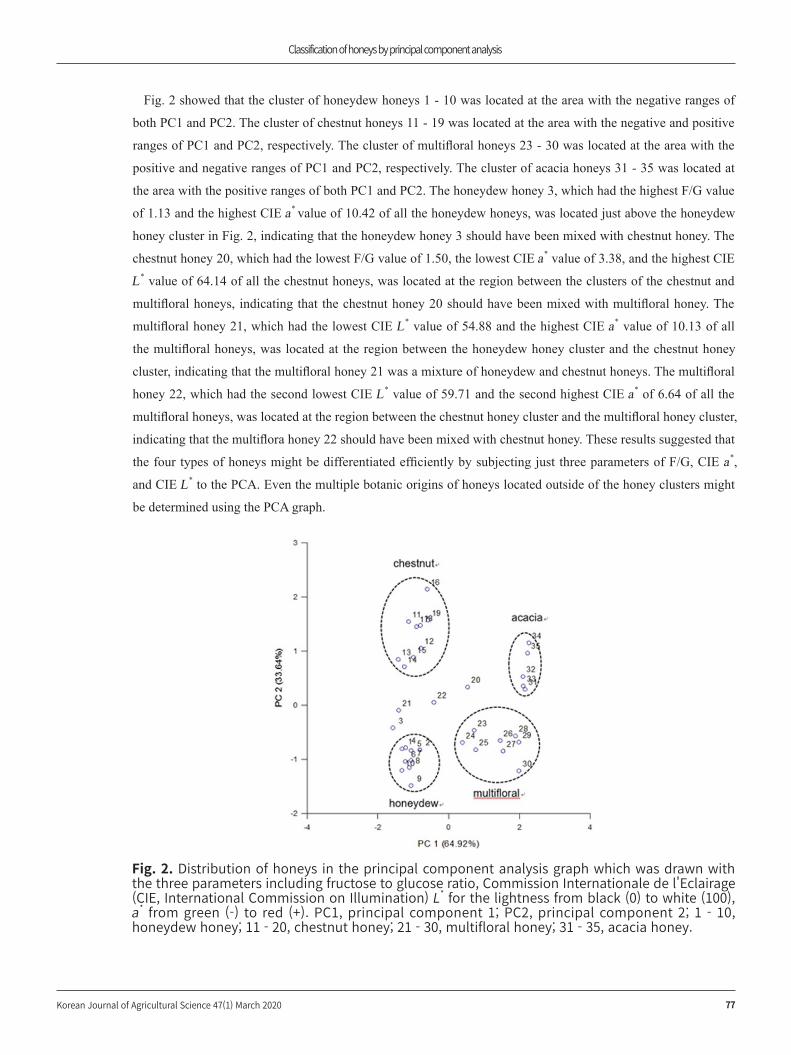
Fig. 2 showed that the cluster of honeydew honeys 1 - 10 was located at the area with the negative ranges of
both PC1 and PC2. The cluster of chestnut honeys 11 - 19 was located at the area with the negative and positive
ranges of PC1 and PC2, respectively. The cluster of multifloral honeys 23 - 30 was located at the area with the
positive and negative ranges of PC1 and PC2, respectively. The cluster of acacia honeys 31 - 35 was located at
the area with the positive ranges of both PC1 and PC2. The honeydew honey 3, which had the highest F/G value
of 1.13 and the highest CIE a* value of 10.42 of all the honeydew honeys, was located just above the honeydew
honey cluster in Fig. 2, indicating that the honeydew honey 3 should have been mixed with chestnut honey. The
chestnut honey 20, which had the lowest F/G value of 1.50, the lowest CIE a* value of 3.38, and the highest CIE
L* value of 64.14 of all the chestnut honeys, was located at the region between the clusters of the chestnut and
multifloral honeys, indicating that the chestnut honey 20 should have been mixed with multifloral honey. The
multifloral honey 21, which had the lowest CIE L* value of 54.88 and the highest CIE a* value of 10.13 of all
the multifloral honeys, was located at the region between the honeydew honey cluster and the chestnut honey
cluster, indicating that the multifloral honey 21 was a mixture of honeydew and chestnut honeys. The multifloral
honey 22, which had the second lowest CIE L* value of 59.71 and the second highest CIE a* of 6.64 of all the
multifloral honeys, was located at the region between the chestnut honey cluster and the multifloral honey cluster,
indicating that the multiflora honey 22 should have been mixed with chestnut honey. These results suggested that
the four types of honeys might be differentiated efficiently by subjecting just three parameters of F/G, CIE a*,
and CIE L* to the PCA. Even the multiple botanic origins of honeys located outside of the honey clusters might
be determined using the PCA graph.
Fig. 2. Distribution of honeys in the principal component analysis graph which was drawn with the three parameters including fructose to glucose ratio, Commission Internationale de l'Eclairage (CIE, International Commission on Illumination) L* for the lightness from black (0) to white (100), a* from green (-) to red (+). PC1, principal component 1; PC2, principal component 2; 1 - 10, honeydew honey; 11 - 20, chestnut honey; 21 - 30, multifloral honey; 31 - 35, acacia honey.
Korean Journal of Agricultural Science 47(1) March 2020 78
Classification of honeys by principal component analysis
When either the four parameters of F/G, CIE a*, CIE L*, and ash content or the five parameters of F/G, CIE
a*, CIE L*, ash content, and free acidity as shown in Table 3 was subjected to the PCA, the percentages of total
variance which PC1 and PC2 accounted for were more than 90%. Thus, the obtained PCA graphs (results not
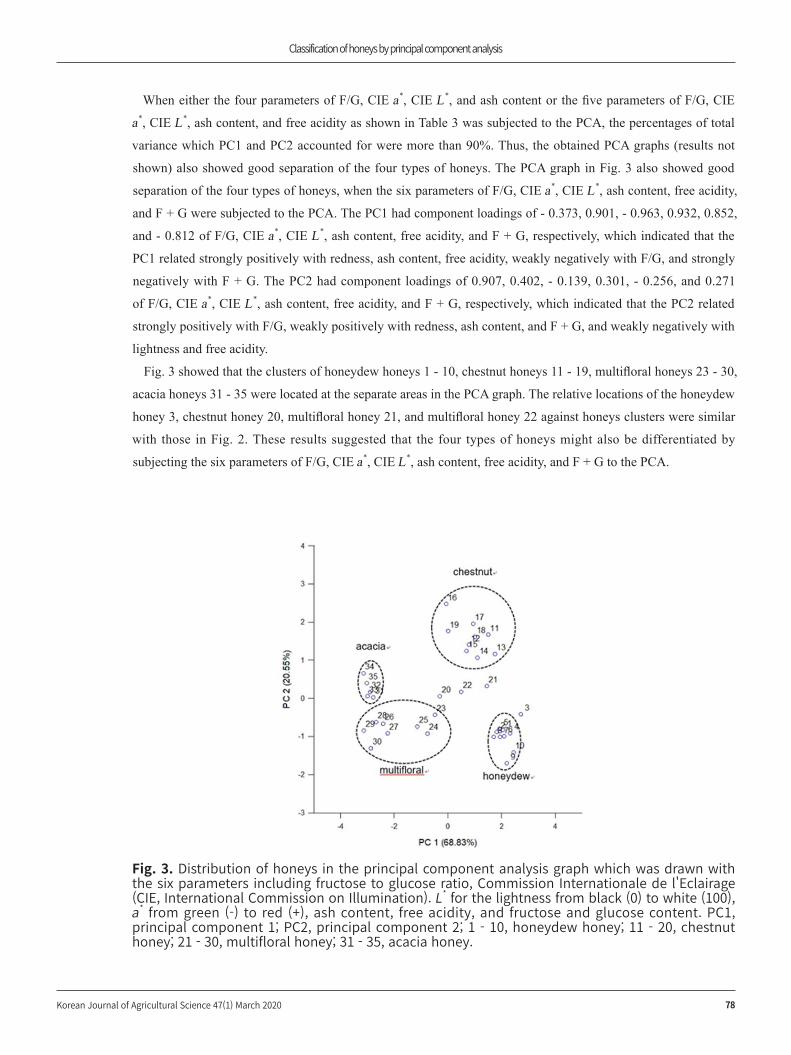
shown) also showed good separation of the four types of honeys. The PCA graph in Fig. 3 also showed good
separation of the four types of honeys, when the six parameters of F/G, CIE a*, CIE L*, ash content, free acidity,
and F + G were subjected to the PCA. The PC1 had component loadings of - 0.373, 0.901, - 0.963, 0.932, 0.852,
and - 0.812 of F/G, CIE a*, CIE L*, ash content, free acidity, and F + G, respectively, which indicated that the
PC1 related strongly positively with redness, ash content, free acidity, weakly negatively with F/G, and strongly
negatively with F + G. The PC2 had component loadings of 0.907, 0.402, - 0.139, 0.301, - 0.256, and 0.271
of F/G, CIE a*, CIE L*, ash content, free acidity, and F + G, respectively, which indicated that the PC2 related
strongly positively with F/G, weakly positively with redness, ash content, and F + G, and weakly negatively with
lightness and free acidity.
Fig. 3 showed that the clusters of honeydew honeys 1 - 10, chestnut honeys 11 - 19, multifloral honeys 23 - 30,
acacia honeys 31 - 35 were located at the separate areas in the PCA graph. The relative locations of the honeydew
honey 3, chestnut honey 20, multifloral honey 21, and multifloral honey 22 against honeys clusters were similar
with those in Fig. 2. These results suggested that the four types of honeys might also be differentiated by
subjecting the six parameters of F/G, CIE a*, CIE L*, ash content, free acidity, and F + G to the PCA.
Fig. 3. Distribution of honeys in the principal component analysis graph which was drawn with the six parameters including fructose to glucose ratio, Commission Internationale de l'Eclairage (CIE, International Commission on Illumination). L* for the lightness from black (0) to white (100), a* from green (-) to red (+), ash content, free acidity, and fructose and glucose content. PC1, principal component 1; PC2, principal component 2; 1 - 10, honeydew honey; 11 - 20, chestnut honey; 21 - 30, multifloral honey; 31 - 35, acacia honey.
Classification of honeys by principal component analysis
Korean Journal of Agricultural Science 47(1) March 2020 79
The traditional method to determine botanical and geographic origin of honey is melissopalynology, the
analysis of pollen in the honey. However, this method is time consuming, requires a specialist, and is unable to
detect intentional pollen contamination. In general, in unifloral honeys, the pollen content should be at least 45%
of the total pollen content, but this is not always the rule. For example, unifloral chestnut honey must contain
more than 90% of chestnut pollen (Arvanitoyannis et al., 2005). Molan (1998) insisted that pollen analysis is
valid only for the determination of geographic origin of honey, while it is less valid for determining the botanical
origin. In some cases, most likely due to above-mentioned limitation of the pollen analysis, studies on the
chemical composition of honey were performed without the pollen analysis. The botanical origin of honey is
based on the claims of local beekeepers, when determination of honey origin is performed by sensory analysis or
by considering the predominant flowers surrounding the hive (Kaškonienė and Venskutonis, 2010).
Principal component analysis of physicochemical data of honey has been used successfully to identify its plant
origin (Maione et al., 2019). Sanz et al. (2005) analyzed thirty honey samples for pH, acidity, water, ash, net
absorbance, total polyphenols, glucose, fructose, melezitiose, and erlose and the resulting data were used in PCA
to characterize the samples in relation to their possible sources (nectar, honeydew, and mixture honeys). They did
not classify the nectar honeys further into monofloral honey. Devillers et al. (2004) used twelve physicochemical
parameters including moisture, HMF, conductivity, diastase activity, pH, free acidity, color, fructose, glucose,
saccharose, erlose, raffinose, and melezitose in PCA to classify 469 honey samples into four clusters in the PCA
of fir honey, chestnut honey, a mixture of heather, rape, and sunflower honeys, and a mixture of lavender and
acacia honeys. Cotte et al. (2004) used seven sugar parameters including glucose, fructose, raffinose, trehalose,
F/G, maltose/trehalose, and erlose/matulose in PCA to classify seven monofloral honeys into five clusters of
fir honey, acacia honey, chestnut honey, a mixture of linden and lavender honeys, and a mixture of rape and
sunflower honeys. They reported that the principal parameter distinguishing acacia and chestnut honeys from
other five honeys was the F/G. The F/G of acacia and chestnut honeys were 1.7 and 1.5, respectively, and the F/
G of five other honeys ranged from 1.0 - 1.3. Raffinose and trehalose contents were the principal parameters to
distinguish fir honey from other six blossom honeys.
In this study, we also show that the F/G is one of the principal parameters in PCA for classification of
honeydew, chestnut, multifloral, and acacia honeys. The PCA in this study requires just three physicochemical
parameters for classification of the honeys. Additional advantage of the PCA in this study is that the
physicochemical parameters, such as F/G and color, can be determined using the analytical instruments for
composition criteria and quality control of honey.
AcknowledgementsThe authors acknowledge the research fund, honey samples, and several analysis data provided by Korea
Beekeeping Agricultural Cooperative.
Classification of honeys by principal component analysis
Korean Journal of Agricultural Science 47(1) March 2020 80
Authors InformationSuk-Ho Choi, https://orcid.org/0000-0001-7759-2954
Myoung Soo Nam, https://orcid.org/0000-0003-0866-1041
References
Arvanitoyannis IS, Chalhoub C, Gotsiou P, Lydakis-Simantiris N, Kefalas P. 2005. Novel quality control methods in conjunction with chemometrics (multivariate analysis) for detecting honey authenticity. Critical Reviews in Food Science and Nutrition 45:193-203.
Bertoncelj J, Doberšek U, Jamnik M, Golog T. 2007. Evaluation of the phenolic content, antioxidant activity and colour of Slovenian honey. Food Chemistry 105:822-828.
Bertoncelj J, Golob T, Kropf U, Korošec M. 2011. Characterization of Slovenian honeys on the basis of sensory and physicochemical analysis with a chemometric approach. International Journal of Food Science and Technology 46:1661-1671.
Codex Alimentarius. 2001. Standard for honey. Codex Stan 12-1981.Cotte JF, Casabianca H, Chardon S, Lheritier J, Grenier-Loustalot MF. 2004. Chromatographic analysis of sugars
applied to the characterization of monofloral honey. Analytical and Bioanalytical Chemistry 380:698-705.Devillers J, Morlot M, Pham-Delegue MH, Dore JC. 2004. Classification of monofloral honeys based on their quality
control data. Food Chemistry 86:305-312.EU (European Union). 2002. Council directive 2001/110/EC of 20 December 2001 relating honey. Official Journal of the
European Communities 10-47.Jang ES, Kim IS, Lee E, Seo HS, Lee EK, Kim KT, Kim JB. 2016. Characterization of traditional Korean unifloral honey
based on the mono-, di-, and trisaccharides. Korean Journal of Food Science and Technology 48:1-8. [in Korean]Jung C, Chon JW. 2016. Quality assessment of honey from different floral origin in Korea. Journal of Apiculture 31:103-
111. [in Korean]KAPE (Korea Institute for Animal Products Quality Evaluation). 2013. Honey grading standard and procedure. Korea
Institute of Animal Products Quality Evaluation. Accessed in https://www.ekape.or.kr/board/list.do#attachdown on 1 May 2019.
Kaškonienė V, Venskutonis PR. 2010. Floral markers in honey of various botanical and geographic origins: A review. Comprehensive Reviews in Food Science and Food Safety 9:620-634.
Kim JY, Song HY, Moon JA, Shin MH, Back SH. 2014. Quality properties of honey in Korean commercial markets. Korean Journal of Food Science and Technology 46:432-437. [in Korean]
Krauze A, Zalewski R. 1991. Classification of honeys by principal component analysis on the basis of chemical and physical parameters. Zeitschrift für Lebensmittel-Untersuchung und Forschung 192:19-23.
Kropf U, Korosec M, Bertoncelj J, Ogrinc N, Necemer M, Kump P, Golob T. 2010. Determination of the geographical origin of Slovenian black locust, lime and chestnut honey. Food Chemistry 121:839-846.
Maione C, Barbosa Jr F, Barbosa RM. 2019. Predicting the botanical and geographical origin of honey with multivariate data analysis and machine learning techniques: A review. Computers and Electronics in Agriculture 157:436-446.
MFDSK (Ministry of Food and Drug Safety of Korea). 2019. Food code. Accessed in http://www.mfds.go.kr/brd/m_211/list.do. on 1 May 2019.
Molan PC. 1998. The limitation of the methods of identifying the floral sources of honeys. Bee World 79:59-68.Ouchemoukh S, Louaileche H, Schweitzer P. 2007. Physicochemical characteristics and pollen spectrum of some
Algerian honeys. Food Control 18:52-58.Ozkok A, Sorkun K. 2018. Characteristic features of oak (Quercus frainetto, Ten.) honey from Turkey. Fresenius Environ
Bull 27:8359-8366.
Classification of honeys by principal component analysis
Korean Journal of Agricultural Science 47(1) March 2020 81
Pichichero E, Canuti L, Canini A. 2009. Characterization of the phenolic and flavonoid fractions and antioxidant power of Italian honeys of different botanical honey. Journal of the Science of Food and Agriculture 89:609-616.
Pita-Calvo C, Vázquez M. 2017. Differences between honeydew and blossom honeys: A review. Trends Food Science and Technology 59:79-87.
Robertson AR. 1976. The CIE 1976 color-difference formulae. Accessed in https://doi.org/10.1002/j. 1520-6378.1977.tb00104. on 7 Feb. 2020.
Rybak-Chmielewska H, Szczęsna T, Was E, Jaśkiewicz K, Teper D. 2013. Characteristics of Polish unifloral honeys IV. Honeydew honey, mainly from Abies alba L. Journal of Apicultural Science 57:51-58.
Sanz ML, Gonzalez M, de Lorenzo C, Sanz J, Martínez-Castro I. 2005. A contribution to the differentiation between nectar honey and honeydew honey. Food Chemistry 91:313-317.
Seraglio SKT, Silva B, Bergamo G, Brugnerotto P, Gonzaga LV, Fett R, Costa ACO. 2019. An overview of physicochemical characteristics and health-promoting properties of honeydew honey. Food Res International 119:44-66.
Thrasyvoulou A, Tananaki C, Goras G, Karazafiris E, Dimou M, Liolios V, Kanelis D, Gounari S. 2018. Legislation of honey criteria and standards. Journal of Apicultural Research 57:88-96.