Embed Size (px)
Citation preview

Classification

Clustering vs ClassificationGenes• Clustering: gene expression similarity suggest that genes have similar functions• Classification: predict a specific (testable) function for a gene with no functional annotation• Example: Gene X is involved in methionine synthesis: if you delete it cells will be unable to synthesize methionine
Samples• Clustering: samples that cluster together are more likely to share clinical parameters• Survival• Activation of signaling pathways• Response to treatment
• Classification: given a gene expression pattern make a prediction about• Survival• Which drug treatment is best

Gene function prediction• Many genes of unknown function• Some information can be learned from sequence: such as domain structure
• This is a kinase, transcription factor, etc –this is often called “Molecular Function”• Phenotypes are harder to predict
• What would happen if this transcription factor was deleted• Possibilities: embryonic lethality, immune abnormalities, nothing
• This if often called “Biological function”
• Need computational methods to assist with functional annotation• Suggest a restricted set of candidate functions that can be experimentally verified • Functional data (such as gene expression) can be used to make predictions about biological function independently from sequence based analysis

The Gene Ontology (GO)• To make new predictions we need a set of examples• Controlled vocabulary for functional annotation• Collaboration between three model organism databases, FlyBase(Drosophila), the Saccharomyces Genome Database (SGD) and the Mouse Genome Database (MGD), in 1998. Now it includes several of the world's major repositories for plant, animal and microbial genomes. • three structured controlled ontologies that describe gene products in terms of their associated biological processes, cellular components and molecular functions in a species independent manner • Terms are organized in a hierarchy for annotation at different levels of detail

Example of the GO hierarchy

Some notes about the general function prediction problem
• Large number of functional classes: thousands (Gene Ontology (GO)) : large multi-‐class classification
• Multiple annotations for each gene: multilabelclassification—classes are not exclusive
• Different level of evidence for functional annotations: labels at different level of reliability
• Hierarchical relationships between functional classes hierarchical relationships between classes (structured output)
• Examples are fundamentally limited by the total number of genes
• Class frequencies are unbalanced, with positive examples usually largely lower than negatives: unbalanced classification
• The notion of “negative example” is not univocally determined: different strategies to choose negative examples
Classical classification problem: classifying hand written digits• Positives and negatives are well defined• Large number of examples: easy to
obtain more• Only 10 classes• Exclusive

Gene function classification• Data based classification problem
• Works like any other classification problem• Genes are examples-‐Data are features• Find a function that maps from features to labels• Each classification task requires a new function
• Network based• Transform functional data into a network that captures relationships among genes• Perform classification on the networks• Advantages
• Network construction is computationally intensive but once constructed can be reused• Can be applied to future unforeseen classification tasks: new function or new phenotype• Some functional data is already in network format—there are no features only relationships
• (Examples: physical and genetic interaction networks)• Natural representation: as gene function is determined by the other genes it associated with
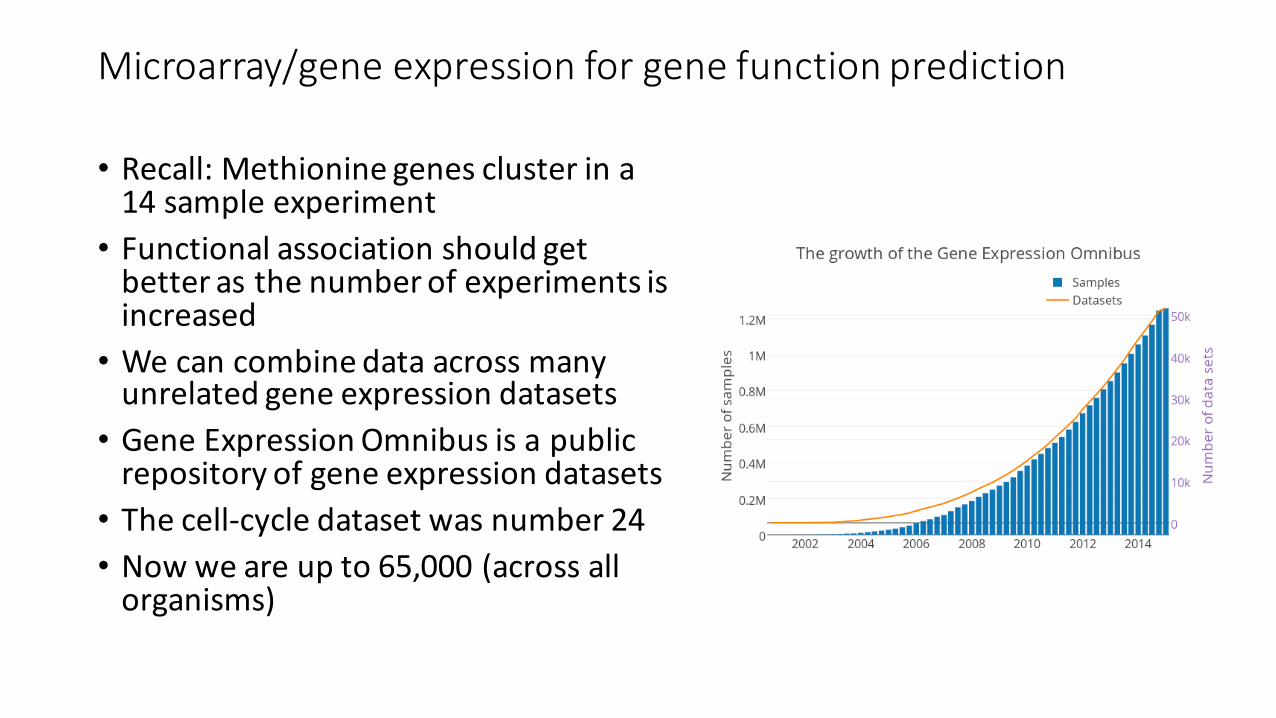
Microarray/gene expression for gene function prediction
• Recall: Methionine genes cluster in a 14 sample experiment• Functional association should get better as the number of experiments is increased• We can combine data across many unrelated gene expression datasets• Gene Expression Omnibus is a public repository of gene expression datasets• The cell-‐cycle dataset was number 24• Now we are up to 65,000 (across all organisms)

Network based methods• Building a network from feature data (i.e. gene expression)• Simple approach-‐-‐ correlate expression vectors for each gene pair• Correlations across multiple experiments can be integrated together, how?
• Concatenate all data• Weighted average-‐many different weighing schemes
• Building a graph that captures functional association well is a hard problem with many solutions
• Making predictions about specific functions given a graph• Guilt by association (GBA)• Label propagation

GBA overview

GBA: one of the first examples• A combined algorithm for genome-‐wide prediction of protein function Nature 1999• Input data includes gene expression patterns• The links suggest that members of the YGR021W family operate in mitochondrial protein synthesis

MouseFunc Competition• Goal predict gene function across GO categories for mouse genes• Internal validation: hold out set• External validation: new functional annotations that were made while the competition was in progress

Methods overviewCompute several kernel matrices (SVM) for each data matrix, train one GO term specific SVM per kernel, and map SVMs' discriminants to probabilities using logistic regression Calibrated ensembles of SVMs
Four different kernels are used per data set. Integration of best kernels and data sources is done using the kernel logistic regression model
Kernel logistic regression
Construct similarity kernels, assign a weight to each kernel using linear regression, combine the weighted kernels, and use a graph based algorithm to obtain the score vector geneMANIA
Train SVM classifiers on each GO term and individual data sets, construct several Bayesian networks that incorporate diverse data sources and hierarchical relationships, and chose for each GO term the Bayes net or the SVM yielding the highest AUC
Multi-‐label hierarchical classification [56] and Bayesian
integration
Combination of an ensemble of classifiers (naïve Bayes, decision tree, and boosted tree) with guilt-‐by-‐association in a functional linkage network, choosing the maximum score
Combination of classifier ensemble and gene network
Code the relationship between functional similarity and the data into a functional linkage graph and predict gene functions using Boltzmann machine and simulated annealing
GeneFAS (gene function annotation system)
Two methods with scores combined by logistic regression: guilt-‐by-‐association using a weighted functional linkage graph generated by probabilistic decision trees; and random forests trained on all binary gene attributes
Funckenstein
Pairwise similarity features for gene pairs were derived from the available data. A Random Forest classifier was trained using pairs of genes for each GO term. Predictions are based on similarity between the query gene and the positive examples for that GO term
Function prediction through query retrieval
Construct an interaction network per data set, merge data set graphs into a single graph, and apply a belief propagation algorithm to compute the probability for each protein to have a specific function given the functions assigned to the proteins in the rest of the graph
Function prediction with message passing algorithms

GeneMANIAGeneMANIA algorithm consists of two parts:
1. An algorithm, based on linear regression, for calculating a single, composite functional association network from multiple network derived from different genomic or proteomic data sources
2. A label propagation algorithm for predicting gene function given this composite network.—searches whole network rather than neighbors

GeneMANIA label propagation algorithm• Input
1. An association network2. A list of nodes with positive labels
• Possibly a list of nodes with negative labels3. Initial label bias values
• Discriminant value assigned to each node by letting the initial label bias propagate through the association network to nearby nodes• Labeled nodes are assigned to +1 and –1• initial bias of unlabeled nodes to be the average bias of the labeled nodes:
(n+ -‐ n-‐)/ (n+ + n-‐)
where n+ is the number of positive and n-‐ is the number of negative examples.

Discriminant values
• Given yi as the vector of gene labels defined above and a network with values wij
• Solve the following objective function:
f = argminf∑(fi – yi)2 + ∑ ∑wij(fi – fj)2
i j
Solved by conjugate gradient method:Iterative method for solving linear systems where taking inverses
is not practical

Real time predictions• GeneMANIA is a webserver for browsing networks• Also works for real time predictions using arbitrary gene seeds

SVM recap
-‐1 plane
+1 plane
εjεk
subject to the following inequality constraints:
For all xi in class + 1
wTx+b ≥ 1-‐ εiFor all xi in class -‐ 1
wTx+b ≤ -‐1+ εi
€
minwwTw2
+ Cεii=1
n
∑
For all i
εI ≥ 0
• We would like to find a hyperplane to separate our negative and positive examples• Arbitrary maximally separating hyperplane can overfit the data
• regularization: maximum margin (the distance between closest correctly classified examples)
• allow for some error

SVM for gene function prediction• Classes very unbalanced• Specific function we have 25 positive examples• All other annotated genes (thousands) can be considered negative• We need to adjust the penalty for misclassification so that the total error on negative examples and total error on positive examples are equal
• Many more features than examples• Kernel trick: rewrite optimization problem in terms of inner products of input feature vectors• We can use Euclidean distance: RBF kernel• Experience show that for many biological problems linear kernel works best• …but we can use the kernel trick to input a network instead of features
For all xi in class + 1
wTx+b ≥ 1-‐ εiFor all xi in class -‐ 1
wTx+b ≤ -‐1+ εi

Using the GO hierarchy to improve SVM predictions
Hierarchical multi-‐label prediction of gene function Bioinformatics

• Probability of SVM output conditioned on the true label is modeled as a Gaussian• Parameters can be inferred from labeled examples

Improvement across the hierarchy
• 105 terms/nodes of the GO BP (model organism S.cerevisiae)• Hierarchical approach improves AUC results on 93 of the 105 GO terms • Darker blue: improvements; darker red: deterioration; white: no change.

Classifying samples based on gene expression
•The promise: given genome wide gene expression we should be able to predict clinical features that are not obvious from symptoms, disease history, or histology
•Disease progression•Drug response
•MammaPrint is an FDA approved diagnostic test to assess the risk that a breast tumor will metastasize to other parts of the body. Actual classifier used is proprietary.• But based on work that led to this diagnostic tool it is likely based on SVMs• The researchers also performed some feature selection since only 70 genes are used by the classifier.

Reducing feature space for SVM classifier• SVM is a very powerful classifier• Problem: uses all the features –each gene has a non-‐zero weight• Reducing the feature space• Popular method: Recursive feature elimination• This method often will include features that on their own don’t have any predictive power
• Alternative methods incorporate statistics about the predictive power of individual features

Many promising findings do not hold up to scrutiny• Microarrays: retracing steps Kevin R Coombes, Jing Wang& Keith A Baggerly• Original study: Using publicly available data, they derived signatures from microarray profiles of the NCI-‐60 human cancer cell lines with known in vitro sensitivity or resistance to a particular drug. They used these profiles to predict in vivo chemotherapeutic response to seven different drugs.• Findings were not reproducible• The lists of genes initially reported in the supplementary information on the Nature Medicine website are wrong because of an 'off-‐by-‐one' indexing error• “When we apply the same methods but maintain the separation of training and test sets, predictions are poor. Simulations show that the results are no better than those obtained with randomly selected cell lines ”
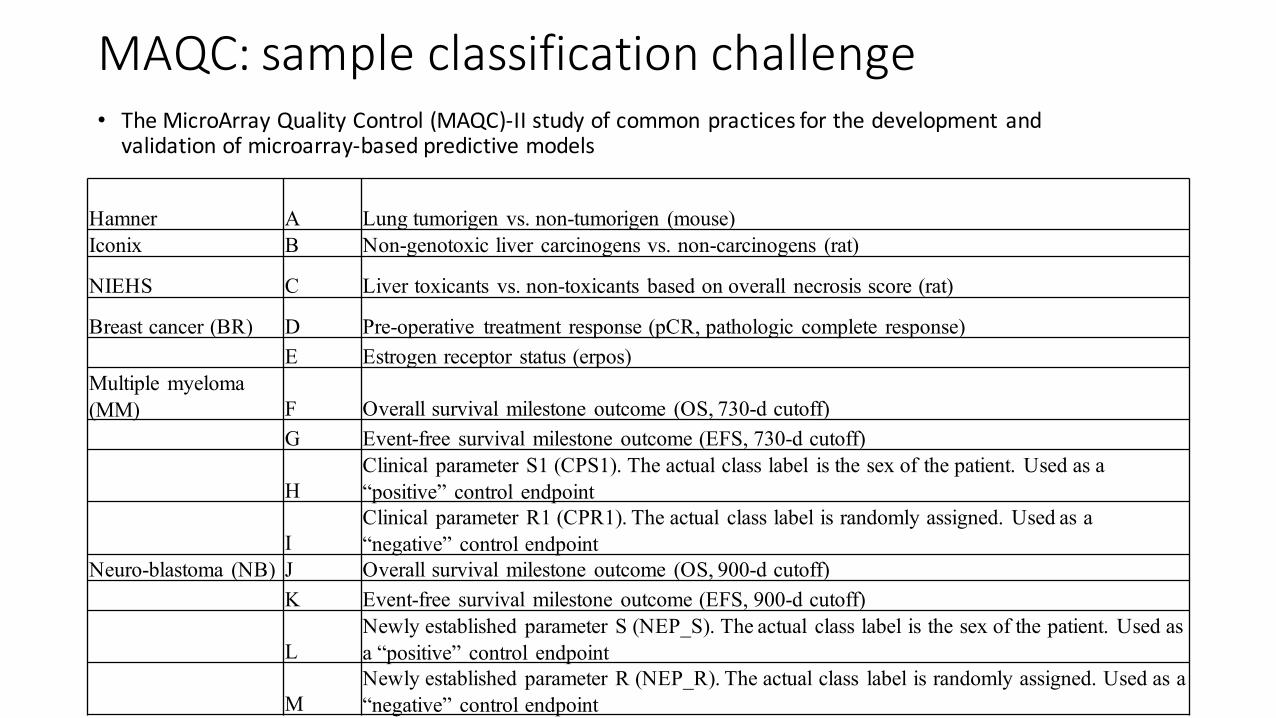
MAQC: sample classification challenge• The MicroArray Quality Control (MAQC)-‐II study of common practices for the development and validation of microarray-‐based predictive models
Hamner A Lung tumorigen vs. non-tumorigen (mouse)Iconix B Non-genotoxic liver carcinogens vs. non-carcinogens (rat)
NIEHS C Liver toxicants vs. non-toxicants based on overall necrosis score (rat)
Breast cancer (BR) D Pre-operative treatment response (pCR, pathologic complete response)E Estrogen receptor status (erpos)
Multiple myeloma (MM) F Overall survival milestone outcome (OS, 730-d cutoff)
G Event-free survival milestone outcome (EFS, 730-d cutoff)
HClinical parameter S1 (CPS1). The actual class label is the sex of the patient. Used as a “positive” control endpoint
IClinical parameter R1 (CPR1). The actual class label is randomly assigned. Used as a “negative” control endpoint
Neuro-blastoma (NB) J Overall survival milestone outcome (OS, 900-d cutoff)K Event-free survival milestone outcome (EFS, 900-d cutoff)
LNewly established parameter S (NEP_S). The actual class label is the sex of the patient. Used as a “positive” control endpoint
MNewly established parameter R (NEP_R). The actual class label is randomly assigned. Used as a “negative” control endpoint

Results• Internal validation: cross-‐validation, a part of the same dataset is held out• External validation: data collected on different subjects possibly at at a different time and with a different protocol• MCC=Mathew correlation coefficient• Often preferred for unbalanced classes

Results on external validation

Conclusions from the study• Study end point was the most important factor• Some tasks were easy and some were hard• Model consistency, as measured by the overlap between selected genes across two independent datasets, and biological validity, are the genes known to be biologically relevant, correlated with prediction accuracy
• Team proficiency was an important factor• Industry teams did best• Some teams made simple errors
• Careful unbiased internal cross-‐validation is important• A portion of the dataset should be held out for the entire classification pipeline including feature selection

Some more details• Loess normalization is best!• Partially confounded with end point so may not be conclusive
• Discriminant analysis had the most positive effect• Recursive feature elimination did not do well

Possible interpretation• Simple models seem to do better
• DA is better than SVM-‐RFE
• External validation: data distribution can be quite different• Different noise profiles• Different batch effects
• Powerful classifiers can capture more dataset specific structure that is irrelevant in another dataset

LOESS regression• locally weighted scatterplot smoothing• Fit a polynomial locally—the polynomial fit determines the value at each point• Almost always first or second degree polynomial
• Only a subset of the data is used for each fit• Fraction of data used is often called the span• Controls the degree of smoothing
• combines much of the simplicity of linear least squares regression with the flexibility of non linear regression

Applied to normalization
• Transform X-‐Y scatter plot into an (X+Y)/2 and (X-‐Y) plot• Apply Loess regression to make the local average 0• Will work well on smaller experiments when quantilenormalization is undesirable (if we have a few hundred measurements)

Sample classification summary• Data is limited by our ability to collect samples• Still have many more features than training example
• Validation datasets may look very different from the training datasets• Biological validity of the classifier is a good predictor of performance on independent data