Embed Size (px)
Citation preview
Classifications of Countries Based on Their Level of Development: How it is Done and How
it Could be Done
Lynge Nielsen
WP/11/31
© 2011 International Monetary Fund WP/11/31
IMF Working Paper
Strategy, Policy, and Review Department
Classifications of Countries Based on Their Level of Development: How it is Done and How it Could be Done
Prepared by Lynge Nielsen1
Authorized for distribution by Catherine Pattillo
February 2011
Abstract
The paper analyzes how the UNDP, the World Bank, and the IMF classify countries based on their level of development. These systems are found lacking in clarity with regard to their underlying rationale. The paper argues that a country classification system based on a transparent, data-driven methodology is preferable to one based on judgment or ad hoc rules. Such an alternative methodology is developed and used to construct classification systems using a variety of proxies for development attainment.
JEL Classification Numbers: O10, O15, O19
Keywords: Country classification systems, developing countries, developed countries
Author’s E-Mail Address:[email protected]
1 Special thanks are due to Russell Kincaid who provided extensive commentary on earlier drafts. I would also like to thank Pedro Conceicao, Sarwat Jahan, Namsuk Kim, Heloisa Marone, Samar Maziad, Prachi Mishra, Catherine Pattillo, Barry Potter, Martin Ravallion, Luca Ricci, Francisco Rodriguez, Mick Silver, Eric Swanson, and Yanchun Zhang for useful comments and inputs. The usual disclaimer applies.
This Working Paper should not be reported as representing the views of the IMF. The views expressed in this Working Paper are those of the author(s) and do not necessarily represent those of the IMF or IMF policy. Working Papers describe research in progress by the author(s) and are published to elicit comments and to further debate.
2
Contents Page
I. Introduction ............................................................................................................................3
II. Development, Development Taxonomies, and Development Thresholds ............................5
III. International Organizations’ Country Classification Systems .............................................7 A. United Nations Development Programme’s Country Classification System ...........8 B. The World Bank’s Country Classification Systems ..................................................9 C. The IMF’s Country Classification Systems ............................................................14 D. Comparison of Approaches .....................................................................................18
IV. An Alternative Development Taxonomy Methodology ....................................................19
V. Examples of Alternative Development Taxonomies ..........................................................32
VI. Concluding Remarks .........................................................................................................41 Tables 1. The World Bank's Operational Income Thresholds .............................................................12 2. The World Bank's Analytical Income Thresholds ...............................................................14 3. Country Classification Systems in Selected International Organizations ............................19 4. Country Classifications in Selected International Organizations ........................................20 5. Trichotomous Development Taxonomies (Population Weighted) ......................................33 6. Trichotomous Development Taxonomies (Equally Weighted) ...........................................37 Figures 1. Dichotomous Development Taxonomy ...............................................................................27 2. Trichotomous Development Taxonomy ..............................................................................28 3. Development Taxonomies ...................................................................................................31 References ................................................................................................................................42 Appendix ..................................................................................................................................44
3
“There are two kinds of people in the world: those who divide the world into two kinds of people, and those who don't.”
- Robert Benchley
I. INTRODUCTION
The Kuhnian view of (normal) scientific progress is the result of productive discourse among people who share a common understanding of the basic building blocks of their chosen field of study. In most fields an important part of this shared common understanding—the broadly agreed paradigm—is classifications. While the importance of classifications varies from field to field, their ubiquity is testimony to their usefulness. For example, the IMF defines balance of payments transactions as occuring between residents and non-residents of countries, where a resident is defined as an economic unit with a center of economic interest in the country of one year or longer. A one year length of stay in a country is an objective, if arbitrary, benchmark for resident status as an economic but not legal concept. This simple definition facilitates the construction of internationally comparable balance of payments data because the resident/non-resident definition is broadly accepted among national statistical agencies charged with compiling balance of payments data. In constrast, when it comes to classifying countries according to their level of development, there is no criterion (either grounded in theory or based on an objective benchmark) that is generally accepted. There are undoubtedly those who would argue that development is not a concept that can provide a basis upon which countries can be classified. While difficult conceptual issues need to be recognized, the pragmatic starting point of this paper is that there is a need for such classifications as evidenced by the plethora of classifications in use. There are large and easily discernable differences in the standard of living enjoyed by citizens of different countries. For example, in 2009 a citizen in Burkina Faso earned on average US$510 as compared to US$37,870 for a Japanese citizen, and while in Burkina Faso 29 percent of the adult population was literate and a new-born baby could expect to live 53 years, virtually all adults in Japan were literate and a Japanese new-born baby could expect to live 83 years.2 To make better sense of such differences in social and economic outcomes, countries can be placed into groups. Perhaps the most famous example thereof is that of labeling countries as either developing or developed. While many economists would readily agree that Burkina Faso is a developing country and Japan is a developed country, they would be more hesitant to classify Malaysia or Russia. Where exactly to draw the line between developing and developed countries is not obvious, and this may explain the absence of a generally agreed criterion. This could suggest that a developing/developed country dichotomy is too restrictive and that a classification system with more than two categories could better capture the diversity in development outcomes across countries.
2 World Bank: World Development Indicators, October 2010.
4
Another possible explanation for the absence of a generally accepted classification system is the inherent normative nature of any such system. The word pair developing/developed countries became in the 1960s the more common way to characterize countries, especially in the context of policy discussions on transfering real resources from richer (developed) to poorer (developing) countries (Pearson et al, 1969). Where resource transfers are involved countries have an economic interest in these definitions and therefore the definitions are much debated. As will be discussed later, in the absence of a methodology or a consensus for how to classify countries based on their level of development, some international organizations have used membership of the Organization of Economic Cooperation and Development (OECD) as the main criterion for developed country status. While the OECD has not used such a country classification system, the preamble to the OECD convention does include a reference to the belief of the contracting parties that “economically more advanced nations should co-operate in assisting to the best of their ability the countries in process of economic development.” As OECD membership is limited to a small subset of countries (it has 34 members up from 20 members at its establishment in 1961), this heuristic approach results in the designation of about 80–85 percent of the world’s countries as developing and about 15–20 percent as developed. An explicit system that categorizes countries based on their development level must build on a clearly articulated view of what constitutes development. In addition, there must be a criterion to test whether countries are developing or developed. A classification system ordering countries based on their level of development is termed a development taxonomy and the associated criterion is called the development threshold. The paper uses the developing/developed country terminology in recognition of its widespread use and not because it is considered appropriate.3 As shown above with the examples of Malaysia and Russia, it may not be appropriate to fit countries into the constriction of a dichotomous classification framework. Taxonomies with more than two categories will therefore also be discussed. Development, of course, is a concept that is difficult to define and the paper first briefly explores some aspects of the concept to better appreciate the challenges faced when one constructs a development taxonomy. However, the focus of the paper is on taxonomies, given a definition of development, and not on the concept of development per se. The paper then goes on to compare and contrast the development taxonomies used by the United Nations Development Programme (UNDP), the World Bank (Bank), and the IMF (Fund) and against this background an alternative development taxonomy is proposed.
3 The literature is replete with competing terminologies; examples include poor/rich, backward/advanced, underdeveloped/developed, undeveloped/developed, North/South, late-comers/pioneers, Third World/First World, and developing/industrialized. For the purpose of this paper any terminology is as good as any other.
5
II. DEVELOPMENT, DEVELOPMENT TAXONOMIES, AND DEVELOPMENT THRESHOLDS
The development concept first needs defining, but unfortunately no simple definition exists. Classical economists were mostly preoccupied with what is now termed economic development in the sense of sustained increases in per capita real income, and neoclassical economists paid scant attention to the issue altogether. (Schumpeter being a notable exception) After the Second World War, decolonization led to the emergence of many new independent countries and development economics emerged as a distinct subfield of economics. In the New Palgrave: A Dictionary of Economics’ overview article on Development Economics, Bell (1989) used ‘pioneers’ and ‘latecomers’ as an organizing framework given that newly independent countries started out poor in a world in which there were already rich countries. Economic development was seen as a process where latecomers catch up with pioneers. Academic interest became directed toward understanding not only the large income differences across countries, but also inter-country diversities in terms of social outcomes, culture, production structures, etc. While income differences remained a core focus, economists increasingly came to view development as a multifaceted problem. The keen academic interest in development issues after the Second World War was matched by an equally keen political interest in the subject matter in the newly-founded United Nations (UN). While the impetus behind establishing the UN was to put in place a durable framework for international security, the preamble of the UN Charter also included calls for the organization to “promote social progress and better standards of life in larger freedom.” In 1952, the UN General Assembly called for the “working out of adequate statistical methods and techniques so as best to facilitate the gathering and use of pertinent data in order to enable the Secretary-General to publish regular annual reports showing changes in absolute levels of living conditions in all countries.”4 In response, the UN Secretariat convened an expert group that issued a Report on International Definition and Measurement of Standards and Levels of Living (UN, 1954). As the title indicates, a distinction was drawn between standards of living (a normative concept) and levels of living (a positive concept). Although the report considered that “measurements of differences and changes in levels of living could be carried out satisfactorily without reference to norms” (page 3), it recognized that positive measures of levels of living must reflect generally-accepted aims for social and economic policy at the international level in particular areas such as health, nutrition, housing, employment, education, etc. The UN report is remarkable not for what it achieved in terms of measuring countries’ economic and social achievements (its results in that regard were rather modest), but for its thorough treatment of the normative and positive dimensions of the problem. Half a century later it is difficult to discern any progress at the conceptual level. However, tremendous progress has been made in national account compilation practices and more realiable purchasing power parities (PPP) have become available and for a broader set of countries. Insofar as per capita income can serve as a proxy for development,
4 UN General Assembly Resolution 527 (VI), 26 January 1952.
6
as measured by various social indicators (such as longevity, educational attainment, health, etc.), it is now possible to construct such inter-country measures. Over time, the focus of development economics has shifted. For instance, Sen (1999) argues that development expands freedom by removing unfreedoms—e.g., hunger and tyranny—that leave people with little choice and opportunity. This humanistic approach to development leads one to explore what constitutes acceptable minimum living conditions. For example, an acceptable minimum economic standard could include a person’s ability to consume sufficient nutrients to avoid being malnourished and to live in a dwelling with certain basic characteristics (in terms of access to potable water, artificial light, size, etc.). By costing this standard of living, the minimum income needed to achieve the standard can be determined. Such calculations are known as (absolute) poverty lines. Individuals (or households) with an income below the poverty line are designated as poor and those with an income above the line are designated as non-poor. As prices and politically acceptable minimum living standards vary greatly from country to country poverty lines are country-specific, which hampers comparisions of poverty outcomes across countries. A global poverty line can be approximated by using an average of country-specific poverty lines found among the poorer developing countries (the sample cut-off is inevitably arbitrary). The World Bank has taken the lead in establishing such a global poverty line on the basis of which internationally comparable poverty rates can be estimated. For instance, in the World Development Report 2000/2001, the Bank estimated that 1.3 billion people in 1993 were below a poverty line of PPP US$1.08 per day. Empirical work of this nature has informed policy debate on poverty issues. In 2000, the UN General Assembly adopted the Millennium Declaration. The declaration included a reference to the global policy intent “to halve, by the year 2015, the proportion of the world’s people whose income is less than one dollar a day,” 5 and this then became part of the UN Secretariat’s first Millennium Development Goal to halve the global poverty rate from 1990 to 2015. In a recent contribution, Chen and Ravallion (2010) provide revised poverty estimates for the period 1981–2005. This study incorporates new PPP estimates from the 2005 International Comparison Program and draws on the significantly expanded number of national poverty lines now available. At a poverty line of 2005 PPP US$1.45 per day (equivalent in real terms to the 1993 PPP US$1.08 per day), Chen and Ravallion estimate that there were 2.2 billion poor people in 1993. Thus, the number of poor people in the early 1990s appears to have been significantly larger than believed when the Millennium Declaration was adopted. At a global poverty line of PPP US$1–2 per day poverty in richer countries is insignificant. Thus, developed countries could be defined as countries with negligible poverty at such a poverty line. The taxonomy would dovetail nicely with the development community’s 5 Paragraph 19 in UN General Assembly Resolution 55/2 of 18 September 2000. The full text of the resolution is contained in document A/RES/55/2 available on the UN’s website (www.un.org).
7
current strong focus on poverty issues. A drawback is that internationally comparable poverty data are not very precise and are subject to large revisions as noted above. A bigger problem with a poverty-based development taxonomy, however, is that the required data are not drawn directly from official country sources. This makes the taxonomy less tractable and thus more difficult to gain acceptance. A simple taxonomy is based on per capita income data. An equally simple taxonomy would use a single social indicator. Life expectancy at birth would probably be among the stronger contenders. To reflect the multifaceted aspect of development, consideration could also be given to constructing composite indices of various economic and social indicators. A separate, but equally pertinent issue, is how to construct the development threshold. A threshold can either be absolute or relative. An absolute threshold has a value that is fixed over time. A relative threshold is based on contemporaneous outcomes. An absolute threshold provides a fixed goal post. The Millennium Development Goals are cast mostly as absolute thresholds. However, a relative threshold captures changes in expectations and values. For example, if in 1950, an absolute development threshold had been established based on life expectancy at birth with a threshold value of 69 years (the life expectancy in the US in 1950), Sri Lanka would now be classified as a developed country. While observers of vintage 1950 may have been comfortable with such a classification of Sri Lanka, current day observers may not be. The final step in constructing the taxonomy is to decide on the numerical value of the threshold. Countries above the x percentile could be designated as developed with remaining countries considered as developing. Alternatively, countries that have achieved a development outcome within y percent of the most advanced country could be designated as developed with remaining countries considered as developing. Any particular threshold would undoubtedly invite questions about how it had been determined and it could reasonably be expected that the designer of the taxonomy would provide a rationale for the threshold.
III. INTERNATIONAL ORGANIZATIONS’ COUNTRY CLASSIFICATION SYSTEMS
Over the years, the UN General Assembly has debated country classification issues. For example, in 1971 the General Assembly identified a group of Least Developed Countries to be afforded special attention in the context of implementing the second UN Development Decade for the 1970s. Follow-up UN conferences have monitored progress in addressing the development challenges in these countries. The current list includes 49 countries. However, the General Assembly has never established a development taxonomy for its full membership. In contrast, international organizations have established such taxonomies, and
8
in this section the development taxonomies used by three such organizations—the UNDP, the World Bank, and the IMF—are explored.6
A. United Nations Development Programme’s Country Classification System
The UNDP’s country classification system is built around the Human Development Index (HDI) launched together with the Human Development Report (HDR) in 1990. To capture the multifaceted nature of development, the HDI is a composite index of three indices measuring countries’ achievements in longevity, education, and income. Other aspects of development—such as political freedom and personal security—were also recognized as important, but the lack of data prevented their inclusion into the HDI. Over the years, the index has been refined, but the index’s basic structure has not changed. In the HDR 2010, the income measure used in the HDI is Gross National Income per capita (GNI/n) with local currency estimates converted into equivalent US dollars using PPP. Longevity is measured by life expectancy at birth. For education, a proxy is constructed by combining measures of actual and expected years of schooling. Measures of achievements in the three dimensions do not enter directly into the sub-indices, but undergo a transformation. The basic building block of all sub-indices is:
X = (Xactual – Xmin)/(Xmax – Xmin), where the maximum values are set to the actual observed maximum values over the 1980-2010 period. The minimum value for education is set at zero, for longevity at 20 years and for income at US$163 (the income level in Zimbabwe in 2008 which is the minimum observed income level). These maximum and minimum values ensure that the values of the sub-indices are bounded between zero and one. While the formulation of each sub-index is fairly involved, the construction of the aggregate HDI is a straigthforward geometric averaging of the three sub-indices. The HDI is therefore also bounded between zero and one. In the HDR 1990 countries were divided into low-, medium-, and high-human development countries using threshold values 0.5 and 0.8. In the HDR 2009, a fourth category—very high human development—was introduced with a threshold value of 0.9. No explanations for these thresholds were provided in either the 1990 or the 2009 report. The HDR 1990 also designated countries as either industrial or developing (at times the terminology of ‘north’ and ‘south’ was used as well). The report did not indicate the origin of the designations. The industrial country grouping was with a single exception a subgroup of the high human development country category.7 By the time of the HDR 2007/08, the industrial country grouping had been replaced by: (1) member countries of the OECD and (2) countries in
6 The UNDP is a subsidiary body of the UN established pursuant to a UN General Assembly resolution. The World Bank and IMF are UN specialized agencies. 7 The exception was Albania which had an HDI of 0.79.
9
Central or Eastern Europe or members of the Commonwealth of Independent states, while the developing countries group was retained. This presentation, however, had partially overlapping memberships; for example, OECD members Mexico and Turkey were also designated as developing countries and the Central/Eastern European countries of Czech Republic, Hungary, Poland, and Slovakia were also members of the OECD. In the HDR 2009 these overlapping classifications were resolved by introducing the new category “developed countries” consisting of countries that have achieved very high human development; other countries were designated as developing. The distinction between developing and developed countries was recognized as “somewhat arbitrary.” In the HDR 2010, absolute thresholds were dropped in favor of relative thresholds. In the new classification system, developed countries are countries in the top quartile in the HDI-distribution, those in the bottom three quartiles are developing countries. The report did not provide an explanation for this shift from absolute to relative thresholds nor did it discuss why the top quartile is the appropriate threshold. The UNDP uses equal country weights to construct the HDI distribution; in this distribution, 15 percent of the world’s population lives in designated developed countries. The report did not discuss this choice of weights.
B. The World Bank’s Country Classification Systems
The classification systems in the World Bank are utilized both for operational and analytical purposes. The operational country classification system preceded the analytical classification system, which draws upon the operational system. Operational classifications The World Bank’s International Bank for Reconstruction and Development (IBRD) has a statutory obligation to lend only to credit-worthy member countries that cannot otherwise obtain external financing on reasonable terms.8 This obligation required the IBRD to designate a subset of its membership as eligible borrowers. Determination of eligibility was initially judgmental, but in the early 1980s, the IBRD moved toward a more rule-based system using a GNI/n criterion.9 Under this system, countries that borrow from the IBRD and exceed a certain income threshold engage in a process that moves the country to non-borrowing status (when the process is completed the country is said to have ‘graduated’ from IBRD-borrowing). With the establishment in 1960 of its concessional financing entity, The International Development Association (IDA) the World Bank identified two lists of IDA member
8 Article 1 (ii) and Article III, Section 4 (ii) of the IBRD Articles of Agreement. 9 While the introduction in the early 1980s of a GNI/n criterion helped clarify eligibility requirements, an informal threshold had been in place since 1973 (when it was set at US$1,000 in 1970-prices).
10
countries. Part 1 countries were expected to contribute financially to IDA and Part 2 countries were other countries of which only a subset could be expected to draw on the concessional resources.10 What was the basis for assigning a country to either Part 1 or Part 2?
“Well, this presented the Bank with an interesting and rather difficult question. A large number of economic criteria were made available by the Bank, the amount of capital exported by the country, the gross national product of the country, and various other things of that sort. These were reviewed by the Board of Directors. But, in the ultimate analysis, the management of the Bank was invited to present a list of those countries which, in their opinion, and based on the background [work] of the World Bank, should be in category I and those which should be in category II. The management presented this list, and the various executive directors who were negotiating the charter discussed it and agreed that this was an adequate list.”11
As the quote makes clear, the partitioning was a political exercise: a civilized understanding among sovereign countries about how to label each other. However, the partition followed a per capita income criterion with a few exceptions. Exceptions included Spain, which stated that it was flattered to be asked to be in Part 1 but did not consider it belonged there, and Japan (a capital exporter) that was placed in Part 1 despite its relatively low per capita income level (Mason and Asher, 1973). While an income criterion was not used to demarcate Part 1 and Part 2 countries, it was decided in 1964—at the time of the first IDA replenishment of resources and against the background of a rapidly increasing membership—to establish an income threshold as a test for eligibility to access IDA resources.12 In the 1970s operational guidelines used GNI/n thresholds as the basis for determining preferential assistance based on Bank research that had found “a stable relationship between a summary measure of well-being such as poverty incidence and infant mortality on the one hand and economic variables including per capita GNI estimated based on the Bank’s Atlas method on the other.”13 After the thresholds had been established, they were then adjusted
10 During the negotiations for the establishment of the IDA, there had been intermittent support for creating three categories of members, but in the end the two-category model prevailed (Mason and Asher, 1973). Presumably, a three category model would have identified the subset of countries that would neither be obligated to contribute to nor be eligible to benefit from the Association’s financial resources. 11 T. Graydon Upton, US Executive Director to the World Bank in testimony to the Committee on Foreign Relations of the United States Senate, March 18, 1960 (Hearings on S. 074 to provide for the participation of the US in the IDA, 86th Congress 2nd session, pages 22–23). The quotation is taken from page 391 in Mason and Asher (1973). 12 The threshold was initially set at an annual per capita income level of US$250, but throughout the 1960s the threshold was not rigidly adhered to as several countries with income levels of up to US$300 accessed IDA resources. 13 The quotation is from the World Bank’s website available at http://web.worldbank.org/WBSITE/EXTERNAL/DATASTATISTICS/0,,contentMDK:20487070~menuPK:64133156~pagePK:64133150~piPK:64133175~theSitePK:239419~isCURL:Y,00.html. In order to reduce the impact of exchange rate fluctuations, the World Bank converts domestic currency national account estimates
(continued…)
11
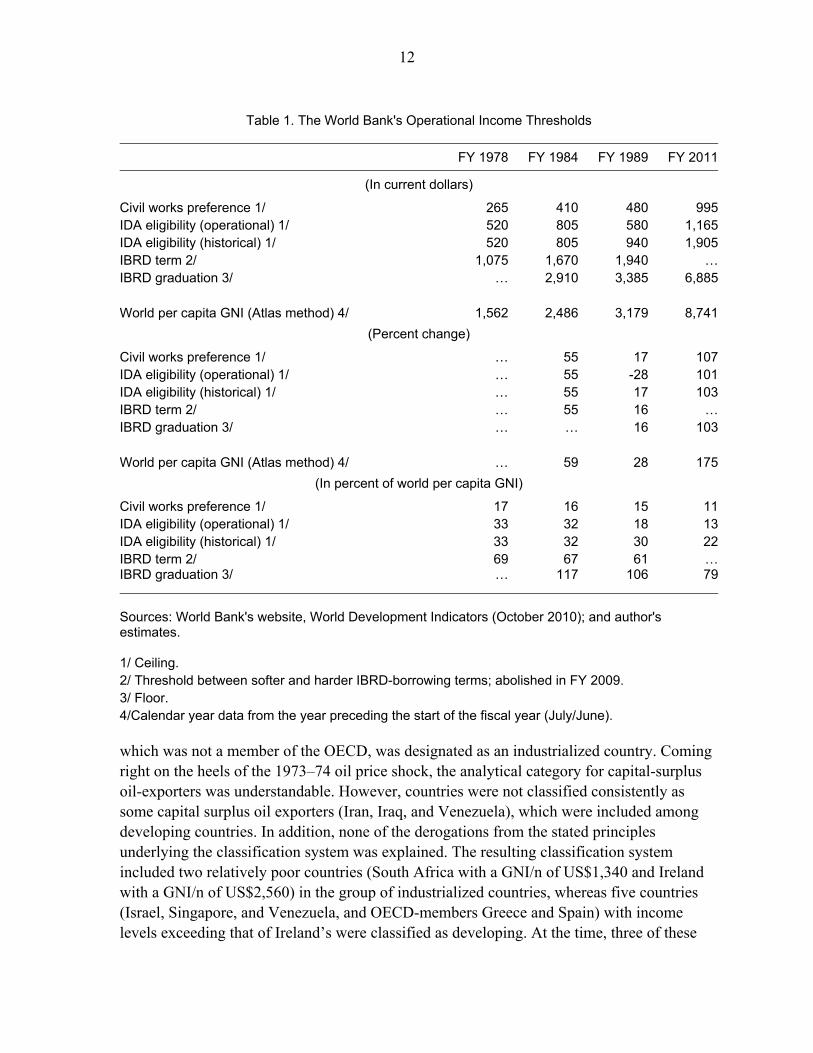
annually in line with inflation. Therefore, the use of income thresholds is not because the World Bank equates income with development, but simply because it considers GNI/n to be “the best single indicator of economic capacity and progress.”14 Besides the threshold on IDA eligibility, the Bank has also established a threshold to afford preferences to national companies in civil works procurement bids in Bank-financed projects subject to international competitive bidding procedures, and another threshold to determine which countries should be afforded more lenient borrowing terms from the IBRD.15 To these three thresholds were added a fourth in the early 1980s relating to IBRD graduation (as discussed above) and finally in 1987—at the time of the eighth IDA replenishment—the IDA threshold was split up into a higher ‘historical’ and lower ‘operational’ threshold reflecting scarcity of donor resources relative to demand, which did not allow IDA allocations to countries with a per capita income level above the ‘operational’ threshold. For the 2011 fiscal year (July-June), the operational thresholds range from US$995 (the civil works preference threshold) to US$6,885 (the IBRD graduation threshold). While the thresholds are adjusted for inflation, they are not adjusted for the trend growth in global real income, and relative to average world income, these thresholds have witnessed a secular decrease (Table 1). (After the 1989 fiscal year, there are small differences in the inflation adjustments made to the various thresholds presumably to address various operational needs) Thus, these operational thresholds are absolute rather than relative thresholds. Analytical classifications In 1978, the World Bank, for the first time, constructed an analytical country classification system. The occasion was the launch of the World Development Report. Annexed to the report was a set of World Development Indicators (WDI), which provided the statistical underpinning for the analysis.16 The first economic classification in the 1978 WDI divided countries into three categories: (1) developing countries, (2) industrialized countries, and (3) capital-surplus oil-exporting countries.17 Developing countries were categorized as low-income (with GNI/n of US$250 or less) and middle-income (with GNI/n above US$250). Instead of using income as a threshold between developing and industrialized countries, the Bank used membership in the OECD. However, four OECD member (Greece, Portugal, Spain, and Turkey) were placed in the group of developing countries, while South Africa,
into dollars-equivalent values using a trailing three-year moving-average weighted exchange rate with the weights chosen so as to minimize short-run real exchange rate movements (the so-called Atlas method). 14 Ibid. 15 This threshold was eliminated in July 2008 when IBRD-borrowing terms were unified. 16 Both the World Development Report and WDI have been published annually since 1978, but from 1997 onward, the WDI has been published as a stand-alone publication containing the Bank’s statistical survey of world development. 17 In addition, the 1978 WDI included summary data on eleven countries with centrally planned economies.
12
which was not a member of the OECD, was designated as an industrialized country. Coming right on the heels of the 1973–74 oil price shock, the analytical category for capital-surplus oil-exporters was understandable. However, countries were not classified consistently as some capital surplus oil exporters (Iran, Iraq, and Venezuela), which were included among developing countries. In addition, none of the derogations from the stated principles underlying the classification system was explained. The resulting classification system included two relatively poor countries (South Africa with a GNI/n of US$1,340 and Ireland with a GNI/n of US$2,560) in the group of industrialized countries, whereas five countries (Israel, Singapore, and Venezuela, and OECD-members Greece and Spain) with income levels exceeding that of Ireland’s were classified as developing. At the time, three of these
Table 1. The World Bank's Operational Income Thresholds
FY 1978 FY 1984 FY 1989 FY 2011
(In current dollars)
Civil works preference 1/ 265 410 480 995IDA eligibility (operational) 1/ 520 805 580 1,165IDA eligibility (historical) 1/ 520 805 940 1,905IBRD term 2/ 1,075 1,670 1,940 …IBRD graduation 3/ … 2,910 3,385 6,885
World per capita GNI (Atlas method) 4/ 1,562 2,486 3,179 8,741
(Percent change)
Civil works preference 1/ … 55 17 107IDA eligibility (operational) 1/ … 55 -28 101IDA eligibility (historical) 1/ … 55 17 103IBRD term 2/ … 55 16 …IBRD graduation 3/ … … 16 103
World per capita GNI (Atlas method) 4/ … 59 28 175
(In percent of world per capita GNI)
Civil works preference 1/ 17 16 15 11IDA eligibility (operational) 1/ 33 32 18 13IDA eligibility (historical) 1/ 33 32 30 22IBRD term 2/ 69 67 61 …IBRD graduation 3/ … 117 106 79
Sources: World Bank's website, World Development Indicators (October 2010); and author's estimates. 1/ Ceiling. 2/ Threshold between softer and harder IBRD-borrowing terms; abolished in FY 2009. 3/ Floor. 4/Calendar year data from the year preceding the start of the fiscal year (July/June).
13
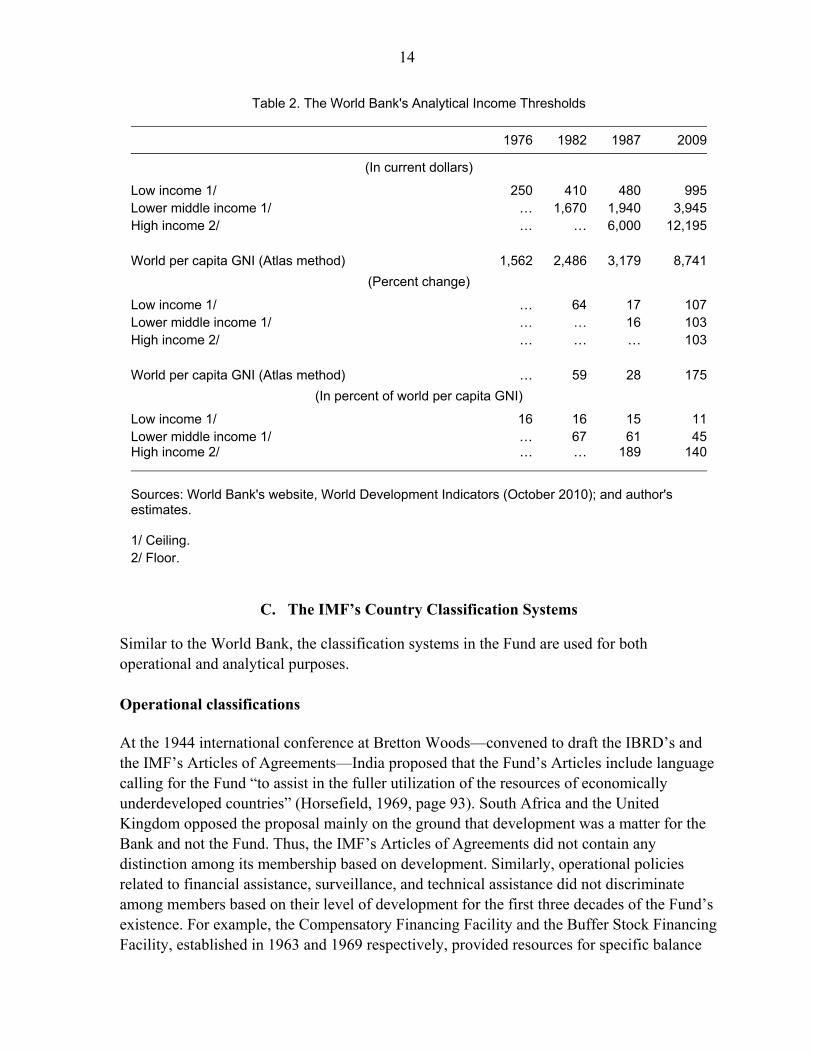
five countries—Greece, Spain, and Venezuela—were active borrowers from the IBRD whereas lending to South Africa and Israel had ceased in 1966 and 1975 respectively.18 Major reforms to the country classification system were introduced in the 1989 WDI. First, a high-income country category—to include countries with a GNI/n above US$6,000—was established by combining the old industrial and capital-surplus oil-exporter categories. No rationale was provided for the cut-off level, but the threshold was set at 12½ times the low-income threshold or about double that of average world income level; it was also well-above the IBRD graduation threshold. Thirty countries (including all OECD member countries with the exception of Turkey) were in the new high-income group. Second, within the middle-income developing countries group, a subdivision between lower and upper middle-income countries was established using as a threshold the income cut-off between softer and harder IBRD borrowing terms. Third, with the abolishment of the industrialized countries category, the developing countries category was also dropped. However, it was acknowledged that it might be “convenient” to continue to refer to low- and middle-income countries as developing countries.19 As all economic thresholds are maintained (approximately) constant in real terms in line with the methodology used on the operational side, the economic classification thresholds are subject to a secular downward trend relative to average world income. From 1987 (the base year for the 1989 classification reform) to 2009, the world price level—as measured by the increase in the World Bank’s operational thresholds—about doubled, but the average per capita nominal income almost tripled. Consequently, the low-income threshold fell from 16 to 11 percent of average world income over this period and the high-income threshold fell from 189 to 140 percent (Table 2). The terminology suggests that the thresholds are defined relative to the size distribution; this, however, is not the case. The thresholds are not relative, but absolute, and it is possible for all countries to be classified as either low-income or high-income at the same time. This raises questions about the appropriateness of the terminology. For example, with a continued trend increase in average world income the high-income threshold will fall below the average world income level. Therefore, consideration could be given to renaming the category to something that would do justice to the fact that the threshold is an absolute and not a relative threshold.
18 IBRD lending to South Africa resumed in 1997. 19 Twenty years hence similar language is still in use in the World Bank. On page xxi in the 2009 WDI, one learns that “low- and middle-income economies are sometimes referred to as developing economies. The term is used for convenience; it is not intended to imply that all economies in the group are experiencing similar development or that other economies have reached a preferred or final stage of development.”
14
Table 2. The World Bank's Analytical Income Thresholds
1976 1982 1987 2009
(In current dollars)
Low income 1/ 250 410 480 995Lower middle income 1/ … 1,670 1,940 3,945High income 2/ … … 6,000 12,195
World per capita GNI (Atlas method) 1,562 2,486 3,179 8,741
(Percent change)
Low income 1/ … 64 17 107Lower middle income 1/ … … 16 103High income 2/ … … … 103
World per capita GNI (Atlas method) … 59 28 175
(In percent of world per capita GNI)
Low income 1/ 16 16 15 11Lower middle income 1/ … 67 61 45High income 2/ … … 189 140
Sources: World Bank's website, World Development Indicators (October 2010); and author's estimates. 1/ Ceiling. 2/ Floor.
C. The IMF’s Country Classification Systems
Similar to the World Bank, the classification systems in the Fund are used for both operational and analytical purposes. Operational classifications At the 1944 international conference at Bretton Woods—convened to draft the IBRD’s and the IMF’s Articles of Agreements—India proposed that the Fund’s Articles include language calling for the Fund “to assist in the fuller utilization of the resources of economically underdeveloped countries” (Horsefield, 1969, page 93). South Africa and the United Kingdom opposed the proposal mainly on the ground that development was a matter for the Bank and not the Fund. Thus, the IMF’s Articles of Agreements did not contain any distinction among its membership based on development. Similarly, operational policies related to financial assistance, surveillance, and technical assistance did not discriminate among members based on their level of development for the first three decades of the Fund’s existence. For example, the Compensatory Financing Facility and the Buffer Stock Financing Facility, established in 1963 and 1969 respectively, provided resources for specific balance
15
of payments needs mainly of interest to developing member countries, but eligibility to access these facilities was open to the full membership (Garritsen de Vries, 1985). The Fund responded to the oil price shock of 1973 and the accompanying international economic dislocation with the establishment of two oil facilities in 1974 and 1975 (Garritsen de Vries, 1985). In line with standard Fund practice, eligibility for use of the facilities was open to the full membership, but the facilities were special in that their resources came from borrowing on commercial terms (mostly from oil-exporting countries) and charges on Fund’s financial assistance under these facilities were therefore higher than charges on quota-based resources. To assist developing countries meet their debt service obligations stemming from drawings under the oil facilities, the Fund established in 1975 a Subsidy Account through which voluntary contributions from industrial and oil-exporting countries would subsidize the financing charges. The Fund administered the Subsidy Account as a trustee. For the purpose of identifying beneficiaries of the Subsidy Account, the Fund relied on a list of 41 countries drawn up by the UN as having been “most seriously affected by the current situation” (i.e., the oil and food price hikes in 1972–73).20 With the establishment of the Subsidy Account, the Fund, for the first time, distinguished among its members. Also in response to the oil price shock of 1973, the US proposed in 1974 the establishment of a Trust Fund at the Fund (Garritsen de Vries, 1985). The purpose of the Trust Fund was to provide concessional balance of payments support to developing members following the expiry of the oil facilities. In 1976, the Fund began a series of gold sales. The profits from these gold sales were then placed in the Trust Fund from where disbursements were made either as concessional loans or as direct distributions. Whereas eligibility for Trust Fund loans was limited to 61 members that had per capita income of no more than SDR 300 in 1973, distributions were to be “for the benefit of developing countries.” This language was contained in a 1975 Interim Committee’s communiqué, but it was left for the IMF’s Executive Board to decide on an operational definition of developing countries. Most Fund members—107 countries—insisted on their inclusion on the list of developing countries, something that remaining members resisted. A compromise by the Fund’s Managing Director—to designate all 107 countries as developing on the understanding that the 46 members ineligible for Trust Fund loans would forego a part or the full share of the gold profits—was not accepted. After two years of discussions that yielded no results, the Fund’s Executive Board in 1977 in a close vote decided to designate 103 members as developing countries (the 107 countries with the exception of Greece, Israel, Singapore, and Spain). However, Singapore remained concerned about its classification for the purposes of the General Agreement on Tariffs and Trade and it presented to the Fund detailed statistics to support its view that per capita income level was not a reliable indicator of development.
20 Since Cape Verde and Mozambique, which were on the UN list, were not then members of the list, 39 Fund members were eligible to receive payments from the Subsidy Account. The 41 most seriously affected countries all had per capita incomes of US$400 a year or less in 1971.
16
Based on this submission, the Board agreed to include Singapore in a final list of 104 developing countries. In 1978, the second amendment to the Articles of Agreement was adopted. The amended articles recognized that “balance of payments assistance may be made available on special terms to developing members in difficult circumstances, and that for this purpose the Fund shall take into account the level of per capita income.”21 In 1986, the Fund then established the Structural Adjustment Facility to make concessional resources available by recycling resources lent under the Trust Fund. In establishing the facility, the Fund decided that “all low-income countries eligible for IDA resources that are in need of such resources and face protracted balance of payments problems would be eligible initially to use the Fund’s new facility” (Boughton, 2001, p. 649). The carefully drafted decision made it clear that it was the Fund, and not IDA, that had responsibility for any future changes in the list of eligible countries. Over the years, this concessional facility has been expanded, refocused, and renamed. Currently, the Fund’s concessional assistance comes from the Poverty Reduction and Growth Trust (PRGT) and a new framework for determining PRGT eligibility was agreed in early 2010. The new framework determines eligibility based on criteria relating to per capita income, market access, and vulnerability. Based on the new framework, the number of PRGT-eligible countries was reduced from 77 to 71. These countries are recognized by the Fund to be “low-income developing countries.”22 Analytical classifications Member countries of the IMF are obligated to provide economic and financial data to the Fund, which in turn is charged with acting as a center for the collection and exchange for information.23 Some of these data have been included in the International Financial Statistics (IFS) published since 1948. In the earlier years, country specific data were not aggregated, but from 1964 onwards various analytical classifications have been in use. The first classification system divided countries into (1) industrial countries, (2) other high-income countries, and (3) less-developed countries. In the early 1970s, the classification system divided countries into (1) industrial countries, (2) primary producing countries in more developed areas, and (3) primary producing countries in less developed areas. By the late 1970s, the classification system had changed to (1) industrial countries, (2) other Europe, Australia, New Zealand, South Africa, (3) oil exporting countries, and (4) other less developed areas. In early 1980, this classification system was significantly simplified when IFS introduced a two category system consisting of (1) industrial countries and (2) developing countries. The IFS never motivated the choice of classification systems used.
21 Article V, Section 12 of the IMF’s Articles of Agreement. 22 Selected Decisions and Selected Documents of the IMF, Thirty-fourth Issue, December 31, 2009, page 201. 23 Article VIII, Section 5 of the IMF’s Articles of Agreement.
17
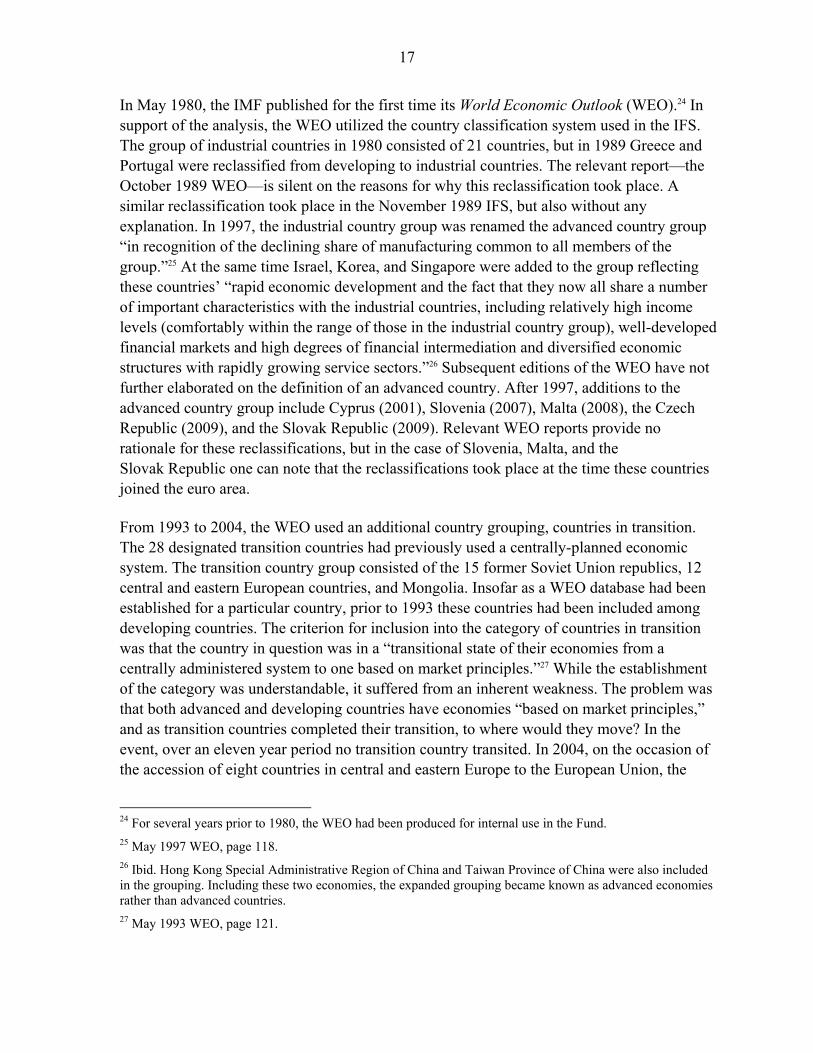
In May 1980, the IMF published for the first time its World Economic Outlook (WEO).24 In support of the analysis, the WEO utilized the country classification system used in the IFS. The group of industrial countries in 1980 consisted of 21 countries, but in 1989 Greece and Portugal were reclassified from developing to industrial countries. The relevant report—the October 1989 WEO—is silent on the reasons for why this reclassification took place. A similar reclassification took place in the November 1989 IFS, but also without any explanation. In 1997, the industrial country group was renamed the advanced country group “in recognition of the declining share of manufacturing common to all members of the group.”25 At the same time Israel, Korea, and Singapore were added to the group reflecting these countries’ “rapid economic development and the fact that they now all share a number of important characteristics with the industrial countries, including relatively high income levels (comfortably within the range of those in the industrial country group), well-developed financial markets and high degrees of financial intermediation and diversified economic structures with rapidly growing service sectors.”26 Subsequent editions of the WEO have not further elaborated on the definition of an advanced country. After 1997, additions to the advanced country group include Cyprus (2001), Slovenia (2007), Malta (2008), the Czech Republic (2009), and the Slovak Republic (2009). Relevant WEO reports provide no rationale for these reclassifications, but in the case of Slovenia, Malta, and the Slovak Republic one can note that the reclassifications took place at the time these countries joined the euro area. From 1993 to 2004, the WEO used an additional country grouping, countries in transition. The 28 designated transition countries had previously used a centrally-planned economic system. The transition country group consisted of the 15 former Soviet Union republics, 12 central and eastern European countries, and Mongolia. Insofar as a WEO database had been established for a particular country, prior to 1993 these countries had been included among developing countries. The criterion for inclusion into the category of countries in transition was that the country in question was in a “transitional state of their economies from a centrally administered system to one based on market principles.”27 While the establishment of the category was understandable, it suffered from an inherent weakness. The problem was that both advanced and developing countries have economies “based on market principles,” and as transition countries completed their transition, to where would they move? In the event, over an eleven year period no transition country transited. In 2004, on the occasion of the accession of eight countries in central and eastern Europe to the European Union, the
24 For several years prior to 1980, the WEO had been produced for internal use in the Fund. 25 May 1997 WEO, page 118. 26 Ibid. Hong Kong Special Administrative Region of China and Taiwan Province of China were also included in the grouping. Including these two economies, the expanded grouping became known as advanced economies rather than advanced countries. 27 May 1993 WEO, page 121.
18
transition countries group was combined with the developing countries group to form a new emerging and developing countries group. Countries in the new group were defined for what they were not; i.e., they were not advanced. The designation emerging and developing countries would seem to suggest a further division exists between emerging countries and developing countries. That, however, is not the case, but the operational category of low-income, developing countries (PRGT-eligible countries) constitutes a sub-group.
D. Comparison of Approaches
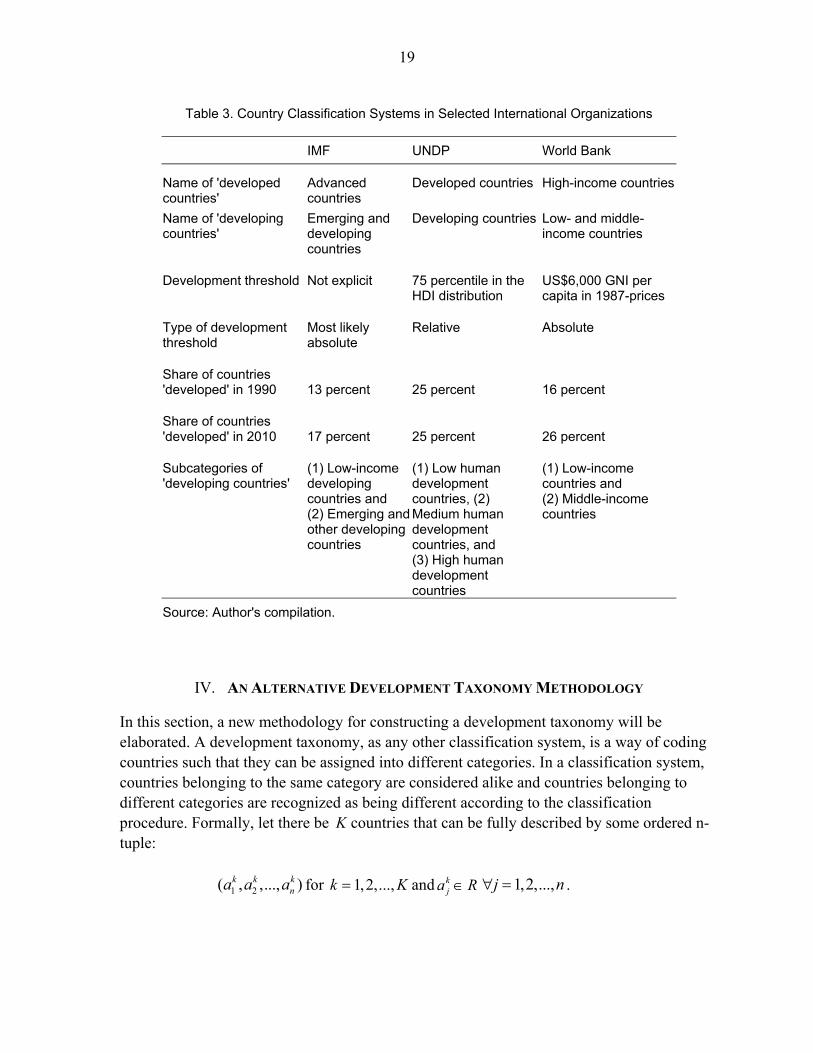
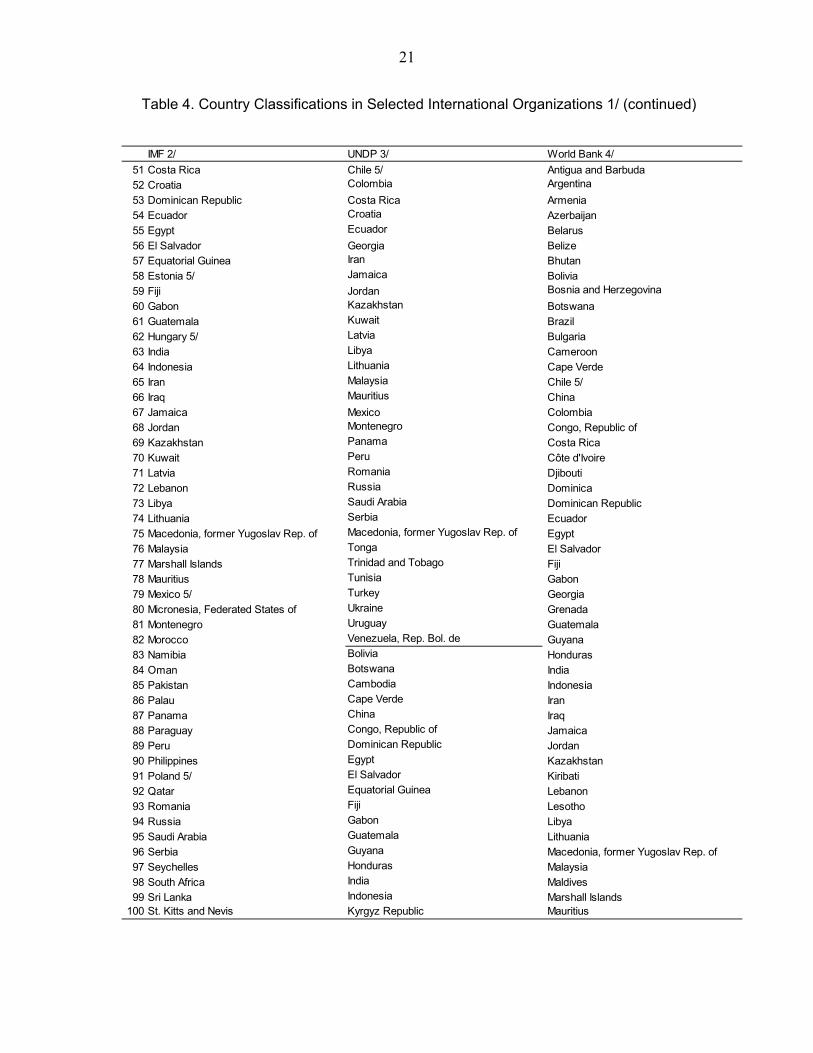
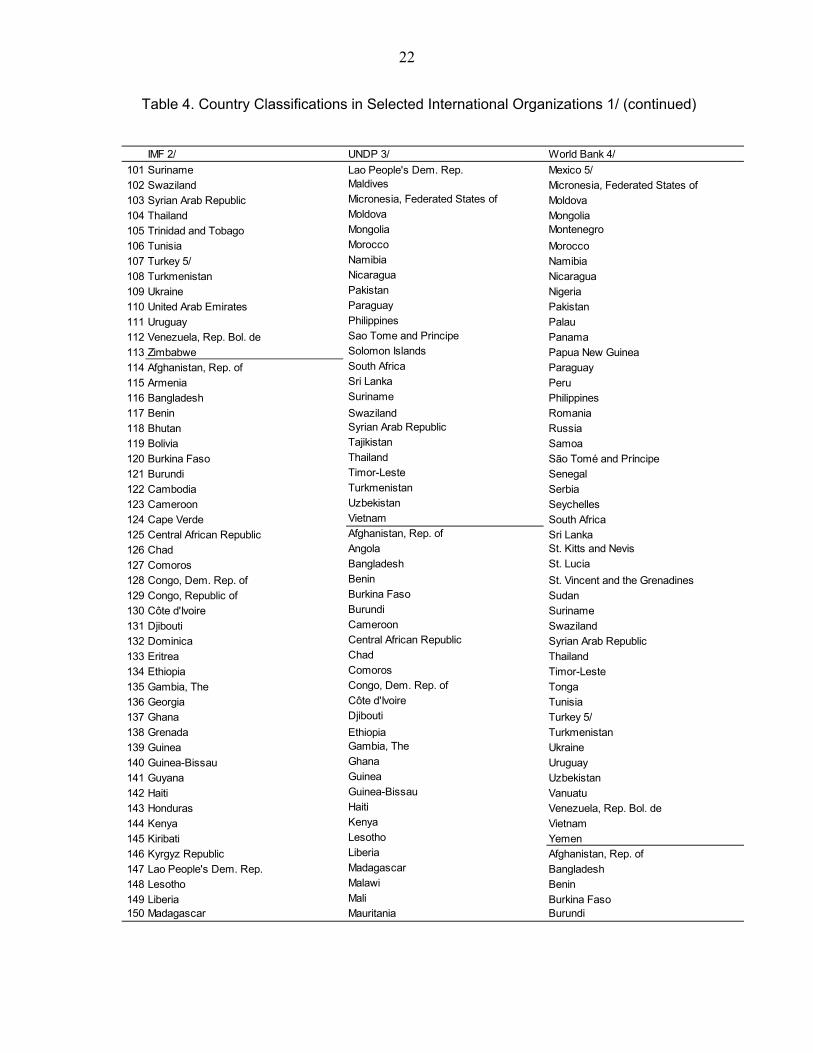
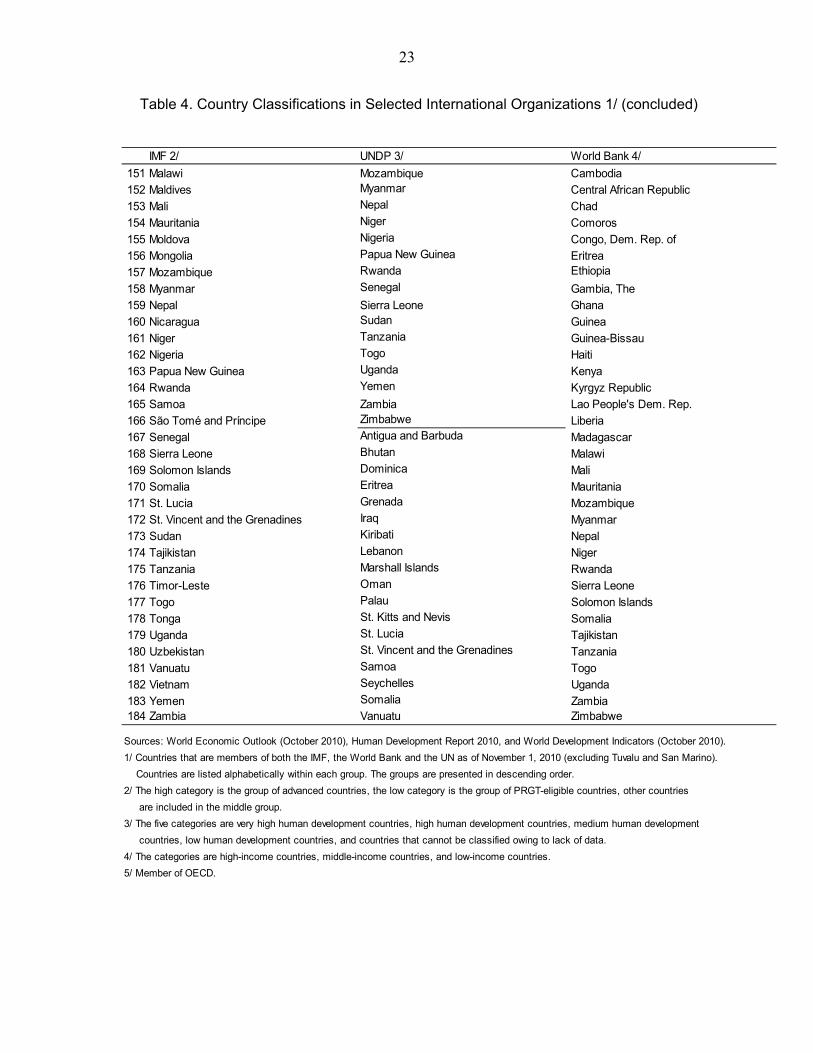
From the preceding discussion, it is reasonable to conclude that international organizations approach the construction of development taxonomies very differently. One explanation for this diversity is that economic theory provides little guidance. Another explanation is that the institutions have different mandates and therefore may approach the issue with different perspectives both operationally and analytically. At the same time, a casual inspection suggests that currently the classification systems are quite similar in terms of designating countries as being either ‘developed’ or ‘developing’. All three organizations identify a relatively small share of ‘developed’ countries. All countries that the IMF considers advanced are also considered developed by the UNDP, and only seven countries considered developed by the UNDP (Barbados, Brunei Darussalam, Estonia, Hungary, Poland, Qatar, and United Arab Emirates) are not advanced according to the IMF. The World Bank’s high-income group is the larger group and it encompasses all designated advanced and developed countries. High-income countries in the Bank’s classification that are not either ’advanced’ or ‘developed’ include The Bahamas, Croatia, Equatorial Guinea, Kuwait, Latvia, Oman, Saudi Arabia, and Trinidad and Tobago. As the institutions reach broadly similar conclusions as to the membership of the developed country grouping, the compositions of the developing country group are, of course, equally similar. Given the large and diverse group of developing countries, all three organizations have found it useful to identify subgroups among developing countries. Table 3 provides an overview of the development taxonomies used in the three international organizations. Note that over the last twenty years the shares of ‘developed’ countries in the World Bank and IMF’s systems have increased relative to the share of developed countries in UNDP’s system. The reason is that the UNDP’s development threshold is relative while the Bank’s and (probably) the Fund’s are absolute. With an absolute development threshold the share of ‘developed’ countries will tend to increase in line with general economic and social progress, but not necessarily so with a relative threshold. While the three organizations use very different development thresholds, there is a lack of clarity around how these thresholds have been established in all organizations. The three institutions’ development taxonomies are presented in Table 4.
19
IV. AN ALTERNATIVE DEVELOPMENT TAXONOMY METHODOLOGY
In this section, a new methodology for constructing a development taxonomy will be elaborated. A development taxonomy, as any other classification system, is a way of coding countries such that they can be assigned into different categories. In a classification system, countries belonging to the same category are considered alike and countries belonging to different categories are recognized as being different according to the classification procedure. Formally, let there be K countries that can be fully described by some ordered n-tuple: 1 2( , ,..., )k k k
na a a for 1,2,...,k K and kja R 1,2,...,j n .
Table 3. Country Classification Systems in Selected International Organizations
IMF UNDP World Bank
Name of 'developed countries'
Advanced countries
Developed countries High-income countries
Name of 'developing countries'
Emerging and developing countries
Developing countries Low- and middle-income countries
Development threshold
Not explicit
75 percentile in the HDI distribution
US$6,000 GNI per capita in 1987-prices
Type of development threshold
Most likely absolute
Relative
Absolute
Share of countries 'developed' in 1990 13 percent 25 percent 16 percent Share of countries 'developed' in 2010 17 percent 25 percent 26 percent Subcategories of 'developing countries'
(1) Low-income developing countries and (2) Emerging and other developing countries
(1) Low human development countries, (2) Medium human development countries, and (3) High human development countries
(1) Low-income countries and (2) Middle-income countries
Source: Author's compilation.
20
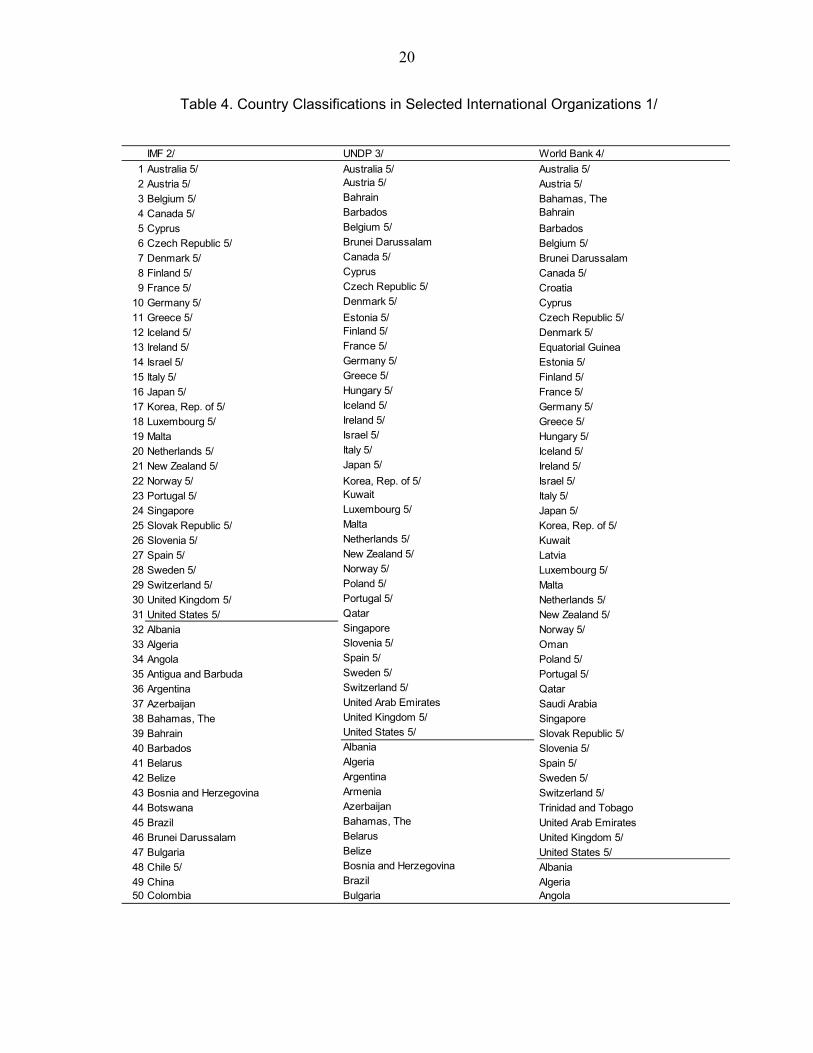
Table 4. Country Classifications in Selected International Organizations 1/
IMF 2/ UNDP 3/ World Bank 4/
1 Australia 5/ Australia 5/ Australia 5/
2 Austria 5/ Austria 5/ Austria 5/
3 Belgium 5/ Bahrain Bahamas, The
4 Canada 5/ Barbados Bahrain
5 Cyprus Belgium 5/ Barbados
6 Czech Republic 5/ Brunei Darussalam Belgium 5/
7 Denmark 5/ Canada 5/ Brunei Darussalam
8 Finland 5/ Cyprus Canada 5/
9 France 5/ Czech Republic 5/ Croatia
10 Germany 5/ Denmark 5/ Cyprus
11 Greece 5/ Estonia 5/ Czech Republic 5/
12 Iceland 5/ Finland 5/ Denmark 5/
13 Ireland 5/ France 5/ Equatorial Guinea
14 Israel 5/ Germany 5/ Estonia 5/
15 Italy 5/ Greece 5/ Finland 5/
16 Japan 5/ Hungary 5/ France 5/
17 Korea, Rep. of 5/ Iceland 5/ Germany 5/
18 Luxembourg 5/ Ireland 5/ Greece 5/
19 Malta Israel 5/ Hungary 5/
20 Netherlands 5/ Italy 5/ Iceland 5/
21 New Zealand 5/ Japan 5/ Ireland 5/
22 Norway 5/ Korea, Rep. of 5/ Israel 5/
23 Portugal 5/ Kuwait Italy 5/
24 Singapore Luxembourg 5/ Japan 5/
25 Slovak Republic 5/ Malta Korea, Rep. of 5/
26 Slovenia 5/ Netherlands 5/ Kuwait
27 Spain 5/ New Zealand 5/ Latvia
28 Sweden 5/ Norway 5/ Luxembourg 5/
29 Switzerland 5/ Poland 5/ Malta
30 United Kingdom 5/ Portugal 5/ Netherlands 5/
31 United States 5/ Qatar New Zealand 5/
32 Albania Singapore Norway 5/
33 Algeria Slovenia 5/ Oman
34 Angola Spain 5/ Poland 5/
35 Antigua and Barbuda Sweden 5/ Portugal 5/
36 Argentina Switzerland 5/ Qatar
37 Azerbaijan United Arab Emirates Saudi Arabia
38 Bahamas, The United Kingdom 5/ Singapore
39 Bahrain United States 5/ Slovak Republic 5/
40 Barbados Albania Slovenia 5/
41 Belarus Algeria Spain 5/
42 Belize Argentina Sweden 5/
43 Bosnia and Herzegovina Armenia Switzerland 5/
44 Botswana Azerbaijan Trinidad and Tobago
45 Brazil Bahamas, The United Arab Emirates
46 Brunei Darussalam Belarus United Kingdom 5/
47 Bulgaria Belize United States 5/
48 Chile 5/ Bosnia and Herzegovina Albania
49 China Brazil Algeria50 Colombia Bulgaria Angola
21
Table 4. Country Classifications in Selected International Organizations 1/ (continued)
IMF 2/ UNDP 3/ World Bank 4/
51 Costa Rica Chile 5/ Antigua and Barbuda
52 Croatia Colombia Argentina
53 Dominican Republic Costa Rica Armenia
54 Ecuador Croatia Azerbaijan
55 Egypt Ecuador Belarus
56 El Salvador Georgia Belize57 Equatorial Guinea Iran Bhutan
58 Estonia 5/ Jamaica Bolivia
59 Fiji Jordan Bosnia and Herzegovina
60 Gabon Kazakhstan Botswana
61 Guatemala Kuwait Brazil
62 Hungary 5/ Latvia Bulgaria
63 India Libya Cameroon
64 Indonesia Lithuania Cape Verde
65 Iran Malaysia Chile 5/
66 Iraq Mauritius China67 Jamaica Mexico Colombia
68 Jordan Montenegro Congo, Republic of
69 Kazakhstan Panama Costa Rica
70 Kuwait Peru Côte d'Ivoire
71 Latvia Romania Djibouti
72 Lebanon Russia Dominica
73 Libya Saudi Arabia Dominican Republic
74 Lithuania Serbia Ecuador
75 Macedonia, former Yugoslav Rep. of Macedonia, former Yugoslav Rep. of Egypt
76 Malaysia Tonga El Salvador
77 Marshall Islands Trinidad and Tobago Fiji78 Mauritius Tunisia Gabon
79 Mexico 5/ Turkey Georgia
80 Micronesia, Federated States of Ukraine Grenada
81 Montenegro Uruguay Guatemala
82 Morocco Venezuela, Rep. Bol. de Guyana
83 Namibia Bolivia Honduras
84 Oman Botswana India
85 Pakistan Cambodia Indonesia
86 Palau Cape Verde Iran
87 Panama China Iraq88 Paraguay Congo, Republic of Jamaica
89 Peru Dominican Republic Jordan
90 Philippines Egypt Kazakhstan
91 Poland 5/ El Salvador Kiribati
92 Qatar Equatorial Guinea Lebanon
93 Romania Fiji Lesotho
94 Russia Gabon Libya
95 Saudi Arabia Guatemala Lithuania
96 Serbia Guyana Macedonia, former Yugoslav Rep. of
97 Seychelles Honduras Malaysia
98 South Africa India Maldives99 Sri Lanka Indonesia Marshall Islands
100 St. Kitts and Nevis Kyrgyz Republic Mauritius
22
Table 4. Country Classifications in Selected International Organizations 1/ (continued)
IMF 2/ UNDP 3/ World Bank 4/
101 Suriname Lao People's Dem. Rep. Mexico 5/
102 Swaziland Maldives Micronesia, Federated States of
103 Syrian Arab Republic Micronesia, Federated States of Moldova
104 Thailand Moldova Mongolia
105 Trinidad and Tobago Mongolia Montenegro
106 Tunisia Morocco Morocco
107 Turkey 5/ Namibia Namibia
108 Turkmenistan Nicaragua Nicaragua
109 Ukraine Pakistan Nigeria
110 United Arab Emirates Paraguay Pakistan
111 Uruguay Philippines Palau
112 Venezuela, Rep. Bol. de Sao Tome and Principe Panama
113 Zimbabwe Solomon Islands Papua New Guinea
114 Afghanistan, Rep. of South Africa Paraguay
115 Armenia Sri Lanka Peru
116 Bangladesh Suriname Philippines
117 Benin Swaziland Romania
118 Bhutan Syrian Arab Republic Russia
119 Bolivia Tajikistan Samoa
120 Burkina Faso Thailand São Tomé and Príncipe
121 Burundi Timor-Leste Senegal
122 Cambodia Turkmenistan Serbia
123 Cameroon Uzbekistan Seychelles
124 Cape Verde Vietnam South Africa
125 Central African Republic Afghanistan, Rep. of Sri Lanka
126 Chad Angola St. Kitts and Nevis
127 Comoros Bangladesh St. Lucia
128 Congo, Dem. Rep. of Benin St. Vincent and the Grenadines
129 Congo, Republic of Burkina Faso Sudan
130 Côte d'Ivoire Burundi Suriname
131 Djibouti Cameroon Swaziland
132 Dominica Central African Republic Syrian Arab Republic
133 Eritrea Chad Thailand
134 Ethiopia Comoros Timor-Leste
135 Gambia, The Congo, Dem. Rep. of Tonga
136 Georgia Côte d'Ivoire Tunisia
137 Ghana Djibouti Turkey 5/
138 Grenada Ethiopia Turkmenistan
139 Guinea Gambia, The Ukraine
140 Guinea-Bissau Ghana Uruguay
141 Guyana Guinea Uzbekistan
142 Haiti Guinea-Bissau Vanuatu
143 Honduras Haiti Venezuela, Rep. Bol. de
144 Kenya Kenya Vietnam
145 Kiribati Lesotho Yemen
146 Kyrgyz Republic Liberia Afghanistan, Rep. of
147 Lao People's Dem. Rep. Madagascar Bangladesh
148 Lesotho Malawi Benin
149 Liberia Mali Burkina Faso150 Madagascar Mauritania Burundi
23
Table 4. Country Classifications in Selected International Organizations 1/ (concluded)
IMF 2/ UNDP 3/ World Bank 4/
151 Malawi Mozambique Cambodia
152 Maldives Myanmar Central African Republic
153 Mali Nepal Chad
154 Mauritania Niger Comoros
155 Moldova Nigeria Congo, Dem. Rep. of
156 Mongolia Papua New Guinea Eritrea
157 Mozambique Rwanda Ethiopia
158 Myanmar Senegal Gambia, The
159 Nepal Sierra Leone Ghana
160 Nicaragua Sudan Guinea
161 Niger Tanzania Guinea-Bissau
162 Nigeria Togo Haiti
163 Papua New Guinea Uganda Kenya
164 Rwanda Yemen Kyrgyz Republic
165 Samoa Zambia Lao People's Dem. Rep.
166 São Tomé and Príncipe Zimbabwe Liberia
167 Senegal Antigua and Barbuda Madagascar
168 Sierra Leone Bhutan Malawi
169 Solomon Islands Dominica Mali
170 Somalia Eritrea Mauritania
171 St. Lucia Grenada Mozambique
172 St. Vincent and the Grenadines Iraq Myanmar
173 Sudan Kiribati Nepal
174 Tajikistan Lebanon Niger
175 Tanzania Marshall Islands Rwanda
176 Timor-Leste Oman Sierra Leone
177 Togo Palau Solomon Islands
178 Tonga St. Kitts and Nevis Somalia
179 Uganda St. Lucia Tajikistan
180 Uzbekistan St. Vincent and the Grenadines Tanzania
181 Vanuatu Samoa Togo
182 Vietnam Seychelles Uganda
183 Yemen Somalia Zambia184 Zambia Vanuatu Zimbabwe
Sources: World Economic Outlook (October 2010), Human Development Report 2010, and World Development Indicators (October 2010).
1/ Countries that are members of both the IMF, the World Bank and the UN as of November 1, 2010 (excluding Tuvalu and San Marino).
Countries are listed alphabetically within each group. The groups are presented in descending order.
2/ The high category is the group of advanced countries, the low category is the group of PRGT-eligible countries, other countries
are included in the middle group.
3/ The five categories are very high human development countries, high human development countries, medium human development
countries, low human development countries, and countries that cannot be classified owing to lack of data.
4/ The categories are high-income countries, middle-income countries, and low-income countries.
5/ Member of OECD.
24
The arguments in the n-tuple may be population density, share of agriculture in GDP, educational attainment, human rights record, per capita income level, etc. A classification system then is a procedure that uses any of these n arguments to construct categories of countries. Countries within a category either have, or are assumed to have, the same ja and
for countries in different categories the ja ’s differ. For example, if ja takes on the value of
one if the country is land-locked and 0 otherwise, it is straightforward to group countries into those land-locked and those with access to the sea by ensuring that the value of ja is the same
for countries within a group. For the purpose of this classification, countries within a category are alike (they have the same value of ja ), but for other purposes they may, of
course, be different. While it is straightforward to categorize countries as either land-locked or not, it is more complicated to construct a development taxonomy. Leaving aside the difficult question of how to define development, there are two problems that need to be addressed. One, it is not obvious what is the appropriate number of categories. Two, countries’ measured development attainment (the ja ’s) are most likely all different and a procedure is needed to
tweak the development attainments—that is to say, construct a synthetic distribution—to ensure that countries within each category have the same ja .
As to the first problem, one could address it by applying cluster analysis to the data set. If countries’ development attainments clustered closely around n different values, one could construct a development taxonomy with n categories. Cluster analysis, however, has drawbacks. If outcomes are distributed fairly evenly across the full development spectrum, it may not be possible to identify any cluster, even though cumulative differences are of such magnitudes that the construction of a development taxonomy is warranted. In addition, the application of cluster analysis involves a large degree of latitude as to what distance measures and algorithms to use. This makes it difficult to define time-invariant parameters that can be used in periodic updates of the taxonomy. In practice, a judgmental approach to determining the number of categories would appear to be the only feasible approach. Such judgment should be informed by a consideration of the relative benefits and costs of employing a particular number of categories. A development taxonomy is beneficial because it facilitates analysis; its associated costs relate to the treatment of different countries as being alike. The number of categories in existing taxonomies suggests that the optimum number of categories is in the low single digits. To address the second problem—how to construct the synthetic development distribution on the basis of which countries can be classified—it will be assumed that the synthetic distribution preserves both the mean and ranking of the actual distribution. The mean-preserving assumption anchors the synthetic distribution to the actual distribution while the rank-preserving assumption rules out non-sensible groupings (e.g., categorizing one country
25
as developing and another country with a lower development outcome as developed).The
mean-preserving assumption requires that any adjustment to a kja has to be off-set by a
combined negative adjustment of the same magnitude to other lja where k l . The rank-
preserving condition limits the magnitude of permissible adjustments. The Lorenz curve will be the analytical tool used to develop this methodology. The Lorenz curve is a function showing the cumulative outcome, ( )L x , of the lowest x percentile of the total population.
Both the domain and range of the function is the closed interval between zero and one. By definition, (0) 0L and (1) 1L . Furthermore, ( )L x is strictly convex and therefore '( ) 0L x and ''( ) 0L x . Completing the Lorenz curve framework is the 45-degree line of equality.
The area between the lines of equal and actual development attainment is a measure of the inequality of the distribution (the area equals half of the Gini coefficient). For a given actual development distribution, ( )L x , assume that all countries have the same level of
development. A measure of the error associated with that assumption is this area. Formally, the area is
1
1
0
1( )
2E L x dx ,
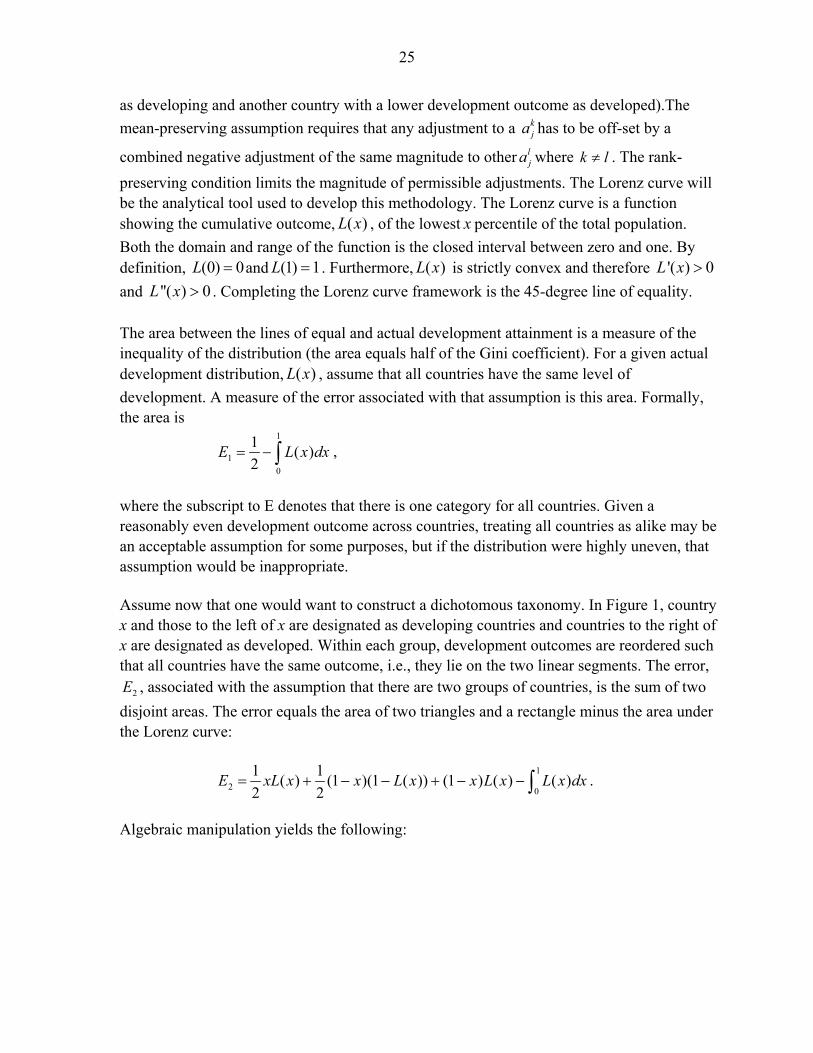
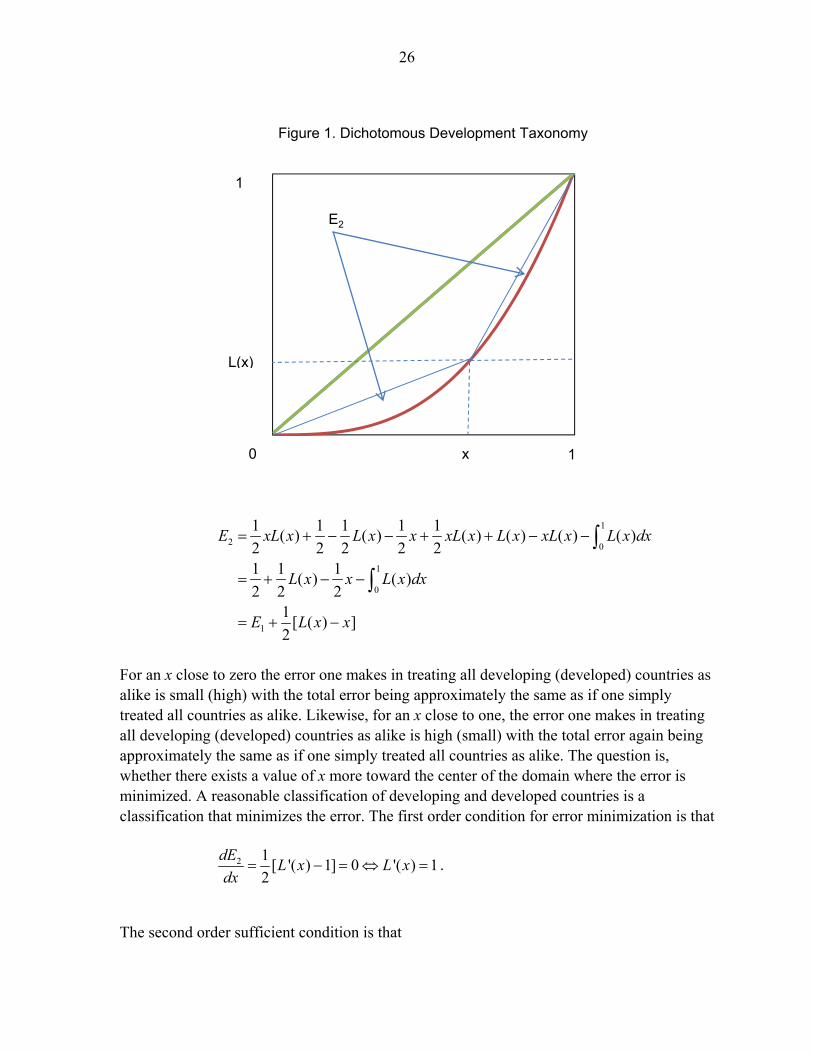
where the subscript to E denotes that there is one category for all countries. Given a reasonably even development outcome across countries, treating all countries as alike may be an acceptable assumption for some purposes, but if the distribution were highly uneven, that assumption would be inappropriate. Assume now that one would want to construct a dichotomous taxonomy. In Figure 1, country x and those to the left of x are designated as developing countries and countries to the right of x are designated as developed. Within each group, development outcomes are reordered such that all countries have the same outcome, i.e., they lie on the two linear segments. The error,
2E , associated with the assumption that there are two groups of countries, is the sum of two
disjoint areas. The error equals the area of two triangles and a rectangle minus the area under the Lorenz curve:
1
2 0
1 1( ) (1 )(1 ( )) (1 ) ( ) ( )
2 2E xL x x L x x L x L x dx .
Algebraic manipulation yields the following:
26
1
2 0
1
0
1
1 1 1 1 1( ) ( ) ( ) ( ) ( ) ( )
2 2 2 2 21 1 1
( ) ( )2 2 2
1[ ( ) ]
2
E xL x L x x xL x L x xL x L x dx
L x x L x dx
E L x x
For an x close to zero the error one makes in treating all developing (developed) countries as alike is small (high) with the total error being approximately the same as if one simply treated all countries as alike. Likewise, for an x close to one, the error one makes in treating all developing (developed) countries as alike is high (small) with the total error again being approximately the same as if one simply treated all countries as alike. The question is, whether there exists a value of x more toward the center of the domain where the error is minimized. A reasonable classification of developing and developed countries is a classification that minimizes the error. The first order condition for error minimization is that
2 1[ '( ) 1] 0 '( ) 1
2
dEL x L x
dx .
The second order sufficient condition is that
Figure 1. Dichotomous Development Taxonomy
1
0 1x
L(x)
E2
27
2
22
1''( ) 0
2
d EL x
dx .
That condition holds because ( )L x is strictly convex. Therefore, if one were to divide
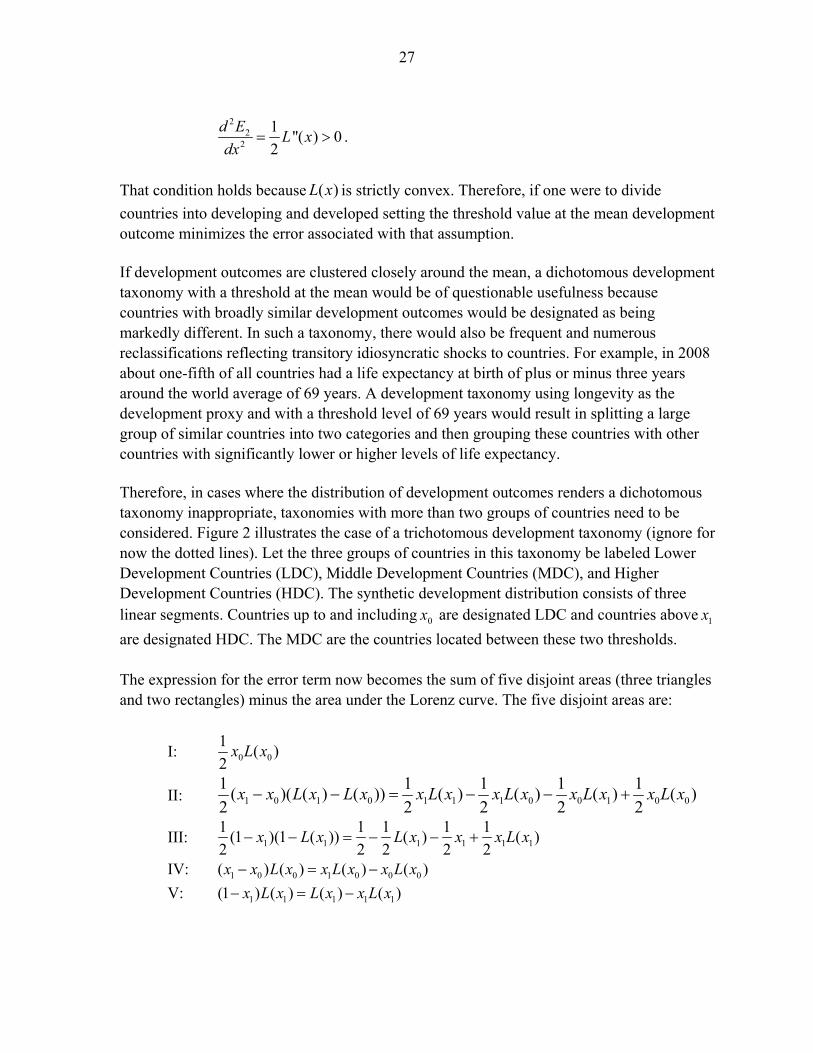
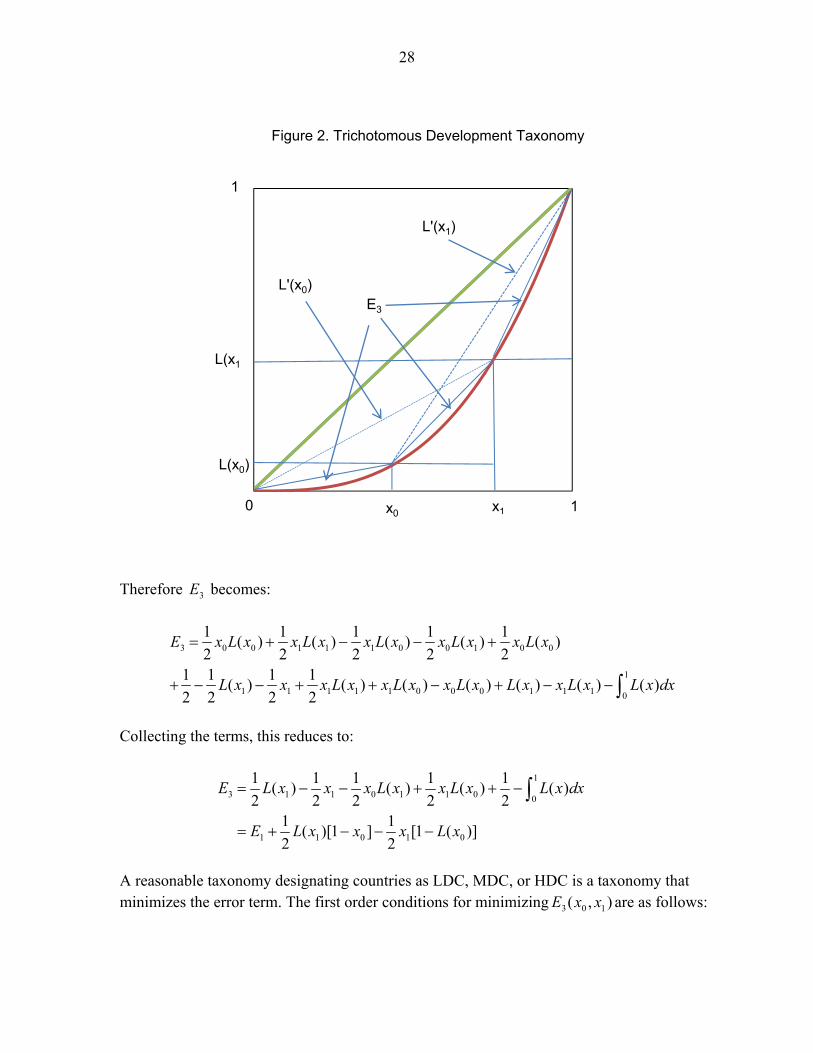
countries into developing and developed setting the threshold value at the mean development outcome minimizes the error associated with that assumption. If development outcomes are clustered closely around the mean, a dichotomous development taxonomy with a threshold at the mean would be of questionable usefulness because countries with broadly similar development outcomes would be designated as being markedly different. In such a taxonomy, there would also be frequent and numerous reclassifications reflecting transitory idiosyncratic shocks to countries. For example, in 2008 about one-fifth of all countries had a life expectancy at birth of plus or minus three years around the world average of 69 years. A development taxonomy using longevity as the development proxy and with a threshold level of 69 years would result in splitting a large group of similar countries into two categories and then grouping these countries with other countries with significantly lower or higher levels of life expectancy. Therefore, in cases where the distribution of development outcomes renders a dichotomous taxonomy inappropriate, taxonomies with more than two groups of countries need to be considered. Figure 2 illustrates the case of a trichotomous development taxonomy (ignore for now the dotted lines). Let the three groups of countries in this taxonomy be labeled Lower Development Countries (LDC), Middle Development Countries (MDC), and Higher Development Countries (HDC). The synthetic development distribution consists of three linear segments. Countries up to and including 0x are designated LDC and countries above 1x
are designated HDC. The MDC are the countries located between these two thresholds. The expression for the error term now becomes the sum of five disjoint areas (three triangles and two rectangles) minus the area under the Lorenz curve. The five disjoint areas are:
I: 0 0
1( )
2x L x
II: 1 0 1 0 1 1 1 0 0 1 0 0
1 1 1 1 1( )( ( ) ( )) ( ) ( ) ( ) ( )
2 2 2 2 2x x L x L x x L x x L x x L x x L x
III: 1 1 1 1 1 1
1 1 1 1 1(1 )(1 ( )) ( ) ( )
2 2 2 2 2x L x L x x x L x
IV: 1 0 0 1 0 0 0( ) ( ) ( ) ( )x x L x x L x x L x
V: 1 1 1 1 1(1 ) ( ) ( ) ( )x L x L x x L x
28
Therefore 3E becomes:
3 0 0 1 1 1 0 0 1 0 0
1
1 1 1 1 1 0 0 0 1 1 1 0
1 1 1 1 1( ) ( ) ( ) ( ) ( )
2 2 2 2 21 1 1 1
( ) ( ) ( ) ( ) ( ) ( ) ( )2 2 2 2
E x L x x L x x L x x L x x L x
L x x x L x x L x x L x L x x L x L x dx
Collecting the terms, this reduces to:
1
3 1 1 0 1 1 0 0
1 1 0 1 0
1 1 1 1 1( ) ( ) ( ) ( )
2 2 2 2 21 1
( )[1 ] [1 ( )]2 2
E L x x x L x x L x L x dx
E L x x x L x
A reasonable taxonomy designating countries as LDC, MDC, or HDC is a taxonomy that minimizes the error term. The first order conditions for minimizing 3 0 1( , )E x x are as follows:
Figure 2. Trichotomous Development Taxonomy
1
0 1x0
L(x0)
E3
x1
L(x1
L'(x0)
L'(x1)
29
1
3 11 0 0
0 1
( )1 1( ) '( ) 0 '( )
2 2
E L xL x x L x L x
x x
3 01 0 0 1
1 0
1 ( )1 1'( )[1 ] [1 ( )] 0 '( )
2 2 1
E L xL x x L x L x
x x
The sufficient second order conditions are that
2
3 1 020
''( )0
2
E x L x
x
2
3 0 121
(1 ) ''( )0
2
E x L x
x
.
These conditions are met because ( )L x is strictly convex. An additional necessary second
order condition is that the determinant of the Hessian matrix is non-negative:
2 23 3 1 0 0 1
20 1 0
2 20 1 0 13 3
20 1 1
''( ) '( ) '( )?2 2
'( ) '( ) (1 ) ''( )
2 2
0E E x L x L x L xx x x
L x L x x L xE E
x x x
This is equivalent to evaluating the sign of the following expression: 2
1 0 0 1 0 1(1 ) ''( ) ''( ) ( '( ) '( ))x x L x L x L x L x
When the first order conditions are satisfied, the second derivatives are given by:
01 1
1 1 1 0 100 2 2 2
1 1 0 1 1
1 ( )( )
'( ) ( ) 1 ( ) ( )1''( )
(1 )
L xx L x
L x x L x L x L xxL x
x x x x x
10 0
0 0 0 1 011 2 2 2
0 0 0 1 0
( )(1 ) 1 ( )
'( )(1 ) 1 ( ) ( ) 1 ( )''( )
(1 ) (1 ) (1 ) (1 )
L xx L x
L x x L x L x L xxL x
x x x x x
Therefore, the expression can be rewritten as follows:
30
20 1 0 1 0 1
20 01 10 1 0 12 2
0 1 1 0 1 0
21 0 010 0 12
1 0 1 0
1
(1 ) ''( ) ''( ) ( '( ) '( ))
1 ( ) 1 ( )( ) ( )(1 ) { }{ } ( '( ) '( ))
(1 ) (1 ) (1 )
( )(1 ) 1 ( )( ){1 ( ) }{ } ( '( ) '( ))
(1 ) (1 )
(
x x L x L x L x L x
L x L xL x L xx x L x L x
x x x x x x
L x x L xL xL x L x L x
x x x x
L x
2
20 0 1 0 0 1 012 2 2
0 1 0 0 1 0 1 0 1
21 0 1 1 0 0 0 0 1
0 12 20 1 0 1
1 ( ) ( ) ( ) ( )[1 ( )] ( )[1 ( )]) ( )(...)
(1 ) (1 ) (1 ) (1 ) (1 )
( ) ( ) ( ) ( )[1 ( )] 1 ( ) ( )[1 ( )] ( )( '( ) '(
(1 ) (1 )
L x L x L x L x L x L x L xL x
x x x x x x x x x
L x L x L x L x L x L x L x L x L xL x L x
x x x x
2
2 221 0 1 0 0 0 0 1
0 12 20 1 0 1
2 220 01 1
0 12 21 0 0 1
2010 1
1 0
))
( )[1 ( )] ( )[1 ( )] 1 ( ) ( ) ( ) ( )( '( ) '( ))
(1 ) (1 )
1 ( ) (1 ( ))( ) ( )2 ( '( ) '( ))
1 (1 )
1 ( )( )[ ] ( '( ) '(
1
L x L x L x L x L x L x L x L xL x L x
x x x x
L x L xL x L xL x L x
x x x x
L xL xL x L x
x x
2))
0 As the determinant of the Hessian matrix is zero, all necessary second order conditions are met. The corner solution is when 0 10 1x x . That point, 3 1(0,1)E E , maximizes the
error. The interior point where the first order conditions are met is therefore a minimum. For a graphical solution to the optimization problem, refer back to Figure 2. The points 0x
and 1x must be jointly chosen such that 0'( )L x and 1'( )L x are equal to the slopes of the
corresponding dotted lines. The optimum trichotomous development taxonomy requires setting the threshold between LDC and MDC at the average development outcome of non-HDC and setting the threshold between MDC and HDC at the average development outcome of non-LDC. The actual distribution of development outcomes may be such that it renders a trichotomous taxonomy inappropriate for the same reasons that it may render a dichotomous taxonomy inappropriate, as discussed above. In such cases, a taxonomy with more than three categories is required. Fortunately, the methodology can easily be used to construct a taxonomy with any number of categories (less than the number of countries). An outline of the general case is presented in the appendix. In the general case, an optimal partition requires that each threshold, ix , is chosen such that the development outcome of country ix is equal to the
average development outcome of the countries in the interval from the previous threshold,
1ix , to the subsequent threshold, 1ix . For example, in a development taxonomy with four
categories: LDC, lower MDC, upper MDC, and HDC, the lowest threshold would be set such
31
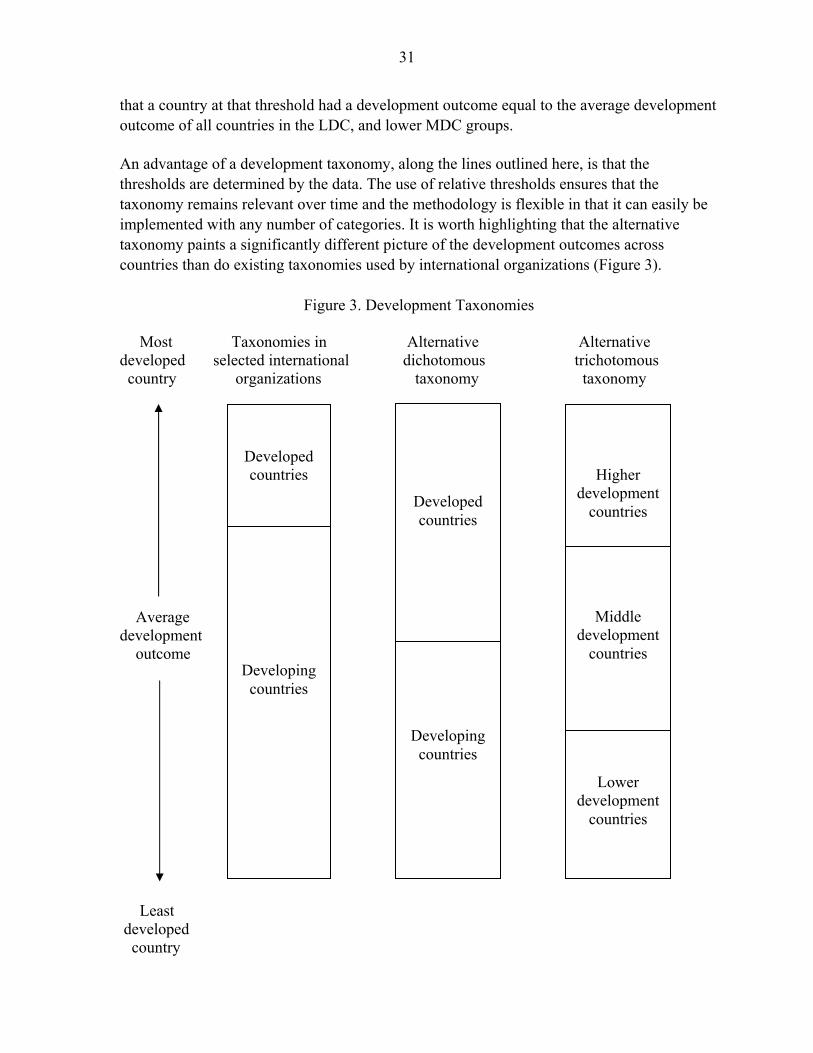
that a country at that threshold had a development outcome equal to the average development outcome of all countries in the LDC, and lower MDC groups. An advantage of a development taxonomy, along the lines outlined here, is that the thresholds are determined by the data. The use of relative thresholds ensures that the taxonomy remains relevant over time and the methodology is flexible in that it can easily be implemented with any number of categories. It is worth highlighting that the alternative taxonomy paints a significantly different picture of the development outcomes across countries than do existing taxonomies used by international organizations (Figure 3).
Figure 3. Development Taxonomies Most Taxonomies in Alternative Alternative developed selected international dichotomous trichotomous country organizations taxonomy taxonomy Average development outcome Least developed country
Developed countries
Higher development
countries
Developing countries
Middle development
countries
Lower development
countries
Developed countries
Developing countries
32
V. EXAMPLES OF ALTERNATIVE DEVELOPMENT TAXONOMIES
The methodology derived in the previous section can be used to construct a taxonomy using any ordinal measure of development such as, for instance, the World Bank’s ‘convenient’ measure or the UNDP’s direct measure. In this section, three different taxonomies will be presented using three different proxies for development: income (GNI/n), longevity (life expectancy at birth), and lifetime income. The latter proxy—constructed by multiplying the income and longevity variables—combines what may be considered the most important economic indicator and the most important social indicator of development outcomes. The variable shows the expected lifetime income of a newborn at a zero percent discount rate under the assumption of no future income growth.28 Market exchange rates are used to convert local currency per capita income measures into a common value, but one could also have used PPP. When constructing the development distribution, each country outcome can be treated as a single data point (i.e., using equal country weights) or country outcomes can be weighted together using countries’ share of world population. Given that the world’s population distribution is highly uneven (China and India account for more than one third of the total), a population-weighted distribution would arguably provide a better basis for constructing the taxonomy. However, as noted above, the UNDP uses equal country weights in spite of its strong focus on the human aspect of development. Therefore, the taxonomies are constructed in two variants (population- and equal-weighted). In Table 5 (population-weighted) and Table 6 (equal-weighted) trichotomous development taxonomies are shown using the three development proxies. The corresponding dichotomous taxonomies are embedded in the tables. An Excel workbook used to generate the tables is available upon request.
28 The use of a positive discount rate will shift the measure more toward a simple per capita income measure.

33
Table 5. Trichotomous Development Taxonomies (Population Weighted) 1/
Lifetime Income Income Longevity
1 Luxembourg Luxembourg Japan
2 Norway Norway Iceland
3 Switzerland Switzerland Switzerland
4 Iceland Iceland Australia
5 Denmark Denmark Italy
6 United States United States Sweden
7 Sweden Sweden Canada
8 Ireland Ireland Spain
9 Japan Netherlands France
10 Netherlands Japan Norway
11 United Kingdom United Kingdom Israel
12 Finland Finland Singapore
13 Austria Austria New Zealand
14 Belgium Belgium Ireland
15 France Germany Netherlands
16 Germany France Luxembourg
17 Canada Canada Austria
18 Italy Kuwait Cyprus
19 Kuwait Italy Germany
20 Australia Australia Malta
21 Singapore Singapore Greece
22 Spain United Arab Emirates United Kingdom
23 United Arab Emirates Spain Finland
24 New Zealand New Zealand Belgium
25 Brunei Darussalam Brunei Darussalam Costa Rica
26 Greece Greece Korea, Rep. of
27 Cyprus Cyprus Chile
28 Israel Israel Denmark 29 Bahamas, The Bahamas, The Portugal
30 Slovenia Slovenia United States
31 Portugal Portugal Kuwait
32 Korea, Rep. of Bahrain United Arab Emirates
33 Bahrain Korea, Rep. of Slovenia
34 Malta Malta Brunei Darussalam
35 Saudi Arabia Saudi Arabia Dominica
36 Czech Republic Czech Republic Barbados
37 Slovak Republic Slovak Republic Albania
38 Oman Trinidad and Tobago Czech Republic
39 Antigua and Barbuda Oman Uruguay
40 Hungary Antigua and Barbuda Belize
41 Trinidad and Tobago Hungary Bahrain
42 Croatia Estonia Antigua and Barbuda
43 Barbados Seychelles Croatia
44 Estonia Croatia Panama
45 Seychelles Barbados Oman

34
Table 5. Trichotomous Development Taxonomies (Population Weighted) 1/ (continued)
Lifetime Income Income Longevity
46 St. Kitts and Nevis St. Kitts and Nevis Poland
47 Mexico 2/ Mexico Argentina
48 Poland 2/ Palau Grenada
49 Palau Lithuania Bosnia and Herzegovina50 Lithuania Poland 2/ Ecuador
51 Latvia Latvia 2/ Mexico
52 Chile Libya Slovak Republic
53 Libya Turkey Montenegro
54 Turkey Chile Macedonia, former Yugoslav Rep. of
55 Lebanon Lebanon Sri Lanka
56 Grenada Mauritius Vietnam
57 Mauritius Botswana Malaysia
58 Malaysia Equatorial Guinea Libya
59 St. Lucia Grenada Syrian Arab Republic
60 Costa Rica Malaysia Tunisia
61 Uruguay Gabon Venezuela, Rep. Bol.
62 Venezuela, Rep. Bol. St. Lucia Armenia
63 Panama Venezuela, Rep. Bol. Hungary
64 Argentina Uruguay St. Lucia
65 Gabon South Africa Serbia66 Dominica Costa Rica China
67 Russia Panama Estonia
68 Brazil Argentina Bulgaria
69 Romania Russia Peru
70 Jamaica Brazil Mauritius
71 Botswana Romania Saudi Arabia
72 Belize Jamaica Bahamas, The
73 Montenegro Dominica Colombia
74 St. Vincent and the Grenadines St. Vincent and the Grenadines Seychelles75 Equatorial Guinea Montenegro Dominican Republic
76 Serbia Belize Romania
77 Bulgaria Fiji Jordan
78 South Africa Serbia Nicaragua
79 Fiji Bulgaria Algeria
80 Suriname Namibia Brazil
81 Bosnia and Herzegovina Suriname Honduras
82 Tunisia Marshall Islands Lebanon
83 Macedonia, former Yugoslav Rep. of Bosnia and Herzegovina Tonga
84 Colombia Kazakhstan Turkey
85 Marshall Islands Colombia Georgia
86 Dominican Republic Tunisia St. Kitts and Nevis
87 Ecuador Macedonia, former Yugoslav Rep. of Paraguay
88 Namibia Dominican Republic Jamaica
89 Albania El Salvador Lithuania
90 El Salvador Belarus Philippines
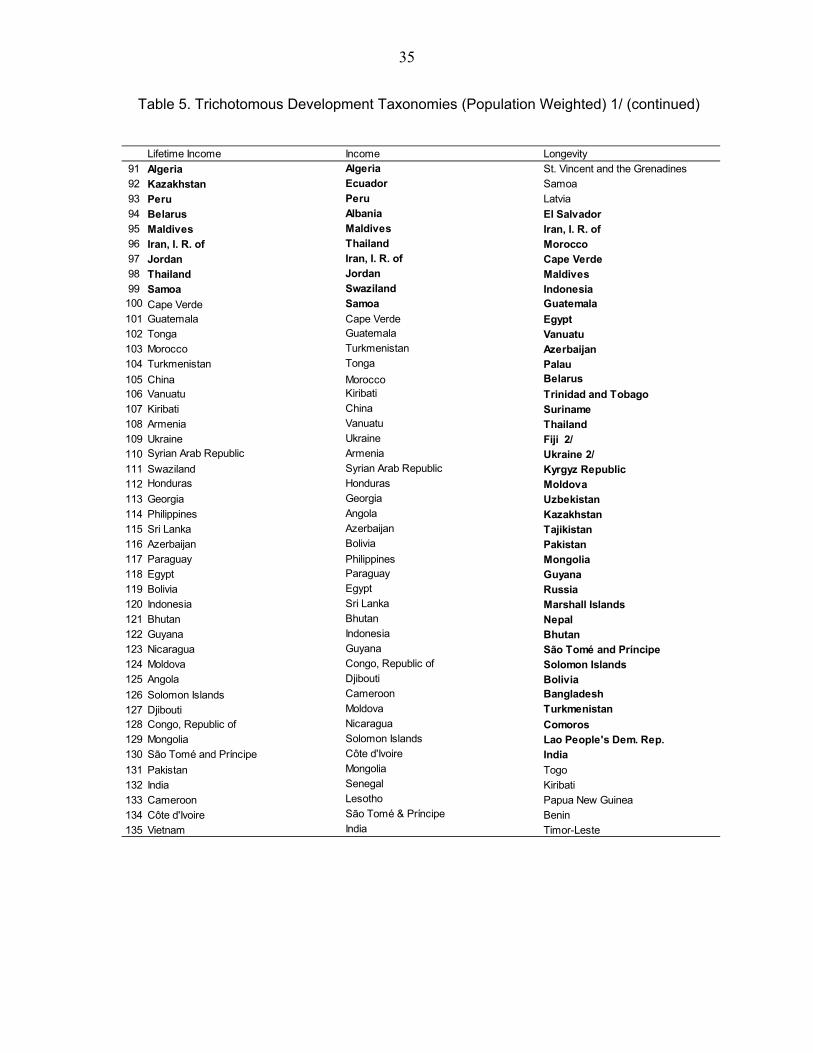
35
Table 5. Trichotomous Development Taxonomies (Population Weighted) 1/ (continued)
Lifetime Income Income Longevity
91 Algeria Algeria St. Vincent and the Grenadines
92 Kazakhstan Ecuador Samoa
93 Peru Peru Latvia
94 Belarus Albania El Salvador 95 Maldives Maldives Iran, I. R. of96 Iran, I. R. of Thailand Morocco 97 Jordan Iran, I. R. of Cape Verde 98 Thailand Jordan Maldives 99 Samoa Swaziland Indonesia 100 Cape Verde Samoa Guatemala
101 Guatemala Cape Verde Egypt 102 Tonga Guatemala Vanuatu 103 Morocco Turkmenistan Azerbaijan104 Turkmenistan Tonga Palau
105 China Morocco Belarus
106 Vanuatu Kiribati Trinidad and Tobago107 Kiribati China Suriname108 Armenia Vanuatu Thailand109 Ukraine Ukraine Fiji 2/110 Syrian Arab Republic Armenia Ukraine 2/111 Swaziland Syrian Arab Republic Kyrgyz Republic 112 Honduras Honduras Moldova 113 Georgia Georgia Uzbekistan 114 Philippines Angola Kazakhstan 115 Sri Lanka Azerbaijan Tajikistan116 Azerbaijan Bolivia Pakistan117 Paraguay Philippines Mongolia 118 Egypt Paraguay Guyana 119 Bolivia Egypt Russia120 Indonesia Sri Lanka Marshall Islands121 Bhutan Bhutan Nepal122 Guyana Indonesia Bhutan 123 Nicaragua Guyana São Tomé and Príncipe124 Moldova Congo, Republic of Solomon Islands 125 Angola Djibouti Bolivia
126 Solomon Islands Cameroon Bangladesh
127 Djibouti Moldova Turkmenistan
128 Congo, Republic of Nicaragua Comoros 129 Mongolia Solomon Islands Lao People's Dem. Rep.130 São Tomé and Príncipe Côte d'Ivoire India
131 Pakistan Mongolia Togo
132 India Senegal Kiribati
133 Cameroon Lesotho Papua New Guinea
134 Côte d'Ivoire São Tomé & Príncipe Benin
135 Vietnam India Timor-Leste

36
Table 5. Trichotomous Development Taxonomies (Population Weighted) 1/ (concluded)
Lifetime Income Income Longevity
136 Timor-Leste Timor-Leste Gabon
137 Senegal Pakistan Cambodia
138 Comoros Papua New Guinea Madagascar
139 Papua New Guinea Comoros Namibia
140 Uzbekistan Nigeria Eritrea 141 Lesotho Vietnam Sudan
142 Mauritania Mauritania Liberia
143 Sudan Sudan Ghana
144 Benin Benin Mauritania
145 Kyrgyz Republic Uzbekistan Guinea
146 Nigeria Kenya Côte d'Ivoire
147 Lao People's Dem. Rep. Zambia Gambia, The
148 Bangladesh Ghana Senegal 149 Kenya Cambodia Djibouti 150 Cambodia Kyrgyz Republic Ethiopia
151 Ghana Lao People's Dem. Rep. Tanzania
152 Tajikistan Bangladesh Congo, Republic of
153 Togo Chad Kenya
154 Zambia Mali Burkina Faso
155 Chad Burkina Faso South Africa
156 Mali Zimbabwe Malawi
157 Burkina Faso Guinea Botswana
158 Guinea Tanzania Cameroon
159 Nepal Togo Uganda
160 Tanzania Central African Rep. Niger
161 Madagascar Tajikistan Equatorial Guinea
162 Central African Rep. Madagascar Burundi
163 Uganda Uganda Chad
164 Zimbabwe Mozambique Rwanda
165 Gambia, The Nepal Mozambique
166 Mozambique Afghanistan, Rep. of Congo, Dem. Rep. of 167 Niger Gambia, The Mali
168 Rwanda Niger Nigeria
169 Afghanistan, Rep. of Rwanda Guinea-Bissau
170 Sierra Leone Sierra Leone Sierra Leone
171 Malawi Malawi Central African Rep. 172 Eritrea Guinea-Bissau Angola
173 Guinea-Bissau Eritrea Swaziland
174 Ethiopia Ethiopia Lesotho
175 Liberia Congo, Dem. Rep. of Afghanistan, Rep. of
176 Congo, Dem. Rep. of Liberia Zambia177 Burundi Burundi Zimbabwe
Sources: World Development Indicators (October 2010); and author's estimates.
1/ Countries are ranked from highest development outcome to lowest development outcome. Middle Development Countries are shown in bold typeface. 2/ Marginal developed country and marginal developing country in a dichotomous development taxonomy.
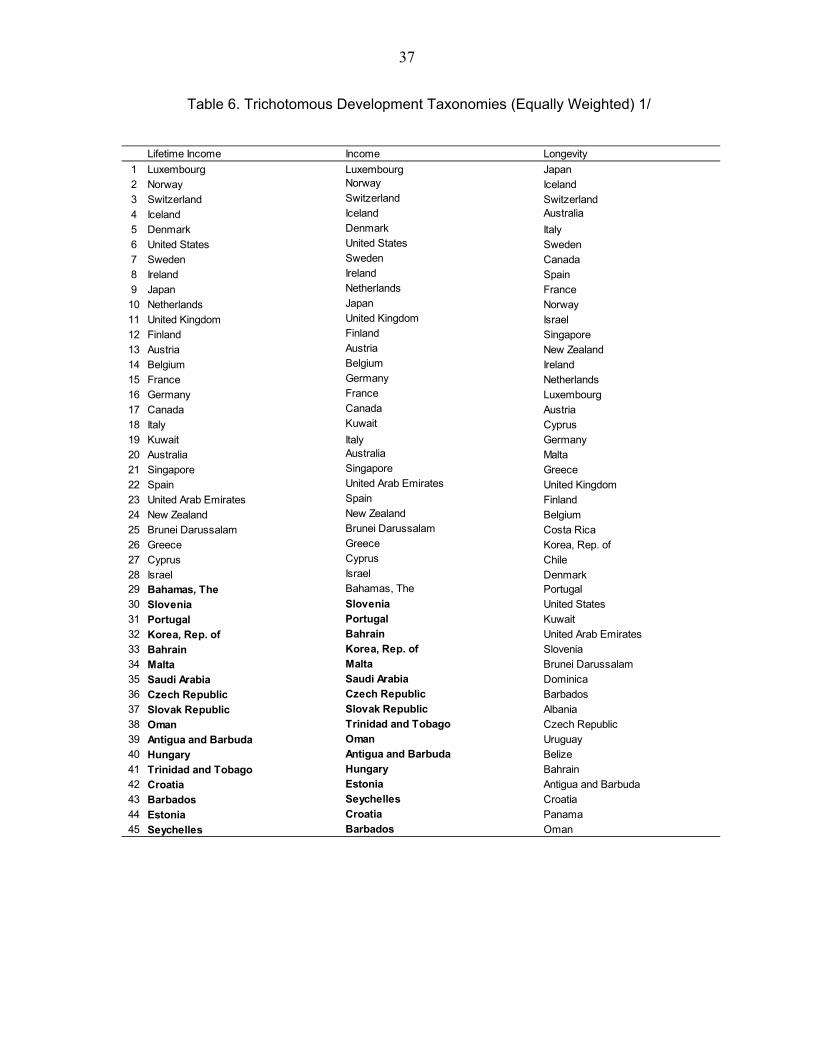
37
Table 6. Trichotomous Development Taxonomies (Equally Weighted) 1/
Lifetime Income Income Longevity
1 Luxembourg Luxembourg Japan
2 Norway Norway Iceland
3 Switzerland Switzerland Switzerland
4 Iceland Iceland Australia
5 Denmark Denmark Italy
6 United States United States Sweden
7 Sweden Sweden Canada
8 Ireland Ireland Spain
9 Japan Netherlands France
10 Netherlands Japan Norway
11 United Kingdom United Kingdom Israel
12 Finland Finland Singapore
13 Austria Austria New Zealand
14 Belgium Belgium Ireland
15 France Germany Netherlands
16 Germany France Luxembourg
17 Canada Canada Austria
18 Italy Kuwait Cyprus
19 Kuwait Italy Germany
20 Australia Australia Malta
21 Singapore Singapore Greece
22 Spain United Arab Emirates United Kingdom
23 United Arab Emirates Spain Finland
24 New Zealand New Zealand Belgium
25 Brunei Darussalam Brunei Darussalam Costa Rica
26 Greece Greece Korea, Rep. of
27 Cyprus Cyprus Chile
28 Israel Israel Denmark 29 Bahamas, The Bahamas, The Portugal
30 Slovenia Slovenia United States
31 Portugal Portugal Kuwait
32 Korea, Rep. of Bahrain United Arab Emirates
33 Bahrain Korea, Rep. of Slovenia
34 Malta Malta Brunei Darussalam
35 Saudi Arabia Saudi Arabia Dominica
36 Czech Republic Czech Republic Barbados
37 Slovak Republic Slovak Republic Albania
38 Oman Trinidad and Tobago Czech Republic
39 Antigua and Barbuda Oman Uruguay
40 Hungary Antigua and Barbuda Belize
41 Trinidad and Tobago Hungary Bahrain
42 Croatia Estonia Antigua and Barbuda
43 Barbados Seychelles Croatia
44 Estonia Croatia Panama
45 Seychelles Barbados Oman
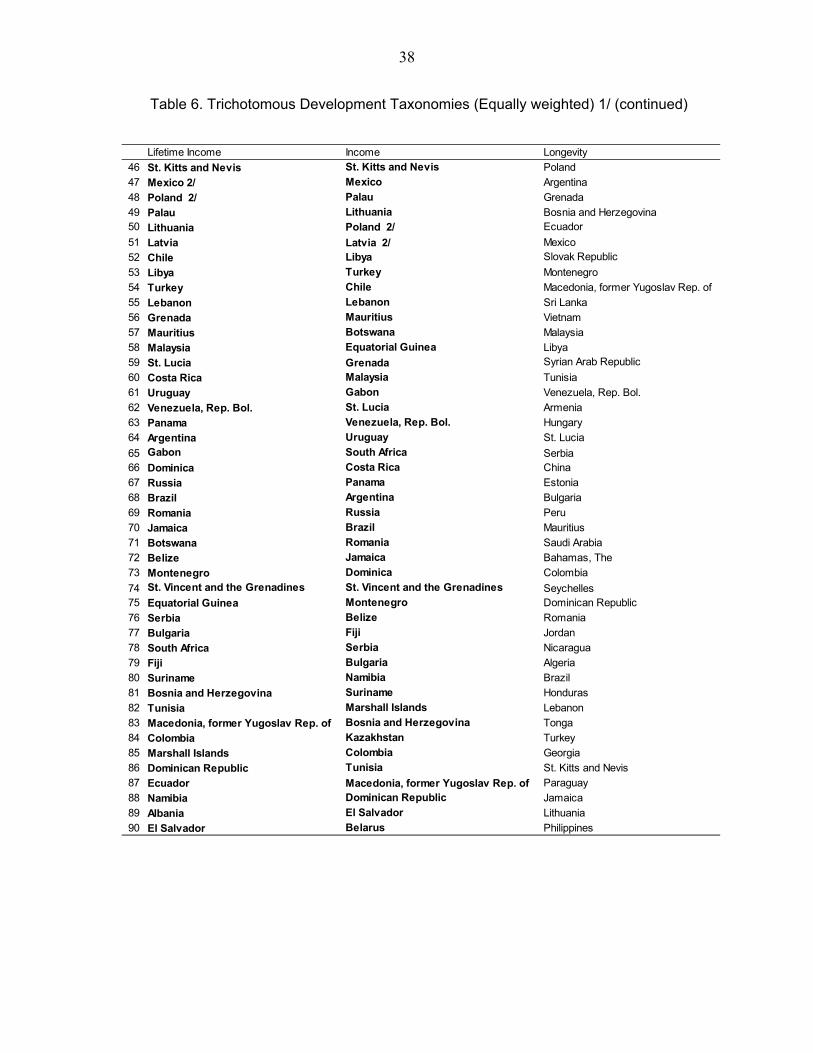
38
Table 6. Trichotomous Development Taxonomies (Equally weighted) 1/ (continued)
Lifetime Income Income Longevity
46 St. Kitts and Nevis St. Kitts and Nevis Poland
47 Mexico 2/ Mexico Argentina
48 Poland 2/ Palau Grenada
49 Palau Lithuania Bosnia and Herzegovina50 Lithuania Poland 2/ Ecuador
51 Latvia Latvia 2/ Mexico
52 Chile Libya Slovak Republic
53 Libya Turkey Montenegro
54 Turkey Chile Macedonia, former Yugoslav Rep. of
55 Lebanon Lebanon Sri Lanka
56 Grenada Mauritius Vietnam
57 Mauritius Botswana Malaysia
58 Malaysia Equatorial Guinea Libya
59 St. Lucia Grenada Syrian Arab Republic
60 Costa Rica Malaysia Tunisia
61 Uruguay Gabon Venezuela, Rep. Bol.
62 Venezuela, Rep. Bol. St. Lucia Armenia
63 Panama Venezuela, Rep. Bol. Hungary
64 Argentina Uruguay St. Lucia
65 Gabon South Africa Serbia66 Dominica Costa Rica China
67 Russia Panama Estonia
68 Brazil Argentina Bulgaria
69 Romania Russia Peru
70 Jamaica Brazil Mauritius
71 Botswana Romania Saudi Arabia
72 Belize Jamaica Bahamas, The
73 Montenegro Dominica Colombia
74 St. Vincent and the Grenadines St. Vincent and the Grenadines Seychelles75 Equatorial Guinea Montenegro Dominican Republic
76 Serbia Belize Romania
77 Bulgaria Fiji Jordan
78 South Africa Serbia Nicaragua
79 Fiji Bulgaria Algeria
80 Suriname Namibia Brazil
81 Bosnia and Herzegovina Suriname Honduras
82 Tunisia Marshall Islands Lebanon
83 Macedonia, former Yugoslav Rep. of Bosnia and Herzegovina Tonga
84 Colombia Kazakhstan Turkey
85 Marshall Islands Colombia Georgia
86 Dominican Republic Tunisia St. Kitts and Nevis
87 Ecuador Macedonia, former Yugoslav Rep. of Paraguay
88 Namibia Dominican Republic Jamaica
89 Albania El Salvador Lithuania
90 El Salvador Belarus Philippines
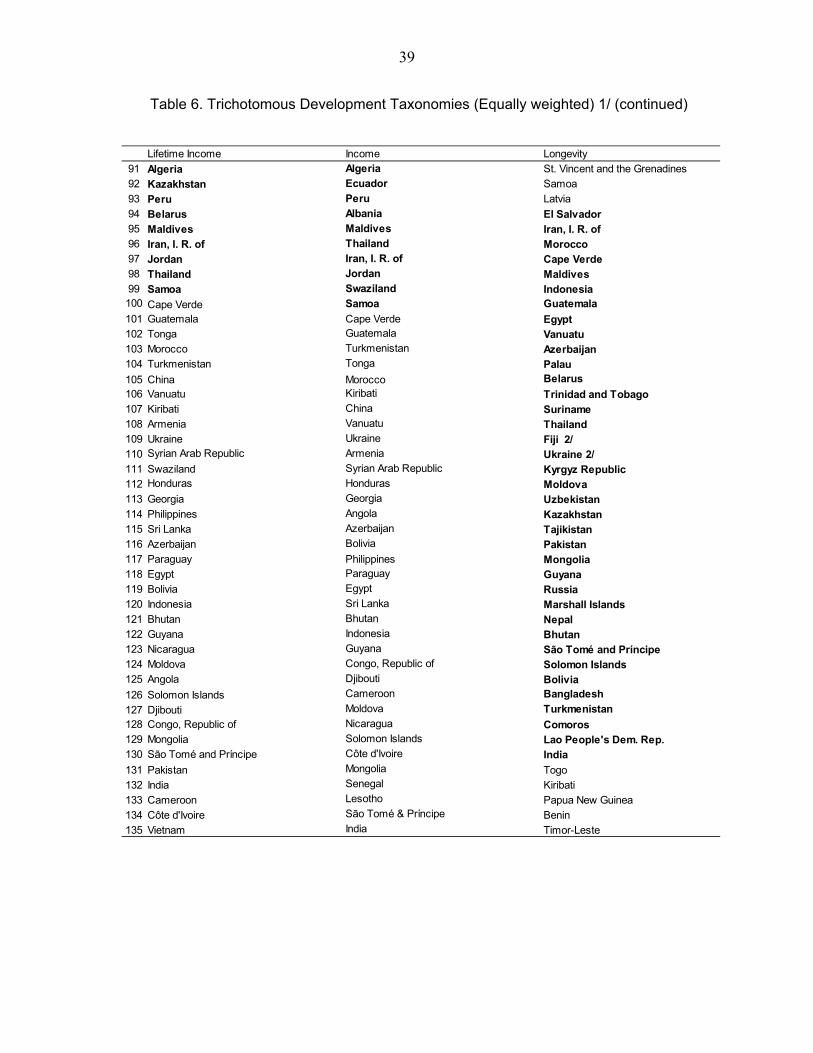
39
Table 6. Trichotomous Development Taxonomies (Equally weighted) 1/ (continued)
Lifetime Income Income Longevity
91 Algeria Algeria St. Vincent and the Grenadines
92 Kazakhstan Ecuador Samoa
93 Peru Peru Latvia
94 Belarus Albania El Salvador 95 Maldives Maldives Iran, I. R. of96 Iran, I. R. of Thailand Morocco 97 Jordan Iran, I. R. of Cape Verde 98 Thailand Jordan Maldives 99 Samoa Swaziland Indonesia 100 Cape Verde Samoa Guatemala
101 Guatemala Cape Verde Egypt 102 Tonga Guatemala Vanuatu 103 Morocco Turkmenistan Azerbaijan104 Turkmenistan Tonga Palau
105 China Morocco Belarus
106 Vanuatu Kiribati Trinidad and Tobago107 Kiribati China Suriname108 Armenia Vanuatu Thailand109 Ukraine Ukraine Fiji 2/110 Syrian Arab Republic Armenia Ukraine 2/111 Swaziland Syrian Arab Republic Kyrgyz Republic 112 Honduras Honduras Moldova 113 Georgia Georgia Uzbekistan 114 Philippines Angola Kazakhstan 115 Sri Lanka Azerbaijan Tajikistan116 Azerbaijan Bolivia Pakistan117 Paraguay Philippines Mongolia 118 Egypt Paraguay Guyana 119 Bolivia Egypt Russia120 Indonesia Sri Lanka Marshall Islands121 Bhutan Bhutan Nepal122 Guyana Indonesia Bhutan 123 Nicaragua Guyana São Tomé and Príncipe124 Moldova Congo, Republic of Solomon Islands 125 Angola Djibouti Bolivia
126 Solomon Islands Cameroon Bangladesh
127 Djibouti Moldova Turkmenistan
128 Congo, Republic of Nicaragua Comoros 129 Mongolia Solomon Islands Lao People's Dem. Rep.130 São Tomé and Príncipe Côte d'Ivoire India
131 Pakistan Mongolia Togo
132 India Senegal Kiribati
133 Cameroon Lesotho Papua New Guinea
134 Côte d'Ivoire São Tomé & Príncipe Benin
135 Vietnam India Timor-Leste
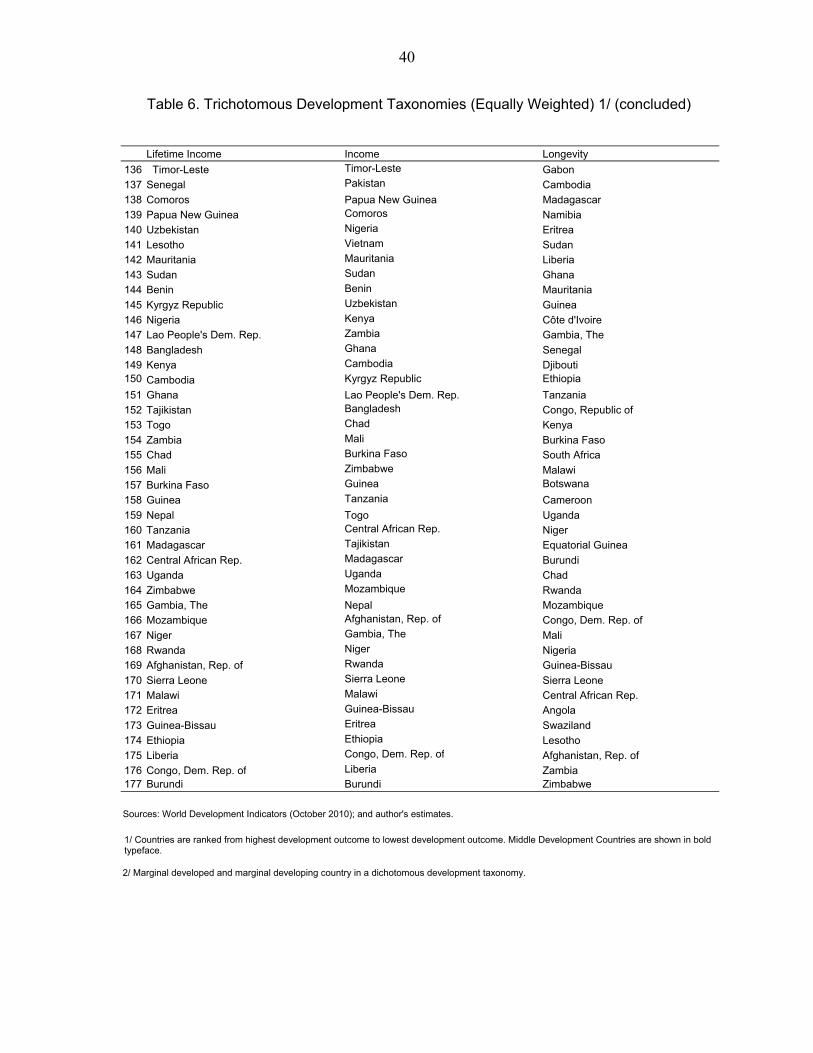
40
Table 6. Trichotomous Development Taxonomies (Equally Weighted) 1/ (concluded)
Lifetime Income Income Longevity
136 Timor-Leste Timor-Leste Gabon
137 Senegal Pakistan Cambodia
138 Comoros Papua New Guinea Madagascar
139 Papua New Guinea Comoros Namibia
140 Uzbekistan Nigeria Eritrea 141 Lesotho Vietnam Sudan
142 Mauritania Mauritania Liberia
143 Sudan Sudan Ghana
144 Benin Benin Mauritania
145 Kyrgyz Republic Uzbekistan Guinea
146 Nigeria Kenya Côte d'Ivoire
147 Lao People's Dem. Rep. Zambia Gambia, The
148 Bangladesh Ghana Senegal 149 Kenya Cambodia Djibouti 150 Cambodia Kyrgyz Republic Ethiopia
151 Ghana Lao People's Dem. Rep. Tanzania
152 Tajikistan Bangladesh Congo, Republic of 153 Togo Chad Kenya
154 Zambia Mali Burkina Faso
155 Chad Burkina Faso South Africa
156 Mali Zimbabwe Malawi
157 Burkina Faso Guinea Botswana
158 Guinea Tanzania Cameroon
159 Nepal Togo Uganda
160 Tanzania Central African Rep. Niger
161 Madagascar Tajikistan Equatorial Guinea
162 Central African Rep. Madagascar Burundi
163 Uganda Uganda Chad
164 Zimbabwe Mozambique Rwanda
165 Gambia, The Nepal Mozambique
166 Mozambique Afghanistan, Rep. of Congo, Dem. Rep. of 167 Niger Gambia, The Mali
168 Rwanda Niger Nigeria
169 Afghanistan, Rep. of Rwanda Guinea-Bissau
170 Sierra Leone Sierra Leone Sierra Leone
171 Malawi Malawi Central African Rep. 172 Eritrea Guinea-Bissau Angola
173 Guinea-Bissau Eritrea Swaziland
174 Ethiopia Ethiopia Lesotho
175 Liberia Congo, Dem. Rep. of Afghanistan, Rep. of 176 Congo, Dem. Rep. of Liberia Zambia177 Burundi Burundi Zimbabwe
Sources: World Development Indicators (October 2010); and author's estimates.
1/ Countries are ranked from highest development outcome to lowest development outcome. Middle Development Countries are shown in bold typeface.
2/ Marginal developed and marginal developing country in a dichotomous development taxonomy.
41
VI. CONCLUDING REMARKS
This paper has explored how to construct a classification system based on countries’ development attainment. The UNDP, the World Bank, and the IMF approach this issue very differently (including as regards to choice of terminology). Nonetheless, their taxonomies are similar in that they designate about 20–25 percent of countries as developed. The group of developing countries is therefore large and all three institutions have found it useful to identify subgroups among developing countries. Existing taxonomies suffer from lack of clarity with regard to how they distinguish among country groupings. The World Bank does not explain why the threshold between developed and developing countries is a per capita income level of US$6,000 in 1987-prices and the UNDP does not provide any rationale for why the ratio of developed and developing countries is one to three. As for the IMF’s classification system, it is not clear what threshold is used. The paper proposes an alternative transparent methodology where data—rather than judgment or ad hoc rules—determine the thresholds. In the dichotomous version of this system, the threshold between developing and developed countries—pitched at the average development outcome—lies well below existing thresholds used by international organizations. Such a taxonomy would be a major departure from existing ones. The taxonomy would also provide a poor fit for the increasing diversity in development outcomes across countries. For those two reasons, a dichotomous classification system may be found wanting. A trichotomous taxonomy would better capture the observed diversity. In the trichotomous system, the group of higher development countries is broadly equal to the group of developed countries in existing systems and the two lower groups provide for the distinction among developing countries that all three institutions find warranted. The taxonomy can be implemented using a variety of development proxies. Multivariate proxies—such as the UNDP’s HDI or a lifetime income measure—can easily be incorporated into this framework. Taxonomy matters and a more principled, data-driven approach to the construction of country classification systems could prove useful. It is therefore worthwhile to explore how a generally accepted, rational and principle-based country classification system ought to look like. This paper has addressed the question of how development thresholds can be established for a given data set, but unanswered questions remain as to what constitutes the optimal number of categories and what is the appropriate choice of development proxy.
42
References Bell, Clive, 1989, The New Palgrave: Economic Development (New York: W.W. Norton &
Company, Inc.) Boughton, James M., 2001, Silent Revolution: The International Monetary Fund 1979–1989
(Washington: International Monetary Fund). Chen, Shaohua and Martin Ravallion, 2010, “The Developing World is Poorer than we
Thought, but no Less Successful in the Fight Against Poverty,” Quarterly Journal of Economics, Vol. 125 (4), 1577-1625.
Garritsen de Vries, Margaret, 1985, The International Monetary Fund 1972–78: Cooperation
on Trial (Washington: International Monetary Fund). Horsefield, J. Keith, 1969, The International Monetary Fund 1945–1965: Twenty Years of
International Monetary Cooperation (Washington: International Monetary Fund). International Monetary Fund, World Economic Outlook (Washington, various issues). ______, 2009, Selected Decisions and Selected Documents of the International Monetary
Fund, Thirty-fourth Issue (Washington). ______, 2010, “Eligibility to Use the Fund’s Facilities for Concessional Financing,”
January 11 (Washington). Mason, Edward S. and Robert E. Asher, 1973, The World Bank Since Bretton Woods
(Washington: The Brookings Institution). Pearson, Lester B, et al, 1969, Partners in Development: Report of the Commission on
International Development (New York: Praeger Publishers). Sen, Amartya, 1999, Development As Freedom (New York: Random House). United Nations, Report on International Definition and Measurement of Standards and
Levels of Living, 1954 (New York). United Nations Development Programme, 1990, Human Development Report 1990
(New York: Oxford University Press). ______, 2007, Human Development Report 2007/08 (New York: Oxford University Press). ______, 2009, Human Development Report 2009 (New York: Oxford University Press). ______, 2010, Human Development Report 2010 (New York: Oxford University Press).
43
World Bank, 1978, World Development Report 1978 (Washington). ______, 1989, World Development Report 1989 (Washington). ______, 2000, World Development Report 2000/2001 (Washington). ______, 2010, World Development Indicators (Washington), available at
http://data.worldbank.org/data-catalog/world-development-indicators/wdi-2010
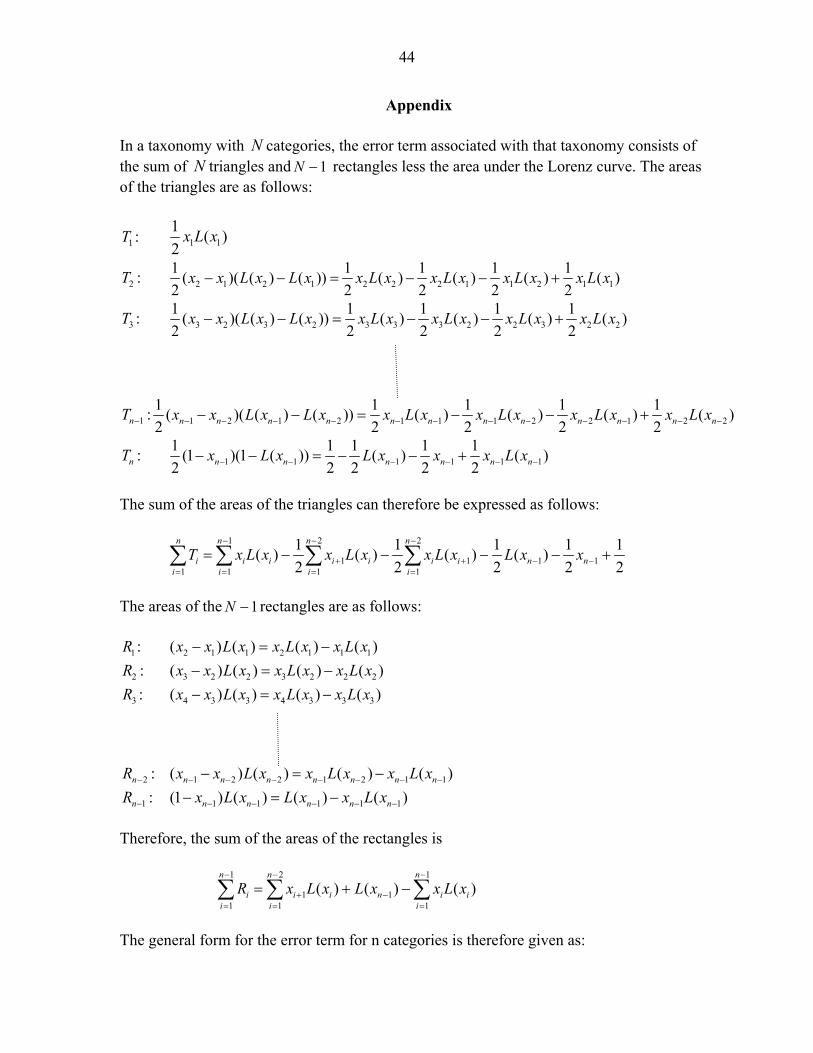
44
Appendix In a taxonomy with N categories, the error term associated with that taxonomy consists of the sum of N triangles and 1N rectangles less the area under the Lorenz curve. The areas of the triangles are as follows:
1T : 1 1
1( )
2x L x
2T : 2 1 2 1 2 2 2 1 1 2 1 1
1 1 1 1 1( )( ( ) ( )) ( ) ( ) ( ) ( )
2 2 2 2 2x x L x L x x L x x L x x L x x L x
3T : 3 2 3 2 3 3 3 2 2 3 2 2
1 1 1 1 1( )( ( ) ( )) ( ) ( ) ( ) ( )
2 2 2 2 2x x L x L x x L x x L x x L x x L x
1nT : 1 2 1 2 1 1 1 2 2 1 2 2
1 1 1 1 1( )( ( ) ( )) ( ) ( ) ( ) ( )
2 2 2 2 2n n n n n n n n n n n nx x L x L x x L x x L x x L x x L x
nT : 1 1 1 1 1 1
1 1 1 1 1(1 )(1 ( )) ( ) ( )
2 2 2 2 2n n n n n nx L x L x x x L x
The sum of the areas of the triangles can therefore be expressed as follows:
1 2 2
1 1 1 11 1 1 1
1 1 1 1 1( ) ( ) ( ) ( )
2 2 2 2 2
n n n n
i i i i i i i n ni i i i
T x L x x L x x L x L x x
The areas of the 1N rectangles are as follows:
1R : 2 1 1 2 1 1 1( ) ( ) ( ) ( )x x L x x L x x L x
2R : 3 2 2 3 2 2 2( ) ( ) ( ) ( )x x L x x L x x L x
3R : 4 3 3 4 3 3 3( ) ( ) ( ) ( )x x L x x L x x L x
2nR : 1 2 2 1 2 1 1( ) ( ) ( ) ( )n n n n n n nx x L x x L x x L x
1nR : 1 1 1 1 1(1 ) ( ) ( ) ( )n n n n nx L x L x x L x
Therefore, the sum of the areas of the rectangles is
1 2 1
1 11 1 1
( ) ( ) ( )n n n
i i i n i ii i i
R x L x L x x L x
The general form for the error term for n categories is therefore given as:
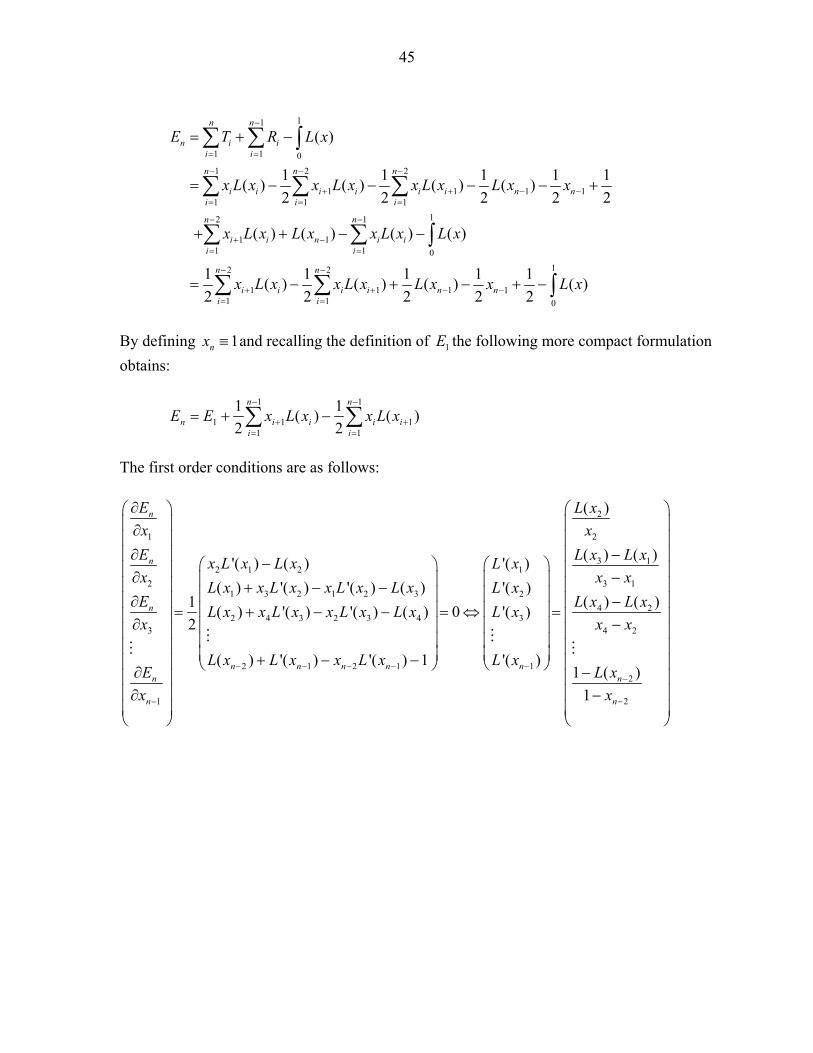
45
11
1 1 0
1 2 2
1 1 1 11 1 1
12 1
1 11 1 0
2 2
1 1 11 1
( )
1 1 1 1 1( ) ( ) ( ) ( )
2 2 2 2 2
( ) ( ) ( ) ( )
1 1 1 1( ) ( ) ( )
2 2 2 2
n n
n i ii i
n n n
i i i i i i n ni i i
n n
i i n i ii i
n n
i i i i ni i
E T R L x
x L x x L x x L x L x x
x L x L x x L x L x
x L x x L x L x
1
1
0
1( )
2nx L x
By defining 1nx and recalling the definition of 1E the following more compact formulation
obtains:
1 1
1 1 11 1
1 1( ) ( )
2 2
n n
n i i i ii i
E E x L x x L x
The first order conditions are as follows:
1
2 1 2 1
21 3 2 1 2 3 2
2 4 3 2 3 4 33
2 1 2 1
1
'( ) ( ) '( )
( ) '( ) '( ) ( ) '( )1
( ) '( ) '( ) ( ) 0 '(2
( ) '( ) '( ) 1
n
n
n
n n n nn
n
E
x
E x L x L x L xx
L x x L x x L x L x L xE
L x x L x x L x L x L xx
L x L x x L xE
x
2
2
3 1
3 1
4 2
4 2
12
2
( )
( ) ( )
( ) ( ))
'( )1 ( )
1
nn
n
L x
x
L x L x
x x
L x L x
x x
L xL x
x