Embed Size (px)
Citation preview
© 2011 Inspiration Software, Inc. You may use and modify this lesson plan for any non-commercial, instructional use.
1
Classifying Flowering Plants
Lesson Plan Subject Area: Science Grade Levels: The lesson can be adapted for grades 4–12 (ages 9–18). Time: At least two 45-minute class periods; time outside of class as necessary Lesson Objectives:
Students will:
• Classify and record measurement data about flowering plants.
• Develop a basic understanding of the Linnaean classification system.
• Build data literacy skills by comparing the plants using dynamic, visual plots.
• Explain their findings in writing and visual slide shows.
Standards:
National Science Education Standards1:
Science as Inquiry – Content Standard A
All students should develop
• Abilities necessary to do scientific inquiry.
Life Science – Content Standard C
All students should develop understanding of
• Diversity and adaptations of organisms.
Common Core State Standards2:
Common Core State Standards for Mathematics:
Mathematical Practices
• Make sense of problems and persevere in solving them.
• Reason abstractly and quantitatively.
• Use appropriate tools strategically.
Measurement and Data
• Represent and interpret data.
Statistics and Probability
• Summarize and describe distributions.
© 2011 Inspiration Software, Inc. You may use and modify this lesson plan for any non-commercial, instructional use.
2
College and Career Readiness Anchor Standards for Writing:
Standard 6. Use technology, including the Internet, to produce and publish writing and to
interact and collaborate with others.
Standard 7. Conduct short as well as more sustained research projects based on focused
questions, demonstrating understanding of the subject under investigation.
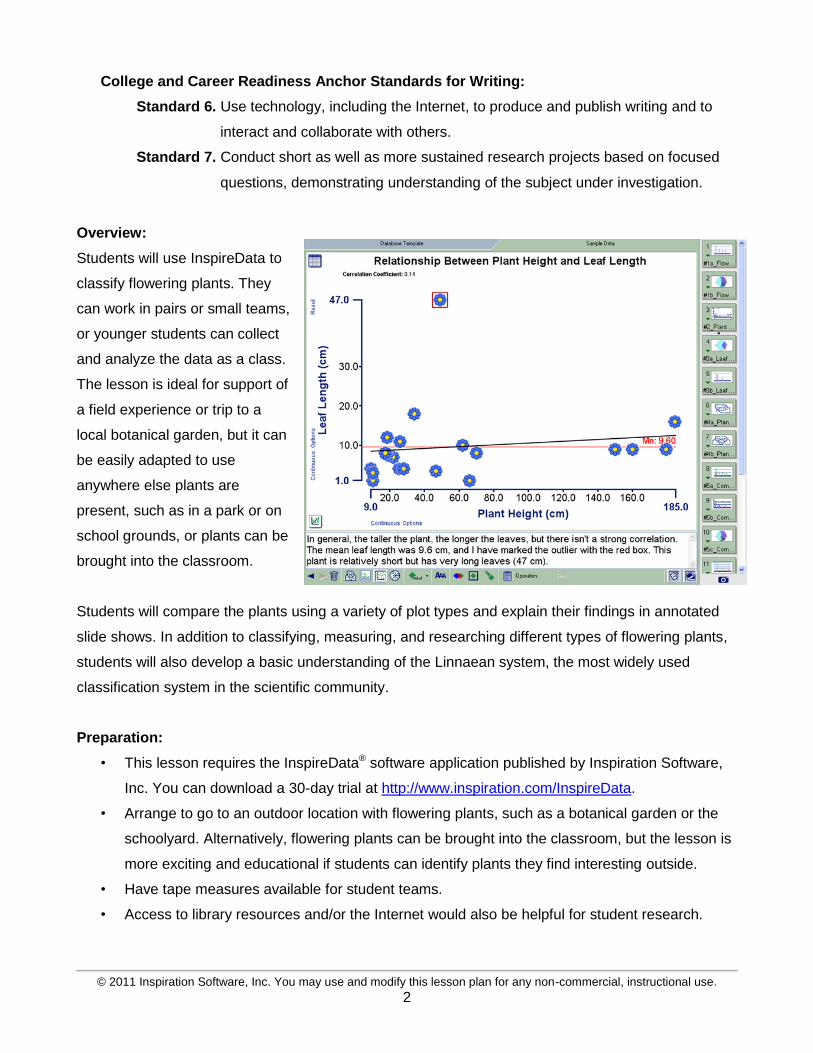
Overview:
Students will use InspireData to
classify flowering plants. They
can work in pairs or small teams,
or younger students can collect
and analyze the data as a class.
The lesson is ideal for support of
a field experience or trip to a
local botanical garden, but it can
be easily adapted to use
anywhere else plants are
present, such as in a park or on
school grounds, or plants can be
brought into the classroom.
Students will compare the plants using a variety of plot types and explain their findings in annotated
slide shows. In addition to classifying, measuring, and researching different types of flowering plants,
students will also develop a basic understanding of the Linnaean system, the most widely used
classification system in the scientific community.
Preparation:
• This lesson requires the InspireData® software application published by Inspiration Software,
Inc. You can download a 30-day trial at http://www.inspiration.com/InspireData.
• Arrange to go to an outdoor location with flowering plants, such as a botanical garden or the
schoolyard. Alternatively, flowering plants can be brought into the classroom, but the lesson is
more exciting and educational if students can identify plants they find interesting outside.
• Have tape measures available for student teams.
• Access to library resources and/or the Internet would also be helpful for student research.
© 2011 Inspiration Software, Inc. You may use and modify this lesson plan for any non-commercial, instructional use.
3
Lesson:
1. Begin by asking students if they know what it means to classify and how they might classify
things in their everyday lives. For example, how might they classify forms of writing or types of
lab equipment? Tell them that today they will have the opportunity to observe and classify
plants using InspireData.
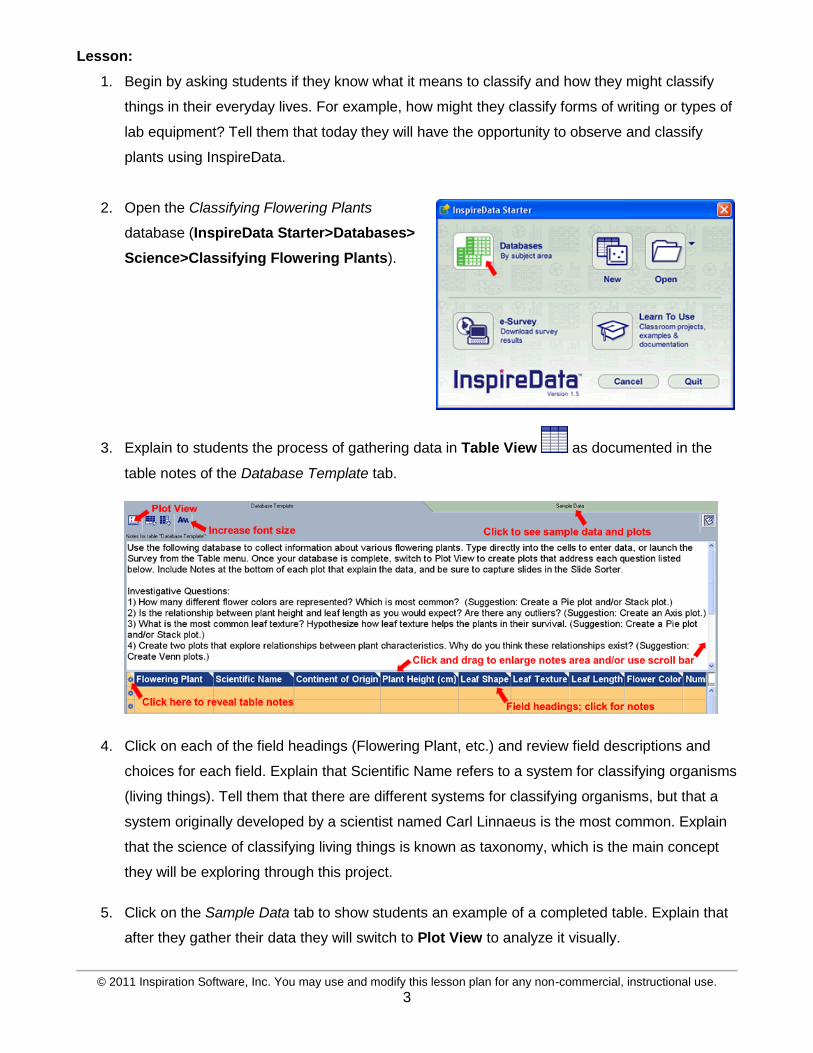
2. Open the Classifying Flowering Plants
database (InspireData Starter>Databases>
Science>Classifying Flowering Plants).
3. Explain to students the process of gathering data in Table View as documented in the
table notes of the Database Template tab.
4. Click on each of the field headings (Flowering Plant, etc.) and review field descriptions and
choices for each field. Explain that Scientific Name refers to a system for classifying organisms
(living things). Tell them that there are different systems for classifying organisms, but that a
system originally developed by a scientist named Carl Linnaeus is the most common. Explain
that the science of classifying living things is known as taxonomy, which is the main concept
they will be exploring through this project.
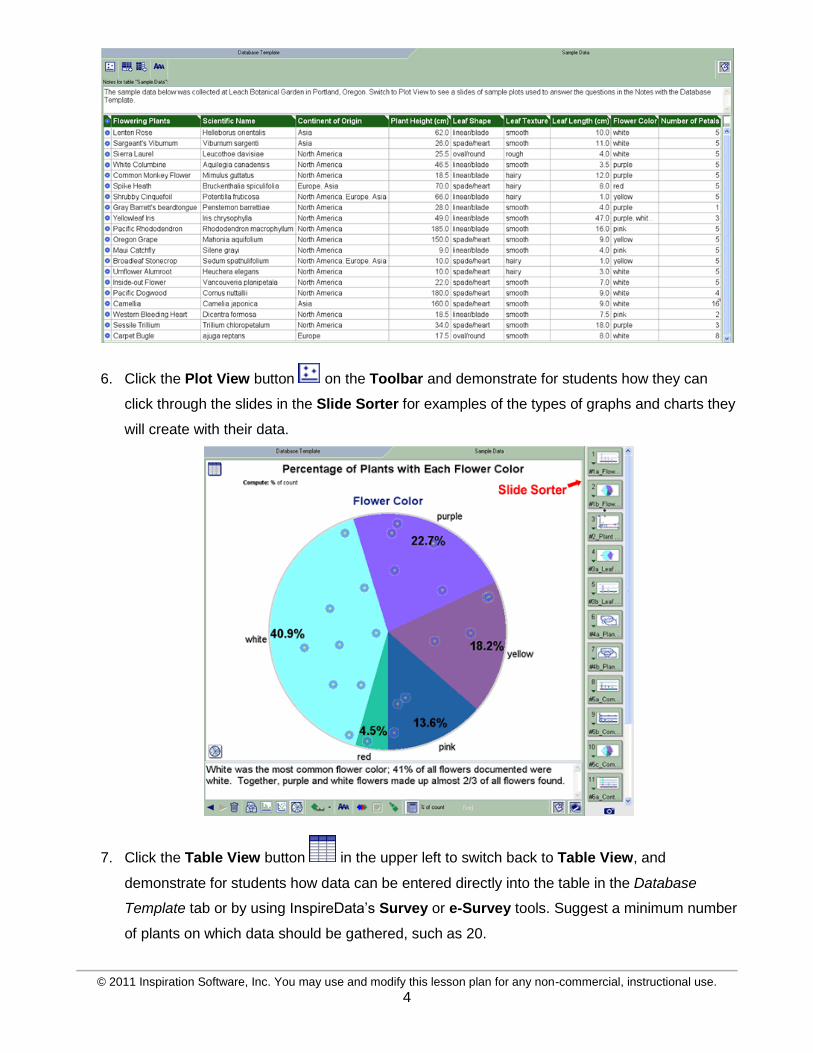
5. Click on the Sample Data tab to show students an example of a completed table. Explain that
after they gather their data they will switch to Plot View to analyze it visually.
© 2011 Inspiration Software, Inc. You may use and modify this lesson plan for any non-commercial, instructional use.
4
6. Click the Plot View button on the Toolbar and demonstrate for students how they can
click through the slides in the Slide Sorter for examples of the types of graphs and charts they
will create with their data.
7. Click the Table View button in the upper left to switch back to Table View, and
demonstrate for students how data can be entered directly into the table in the Database
Template tab or by using InspireData’s Survey or e-Survey tools. Suggest a minimum number
of plants on which data should be gathered, such as 20.
© 2011 Inspiration Software, Inc. You may use and modify this lesson plan for any non-commercial, instructional use.
5
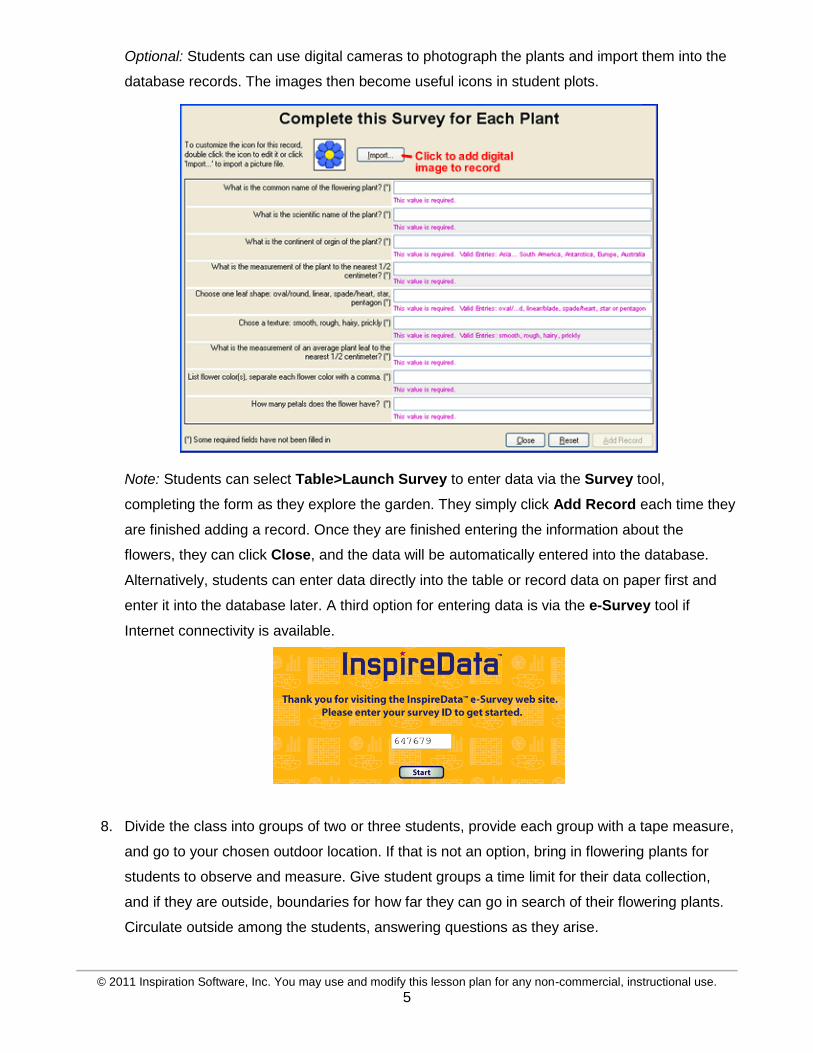
Optional: Students can use digital cameras to photograph the plants and import them into the
database records. The images then become useful icons in student plots.
Note: Students can select Table>Launch Survey to enter data via the Survey tool,
completing the form as they explore the garden. They simply click Add Record each time they
are finished adding a record. Once they are finished entering the information about the
flowers, they can click Close, and the data will be automatically entered into the database.
Alternatively, students can enter data directly into the table or record data on paper first and
enter it into the database later. A third option for entering data is via the e-Survey tool if
Internet connectivity is available.
8. Divide the class into groups of two or three students, provide each group with a tape measure,
and go to your chosen outdoor location. If that is not an option, bring in flowering plants for
students to observe and measure. Give student groups a time limit for their data collection,
and if they are outside, boundaries for how far they can go in search of their flowering plants.
Circulate outside among the students, answering questions as they arise.
© 2011 Inspiration Software, Inc. You may use and modify this lesson plan for any non-commercial, instructional use.
6
9. When data collection is completed, return to class or to a computer lab and remind students
how they can access the table notes. These include Possible Investigations they will be trying
to answer via data analysis.
Questions include:
• How many different flower colors are represented? Which is most common?
(Suggestion: Use the Pie plot and/or Stack plot tool.)
• Is the relationship between plant height and leaf length as you would expect? Are there
any outliers? (Suggestion: Use the Axis plot tool.)
• What is the most common leaf texture? Hypothesize how leaf texture helps the plants
in their survival. (Suggestion: Use the Pie plot and/or Stack plot tool.)
• Create two plots that explore relationships between plant characteristics. Why do you
think these relationships exist? (Suggestion: Use the Venn plot tool.)
• Advanced questions for older students if they complete the basic questions:
• Do plants with the same color of flowers have any other characteristics in common?
If so, which characteristics? (Suggestions: Use the Stack plot tool with Color by
Field feature, or Multiple Stack plot and/or Pie plot tool with Color by Field
feature.)
• Are there similarities among plants that originate from the same continent?
(Suggestions: Use the Stack plot tool with Color by Field feature, or Multiple
Stack plot or Pie plot tool with Color by Field feature.)
• Explore a relationship between two numerical fields and mark any outliers.
(Suggestion: Use the Axis plot tool with Mark and Label features.)
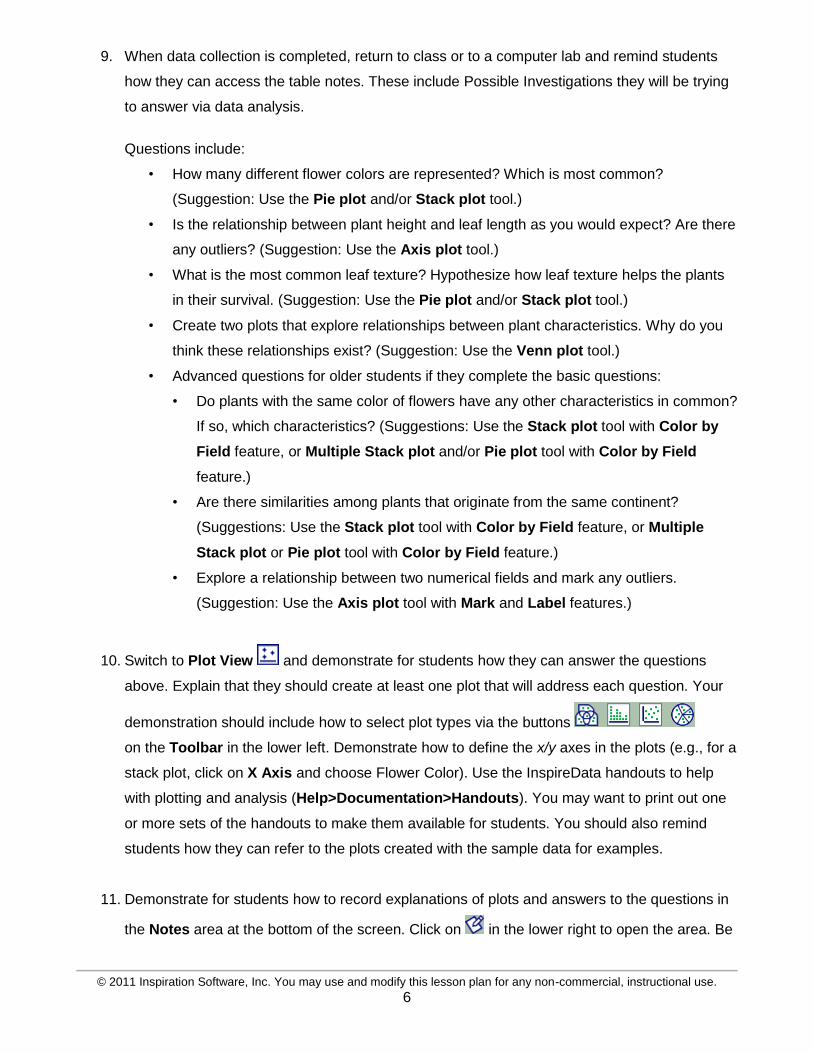
10. Switch to Plot View and demonstrate for students how they can answer the questions
above. Explain that they should create at least one plot that will address each question. Your
demonstration should include how to select plot types via the buttons
on the Toolbar in the lower left. Demonstrate how to define the x/y axes in the plots (e.g., for a
stack plot, click on X Axis and choose Flower Color). Use the InspireData handouts to help
with plotting and analysis (Help>Documentation>Handouts). You may want to print out one
or more sets of the handouts to make them available for students. You should also remind
students how they can refer to the plots created with the sample data for examples.
11. Demonstrate for students how to record explanations of plots and answers to the questions in
the Notes area at the bottom of the screen. Click on in the lower right to open the area. Be
© 2011 Inspiration Software, Inc. You may use and modify this lesson plan for any non-commercial, instructional use.
7
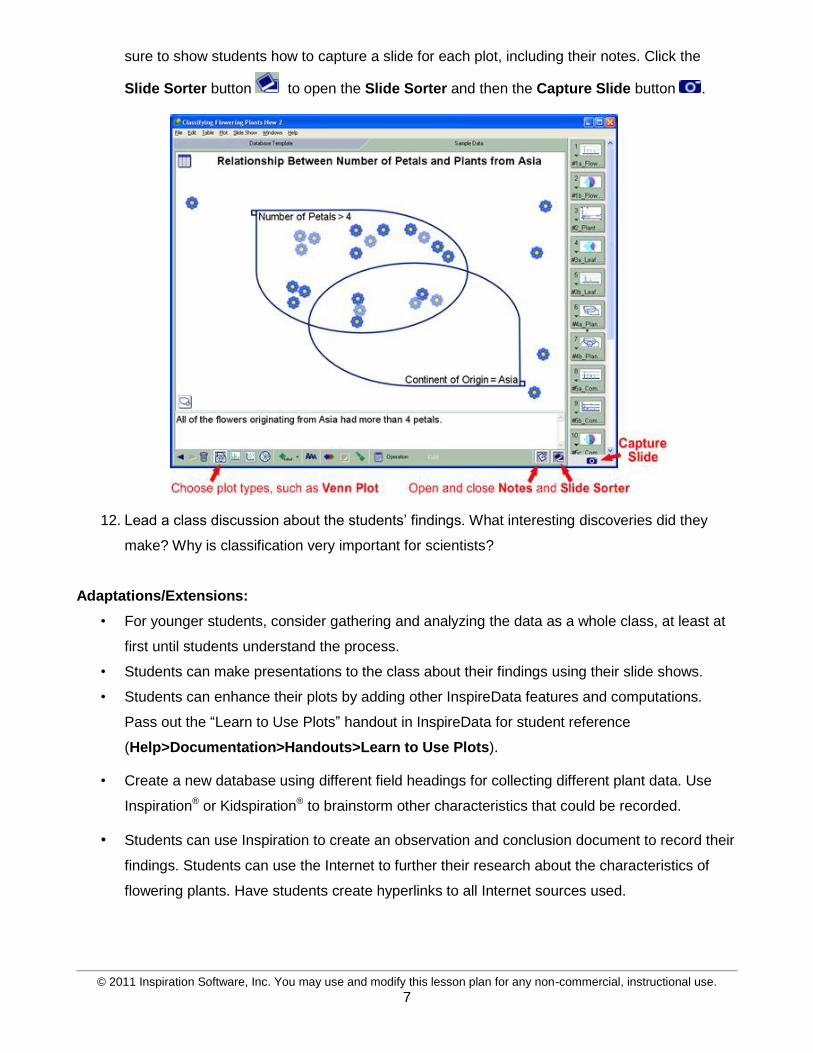
sure to show students how to capture a slide for each plot, including their notes. Click the
Slide Sorter button to open the Slide Sorter and then the Capture Slide button .
12. Lead a class discussion about the students’ findings. What interesting discoveries did they
make? Why is classification very important for scientists?
Adaptations/Extensions:
• For younger students, consider gathering and analyzing the data as a whole class, at least at
first until students understand the process.
• Students can make presentations to the class about their findings using their slide shows.
• Students can enhance their plots by adding other InspireData features and computations.
Pass out the “Learn to Use Plots” handout in InspireData for student reference
(Help>Documentation>Handouts>Learn to Use Plots).
• Create a new database using different field headings for collecting different plant data. Use
Inspiration® or Kidspiration® to brainstorm other characteristics that could be recorded.
• Students can use Inspiration to create an observation and conclusion document to record their
findings. Students can use the Internet to further their research about the characteristics of
flowering plants. Have students create hyperlinks to all Internet sources used.

© 2011 Inspiration Software, Inc. You may use and modify this lesson plan for any non-commercial, instructional use.
8
1 © Copyright 1996. National Science Education Standards. National Academy Press. All rights reserved. Learn
more online at http://www.nap.edu/openbook.php?record_id=4962. 2 © Copyright 2010. Common Core State Standards. National Governors Association Center for Best Practices
and Council of Chief State School Officers. All rights reserved. Learn more online at http://www.corestandards.org.