Embed Size (px)
Citation preview
Clastic Rocks Associated with theMidcontinent Rift System in Iowa
U.S. GEOLOGICAL SURVEY BULLETIN 1989–I
M A R C H 3, 1849
U.S
.D
EPA
RTMENT OF THEINTE
RIO
R
Chapter I
Clastic Rocks Associated with theMidcontinent Rift System in Iowa
By RAYMOND R. ANDERSON and ROBERT M. McKAY
U.S. GEOLOGICAL SURVEY BULLETIN 1989
STRATEGIC AND CRITICAL MINERALS IN THE MIDCONTINENT REGION, UNITED STATES
WARREN C. DAY and DIANE E. LANE, Editors
U.S. DEPARTMENT OF THE INTERIOR
BRUCE BABBITT, Secretary
U.S. GEOLOGICAL SURVEY
Gordon P. Eaton, Director
Any use of trade, product, or firm names in this publication is for descriptive purposes only and does not imply endorsement by the U.S. Government.
UNITED STATES GOVERNMENT PRINTING OFFICE: 1997
For sale byU.S. Geological Survey, Information ServicesBox 25286, Federal CenterDenver, CO 80225
Library of Congress Cataloging-in-Publication Data
M A R C H 3, 1849
U.S
.D
EPA
RTMENT OF THEINTE
RIO
R
Anderson, Raymond R.Clastic rocks associated with the Midcontinent Rift System in Iowa /
by Raymond R. Anderson and Robert M. McKay.p. cm. — (Strategic and critical minerals in the midcontinent
region, United States ; ch. I) (U.S. Geological Survey bulletin ; 1989) Includes bibliographical references (p. – ).Supt. of Docs. no. : I 19.3 : 1989–I1. Geology, Stratigraphic—Proterozoic. 2. Geology—Iowa.
3. Keweenawan Rift. I. McKay, Robert M. II. Title. III. Series. IV. Series: U.S. Geological Survey bulletin ; 1989.QE75.B9 no.1989–I[QE653.5]557.3 s—dc21 96–50394[551.7’15’09777] CIP
Published in the Central Region, Denver, Colo.Manuscript approved for publication October 20, 1996.Photocomposition by Norma J. Maes.
Contents III
CONTENTS
Abstract
I1
Introduction
I1
The Midcontinent Rift System (MRS) in Iowa
I3
MRS clastic rock data
I4
The well record in Iowa
I4
Geophysical data
I4
Gravity anomaly data
I4
Magnetic anomaly data
I4
Reflection seismic data
I5
Clastic units associated with the MRS
I7
Reagan Sandstone
I7
Mount Simon Sandstone
I7
Red clastics
I7
History of the term “Red clastics”
I7
The M.G. Eischeid #1 deep petroleum test well
I9
Stratigraphy of the M.G. Eischeid #1 Red clastics
I10
Upper Red clastics sequence
I10
Lower Red clastics sequence
I12
Red clastics basins flanking the Iowa Horst
I16
Western flanking basins
I16
Duncan Basin
I16
Defiance Basin
I16
Eastern flanking basins
I16
Wellsburg Basin
I17
Ankeny Basin
I18
Shenandoah Basin
I18
Clastic basins on the Iowa Horst
I19
Stratford Basin
I19
Jewell Basin
I19
Mineola Basin
I19
Ames Block
I20
Summary of Red clastics in Iowa
I23
Depositional history of MRS clastic rocks in Iowa
I24
MRS lower Red clastics sequence
I24
MRS upper Red clastics sequence
I24
Problems associated with differentiation of clastics
I25
Investigation of the UPH–2 core
I25
Reinterpretation of the #1 Wilson well
I26
Petrographic analysis
I26
Examination of fossils
I26
Examination of chip samples
I29
Conclusions
I31
Re-examination of the #1 Huntley well
I31
Evaluation of criteria for picking the Mount Simon–Red clastics contact
I32
Metallic mineral potential of MRS clastic rocks in Iowa
I35
Petroleum resources
I35
Petroleum potential studies of Eischeid samples
I35
Source-rock potential
I35
IV Contents
Porosity
I36
Conclusions
I36
Petroleum potential of MRS clastic rocks
I36
Conclusions
I37
Acknowledgments
I38
References cited
I38
Appendix I1. Results of petrographic analyses of thin-sectioned samples collected from basal Mount Simon Sandstone and Red clastics interval of the M.G. Eischeid #1 well in Carroll County, Iowa
I43
Appendix I2. Results of petrographic analyses of thin-sectioned samples collected from Mount Simon Sandstone and Red clastics intervals of several wells in Iowa and Illinois
I44
FIGURES
I1.–I2. Maps showing:I1. Location and major lithologies of the Midcontinent Rift System
I2
I2. Structural components of the Midcontinent Rift System in Iowa
I3
I3. Chart showing comparative Keweenawan stratigraphy of the Midcontinent Rift region
I5
I4.–I6. Maps showing:I4. Major features of the Midcontinent Rift System in Iowa displayed on the
“Bouguer Gravity Anomaly Map of Iowa”
I6
I5. Major features of the Midcontinent Rift System in Iowa displayed on a modified version of the “Aeromagnetic Anomaly Map of Iowa”
I8
I6. Locations of Petty-Ray Geosource, Inc., reflection seismic profiles on a map of major features of the Midcontinent Rift System in Iowa
I9
I7–I8. Generalized lithologic logs of:I7. Upper Red clastics sequence from M.G. Eischeid #1 deep petroleum test
well, Carroll County
I11
I8. Lower Red clastics sequence from M.G. Eischeid #1 deep petroleum test well, Carroll County
I13
19. Quartz–feldspar–lithic grain (QFL) diagrams for Keweenawan Supergroup clastic rocks from Lake Superior area and M.G. Eischeid #1 well, Carroll County
I15
I10.–I13. Maps showing thickness of:I10. Red clastics preserved in basins flanking Iowa Horst
I18
I11. Lower Red clastics sequence in Stratford and Jewell Basins
I20
I12. Upper Red clastics sequence in Mineola Basin
I21
I13. Upper Red clastics sequence, lower Red clastics sequence, and totalRed clastics on Ames Block
I22
I14. Diagram of depositional environment of unit B and lower Oronto Group equivalent rocks
I23
I15.–I16. Charts showing: I15. Stratigraphy and construction history of #1 Wilson oil exploration well,
Page County
I27
I16. Historical interpretations of stratigraphy near base of #1 Wilson oil exploration well, Page County
I28
I17. Lithic log and quartz–feldspar–lithic grain (QFL) diagram for part of #1 Wilson oil exploration well, Page County
I29
I18. Photographs of selected microfossils recovered from chip samples from #1 Wilson oil exploration well, Page County
I30
Contents V
I19. Back-scattered electron photomicrograph of Cryptostome bryozoan from #1 Wilson oil exploration well, Page County
I31
I20. Chart showing stratigraphy and construction history of #1 Huntley oil exploration well, Butler County
I33
I21. Lithic and gamma logs and quartz–feldspar–lithic grain (QFL) diagram for part of #1 Huntley oil exploration well, Butler County
I34
I22. Quartz–feldspar–lithic grain (QFL) diagram of analyses of Mount Simon Sandstone and Red clastics from selected Iowa wells
I35
I1. Iowa wells penetrating the Midcontinent Rift System Red clastic rocks
I10
I2. Dimensions of Red clastics basins in Iowa
I17
METRIC CONVERSION FACTORS
Multiply By To obtain
feet 0.3048 metersmilessquare milescubic miles
1.6092.5904.168
kilometerssquare kilometerscubic kilometers
TABLES
STRATEGIC AND CRITICAL MINERALS IN THE MIDCONTINENT REGION, UNITED STATES
Clastic Rocks Associated with the Midcontinent Rift System in Iowa
By Raymond R. Anderson1 and Robert M. McKay1
Abstract
The Middle Proterozoic Midcontinent Rift System(MRS) of North America is a failed rift that formed inresponse to region-wide stresses about 1,100 Ma. In Iowa,the MRS is buried beneath 2,200–3,500 ft of Paleozoic andMesozoic sedimentary rocks and Quaternary glaciogenicdeposits. An extremely large volume of sediments wasdeposited within basins associated with the rift at severalstages during its development. Although the uplift of arift-axial horst resulted in the erosional removal of most ofthese clastic rocks from the central region of the MRS inIowa, thick sequences are preserved in a series ofhorst-bounding basins. Recent studies incorporating petro-graphic analysis, geophysical modeling, and other analyti-cal procedures have led to the establishment of apreliminary stratigraphy for these clastic rocks and interpre-tations of basin geometries. This information has allowedthe refinement of existing theories and history of MRS for-mation in Iowa. Additionally, drill samples previouslyinterpreted as indicating the existence of early Paleozoicbasins overlying the Proterozoic MRS basins were re-exam-ined. Samples previously interpreted as deep-lying Paleo-zoic rocks are now known to have caved from upper levelsof the drillhole and were out of stratigraphic position. Nodeep Paleozoic basins exist in this area. These investiga-tions led to the development of petrographic parametersuseful in differentiating the Proterozoic MRS Red clasticsfrom Paleozoic clastic rocks having similar lithologies.
INTRODUCTION
The Middle Proterozoic Midcontinent Rift System(MRS) extends from eastern Lake Superior, south and westacross northwestern Wisconsin, southeastern Minnesota,central and southwest Iowa, southeastern Nebraska, andnortheastern Kansas, with related dikes continuing intoOklahoma (fig. I1). Over most of its length the MRS is
Clastic Rocks, Midcontinent Rift System, Iowa I1
dominated by a series of axial horsts, composed primarily ofmafic volcanic rocks, and flanked by clastic-filled basins.Related clastic rocks are also locally preserved on the centralhorsts. MRS clastic rocks are exposed in the Lake Superiorregion of Minnesota, Wisconsin, and Michigan, but are bur-ied beneath Phanerozoic strata south of that region.
In Iowa the MRS is dominated by a central horst pri-marily composed of mafic igneous rocks (the Iowa Horst)flanked by five clastic-filled basins (Anderson, 1988). Therocks of the MRS in Iowa are buried beneath 22,200–3,500ft of Phanerozoic marine and terrestrial sedimentary rocksand glacial drift. MRS rocks are known only from sparsedrill samples and interpretation of their geophysical signa-tures. Drill samples in Iowa include only 14 penetrations ofMRS clastic rocks, most of which are shallow. These rockshave historically been called Red clastics (Norton, 1912).Most of these drill penetrations are shallow, and threeinclude cored intervals.
Modeling of gravity and magnetic data over the MRSled to the interpretation of clastic-filled basins flanking theIowa Horst (fig. I2). They include on the west (north tosouth) the Duncan and Defiance Basins and on the east theWellsburg, Ankeny, and Shenandoah Basins (Anderson,1988). Two basins preserving Red clastics were also mod-eled on the Iowa Horst, the Stratford and Mineola Basins(Anderson, 1988). Recently, two additional areas of Redclastics were identified on the Iowa Horst, the Jewell Basinand Ames Block (Anderson, 1992). Additionally, newmodeling of a series of gravity profiles, controlled by reflec-tion seismic and magnetic data, has led to the delineation ofthe geometries of these basins and estimation of thevolumes of clastics preserved in each (Anderson, 1988).
1Iowa Department of Natural Resources, Geological Survey Bureau, 109 Trowbridge Hall, Iowa City IA 52242–1319.
2Measurements of drill holes on which most thicknesses are based were in feet.
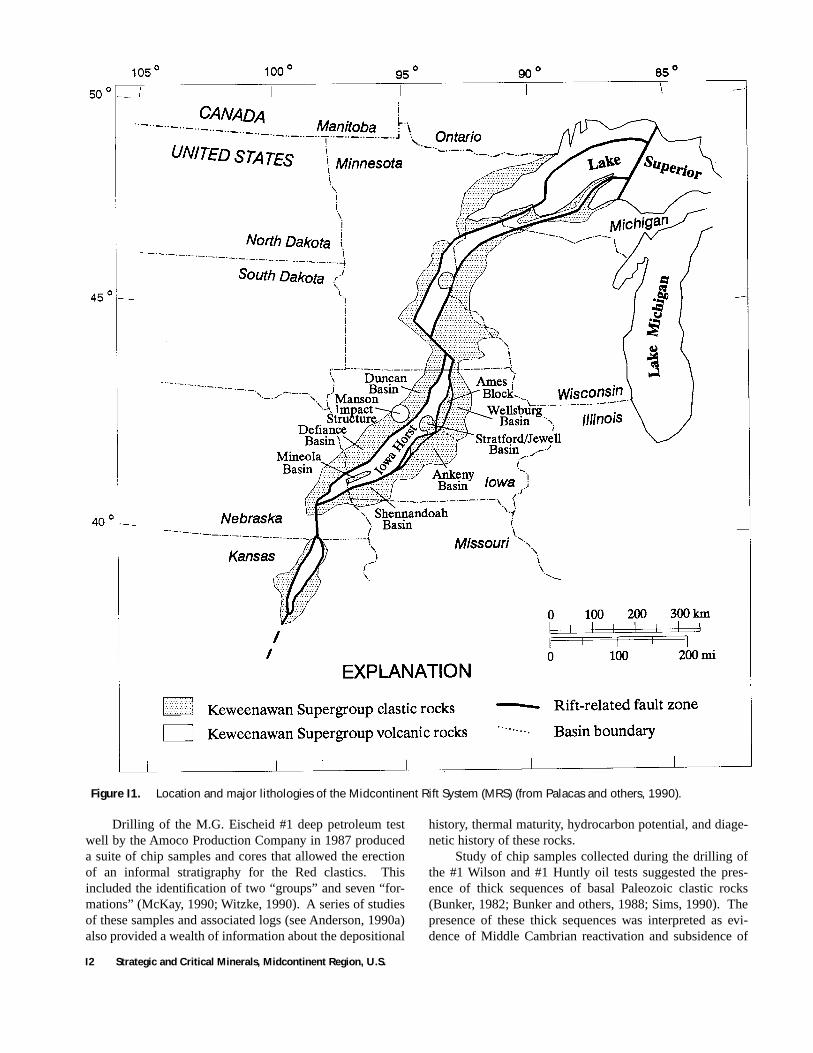
Figure I1.
Location and major lithologies of the Midcontinent Rift System (MRS) (from Palacas and others, 1990).
Drilling of the M.G. Eischeid #1 deep petroleum testwell by the Amoco Production Company in 1987 produceda suite of chip samples and cores that allowed the erectionof an informal stratigraphy for the Red clastics. Thisincluded the identification of two “groups” and seven “for-mations” (McKay, 1990; Witzke, 1990). A series of studiesof these samples and associated logs (see Anderson, 1990a)also provided a wealth of information about the depositional
I2 Strategic and Critical Minerals, Midcontinent Region, U.S.
history, thermal maturity, hydrocarbon potential, and diage-netic history of these rocks.
Study of chip samples collected during the drilling ofthe #1 Wilson and #1 Huntly oil tests suggested the pres-ence of thick sequences of basal Paleozoic clastic rocks(Bunker, 1982; Bunker and others, 1988; Sims, 1990). Thepresence of these thick sequences was interpreted as evi-dence of Middle Cambrian reactivation and subsidence of
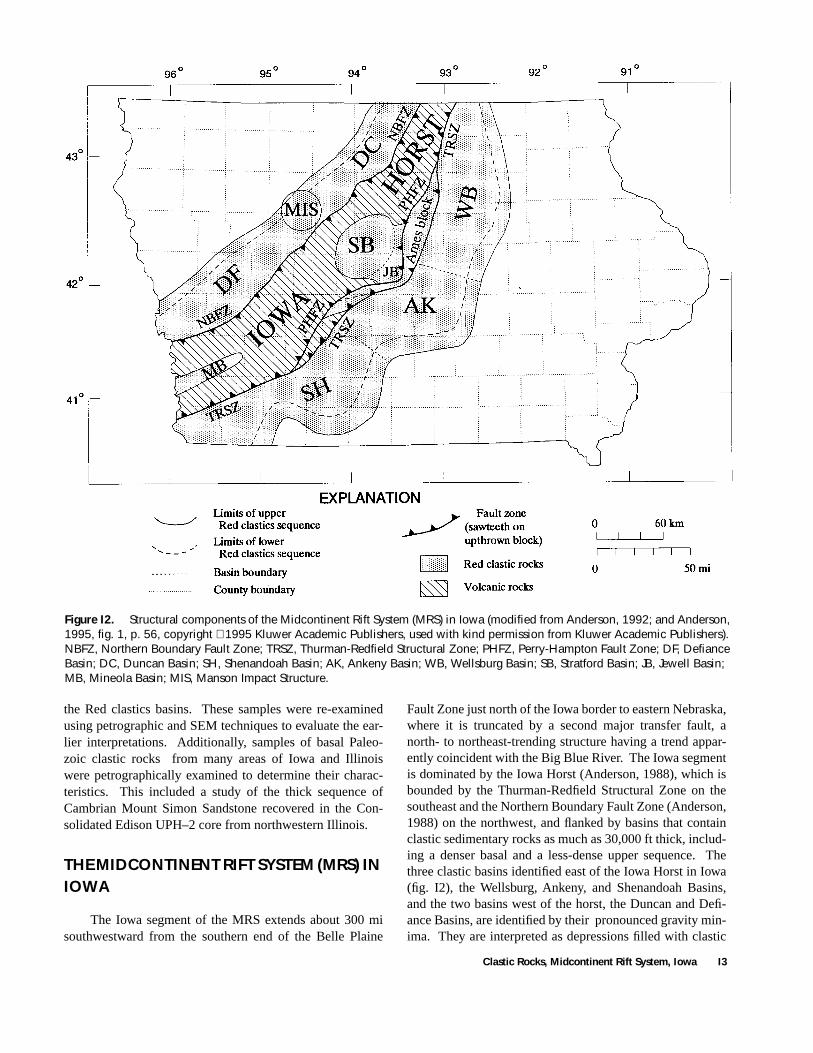
Figure I2.
Structural components of the Midcontinent Rift System (MRS) in Iowa (modified from Anderson, 1992; and Anderson, 1995, fig. 1, p. 56, copyright
1995 Kluwer Academic Publishers, used with kind permission from Kluwer Academic Publishers). NBFZ, Northern Boundary Fault Zone; TRSZ, Thurman-Redfield Structural Zone; PHFZ, Perry-Hampton Fault Zone; DF, Defiance Basin; DC, Duncan Basin; SH, Shenandoah Basin; AK, Ankeny Basin; WB, Wellsburg Basin; SB, Stratford Basin; JB, Jewell Basin; MB, Mineola Basin; MIS, Manson Impact Structure.
the Red clastics basins. These samples were re-examinedusing petrographic and SEM techniques to evaluate the ear-lier interpretations. Additionally, samples of basal Paleo-zoic clastic rocks from many areas of Iowa and Illinoiswere petrographically examined to determine their charac-teristics. This included a study of the thick sequence ofCambrian Mount Simon Sandstone recovered in the Con-solidated Edison UPH–2 core from northwestern Illinois.
THE MIDCONTINENT RIFT SYSTEM (MRS) IN IOWA
The Iowa segment of the MRS extends about 300 misouthwestward from the southern end of the Belle Plaine
Fault Zone just north of the Iowa border to eastern Nebraska,where it is truncated by a second major transfer fault, anorth- to northeast-trending structure having a trend appar-ently coincident with the Big Blue River. The Iowa segmentis dominated by the Iowa Horst (Anderson, 1988), which isbounded by the Thurman-Redfield Structural Zone on thesoutheast and the Northern Boundary Fault Zone (Anderson,1988) on the northwest, and flanked by basins that containclastic sedimentary rocks as much as 30,000 ft thick, includ-ing a denser basal and a less-dense upper sequence. Thethree clastic basins identified east of the Iowa Horst in Iowa(fig. I2), the Wellsburg, Ankeny, and Shenandoah Basins,and the two basins west of the horst, the Duncan and Defi-ance Basins, are identified by their pronounced gravity min-ima. They are interpreted as depressions filled with clastic
Clastic Rocks, Midcontinent Rift System, Iowa I3
sedimentary rocks of relatively low density (Anderson,1992). The three basins southeast of the Iowa Horst appar-ently are interconnected, forming a continuous sequence ofclastic rocks. The two basins northwest of the Iowa Horstare connected in a similar fashion. The areal extent of theeastern basins appears to be slightly greater than that of thewestern basins, but the MRS is nearly symmetrical in crosssection normal to the strike of the feature.
The igneous and sedimentary rocks that wereemplaced during the formation of the MRS in Iowa displaypronounced gravity and magnetic anomalies that extendcontinuously to the Lake Superior region; in the Lake Supe-rior region these rocks are assigned to the KeweenawanSupergroup (King, 1978). MRS rocks sampled during drill-ing in Iowa are very similar to rocks exposed in the LakeSuperior area (fig. I3). Therefore, the name “KeweewnawanSupergroup” also was applied to all igneous and sedimen-tary rocks associated with the Midcontinent Rift System inIowa by Anderson (1992). Most of the MRS clastic sedi-mentary rocks that were deposited in the axial areas of thestructure were subsequently erosionally removed duringuplift of the Iowa Horst. These clastic rocks were, however,preserved on a step-faulted block on the eastern edge of thehorst in central Iowa (the Ames block), in the Stratford andJewell Basins in the center of the horst, and in the MineolaBasin on the axis of the horst at the Nebraska border(Anderson, 1992).
MRS CLASTIC ROCK DATA
The clastic rocks associated with the MRS inIowa—informally called Red clastics—are buried beneath2,200–5,500 ft of Phanerozoic strata. Since they are notknown to contain economic levels of mineralization and arenot used as aquifers in Iowa, few wells penetrate them.Study of the few well samples of Red clastics and analysisof geophysical data provide the only data on these rocks.
The Well Record in Iowa
Fourteen wells are known to penetrate Red clastic stratain Iowa (table I1). Petroleum exploration wells account forfive of these penetrations (total of 19,197 ft) and water wellsfor four penetrations (total of 1,064 ft); three drillholes (totalof 75 ft) were drilled during the development of under-ground natural gas storage structures, and one hole was aresearch core into the Manson Impact Structure (370 ft).Cores of Red clastics in Iowa include the three gas storagestructure wells (total 75 ft), four short intervals of the M.G.Eischeid #1 oil test (totaling 63 ft), and the M–4 researchcore into the Manson Impact Structure (370 ft). The deepestand most significant Red clastics penetration in Iowa is theM.G. Eischeid #1 deep petroleum test well, drilled by theAmoco Production Company in 1987. The Eischeid well
penetrated more than 14,898 ft of MRS clastics from whichchip samples were collected at intervals of 20–30 ft. TheM–4 core encountered a Red clastics section that was strati-graphically thinned and overturned by the impact.
GEOPHYSICAL DATA
Much of our current understanding of the volume andareal distribution of Red clastics in Iowa is based on inter-pretation of geophysical data. These data include gravitydata, with a 6-mi grid of points covering almost all of Iowa,supplemented by areas of 1-mi-spaced coverage. Analogaeromagnetic data was collected over the entire state ofIowa between 1953 and 1972. This data was obtained along1-mi-spaced flightlines, most at an altitude of 500 ft. Thefinal set of geophysical data over the MRS is reflection seis-mic data, collected over the MRS in the early to mid-1980’sby exploration and geophysical companies as a part of pro-grams to explore MRS clastics. Data collected along sevenlines of profile by Petty-Ray Geosource, Inc., was madeavailable for investigations, as was one short line from thethe AMOCO Production Company.
Gravity Anomaly Data
The “Bouguer Gravity Anomaly Map of Iowa” (Ander-son, 1981) clearly displays anomalies produced by themajor lithologies that characterize the MRS in Iowa (fig.I4). Ranging from north-central Iowa to the southwest cor-ner of the state, the strongly positive axial anomaly is theresult of the thick sequence of dense, mafic-dominated vol-canic and plutonic rocks that dominate the Iowa Horst andits shallow location at the Precambrian surface. The flank-ing gravity minima are produced by the thick sequences ofless dense, rift-related clastic sedimentary rocks that arepreserved in the basins marginal to the horst. The clasticrocks associated with the MRS have modeled densitiesranging from 2.40 to 2.75 g/cm3, much lower than associ-ated crustal rocks whose densities range from 2.67 to 2.79g/cm3 (Anderson, 1992). Five clastic-filled flanking basinsare defined by closed contours of gravity minima along theflanks of the Iowa Horst. The very steep gravity gradientbetween the axial high and the flanking lows attests to theabrupt contact between the two features, their density con-trast, and the very large volumes of the disparate lithologies.
Magnetic Anomaly Data
Over most of its trend in Iowa, the magnetic signatureof the MRS (fig. I5) is characterized by a series of linearanomalies following the trend of the gravity anomaly.Magnetic intensities are generally within a few hundredgammas (nanoteslas) of regional values, as compared toanomalies for typical intrusions, which can exceed 1,000
I4 Strategic and Critical Minerals, Midcontinent Region, U.S.
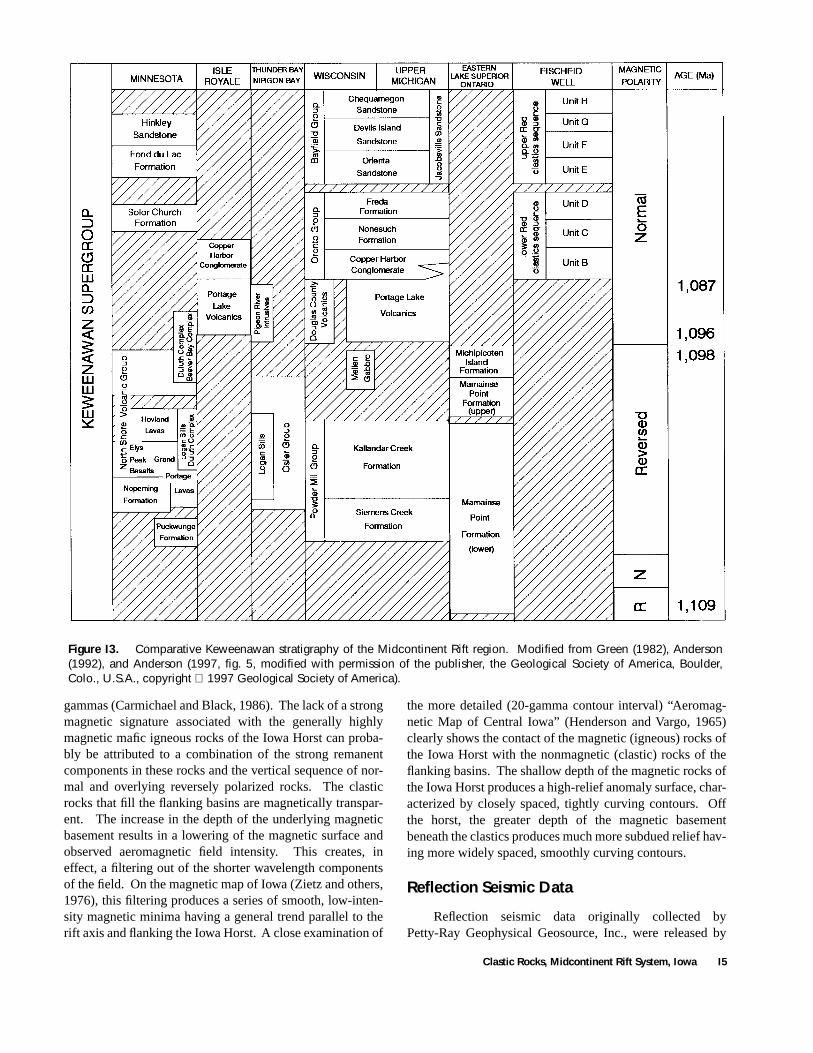
Figure I3.
Comparative Keweenawan stratigraphy of the Midcontinent Rift region. Modified from Green (1982), Anderson(1992), and Anderson (1997, fig. 5, modified with permission of the publisher, the Geological Society of America, Boulder,Colo., U.S.A., copyright
1997 Geological Society of America).
gammas (Carmichael and Black, 1986). The lack of a strongmagnetic signature associated with the generally highlymagnetic mafic igneous rocks of the Iowa Horst can proba-bly be attributed to a combination of the strong remanentcomponents in these rocks and the vertical sequence of nor-mal and overlying reversely polarized rocks. The clasticrocks that fill the flanking basins are magnetically transpar-ent. The increase in the depth of the underlying magneticbasement results in a lowering of the magnetic surface andobserved aeromagnetic field intensity. This creates, ineffect, a filtering out of the shorter wavelength componentsof the field. On the magnetic map of Iowa (Zietz and others,1976), this filtering produces a series of smooth, low-inten-sity magnetic minima having a general trend parallel to therift axis and flanking the Iowa Horst. A close examination of
the more detailed (20-gamma contour interval) “Aeromag-netic Map of Central Iowa” (Henderson and Vargo, 1965)clearly shows the contact of the magnetic (igneous) rocks ofthe Iowa Horst with the nonmagnetic (clastic) rocks of theflanking basins. The shallow depth of the magnetic rocks ofthe Iowa Horst produces a high-relief anomaly surface, char-acterized by closely spaced, tightly curving contours. Offthe horst, the greater depth of the magnetic basementbeneath the clastics produces much more subdued relief hav-ing more widely spaced, smoothly curving contours.
Reflection Seismic Data
Reflection seismic data originally collected byPetty-Ray Geophysical Geosource, Inc., were released by
Clastic Rocks, Midcontinent Rift System, Iowa I5
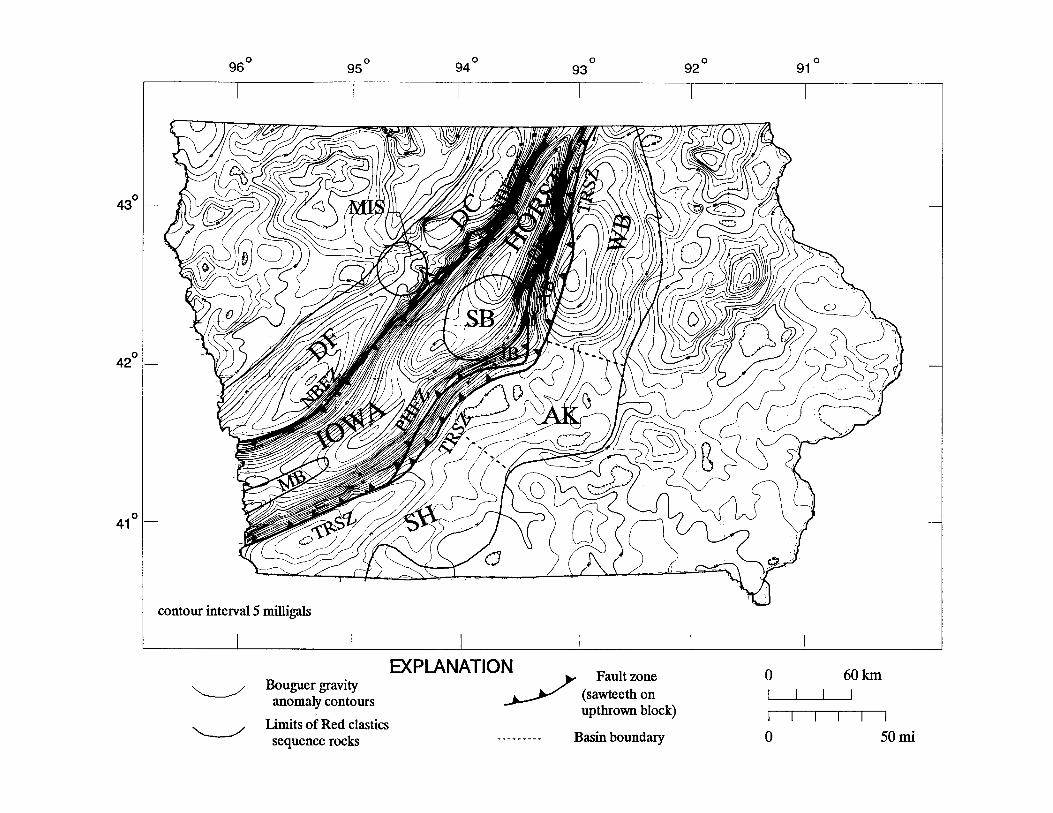
Figure I4 (previous page).
Major features of the Midconti-nent Rift System (MRS) in Iowa displayed on the “BouguerGravity Anomaly Map of Iowa” (from Anderson, 1992; andAnderson, 1997, fig. 8, modified with permission of the pub-lisher, the Geological Society of America, Boulder, Colo.,U.S.A., copyright
1997 Geological Society of America).NBFZ, Northern Boundary Fault Zone; TRSZ, Thurman-Red-field Structural Zone; PHFZ, Perry-Hampton Fault Zone; DF,Defiance Basin; DC, Duncan Basin; SH, Shenandoah Basin;AK, Ankeny Basin; WB, Wellsburg Basin; SB, Stratford Basin;JB, Jewell Basin; MB, Mineola Basin; AB, Ames Block; MIS,Manson Impact Structure.
Halliburton Geophysical Services, Inc., for investigation byAnderson (1992). These seismic lines are currently avail-able from the Wisconsin Geologic and Natural History Sur-vey in Madison, Wisc. Data released included final stackand migrated profiles and profile location maps along sevenlines (fig. I6). Three east-west lines (profiles 7, 12, and 9)completely cross the Iowa Horst and extend over both flank-ing basins (although profile 7 displays no useful informationbelow Phanerozoic reflectors). One more east-west line(profile 11) and three north-south lines (profiles 8, 10, and13) extend from on the Iowa Horst over one flanking basin.In his study, Anderson (1992) utilized interpretive stick dia-grams that were manually constructed from the migratedprofiles. Interpretations were constrained by general riftgeometry, lithologies, and seismic velocities described byearlier workers in the Lake Superior outcrop belt, Iowa drilldata (especially information from the M.G. Eischeid #1well), magnetic data displayed on maps by Henderson andVargo (1965) and Zietz and others (1976), the “BouguerGravity Anomaly Map of Iowa” (Anderson, 1981), and byco-modeling with two-dimensional gravity data alongextended seismic profiles.
CLASTIC UNITS ASSOCIATED WITH THE MRS
The Middle Proterozoic Red clastics were deposited intwo stages during formation of the MRS in Iowa, betweenabout 1.1 and 1.0 Ma. Similar-appearing clastic rocks of theCambrian Mount Simon and Reagan Sandstones overlie theRed clastics in Iowa. These units have traditionally beenvery difficult to differentiate in hand specimen or under abinocular microscope.
Reagan Sandstone
Taft (1902) assigned the name “Reagan Sandstone” tothe Cambrian-aged basal Phanerozoic sandstone in southern
Oklahoma. The term is also used to identify similar strata inKansas. The Reagan Sandstone overlies sandstones of theProterozoic Rice Formation in some area of Kansas. TheReagan Sandstone is generally considered younger than theMount Simon (Kurtz and others, 1975). Recent research(Carlson and others, 1990) suggests that the basal Cambriansandstone in southeastern Nebraska and extreme southwest-ern Iowa is younger than the Mount Simon and should beassigned to the Reagan.
Mount Simon Sandstone
The Mount Simon Sandstone, named by Ulrich (Wal-cott, 1914), is the basal Cambrian sandstone over much ofthe region, including Wisconsin, Minnesota, Iowa, Illinois,and Nebraska. The Mount Simon is consistently less than300 ft thick over much of Wisconsin, Minnesota, Iowa, andNebraska, but in northern Illinois it reaches a maximumthickness of about 2,600 ft (Buschbach, 1964). Previousinterpretations of thick half-graben basins of Mount Simonclastic rocks in central Iowa (Bunker, 1981; Bunker and oth-ers, 1988) are now considered incorrect on the basis ofresults from this study. The Mount Simon sandstone is cor-relative with the Lamotte Sandstone of Missouri.
Red Clastics
History of the Term “Red Clastics”
The term “Red clastic series” was first applied to redshales and sandstones beneath Paleozoic rocks in the sub-surface of Minnesota by Hall and others (1911). The relatedterm “Red clastics” was used by Norton and others (1912)to describe the red sandstones encountered beneath Cam-brian strata in Iowa drillholes. At the time, these rocks weredifferentiated from the overlying white Cambrian sand-stones by their red to pink coloration. He correlated theIowa strata to similar rocks in the subsurface of Minnesotaand suggested an Algonkian age for the rocks. Thiel (1944)described the Red clastics of the southern Minnesota sub-surface as making up the lower part of the Lake Superiorseries and applied the name “Fond du Lac beds” to them inMinnesota. The term “Red clastics” is still used in Iowa todefine the post-volcanic MRS clastic rocks in Iowa (forexample, Anderson, 1990a), although their contact with theoverlying Cambrian sandstones is now defined by lithologicand textural criteria instead of coloration, as will be detailedlater in this report. The Nebraska Geological Survey usesthe term “Red clastics” or “Cornhusker clastics” to refer tosimilar rocks in Nebraska.
Clastic Rocks, Midcontinent Rift System, Iowa I7
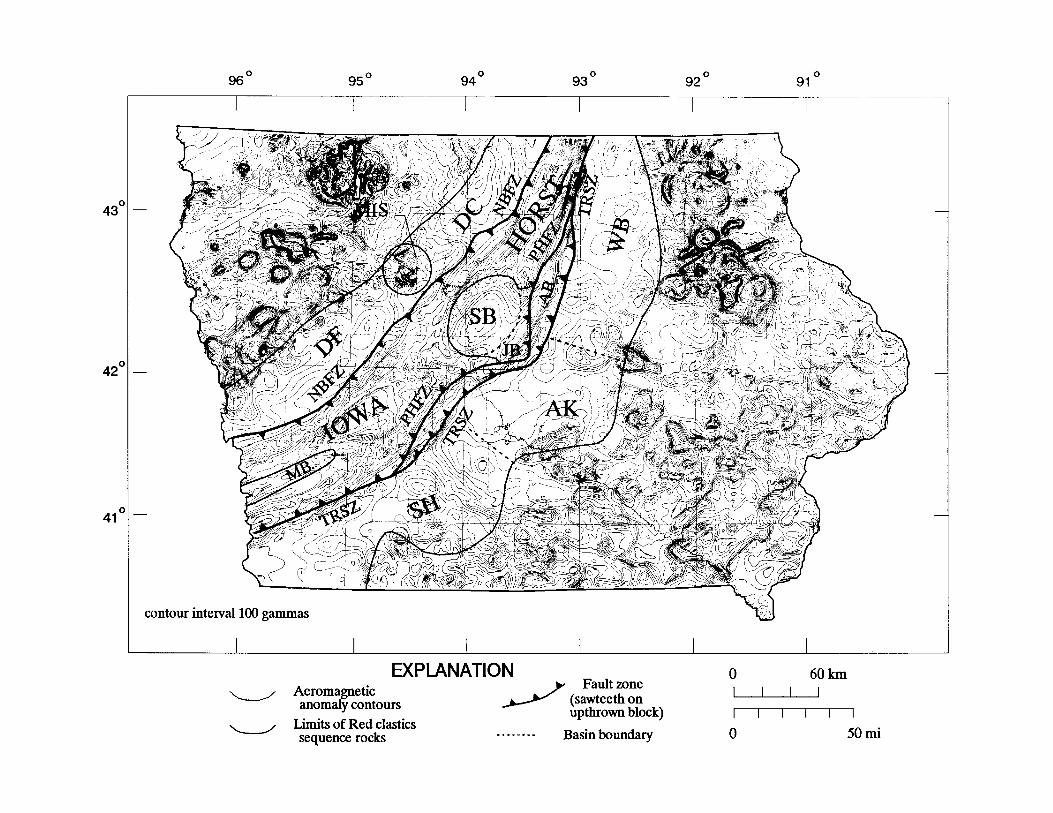
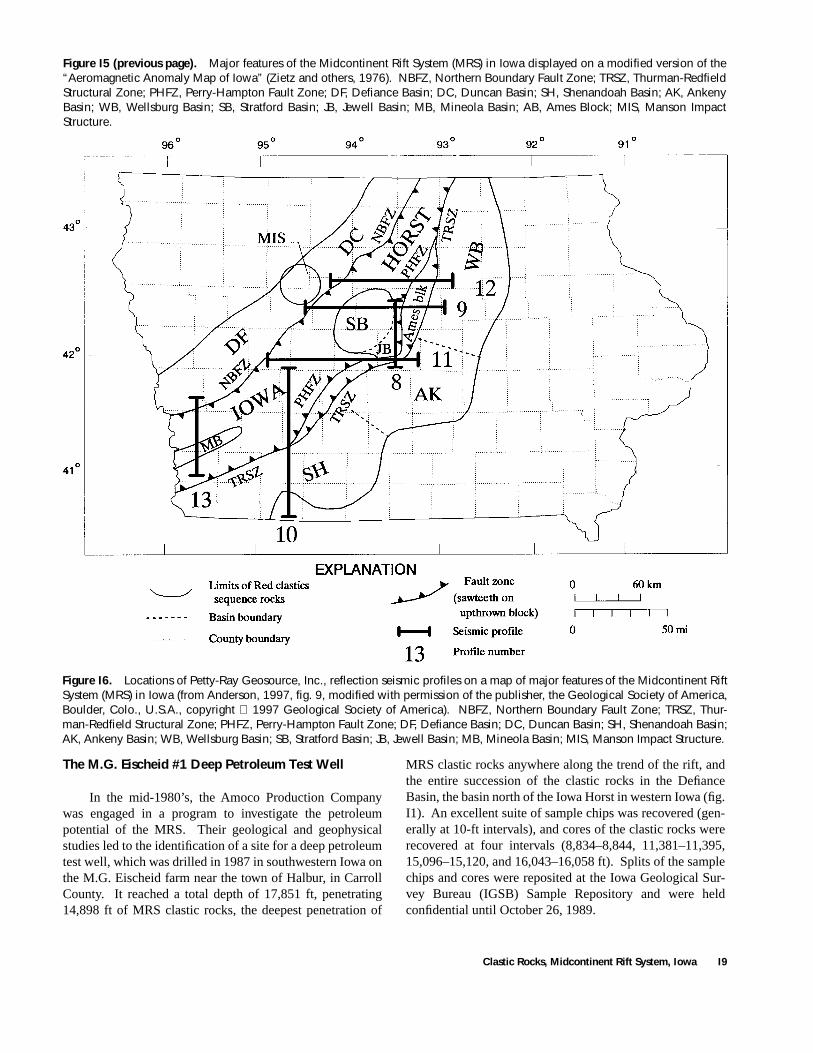
Figure I5 (previous page).
Major features of the Midcontinent Rift System (MRS) in Iowa displayed on a modified version of the“Aeromagnetic Anomaly Map of Iowa” (Zietz and others, 1976). NBFZ, Northern Boundary Fault Zone; TRSZ, Thurman-RedfieldStructural Zone; PHFZ, Perry-Hampton Fault Zone; DF, Defiance Basin; DC, Duncan Basin; SH, Shenandoah Basin; AK, AnkenyBasin; WB, Wellsburg Basin; SB, Stratford Basin; JB, Jewell Basin; MB, Mineola Basin; AB, Ames Block; MIS, Manson ImpactStructure.
Figure I6.
Locations of Petty-Ray Geosource, Inc., reflection seismic profiles on a map of major features of the Midcontinent RiftSystem (MRS) in Iowa (from Anderson, 1997, fig. 9, modified with permission of the publisher, the Geological Society of America,Boulder, Colo., U.S.A., copyright
1997 Geological Society of America). NBFZ, Northern Boundary Fault Zone; TRSZ, Thur-man-Redfield Structural Zone; PHFZ, Perry-Hampton Fault Zone; DF, Defiance Basin; DC, Duncan Basin; SH, Shenandoah Basin;AK, Ankeny Basin; WB, Wellsburg Basin; SB, Stratford Basin; JB, Jewell Basin; MB, Mineola Basin; MIS, Manson Impact Structure.
The M.G. Eischeid #1 Deep Petroleum Test Well
In the mid-1980’s, the Amoco Production Companywas engaged in a program to investigate the petroleumpotential of the MRS. Their geological and geophysicalstudies led to the identification of a site for a deep petroleumtest well, which was drilled in 1987 in southwestern Iowa onthe M.G. Eischeid farm near the town of Halbur, in CarrollCounty. It reached a total depth of 17,851 ft, penetrating14,898 ft of MRS clastic rocks, the deepest penetration of
MRS clastic rocks anywhere along the trend of the rift, andthe entire succession of the clastic rocks in the DefianceBasin, the basin north of the Iowa Horst in western Iowa (fig.I1). An excellent suite of sample chips was recovered (gen-erally at 10-ft intervals), and cores of the clastic rocks wererecovered at four intervals (8,834–8,844, 11,381–11,395,15,096–15,120, and 16,043–16,058 ft). Splits of the samplechips and cores were reposited at the Iowa Geological Sur-vey Bureau (IGSB) Sample Repository and were heldconfidential until October 26, 1989.
Clastic Rocks, Midcontinent Rift System, Iowa I9
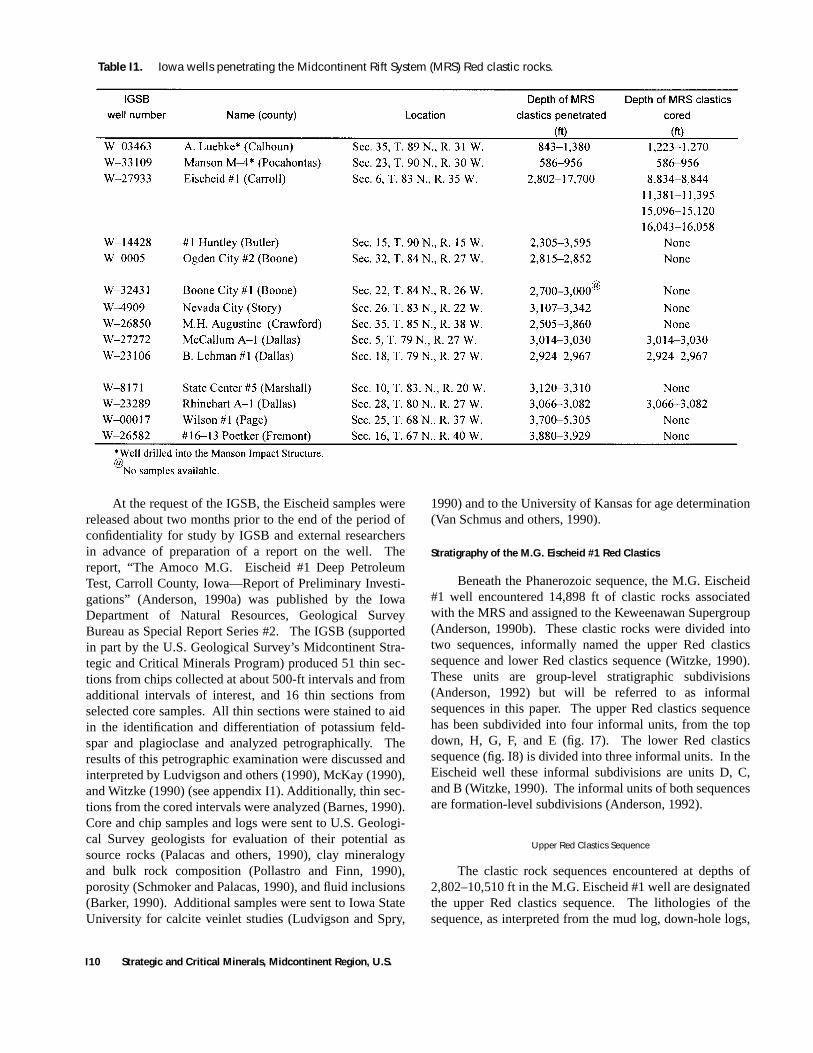
Table I1.
Iowa wells penetrating the Midcontinent Rift System (MRS) Red clastic rocks.
At the request of the IGSB, the Eischeid samples werereleased about two months prior to the end of the period ofconfidentiality for study by IGSB and external researchersin advance of preparation of a report on the well. Thereport, “The Amoco M.G. Eischeid #1 Deep PetroleumTest, Carroll County, Iowa—Report of Preliminary Investi-gations” (Anderson, 1990a) was published by the IowaDepartment of Natural Resources, Geological SurveyBureau as Special Report Series #2. The IGSB (supportedin part by the U.S. Geological Survey’s Midcontinent Stra-tegic and Critical Minerals Program) produced 51 thin sec-tions from chips collected at about 500-ft intervals and fromadditional intervals of interest, and 16 thin sections fromselected core samples. All thin sections were stained to aidin the identification and differentiation of potassium feld-spar and plagioclase and analyzed petrographically. Theresults of this petrographic examination were discussed andinterpreted by Ludvigson and others (1990), McKay (1990),and Witzke (1990) (see appendix I1). Additionally, thin sec-tions from the cored intervals were analyzed (Barnes, 1990).Core and chip samples and logs were sent to U.S. Geologi-cal Survey geologists for evaluation of their potential assource rocks (Palacas and others, 1990), clay mineralogyand bulk rock composition (Pollastro and Finn, 1990),porosity (Schmoker and Palacas, 1990), and fluid inclusions(Barker, 1990). Additional samples were sent to Iowa StateUniversity for calcite veinlet studies (Ludvigson and Spry,
1990) and to the University of Kansas for age determination(Van Schmus and others, 1990).
Stratigraphy of the M.G. Eischeid #1 Red Clastics
Beneath the Phanerozoic sequence, the M.G. Eischeid#1 well encountered 14,898 ft of clastic rocks associatedwith the MRS and assigned to the Keweenawan Supergroup(Anderson, 1990b). These clastic rocks were divided intotwo sequences, informally named the upper Red clasticssequence and lower Red clastics sequence (Witzke, 1990).These units are group-level stratigraphic subdivisions(Anderson, 1992) but will be referred to as informalsequences in this paper. The upper Red clastics sequencehas been subdivided into four informal units, from the topdown, H, G, F, and E (fig. I7). The lower Red clasticssequence (fig. I8) is divided into three informal units. In theEischeid well these informal subdivisions are units D, C,and B (Witzke, 1990). The informal units of both sequencesare formation-level subdivisions (Anderson, 1992).
Upper Red Clastics Sequence
The clastic rock sequences encountered at depths of2,802–10,510 ft in the M.G. Eischeid #1 well are designatedthe upper Red clastics sequence. The lithologies of thesequence, as interpreted from the mud log, down-hole logs,
I10 Strategic and Critical Minerals, Midcontinent Region, U.S.
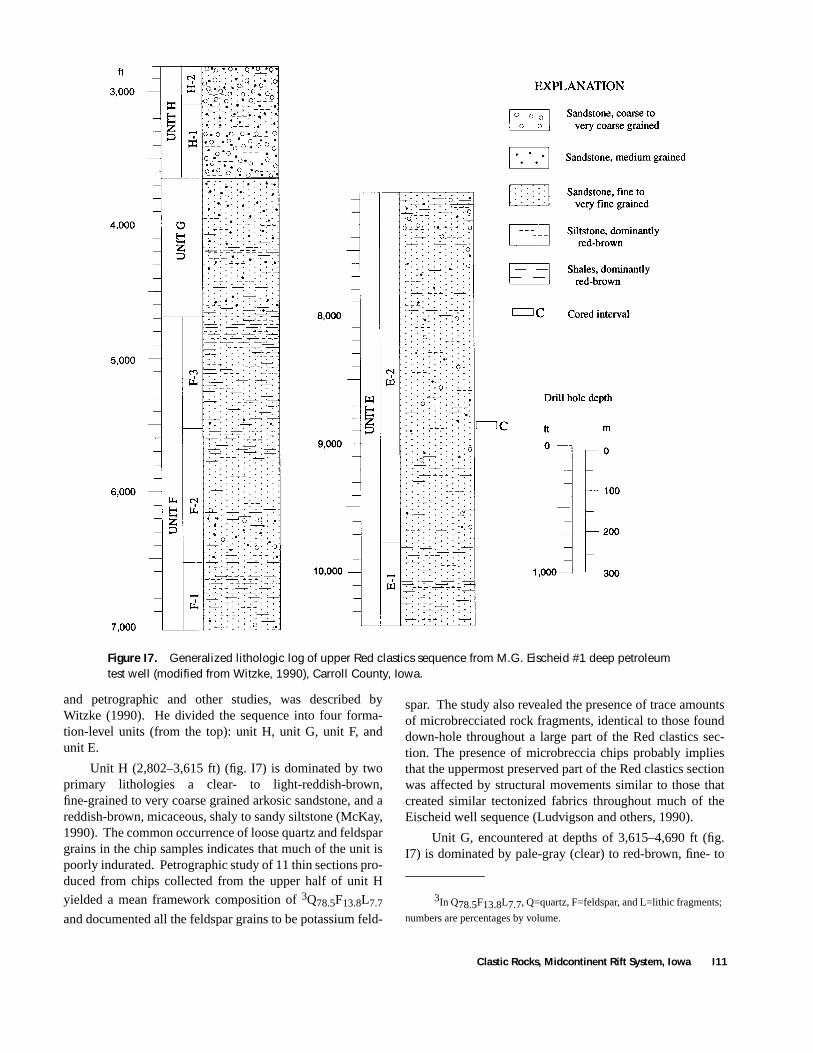
Figure I7.
Generalized lithologic log of upper Red clastics sequence from M.G. Eischeid #1 deep petroleum test well (modified from Witzke, 1990), Carroll County, Iowa.
and petrographic and other studies, was described byWitzke (1990). He divided the sequence into four forma-tion-level units (from the top): unit H, unit G, unit F, andunit E.
Unit H (2,802–3,615 ft) (fig. I7) is dominated by twoprimary lithologies a clear- to light-reddish-brown,fine-grained to very coarse grained arkosic sandstone, and areddish-brown, micaceous, shaly to sandy siltstone (McKay,1990). The common occurrence of loose quartz and feldspargrains in the chip samples indicates that much of the unit ispoorly indurated. Petrographic study of 11 thin sections pro-duced from chips collected from the upper half of unit H
yielded a mean framework composition of 3Q78.5F13.8L7.7
and documented all the feldspar grains to be potassium feld-
spar. The study also revealed the presence of trace amountsof microbrecciated rock fragments, identical to those founddown-hole throughout a large part of the Red clastics sec-tion. The presence of microbreccia chips probably impliesthat the uppermost preserved part of the Red clastics sectionwas affected by structural movements similar to those thatcreated similar tectonized fabrics throughout much of theEischeid well sequence (Ludvigson and others, 1990).
Unit G, encountered at depths of 3,615–4,690 ft (fig.I7) is dominated by pale-gray (clear) to red-brown, fine- to
3In Q78.5F13.8L7.7, Q=quartz, F=feldspar, and L=lithic fragments;
numbers are percentages by volume.
Clastic Rocks, Midcontinent Rift System, Iowa I11
medium-grained sandstone interbedded with red-brown(and minor green) siltstone and shale (Witzke, 1990). Thesandstone is dominated by quartzose grains and has a meanframework-grain composition of Q76F17L7). The volcanicrock component of the lithic grain population in this interval(35 percent) is the highest observed in any clastic unit in theEischeid well (Ludvigson and others, 1990).
Unit F (4,690–7,020 ft), the third Red clastics unitencountered in the Eischeid well (fig. I7), was subdividedby Witzke (1990) into three intervals that generally fineupwards, F–3, F–2, and F–1 (from the top down). Theseintervals grade from basal red-brown to pale-gray (clear),very fine grained to fine-grained sandstones upward tored-brown (in part mottled light green to gray-green) to red(in part mottled light green to gray-green) shales and silt-stones (Witzke, 1990). The sandstones have a mean frame-work grain composition of Q69F22L9 (Ludvigson andothers, 1990).
Unit E (7,020–10,510 ft), the basal unit of the upperRed clastics sequence (fig. I7), is a thick, sandstone-domi-nated unit that is characterized by the highest percentage oflithic fragments, having a mean of Q67F20L13, in the Eisc-heid well (Ludvigson and others, 1990). The unit was sub-divided by Witzke (1990) into two descriptive intervals, E–2(upper) and E–1.
Interval E–2 is the uppermost of the sub-units thatmake up unit E. It is dominated by red to brown, generallyvery fine grained to fine-grained sandstones interbeddedwith red to brown (some mottled grayish-green) siltstonesand shales (Witzke, 1990). Core 1 (8,834–8,844 ft) sampled10 ft of this interval and displays horizontal bedding andtwo facies, one well stratified with low-angle cross-stratifi-cation and containing red mudstone rip-up clasts, the seconda massive, nonstratified sequence containing smaller mudclasts (Ludvigson and others, 1990).
Interval E–1 contains more shale than E–2 and is com-posed of four relatively thin, fining-upward sequences, eachgrading from a basal very fine grained to fine-grained sand-stone upward to a red to dark-brown shale and siltstone(Witzke, 1990).
The upper Red clastics sequence occupies the samerelative stratigraphic position as the Bayfield Group in theLake Superior region (fig. I3). Both units are apparentlydominated by fluvial deposits, with the possible exceptionof the Devils Island Sandstone of the Bayfield Group,which may be a lacustrine deposit. There are, however,some compositional differences between the clastic rocks ofthe two sequences. The Bayfield Group is more mature,both in texture and mineralogy, than the underlying OrontoGroup (Ojakangas, 1986), whereas the rocks of the upperRed clastics sequence are mineralogically less mature thanthe lower Red clastics sequence. Volcanic rock fragmentscontributed less to Bayfield Group rocks than to the OrontoGroup (Ojakangas and Morey, 1982b). However, in theEischeid well volcanic rock fragments are more common inthe upper Red clastics sequence than the lower. Finally,Eischeid drilling did not penetrate any Proterozoic quartz
arenites, such as in the Devils Island and Hinckley Sand-stones in the Lake Superior area.
The Bayfield Group and upper Red clastics sequencedo, however, share many characteristics. Both sequencesapparently overlie the initial MRS clastic units (OrontoGroup and lower Red clastics sequence). The BayfieldGroup, as described by Ojakangas and Morey (1982b), isdominated by fluvial deposition (excluding the possiblelacustrine Devils Island Sandstone). The lithologies presentin the upper Red clastics sequence, as described by Witzke(1990), and the petrology and sedimentary structures, asestablished from the cored intervals by Ludvigson and oth-ers (1990), also suggest a fluvial origin. The differences inthe composition of the units of the upper Red clasticssequence and the Bayfield Group can be explained by dif-ferences in the lithologies of source terranes.
Although quartz arenites were not encountered in theEischeid well, unit F of the upper Red clastics sequence dis-plays the highest content of siltstone and shale. These lowerenergy deposits may be related to the possible lacustrinedeposits observed in the middle unit (Devils Island) of theBayfield Group, perhaps deposited by a low-gradient riverthat flowed into a nearby lake.
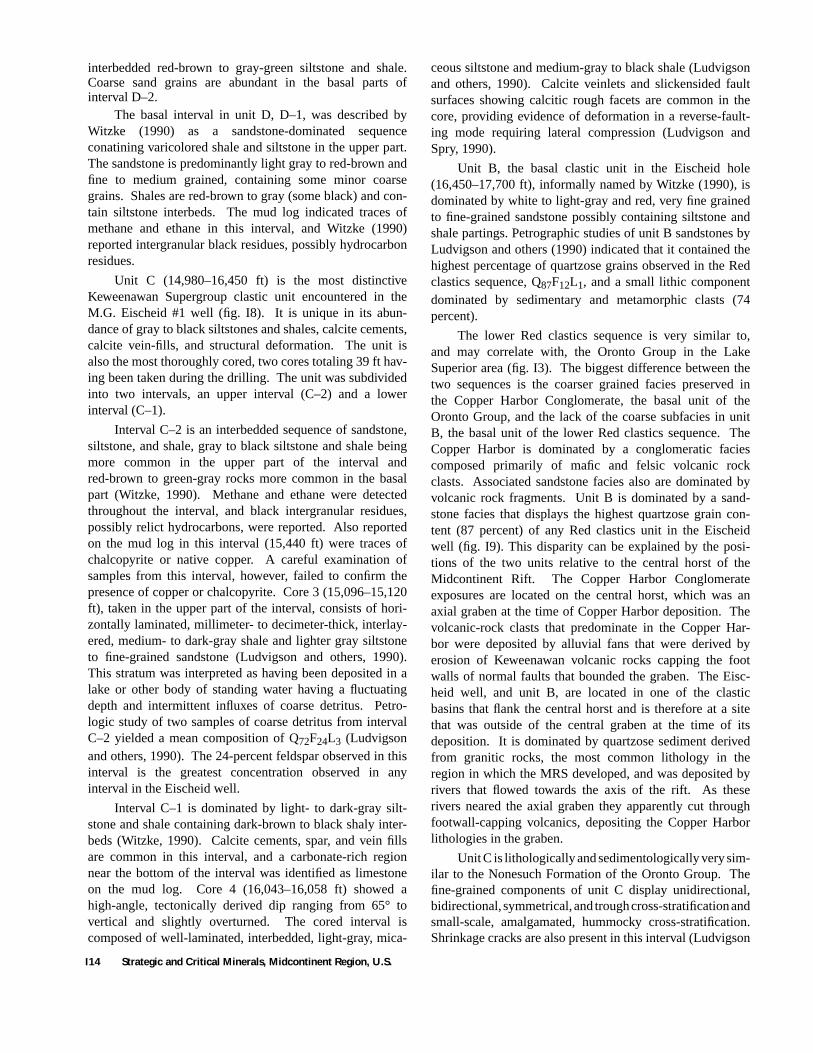
Several trends are evident in the composition of thesandstone component of the upper Red clastics sequence.The QFL composition of the framework grains is comparedto the composition of units in the Lake Superior area in fig-ure I8. Quartzose grain content increases upward in thesequence, from 67 percent in unit E to 79 percent in unit H.At the same time, the average percentage of lithic grainsdecreased up section from 13 percent in unit E to 4 percentin unit H; the volcanic rock component of the grainsincreased from 22 percent in unit E to 62 percent in unit G,and sedimentary and metamorphic grains decreased from 65percent in unit E to 37 percent in unit G. The compositionsof the lithic fragments in the two intervals examined in unitH were quite disparate, and additional analyses are needed.
The relative increase in the concentration of volcanicrock grains moving up section in the upper Red clasticssequence in the Eischeid well may record the local proximalerosional unroofing of the basalts on the Iowa Horst. Welldata from the trend of the MRS in Iowa and seismic inter-pretations indicate that Keweenawan sedimentary rockswere erosionally removed from most areas of the IowaHorst, exposing underlying volcanic rocks (Anderson,1988).
Lower Red Clastics Sequence
The rocks encountered at depths between 10,510 and17,700 ft in the Eischeid well are informally called thelower Red clastics sequence (fig. I8). The sequence wasdivided by Witzke (1990) into three component units (fromthe top downward): units D, C, and B.
The uppermost unit in the lower Red clastics sequence,unit D (10,510–14,980 ft), was described by Witzke (1990)as a thick, generally upward-fining sequence that is domi-nated by sandstones in the lower half and siltstone to shale
I12 Strategic and Critical Minerals, Midcontinent Region, U.S.
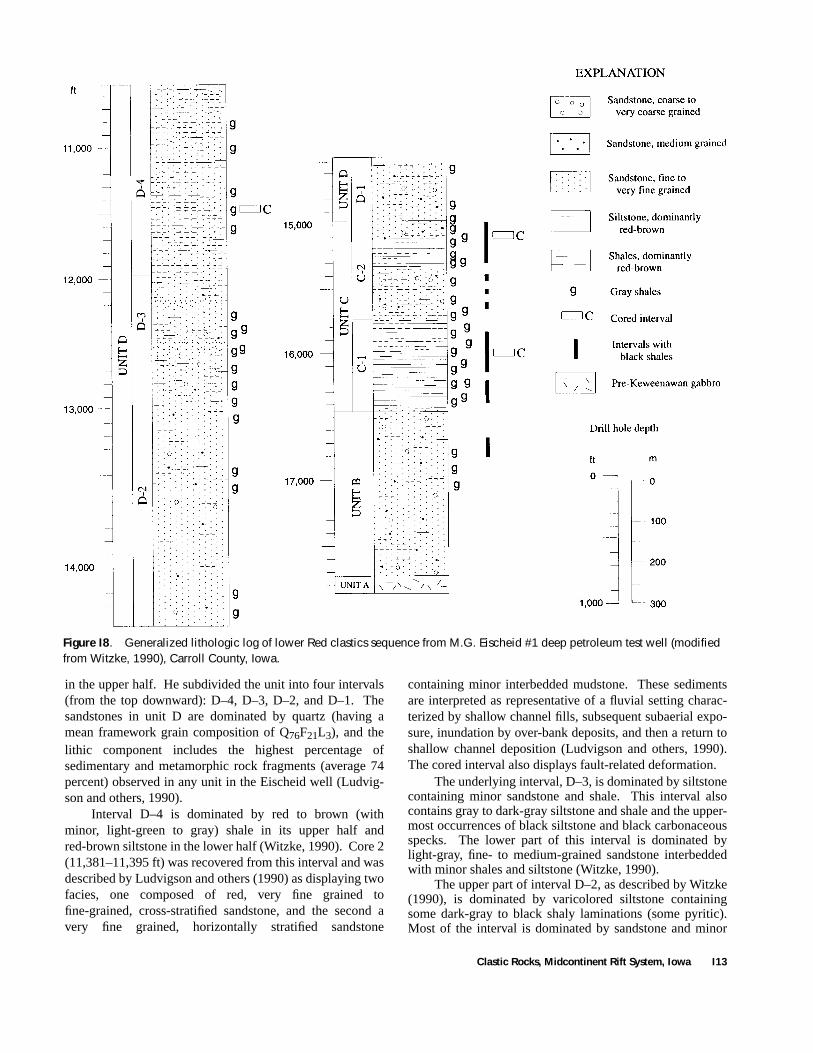
Figure I8
. Generalized lithologic log of lower Red clastics sequence from M.G. Eischeid #1 deep petroleum test well (modified from Witzke, 1990), Carroll County, Iowa.
in the upper half. He subdivided the unit into four intervals(from the top downward): D–4, D–3, D–2, and D–1. Thesandstones in unit D are dominated by quartz (having amean framework grain composition of Q76F21L3), and thelithic component includes the highest percentage ofsedimentary and metamorphic rock fragments (average 74percent) observed in any unit in the Eischeid well (Ludvig-son and others, 1990).
Interval D–4 is dominated by red to brown (withminor, light-green to gray) shale in its upper half andred-brown siltstone in the lower half (Witzke, 1990). Core 2(11,381–11,395 ft) was recovered from this interval and wasdescribed by Ludvigson and others (1990) as displaying twofacies, one composed of red, very fine grained tofine-grained, cross-stratified sandstone, and the second avery fine grained, horizontally stratified sandstone
containing minor interbedded mudstone. These sedimentsare interpreted as representative of a fluvial setting charac-terized by shallow channel fills, subsequent subaerial expo-sure, inundation by over-bank deposits, and then a return toshallow channel deposition (Ludvigson and others, 1990).The cored interval also displays fault-related deformation.
The underlying interval, D–3, is dominated by siltstonecontaining minor sandstone and shale. This interval alsocontains gray to dark-gray siltstone and shale and the upper-most occurrences of black siltstone and black carbonaceousspecks. The lower part of this interval is dominated bylight-gray, fine- to medium-grained sandstone interbeddedwith minor shales and siltstone (Witzke, 1990).
The upper part of interval D–2, as described by Witzke(1990), is dominated by varicolored siltstone containingsome dark-gray to black shaly laminations (some pyritic).Most of the interval is dominated by sandstone and minor
Clastic Rocks, Midcontinent Rift System, Iowa I13
interbedded red-brown to gray-green siltstone and shale.Coarse sand grains are abundant in the basal parts ofinterval D–2.
The basal interval in unit D, D–1, was described byWitzke (1990) as a sandstone-dominated sequenceconatining varicolored shale and siltstone in the upper part.The sandstone is predominantly light gray to red-brown andfine to medium grained, containing some minor coarsegrains. Shales are red-brown to gray (some black) and con-tain siltstone interbeds. The mud log indicated traces ofmethane and ethane in this interval, and Witzke (1990)reported intergranular black residues, possibly hydrocarbonresidues.
Unit C (14,980–16,450 ft) is the most distinctiveKeweenawan Supergroup clastic unit encountered in theM.G. Eischeid #1 well (fig. I8). It is unique in its abun-dance of gray to black siltstones and shales, calcite cements,calcite vein-fills, and structural deformation. The unit isalso the most thoroughly cored, two cores totaling 39 ft hav-ing been taken during the drilling. The unit was subdividedinto two intervals, an upper interval (C–2) and a lowerinterval (C–1).
Interval C–2 is an interbedded sequence of sandstone,siltstone, and shale, gray to black siltstone and shale beingmore common in the upper part of the interval andred-brown to green-gray rocks more common in the basalpart (Witzke, 1990). Methane and ethane were detectedthroughout the interval, and black intergranular residues,possibly relict hydrocarbons, were reported. Also reportedon the mud log in this interval (15,440 ft) were traces ofchalcopyrite or native copper. A careful examination ofsamples from this interval, however, failed to confirm thepresence of copper or chalcopyrite. Core 3 (15,096–15,120ft), taken in the upper part of the interval, consists of hori-zontally laminated, millimeter- to decimeter-thick, interlay-ered, medium- to dark-gray shale and lighter gray siltstoneto fine-grained sandstone (Ludvigson and others, 1990).This stratum was interpreted as having been deposited in alake or other body of standing water having a fluctuatingdepth and intermittent influxes of coarse detritus. Petro-logic study of two samples of coarse detritus from intervalC–2 yielded a mean composition of Q72F24L3 (Ludvigsonand others, 1990). The 24-percent feldspar observed in thisinterval is the greatest concentration observed in anyinterval in the Eischeid well.
Interval C–1 is dominated by light- to dark-gray silt-stone and shale containing dark-brown to black shaly inter-beds (Witzke, 1990). Calcite cements, spar, and vein fillsare common in this interval, and a carbonate-rich regionnear the bottom of the interval was identified as limestoneon the mud log. Core 4 (16,043–16,058 ft) showed ahigh-angle, tectonically derived dip ranging from 65° tovertical and slightly overturned. The cored interval iscomposed of well-laminated, interbedded, light-gray, mica-
ceous siltstone and medium-gray to black shale (Ludvigsonand others, 1990). Calcite veinlets and slickensided faultsurfaces showing calcitic rough facets are common in thecore, providing evidence of deformation in a reverse-fault-ing mode requiring lateral compression (Ludvigson andSpry, 1990).
Unit B, the basal clastic unit in the Eischeid hole(16,450–17,700 ft), informally named by Witzke (1990), isdominated by white to light-gray and red, very fine grainedto fine-grained sandstone possibly containing siltstone andshale partings. Petrographic studies of unit B sandstones byLudvigson and others (1990) indicated that it contained thehighest percentage of quartzose grains observed in the Redclastics sequence, Q87F12L1, and a small lithic componentdominated by sedimentary and metamorphic clasts (74percent).
The lower Red clastics sequence is very similar to,and may correlate with, the Oronto Group in the LakeSuperior area (fig. I3). The biggest difference between thetwo sequences is the coarser grained facies preserved inthe Copper Harbor Conglomerate, the basal unit of theOronto Group, and the lack of the coarse subfacies in unitB, the basal unit of the lower Red clastics sequence. TheCopper Harbor is dominated by a conglomeratic faciescomposed primarily of mafic and felsic volcanic rockclasts. Associated sandstone facies also are dominated byvolcanic rock fragments. Unit B is dominated by a sand-stone facies that displays the highest quartzose grain con-tent (87 percent) of any Red clastics unit in the Eischeidwell (fig. I9). This disparity can be explained by the posi-tions of the two units relative to the central horst of theMidcontinent Rift. The Copper Harbor Conglomerateexposures are located on the central horst, which was anaxial graben at the time of Copper Harbor deposition. Thevolcanic-rock clasts that predominate in the Copper Har-bor were deposited by alluvial fans that were derived byerosion of Keweenawan volcanic rocks capping the footwalls of normal faults that bounded the graben. The Eisc-heid well, and unit B, are located in one of the clasticbasins that flank the central horst and is therefore at a sitethat was outside of the central graben at the time of itsdeposition. It is dominated by quartzose sediment derivedfrom granitic rocks, the most common lithology in theregion in which the MRS developed, and was deposited byrivers that flowed towards the axis of the rift. As theserivers neared the axial graben they apparently cut throughfootwall-capping volcanics, depositing the Copper Harborlithologies in the graben.
Unit C is lithologically and sedimentologically very sim-ilar to the Nonesuch Formation of the Oronto Group. Thefine-grained components of unit C display unidirectional,bidirectional, symmetrical, and trough cross-stratification andsmall-scale, amalgamated, hummocky cross-stratification.Shrinkage cracks are also present in this interval (Ludvigson
I14 Strategic and Critical Minerals, Midcontinent Region, U.S.
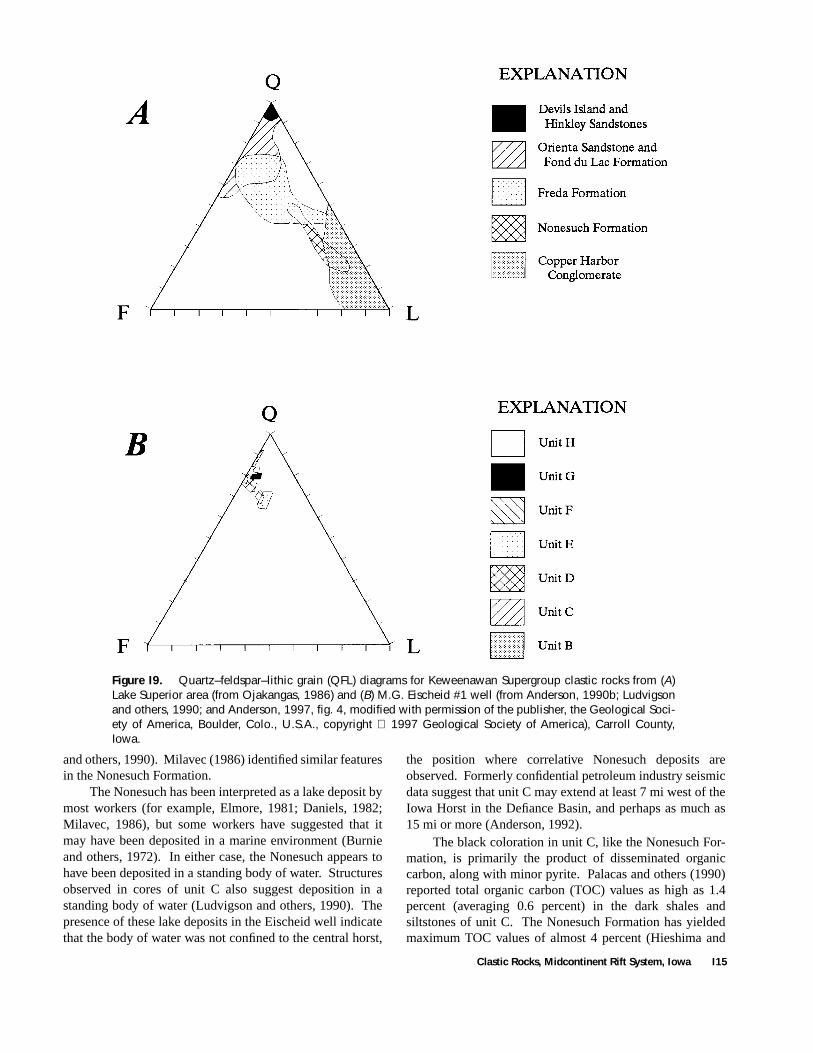
Figure I9.
Quartz–feldspar–lithic grain (QFL) diagrams for Keweenawan Supergroup clastic rocks from (
A
)Lake Superior area (from Ojakangas, 1986) and (
B
) M.G. Eischeid #1 well (from Anderson, 1990b; Ludvigsonand others, 1990; and Anderson, 1997, fig. 4, modified with permission of the publisher, the Geological Soci-ety of America, Boulder, Colo., U.S.A., copyright
1997 Geological Society of America), Carroll County,Iowa.
and others, 1990). Milavec (1986) identified similar featuresin the Nonesuch Formation.
The Nonesuch has been interpreted as a lake deposit bymost workers (for example, Elmore, 1981; Daniels, 1982;Milavec, 1986), but some workers have suggested that itmay have been deposited in a marine environment (Burnieand others, 1972). In either case, the Nonesuch appears tohave been deposited in a standing body of water. Structuresobserved in cores of unit C also suggest deposition in astanding body of water (Ludvigson and others, 1990). Thepresence of these lake deposits in the Eischeid well indicatethat the body of water was not confined to the central horst,
the position where correlative Nonesuch deposits areobserved. Formerly confidential petroleum industry seismicdata suggest that unit C may extend at least 7 mi west of theIowa Horst in the Defiance Basin, and perhaps as much as15 mi or more (Anderson, 1992).
The black coloration in unit C, like the Nonesuch For-mation, is primarily the product of disseminated organiccarbon, along with minor pyrite. Palacas and others (1990)reported total organic carbon (TOC) values as high as 1.4percent (averaging 0.6 percent) in the dark shales andsiltstones of unit C. The Nonesuch Formation has yieldedmaximum TOC values of almost 4 percent (Hieshima and
Clastic Rocks, Midcontinent Rift System, Iowa I15
others, 1989). The petroleum source-rock potential of unitC is discussed later in this report.
Unit D occupies the same stratigraphic position in theEischeid well as the Freda Formation in the Oronto Groupof the Lake Superior area. Interpretation of core 1 from unitD suggested to Ludvigson and others (1990) that the unitwas deposited in a fluvial environment. A similar interpre-tation has been proposed for the Freda Formation by manyworkers (for example, Daniels, 1982; Morey and Ojakan-gas, 1982). Petrographic studies of unit C revealed a meandetrital composition of Q76F21L3 compared to a meancomposition of Q52F18L30 for seven Freda exposuresreported by Daniels (1982). The lithic component of theFreda is dominated (72 percent) by volcanic rock fragments.The higher volcanic rock lithic component indicates thatvolcanic rocks were exposed in the Freda source area, andsimilar lithologies were not exposed in the source area ofunit D.
Red Clastics Basins Flanking the Iowa Horst
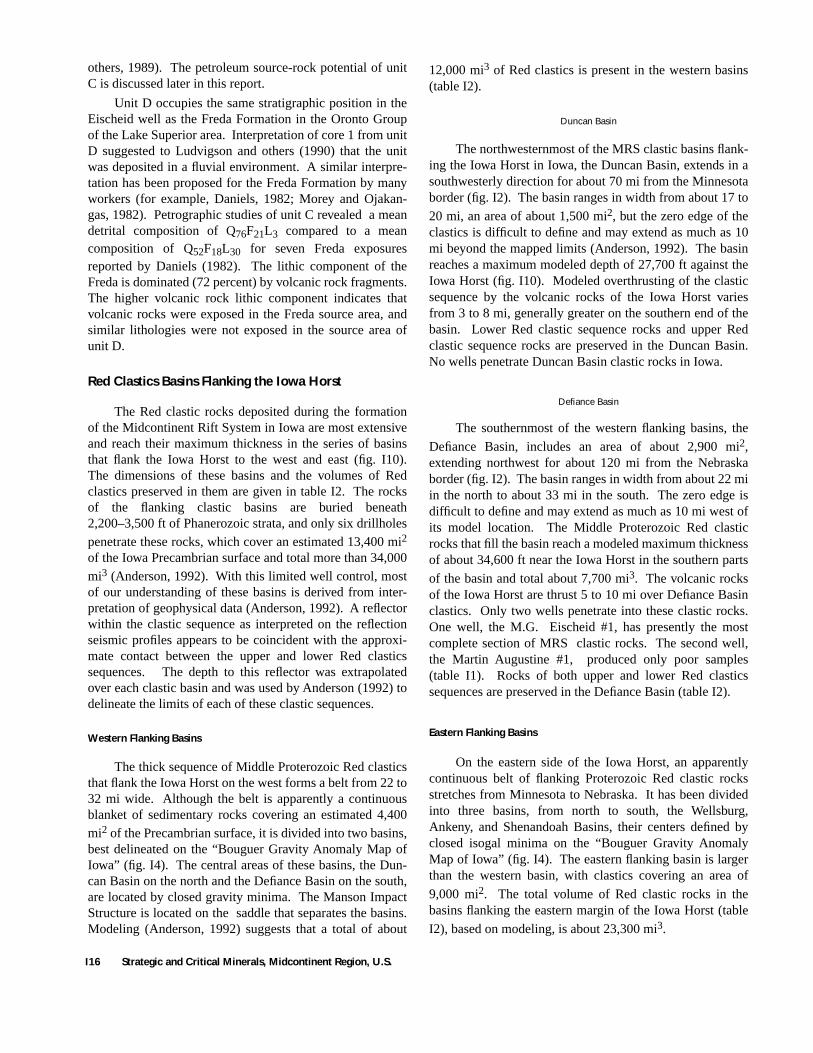
The Red clastic rocks deposited during the formationof the Midcontinent Rift System in Iowa are most extensiveand reach their maximum thickness in the series of basinsthat flank the Iowa Horst to the west and east (fig. I10).The dimensions of these basins and the volumes of Redclastics preserved in them are given in table I2. The rocksof the flanking clastic basins are buried beneath2,200–3,500 ft of Phanerozoic strata, and only six drillholespenetrate these rocks, which cover an estimated 13,400 mi2
of the Iowa Precambrian surface and total more than 34,000mi3 (Anderson, 1992). With this limited well control, mostof our understanding of these basins is derived from inter-pretation of geophysical data (Anderson, 1992). A reflectorwithin the clastic sequence as interpreted on the reflectionseismic profiles appears to be coincident with the approxi-mate contact between the upper and lower Red clasticssequences. The depth to this reflector was extrapolatedover each clastic basin and was used by Anderson (1992) todelineate the limits of each of these clastic sequences.
Western Flanking Basins
The thick sequence of Middle Proterozoic Red clasticsthat flank the Iowa Horst on the west forms a belt from 22 to32 mi wide. Although the belt is apparently a continuousblanket of sedimentary rocks covering an estimated 4,400mi2 of the Precambrian surface, it is divided into two basins,best delineated on the “Bouguer Gravity Anomaly Map ofIowa” (fig. I4). The central areas of these basins, the Dun-can Basin on the north and the Defiance Basin on the south,are located by closed gravity minima. The Manson ImpactStructure is located on the saddle that separates the basins.Modeling (Anderson, 1992) suggests that a total of about
12,000 mi3 of Red clastics is present in the western basins(table I2).
Duncan Basin
The northwesternmost of the MRS clastic basins flank-ing the Iowa Horst in Iowa, the Duncan Basin, extends in asouthwesterly direction for about 70 mi from the Minnesotaborder (fig. I2). The basin ranges in width from about 17 to
20 mi, an area of about 1,500 mi2, but the zero edge of theclastics is difficult to define and may extend as much as 10mi beyond the mapped limits (Anderson, 1992). The basinreaches a maximum modeled depth of 27,700 ft against theIowa Horst (fig. I10). Modeled overthrusting of the clasticsequence by the volcanic rocks of the Iowa Horst variesfrom 3 to 8 mi, generally greater on the southern end of thebasin. Lower Red clastic sequence rocks and upper Redclastic sequence rocks are preserved in the Duncan Basin.No wells penetrate Duncan Basin clastic rocks in Iowa.
Defiance Basin
The southernmost of the western flanking basins, the
Defiance Basin, includes an area of about 2,900 mi2,extending northwest for about 120 mi from the Nebraskaborder (fig. I2). The basin ranges in width from about 22 miin the north to about 33 mi in the south. The zero edge isdifficult to define and may extend as much as 10 mi west ofits model location. The Middle Proterozoic Red clasticrocks that fill the basin reach a modeled maximum thicknessof about 34,600 ft near the Iowa Horst in the southern parts
of the basin and total about 7,700 mi3. The volcanic rocksof the Iowa Horst are thrust 5 to 10 mi over Defiance Basinclastics. Only two wells penetrate into these clastic rocks.One well, the M.G. Eischeid #1, has presently the mostcomplete section of MRS clastic rocks. The second well,the Martin Augustine #1, produced only poor samples(table I1). Rocks of both upper and lower Red clasticssequences are preserved in the Defiance Basin (table I2).
Eastern Flanking Basins
On the eastern side of the Iowa Horst, an apparentlycontinuous belt of flanking Proterozoic Red clastic rocksstretches from Minnesota to Nebraska. It has been dividedinto three basins, from north to south, the Wellsburg,Ankeny, and Shenandoah Basins, their centers defined byclosed isogal minima on the “Bouguer Gravity AnomalyMap of Iowa” (fig. I4). The eastern flanking basin is largerthan the western basin, with clastics covering an area of
9,000 mi2. The total volume of Red clastic rocks in thebasins flanking the eastern margin of the Iowa Horst (table
I2), based on modeling, is about 23,300 mi3.
I16 Strategic and Critical Minerals, Midcontinent Region, U.S.
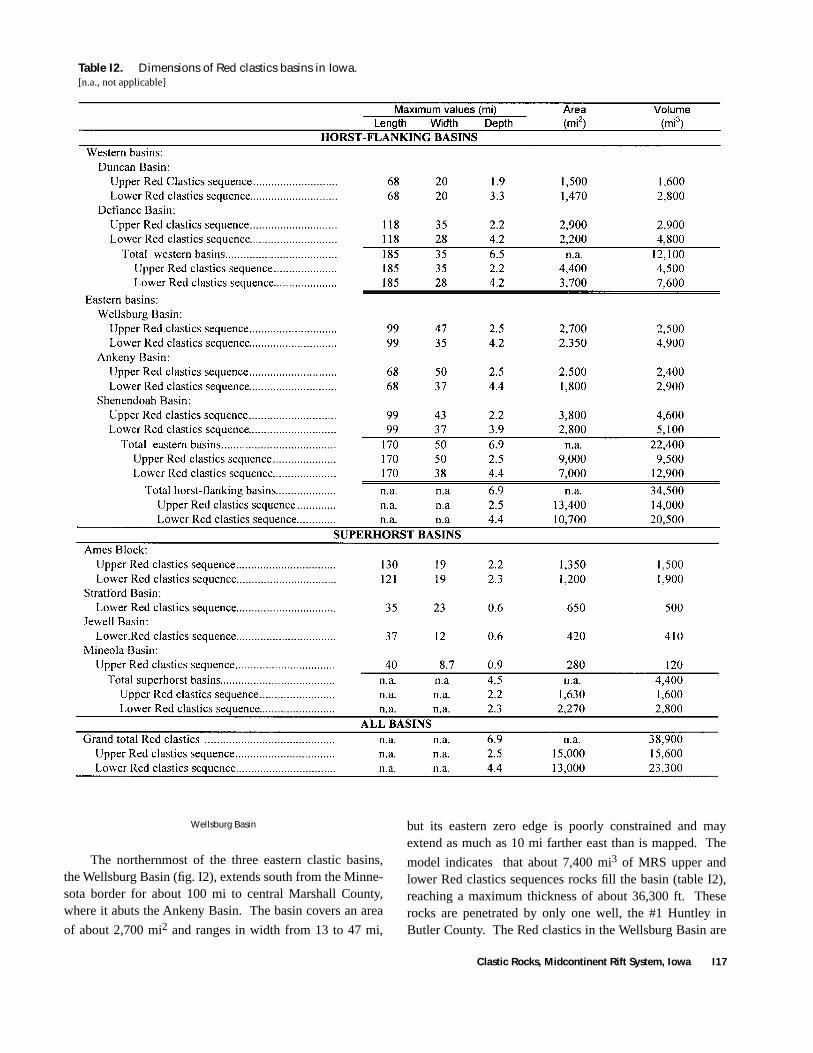
Table I2.
Dimensions of Red clastics basins in Iowa.
[n.a., not applicable]
Wellsburg Basin
The northernmost of the three eastern clastic basins,the Wellsburg Basin (fig. I2), extends south from the Minne-sota border for about 100 mi to central Marshall County,where it abuts the Ankeny Basin. The basin covers an area
of about 2,700 mi2 and ranges in width from 13 to 47 mi,
but its eastern zero edge is poorly constrained and mayextend as much as 10 mi farther east than is mapped. The
model indicates that about 7,400 mi3 of MRS upper andlower Red clastics sequences rocks fill the basin (table I2),reaching a maximum thickness of about 36,300 ft. Theserocks are penetrated by only one well, the #1 Huntley inButler County. The Red clastics in the Wellsburg Basin are
Clastic Rocks, Midcontinent Rift System, Iowa I17
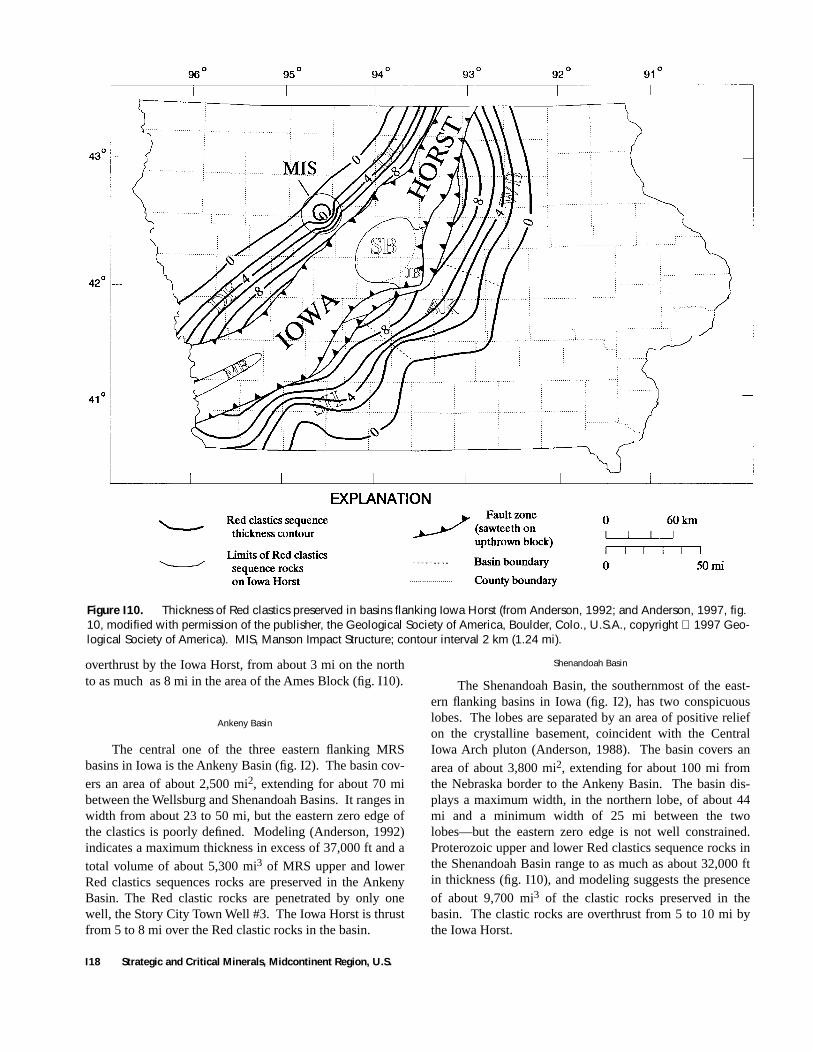
Figure I10.
Thickness of Red clastics preserved in basins flanking Iowa Horst (from Anderson, 1992; and Anderson, 1997, fig. 10, modified with permission of the publisher, the Geological Society of America, Boulder, Colo., U.S.A., copyright
1997 Geo-logical Society of America). MIS, Manson Impact Structure; contour interval 2 km (1.24 mi).
overthrust by the Iowa Horst, from about 3 mi on the northto as much as 8 mi in the area of the Ames Block (fig. I10).
Ankeny Basin
The central one of the three eastern flanking MRSbasins in Iowa is the Ankeny Basin (fig. I2). The basin cov-ers an area of about 2,500 mi2, extending for about 70 mibetween the Wellsburg and Shenandoah Basins. It ranges inwidth from about 23 to 50 mi, but the eastern zero edge ofthe clastics is poorly defined. Modeling (Anderson, 1992)indicates a maximum thickness in excess of 37,000 ft and atotal volume of about 5,300 mi3 of MRS upper and lowerRed clastics sequences rocks are preserved in the AnkenyBasin. The Red clastic rocks are penetrated by only onewell, the Story City Town Well #3. The Iowa Horst is thrustfrom 5 to 8 mi over the Red clastic rocks in the basin.
Shenandoah Basin
The Shenandoah Basin, the southernmost of the east-ern flanking basins in Iowa (fig. I2), has two conspicuouslobes. The lobes are separated by an area of positive reliefon the crystalline basement, coincident with the CentralIowa Arch pluton (Anderson, 1988). The basin covers anarea of about 3,800 mi2, extending for about 100 mi fromthe Nebraska border to the Ankeny Basin. The basin dis-plays a maximum width, in the northern lobe, of about 44mi and a minimum width of 25 mi between the twolobes—but the eastern zero edge is not well constrained.Proterozoic upper and lower Red clastics sequence rocks inthe Shenandoah Basin range to as much as about 32,000 ftin thickness (fig. I10), and modeling suggests the presenceof about 9,700 mi3 of the clastic rocks preserved in thebasin. The clastic rocks are overthrust from 5 to 10 mi bythe Iowa Horst.
I18 Strategic and Critical Minerals, Midcontinent Region, U.S.
Two wells penetrate into the Red clastics of theShenandoah Basin, the #1 Wilson in Page County, whichsampled 1,605 ft of the sequence, and the Gulf Energy16–13 Poetker in Mills County, which penetrated 49 ft ofRed clastics. Additionally, a third well, the Ohio OilCompany Wisnom #1, penetrated 200 ft of quartzarenite at adepth below 3,150 ft. The only quartz arenite in this part ofthe geologic column is in the basal Cambrian sandstone.This basal sand, however, rarely exceeds 100 ft in thicknessin this region. The anomalous quartz arenite in the Wisnomwell may represent rocks related to the Bayfield GroupHinckley or Devils Island Sandstone of the Lake Superiorregion.
Clastic Basins on the Iowa Horst
Stratford Basin
The Stratford Basin (fig. I2) was identified as the“Stratford Geophysical Anomaly” by Osweiler (1982), whointerpreted the feature as an elliptical, clastic-filled basin
having an area of 650 mi2 that formed along the axis of theMRS, similar to the Twin City Basin in Minnesota (King
and Zietz, 1971). Using a gravity contrast of 0.6 g/cm3
between the clastics and the underlying mafic volcanicrocks, Osweiler modeled the basin as elongate (about 35 milong) trending northeasterly (along the axis of the MRS),and about 23 mi wide. The basin reaches a maximum depthof about 3,000 ft below the base of overlying Phanerozoicrocks.
The basin was studied by Anderson (1992) using datafrom Petty-Ray Geosource, Inc., seismic profile 9. Withthis data he calculated a maximum depth of about 5,500 ft.To produce a gravity model using this depth required a den-
sity of 2.65 g/cm3 (density contrast of only 0.2 g/cm3 withthe underlying basalts) for the Red clastics. This density is
higher than the average 2.55 g/cm3 density assigned to thelower Red clastics sequence by Anderson (1992) whenmodeling the horst-flanking basins along profile 9. He sug-gested that the density of the clastics in the Stratford Basinmay be increased by a higher percentage of mafic volcanicrock fragments (similar to clasts in the Copper Harbor Con-glomerate) in the clastic rocks of the Stratford Basin. Thistheory is strengthened by a description (Norton, 1928) ofthe rocks encountered during the drilling of the Ogden City#2 well in 1929 (table I1). Although no samples exist forthe basal 7 ft of the well, the lowest samples, from a depthof 2,845 ft, were described as a litharenite containing abun-dant feldspar, mafic igneous rock fragments, and mafic min-erals. This lithology is similar to the Copper HarborFormation and in Iowa is part of the lower Red clasticssequence. The well encountered the lower Red clastics at adepth of 2,750 ft and penetrated 102 ft of the clasticsequence. Additionally, the Boone City #1 well also
apparently penetrated the clastics of the Stratford Basin.Boone City #1, drilled in 1890, encountered a
sequence of red shales and soft red sandstones, interpretedas the lower Red clastics sequence, at a depth of about 2,700ft. A total of 300 ft of these rocks was penetrated. Addi-tionally, deep burial along the axis of the MRS and thoroughcementation may combine to form an anomalously denseunit, similar to the dense clastic rocks encountered in theAmerada Schroeder well, located in a similar position onthe Iowa Horst in Nebraska.
Using a density of 2.65 g/cm3 for the lower Red clas-tics, Anderson (1992) modeled the Stratford Basin as havinga width and length similar to values determined by Osweiler(1982), but reaching a greater maximum depth (fig. I11),about 12,000 ft. The total volume of lower Red clasticssequence rocks in the Stratford Basin is approximately 500mi3.
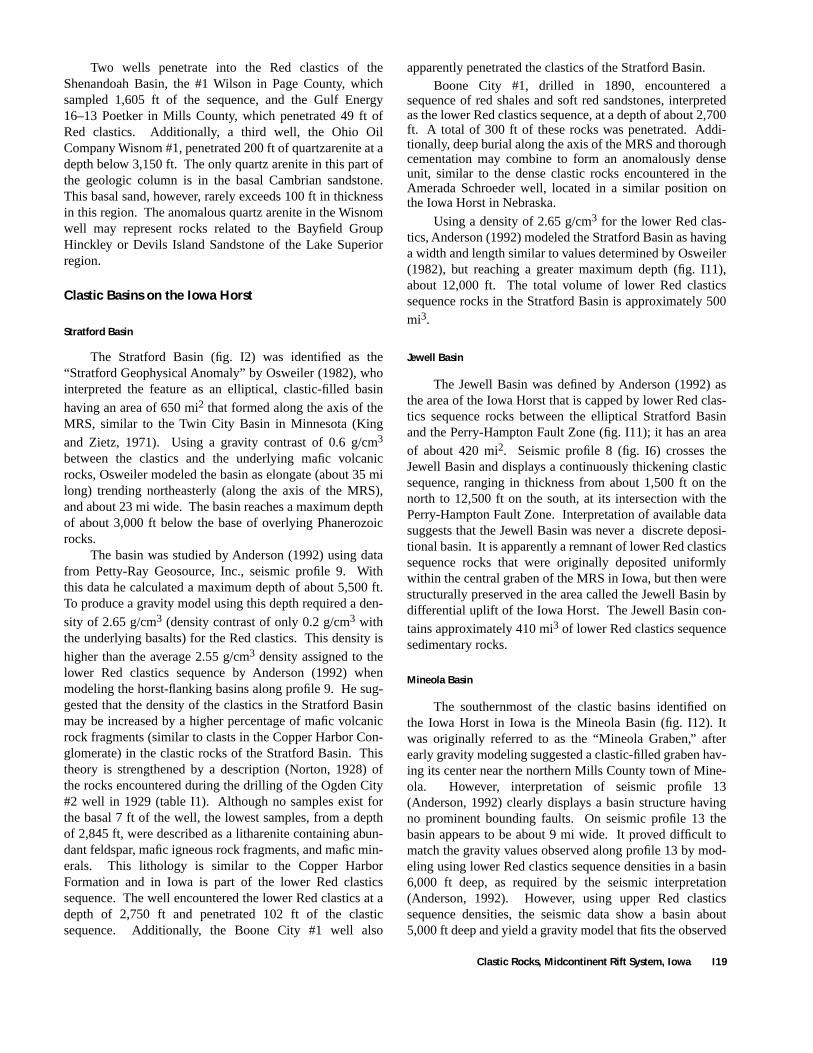
Jewell Basin
The Jewell Basin was defined by Anderson (1992) asthe area of the Iowa Horst that is capped by lower Red clas-tics sequence rocks between the elliptical Stratford Basinand the Perry-Hampton Fault Zone (fig. I11); it has an areaof about 420 mi2. Seismic profile 8 (fig. I6) crosses theJewell Basin and displays a continuously thickening clasticsequence, ranging in thickness from about 1,500 ft on thenorth to 12,500 ft on the south, at its intersection with thePerry-Hampton Fault Zone. Interpretation of available datasuggests that the Jewell Basin was never a discrete deposi-tional basin. It is apparently a remnant of lower Red clasticssequence rocks that were originally deposited uniformlywithin the central graben of the MRS in Iowa, but then werestructurally preserved in the area called the Jewell Basin bydifferential uplift of the Iowa Horst. The Jewell Basin con-tains approximately 410 mi3 of lower Red clastics sequencesedimentary rocks.
Mineola Basin
The southernmost of the clastic basins identified onthe Iowa Horst in Iowa is the Mineola Basin (fig. I12). Itwas originally referred to as the “Mineola Graben,” afterearly gravity modeling suggested a clastic-filled graben hav-ing its center near the northern Mills County town of Mine-ola. However, interpretation of seismic profile 13(Anderson, 1992) clearly displays a basin structure havingno prominent bounding faults. On seismic profile 13 thebasin appears to be about 9 mi wide. It proved difficult tomatch the gravity values observed along profile 13 by mod-eling using lower Red clastics sequence densities in a basin6,000 ft deep, as required by the seismic interpretation(Anderson, 1992). However, using upper Red clasticssequence densities, the seismic data show a basin about5,000 ft deep and yield a gravity model that fits the observed
Clastic Rocks, Midcontinent Rift System, Iowa I19
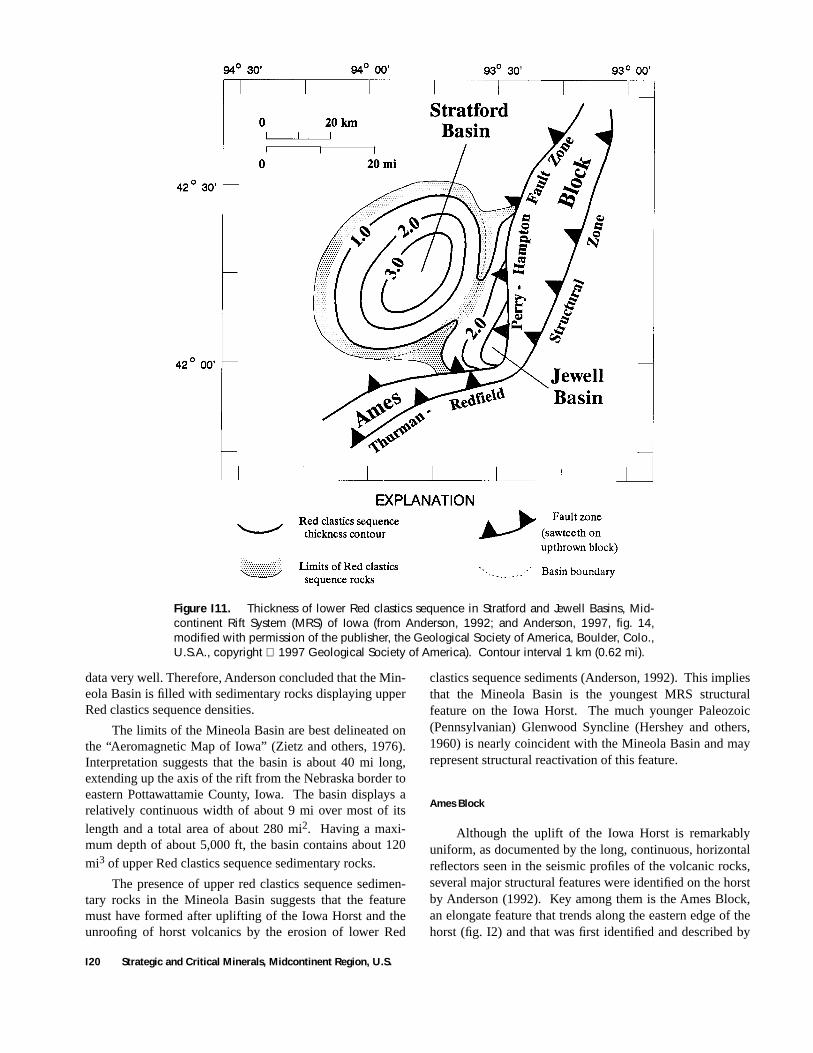
Figure I11.
Thickness of lower Red clastics sequence in Stratford and Jewell Basins, Mid-continent Rift System (MRS) of Iowa (from Anderson, 1992; and Anderson, 1997, fig. 14,modified with permission of the publisher, the Geological Society of America, Boulder, Colo.,U.S.A., copyright
1997 Geological Society of America). Contour interval 1 km (0.62 mi).
data very well. Therefore, Anderson concluded that the Min-eola Basin is filled with sedimentary rocks displaying upperRed clastics sequence densities.
The limits of the Mineola Basin are best delineated onthe “Aeromagnetic Map of Iowa” (Zietz and others, 1976).Interpretation suggests that the basin is about 40 mi long,extending up the axis of the rift from the Nebraska border toeastern Pottawattamie County, Iowa. The basin displays arelatively continuous width of about 9 mi over most of itslength and a total area of about 280 mi2. Having a maxi-mum depth of about 5,000 ft, the basin contains about 120mi3 of upper Red clastics sequence sedimentary rocks.
The presence of upper red clastics sequence sedimen-tary rocks in the Mineola Basin suggests that the featuremust have formed after uplifting of the Iowa Horst and theunroofing of horst volcanics by the erosion of lower Red
clastics sequence sediments (Anderson, 1992). This impliesthat the Mineola Basin is the youngest MRS structuralfeature on the Iowa Horst. The much younger Paleozoic(Pennsylvanian) Glenwood Syncline (Hershey and others,1960) is nearly coincident with the Mineola Basin and mayrepresent structural reactivation of this feature.
Ames Block
Although the uplift of the Iowa Horst is remarkablyuniform, as documented by the long, continuous, horizontalreflectors seen in the seismic profiles of the volcanic rocks,several major structural features were identified on the horstby Anderson (1992). Key among them is the Ames Block,an elongate feature that trends along the eastern edge of thehorst (fig. I2) and that was first identified and described by
I20 Strategic and Critical Minerals, Midcontinent Region, U.S.
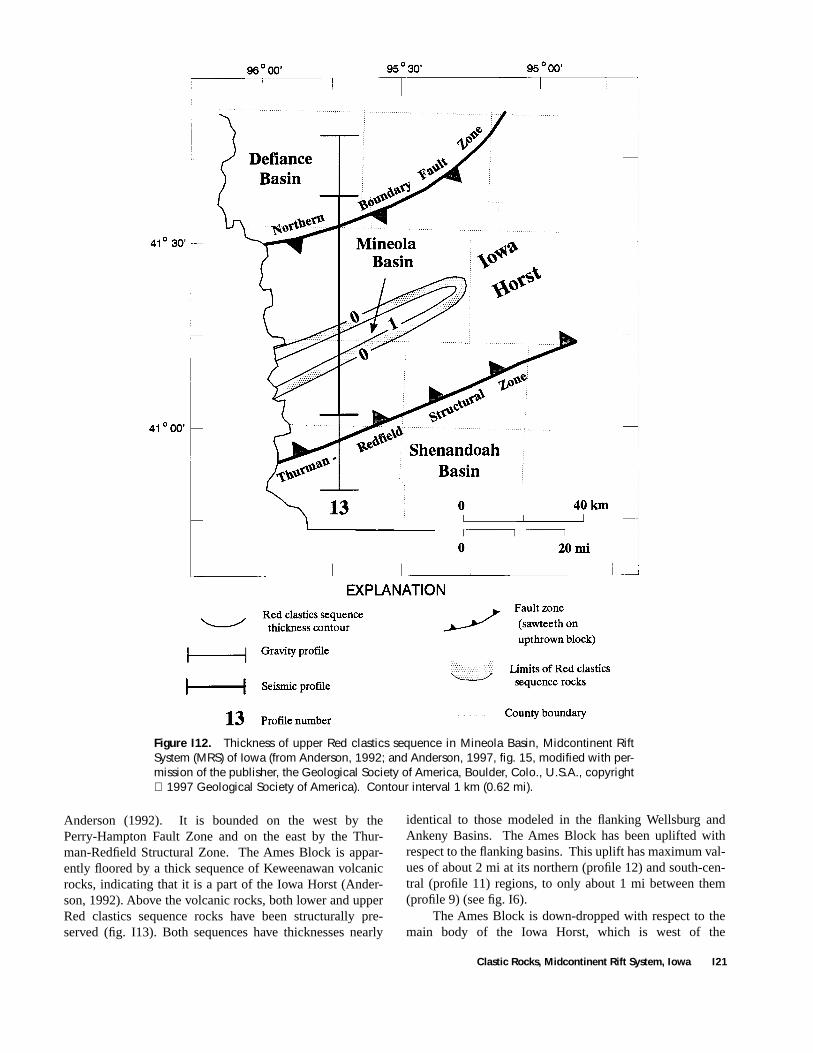
Figure I12.
Thickness of upper Red clastics sequence in Mineola Basin, Midcontinent RiftSystem (MRS) of Iowa (from Anderson, 1992; and Anderson, 1997, fig. 15, modified with per-mission of the publisher, the Geological Society of America, Boulder, Colo., U.S.A., copyright
1997 Geological Society of America). Contour interval 1 km (0.62 mi).
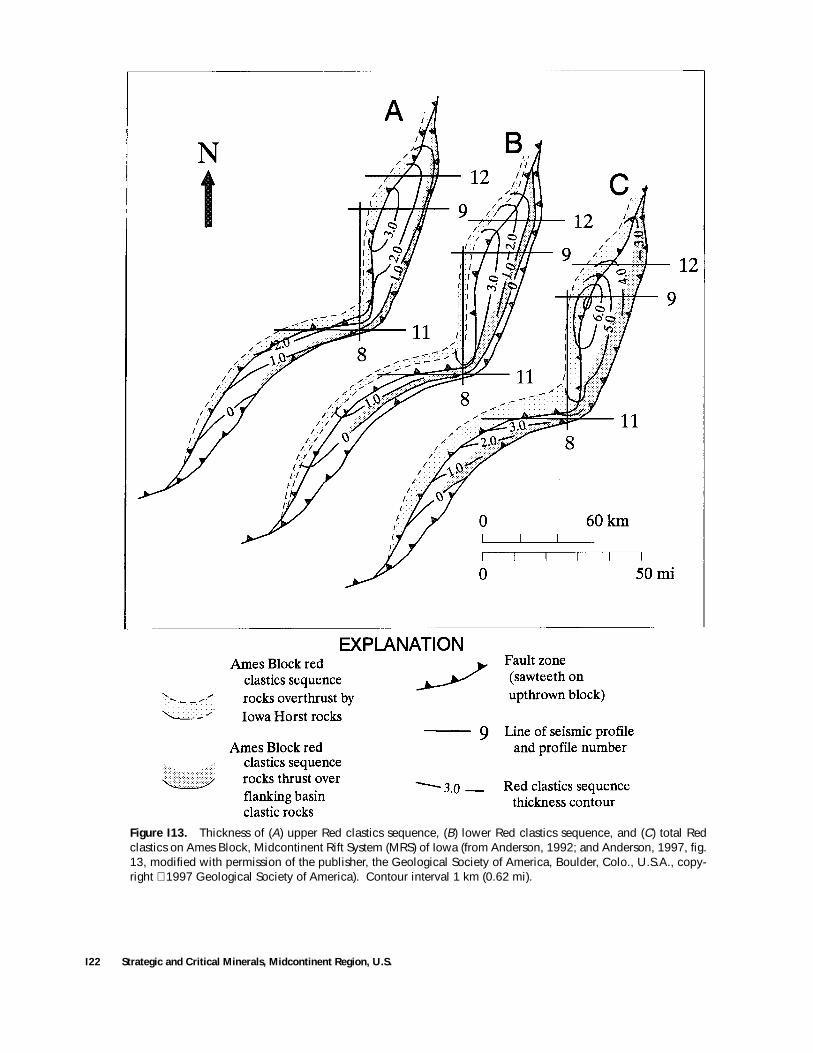
Anderson (1992). It is bounded on the west by thePerry-Hampton Fault Zone and on the east by the Thur-man-Redfield Structural Zone. The Ames Block is appar-ently floored by a thick sequence of Keweenawan volcanicrocks, indicating that it is a part of the Iowa Horst (Ander-son, 1992). Above the volcanic rocks, both lower and upperRed clastics sequence rocks have been structurally pre-served (fig. I13). Both sequences have thicknesses nearly
identical to those modeled in the flanking Wellsburg andAnkeny Basins. The Ames Block has been uplifted withrespect to the flanking basins. This uplift has maximum val-ues of about 2 mi at its northern (profile 12) and south-cen-tral (profile 11) regions, to only about 1 mi between them(profile 9) (see fig. I6).
The Ames Block is down-dropped with respect to themain body of the Iowa Horst, which is west of the
Clastic Rocks, Midcontinent Rift System, Iowa I21
I22 Strategic and Critical Minerals, Midcontinent Region, U.S.
Figure I13.
Thickness of (
A
) upper Red clastics sequence, (
B
) lower Red clastics sequence, and (
C
) total Redclastics on Ames Block, Midcontinent Rift System (MRS) of Iowa (from Anderson, 1992; and Anderson, 1997, fig.13, modified with permission of the publisher, the Geological Society of America, Boulder, Colo., U.S.A., copy-right
1997 Geological Society of America). Contour interval 1 km (0.62 mi).
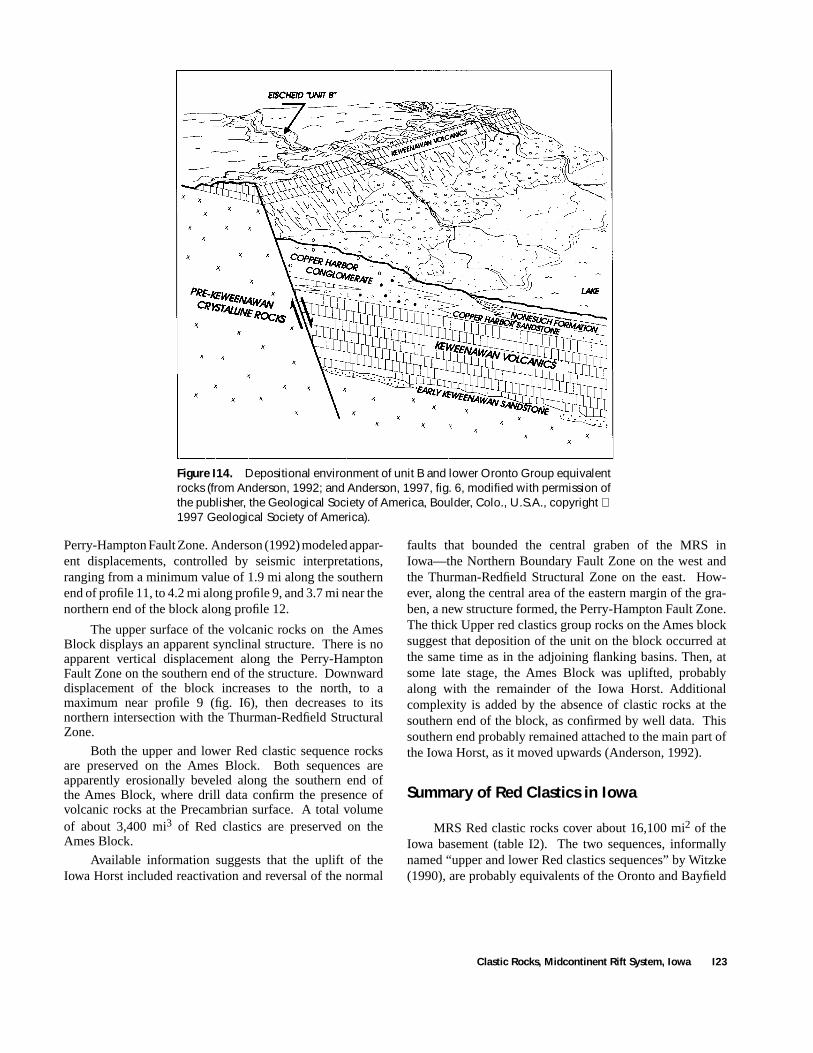
Figure I14.
Depositional environment of unit B and lower Oronto Group equivalent rocks (from Anderson, 1992; and Anderson, 1997, fig. 6, modified with permission of the publisher, the Geological Society of America, Boulder, Colo., U.S.A., copyright
1997 Geological Society of America).
Perry-Hampton Fault Zone. Anderson (1992) modeled appar-ent displacements, controlled by seismic interpretations,ranging from a minimum value of 1.9 mi along the southernend of profile 11, to 4.2 mi along profile 9, and 3.7 mi near thenorthern end of the block along profile 12.
The upper surface of the volcanic rocks on the AmesBlock displays an apparent synclinal structure. There is noapparent vertical displacement along the Perry-HamptonFault Zone on the southern end of the structure. Downwarddisplacement of the block increases to the north, to amaximum near profile 9 (fig. I6), then decreases to itsnorthern intersection with the Thurman-Redfield StructuralZone.
Both the upper and lower Red clastic sequence rocksare preserved on the Ames Block. Both sequences areapparently erosionally beveled along the southern end ofthe Ames Block, where drill data confirm the presence ofvolcanic rocks at the Precambrian surface. A total volumeof about 3,400 mi3 of Red clastics are preserved on theAmes Block.
Available information suggests that the uplift of theIowa Horst included reactivation and reversal of the normal
faults that bounded the central graben of the MRS inIowa—the Northern Boundary Fault Zone on the west andthe Thurman-Redfield Structural Zone on the east. How-ever, along the central area of the eastern margin of the gra-ben, a new structure formed, the Perry-Hampton Fault Zone.The thick Upper red clastics group rocks on the Ames blocksuggest that deposition of the unit on the block occurred atthe same time as in the adjoining flanking basins. Then, atsome late stage, the Ames Block was uplifted, probablyalong with the remainder of the Iowa Horst. Additionalcomplexity is added by the absence of clastic rocks at thesouthern end of the block, as confirmed by well data. Thissouthern end probably remained attached to the main part ofthe Iowa Horst, as it moved upwards (Anderson, 1992).
Summary of Red Clastics in Iowa
MRS Red clastic rocks cover about 16,100 mi2 of theIowa basement (table I2). The two sequences, informallynamed “upper and lower Red clastics sequences” by Witzke(1990), are probably equivalents of the Oronto and Bayfield
Clastic Rocks, Midcontinent Rift System, Iowa I23
Groups (and related rocks) of the Lake Superior area. Ander-son (1992) estimated that a total volume of 39,800 mi3 ofthese rocks are preserved in five basins flanking the IowaHorst and three basins and a structural block on the centralhorst in Iowa. The Red clastics in Iowa are restricted to thesubsurface and have been sampled by only 14 drill penetra-tions.
Depositional History of MRS Clastic Rocks in Iowa
MRS Lower Red Clastics Sequence
Much of the early stages of formation of the MRS wascharacterized by the emplacement of thick sequences ofmafic-dominated volcanic rocks. Periods of magmatismwere separated by periods of quiescence marked by erosionand the deposition of interflow clastic rocks. None of theseinterflow clastic rocks is known to be present in Iowa, but it isprobable that they exist and they are similar to thosedescribed in the Lake Superior region (see Jirsa, 1984). Stud-ies in the Lake Superior region by several geologists, includ-ing Daniels (1982), indicate that as rift volcanism waned,clastic sedimentation became the predominant depositionalprocess along the axis of the rift. Although rift volcanismceased, probably due to a relaxation of the tensile stresses,subsidence of the rift zone continued, driven in part by isos-tatic adjustments to the thick, dense pile of rift-filling volca-nic rocks. In the Lake Superior area, the Oronto Group andrelated units are known primarily from exposures of depositsin the central graben. In the Eischeid well in Iowa the lowerRed clastics sequence was deposited outside of the centralgraben. The basal unit of the Oronto Group, the Copper Har-bor Conglomerate, is dominated by mafic volcanic rock frag-ments, apparently derived from volcanic rocks in the footwallof the graben-bounding normal faults (fig. I14). This sug-gests that deposition of Copper Harbor Conglomerate sedi-ments was primarily limited to the area of the central horst.This unit and all other Oronto Group units are known onlyfrom this area, but related rocks may be buried beneath thickBayfield Group sedimentary rocks as modeled by Mooneyand others (1970) and Chandler and others (1989). Unit B inthe M.G. Eischeid #1 well, the basal unit of the Red clasticsin the horst-flanking basins in Iowa, was interpreted byAnderson (1992) as the distal equivalent of the Copper Har-bor Conglomerate. These fluvial sediments were depositedby rivers that eventually flowed into the central graben. Twowells, the Ogden City #2 and Boone City #1, on the IowaHorst in Boone County, encountered clastic rocks, probablyCopper Harbor Conglomerate equivalent units.
Standing bodies of water, probably lakes but possibly anarm of the sea, that developed in the MRS grabens hosted thedeposition of a sequence of siltstones and shales, the None-
such Formation and equivalent units. Although Hieshima andPratt (1991) used sulfur/carbon isotope ratios to infer amarine environment for Nonesuch sedimentation, Anderson(1992) concluded that regional structures argued against aconnection to the open ocean.
The water bodies in the MRS were apparently rich inalgae and fungae (Moore and others, 1969), which createdan organic-rich sediment. The Nonesuch Formation in theLake Superior area, having a maximum known thickness ofabout 700 ft (Daniels, 1982), was apparently limited in depo-sition to the area of the central graben. In Iowa, however, anequivalent rock sequence (unit C) in the Eischeid well dem-onstrates that in this area the lacustrine environmentextended beyond the limits of the central graben (Anderson,1990c). The 1,470-ft thickness of unit C was depositedabout 15 mi outside the graben and about 55 mi from theaxis of the graben. Additionally, dark-gray shales of unit Cwere encountered in a number of research cores drilled onthe central peak of the Manson Impact Structure, about 11mi west of the Iowa Horst. These shales, as large brecciaclasts in an impact melt-rock matrix, are apparently juxta-posed against underlying brecciated crystalline rocks, sug-gesting that unit C may over-step unit B near the margins ofthe flanking basins.
If interpreted graben margins in Iowa are correct, thelakes that filled the subsiding MRS were probably very large,possibly more than 60 mi wide and may have extended alongmost of the length of the Iowa segment of the MRS, and pos-sibly the entire length of the rift. The thickness of the unitnear the axis of the graben was probably several times thethickness of unit C (Anderson, 1992).
The rift-axial lakes were eventually filled by transgress-ing alluvial fans that deposited the fluvioclastic rocks of theFreda Formation in the Lake Superior area and equivalentunits, including Eischeid well unit D. Deposition of therift-related clastic rocks of the Oronto Group probably ceasedonly a few million to a few tens of millions of years at themost after the cessation of volcanism (about 1,086 Ma; VanSchmus and Hinze, 1995). The end of rift sedimentation wasprobably indicative of the end of rift subsidence and possiblythe initiation of compressive tectonics. This marked thebeginning of a period that was apparently dominated by ero-sion of the recently deposited clastics.
MRS Upper Red Clastics Sequence
Following a period of regional erosion, the area of theMRS was affected by increasing regional shortening that ledto a reversal of movement along the fault system borderingthe central grabens. The central grabens were forcedupwards, ultimately forming axial horsts. Oronto Group sed-iments were eroded from the rising horsts and deposited inbasins that formed along the horst flanks. The remobilizedOronto Group sediments, winnowed during fluvial transport,were also apparently enriched in quartz by mixing with
I24 Strategic and Critical Minerals, Midcontinent Region, U.S.
clastics derived from the granitic terranes in which the MRSwas emplaced (Ojakangas and Morey, 1982a). The sand-stone-dominated sequences that were deposited by theseprocesses, the Bayfield and equivalent units, reach a maxi-mum of about 7,000 ft (Ojakangas and Morey, 1982a). Inthe Lake Superior area, the Bayfield Group is composed ofthree units (fig. I3). Two are feldspathic, fluvial sandstones(the basal Orienta Sandstone and upper ChequamegonSandstone), and the intervening unit is a quartz arenite (theDevils Island Sandstone), interpreted as lacustrine in origin(Ojakangas and Morey, 1982b).
In Iowa, upper Red clastic sequence units E, F, and Gin the Eischeid well were interpreted as equivalent to theBayfield Group (fig. I7) by Witzke (1990). Additionally,Eischeid well unit H is also considered a part of the upperRed clastics sequence (McKay, 1990) and also equivalent tothe Bayfield and related rocks (Anderson, 1990c). All upperRed clastic units in the Eischeid well are feldspathic sand-stones. Unit G, however, is dominated by very fine grainedto fine-grained sandstones and has a large component of silt-stone, possibly indicative of deposition in a standing bodyof water. This is similar to the interpreted environment ofthe Devils Island Sandstone in the Lake Superior area.Units E through G show a progressive increase in the maficvolcanic content of the lithic fragment component of thesandstones and may record the progressive unroofing of thevolcanic rocks of the central horst (Anderson, 1990c; 1992).
Seismic data were interpreted by Cannon and others(1989) to indicate the presence of Bayfield Group sedimen-tary rocks overlying the Oronto Group beneath central LakeSuperior. On land, however, no Bayfield Group rocks havebeen identified on the central horsts. The exception may befound in Iowa, where the Mineola Basin, centered on theIowa Horst in southwestern Iowa and modeled on profile 13,is filled with sediments interpreted as low-density upperRed clastic sequence rocks.
In Iowa, rocks of the Bayfield Group equivalent, theupper Red clastics sequence in the Eischeid well, totals7,708 ft in thickness. Along several of the seismically con-trolled profiles, the upper sequence reaches a thickness ofabout 13,000 ft in the Wellsburg Basin and on the AmesBlock.
Problems Associated with Differentiation of Clastics
Historically, geologists working in Iowa have had diffi-culty differentiating the Red clastics from the basal Paleo-zoic sandstones (traditionally called Mount SimonSandstone). This problem arises from the similarity of thelithologies (sandstones, siltstones, and shales), color, andthe scarcity of diagnostic fossils. Additionally, since thebasal clastic units apparently contain no mineral resourcesor petroleum and are only rarely utilized as an aquifer, sam-ples are rare and the units are not well understood. Previousexaminations of samples and logs from the two deepest
early penetrations of these clastic sequences (#1 Wilson and#1 Huntly oil tests) identified Cambrian fossils deep into theclastic sequence, leading to the interpretation of thickMount Simon Sandstone basins above the Red clastic basinson the flanks of the MRS Iowa Horst (Bunker, 1982; Bunkerand others, 1988). Such “reactivated” basins are notobserved in similar positions along the MRS in Minnesotaor Kansas (Sims, 1990). This interpretation of deep MountSimon basins was investigated by additional studies of thepetrology and other characteristics of strata in thick MountSimon sequences. This information, combined with datafrom the study of the Red clastics in the M.G. Eischeid #1well (see Anderson, 1990a) led to the development of crite-ria for distinguishing the two units.
Investigation of the UPH–2 Core
The first step in this stratigraphic investigation was todetermine the characteristics of thick Mount Simon Sand-stone strata. Such a thick Mount Simon sequence is presentin northern Illinois, but no cores of this material had beendescribed in detail. To provide this information the thickMount Simon interval of the Consolidated Edison UPH–2core drilled in Stephenson County, in northern Illinois nearthe town of Lena, was logged. The core, one of three, wasrecovered from the northwest flank of the Mount SimonBasin, mapped by Buschbach (1975) and known to exceed2,460 ft in depth.
The Mount Simon Sandstone in the UPH–2 core ispresent at a depth between 1,310 and 2,178.5 ft and overliesProterozoic granite porphyry. It can be characterized as avery fine to very coarse grained sandstone containing gran-ules and pebbles. The unit contains less than 5 percent shaleand includes many upward-fining sequences characterizedby a poorly stratified base grading upward to better stratifiedupper units. The coarse-grained and pebbly beds generallyincrease in frequency with depth. The texture, grain size,and sorting are highly variable from bed to bed. The colorof the sandstones of the Mount Simon is also highly variablefrom white (clear to frosted) to yellow and red, and theshales are predominantly red with some green and mottledcolors.
Body fossils were not observed in the Mount SimonSandstone in the UPH–2 core, but some trace fossils wereobserved, including Skolithos, Arenicolites, and Cruziana orRusophycus, generally above 1,584.5 ft. Bioturbation ismost common in the upper 220 ft of the Mount Simon and istotally absent below 1,600 ft.
The sandstones in the Mount Simon are well stratified,individual strata generally being less than 1 ft thick. Struc-tures observed include parallel, horizontal, small- andlarge-scale cross-stratification. Clay drapes were observedover small-scale, cross-stratified intervals, mudstone rip-upclasts, minor flaser structures, and minor lenticular sand-stone bodies.
A qualitative mineralogical assessment during loggingdetermined that the sandstones were quartz-rich. Shales
Clastic Rocks, Midcontinent Rift System, Iowa I25
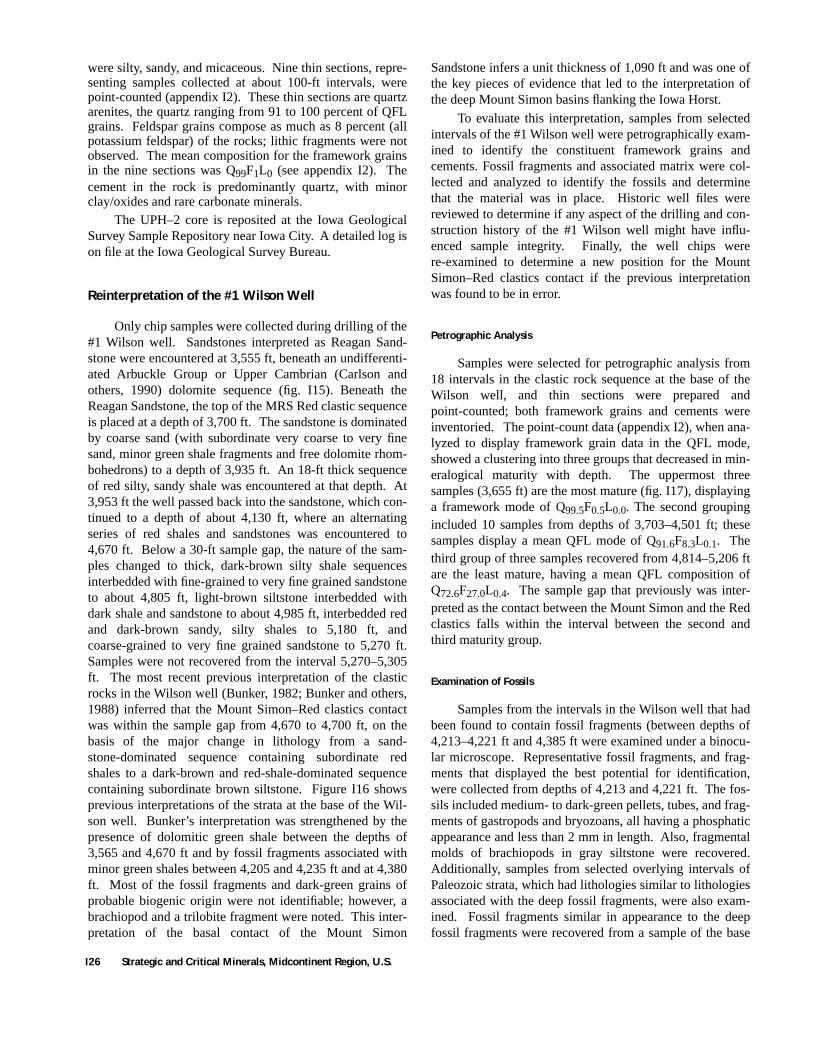
were silty, sandy, and micaceous. Nine thin sections, repre-senting samples collected at about 100-ft intervals, werepoint-counted (appendix I2). These thin sections are quartzarenites, the quartz ranging from 91 to 100 percent of QFLgrains. Feldspar grains compose as much as 8 percent (allpotassium feldspar) of the rocks; lithic fragments were notobserved. The mean composition for the framework grainsin the nine sections was Q99F1L0 (see appendix I2). Thecement in the rock is predominantly quartz, with minorclay/oxides and rare carbonate minerals.
The UPH–2 core is reposited at the Iowa GeologicalSurvey Sample Repository near Iowa City. A detailed log ison file at the Iowa Geological Survey Bureau.
Reinterpretation of the #1 Wilson Well
Only chip samples were collected during drilling of the#1 Wilson well. Sandstones interpreted as Reagan Sand-stone were encountered at 3,555 ft, beneath an undifferenti-ated Arbuckle Group or Upper Cambrian (Carlson andothers, 1990) dolomite sequence (fig. I15). Beneath theReagan Sandstone, the top of the MRS Red clastic sequenceis placed at a depth of 3,700 ft. The sandstone is dominatedby coarse sand (with subordinate very coarse to very finesand, minor green shale fragments and free dolomite rhom-bohedrons) to a depth of 3,935 ft. An 18-ft thick sequenceof red silty, sandy shale was encountered at that depth. At3,953 ft the well passed back into the sandstone, which con-tinued to a depth of about 4,130 ft, where an alternatingseries of red shales and sandstones was encountered to4,670 ft. Below a 30-ft sample gap, the nature of the sam-ples changed to thick, dark-brown silty shale sequencesinterbedded with fine-grained to very fine grained sandstoneto about 4,805 ft, light-brown siltstone interbedded withdark shale and sandstone to about 4,985 ft, interbedded redand dark-brown sandy, silty shales to 5,180 ft, andcoarse-grained to very fine grained sandstone to 5,270 ft.Samples were not recovered from the interval 5,270–5,305ft. The most recent previous interpretation of the clasticrocks in the Wilson well (Bunker, 1982; Bunker and others,1988) inferred that the Mount Simon–Red clastics contactwas within the sample gap from 4,670 to 4,700 ft, on thebasis of the major change in lithology from a sand-stone-dominated sequence containing subordinate redshales to a dark-brown and red-shale-dominated sequencecontaining subordinate brown siltstone. Figure I16 showsprevious interpretations of the strata at the base of the Wil-son well. Bunker’s interpretation was strengthened by thepresence of dolomitic green shale between the depths of3,565 and 4,670 ft and by fossil fragments associated withminor green shales between 4,205 and 4,235 ft and at 4,380ft. Most of the fossil fragments and dark-green grains ofprobable biogenic origin were not identifiable; however, abrachiopod and a trilobite fragment were noted. This inter-pretation of the basal contact of the Mount Simon
Sandstone infers a unit thickness of 1,090 ft and was one ofthe key pieces of evidence that led to the interpretation ofthe deep Mount Simon basins flanking the Iowa Horst.
To evaluate this interpretation, samples from selectedintervals of the #1 Wilson well were petrographically exam-ined to identify the constituent framework grains andcements. Fossil fragments and associated matrix were col-lected and analyzed to identify the fossils and determinethat the material was in place. Historic well files werereviewed to determine if any aspect of the drilling and con-struction history of the #1 Wilson well might have influ-enced sample integrity. Finally, the well chips werere-examined to determine a new position for the MountSimon–Red clastics contact if the previous interpretationwas found to be in error.
Petrographic Analysis
Samples were selected for petrographic analysis from18 intervals in the clastic rock sequence at the base of theWilson well, and thin sections were prepared andpoint-counted; both framework grains and cements wereinventoried. The point-count data (appendix I2), when ana-lyzed to display framework grain data in the QFL mode,showed a clustering into three groups that decreased in min-eralogical maturity with depth. The uppermost threesamples (3,655 ft) are the most mature (fig. I17), displayinga framework mode of Q99.5F0.5L0.0. The second groupingincluded 10 samples from depths of 3,703–4,501 ft; thesesamples display a mean QFL mode of Q91.6F8.3L0.1. Thethird group of three samples recovered from 4,814–5,206 ftare the least mature, having a mean QFL composition ofQ72.6F27.0L0.4. The sample gap that previously was inter-preted as the contact between the Mount Simon and the Redclastics falls within the interval between the second andthird maturity group.
Examination of Fossils
Samples from the intervals in the Wilson well that hadbeen found to contain fossil fragments (between depths of4,213–4,221 ft and 4,385 ft were examined under a binocu-lar microscope. Representative fossil fragments, and frag-ments that displayed the best potential for identification,were collected from depths of 4,213 and 4,221 ft. The fos-sils included medium- to dark-green pellets, tubes, and frag-ments of gastropods and bryozoans, all having a phosphaticappearance and less than 2 mm in length. Also, fragmentalmolds of brachiopods in gray siltstone were recovered.Additionally, samples from selected overlying intervals ofPaleozoic strata, which had lithologies similar to lithologiesassociated with the deep fossil fragments, were also exam-ined. Fossil fragments similar in appearance to the deepfossil fragments were recovered from a sample of the base
I26 Strategic and Critical Minerals, Midcontinent Region, U.S.
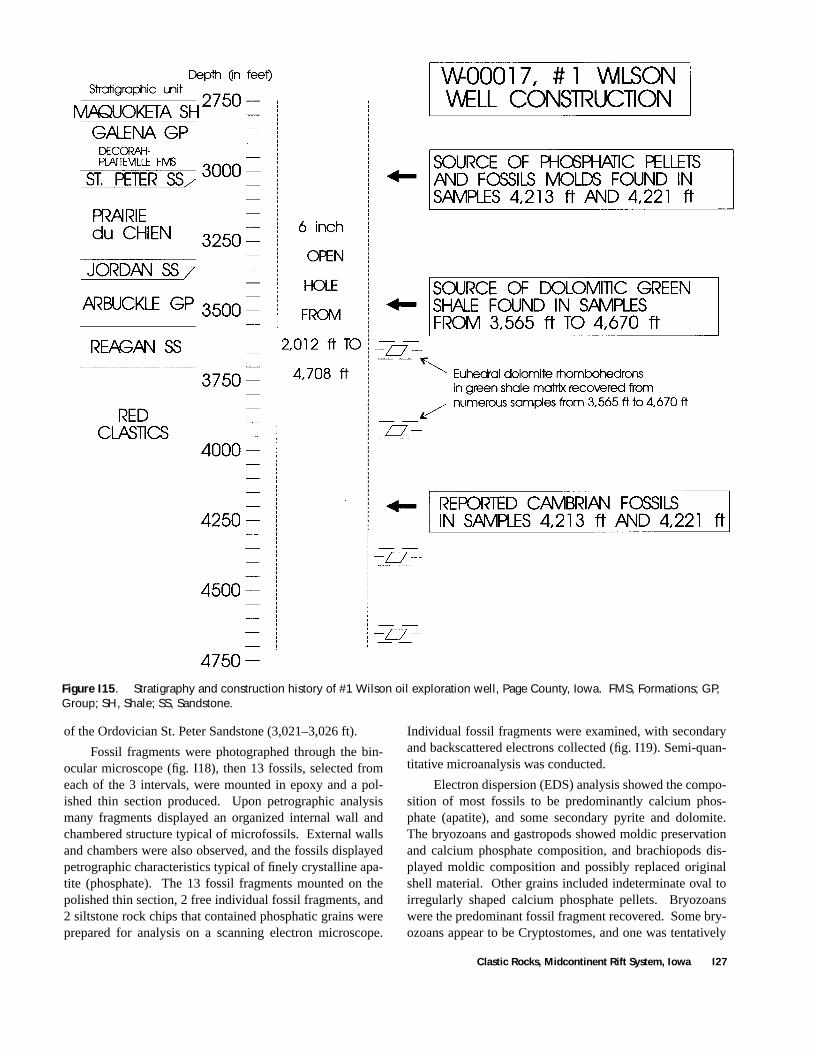
Figure I15. Stratigraphy and construction history of #1 Wilson oil exploration well, Page County, Iowa. FMS, Formations; GP, Group; SH, Shale; SS, Sandstone.
of the Ordovician St. Peter Sandstone (3,021–3,026 ft).
Fossil fragments were photographed through the bin-ocular microscope (fig. I18), then 13 fossils, selected fromeach of the 3 intervals, were mounted in epoxy and a pol-ished thin section produced. Upon petrographic analysismany fragments displayed an organized internal wall andchambered structure typical of microfossils. External wallsand chambers were also observed, and the fossils displayedpetrographic characteristics typical of finely crystalline apa-tite (phosphate). The 13 fossil fragments mounted on thepolished thin section, 2 free individual fossil fragments, and2 siltstone rock chips that contained phosphatic grains wereprepared for analysis on a scanning electron microscope.
Individual fossil fragments were examined, with secondaryand backscattered electrons collected (fig. I19). Semi-quan-titative microanalysis was conducted.
Electron dispersion (EDS) analysis showed the compo-sition of most fossils to be predominantly calcium phos-phate (apatite), and some secondary pyrite and dolomite.The bryozoans and gastropods showed moldic preservationand calcium phosphate composition, and brachiopods dis-played moldic composition and possibly replaced originalshell material. Other grains included indeterminate oval toirregularly shaped calcium phosphate pellets. Bryozoanswere the predominant fossil fragment recovered. Some bry-ozoans appear to be Cryptostomes, and one was tentatively
Clastic Rocks, Midcontinent Rift System, Iowa I27
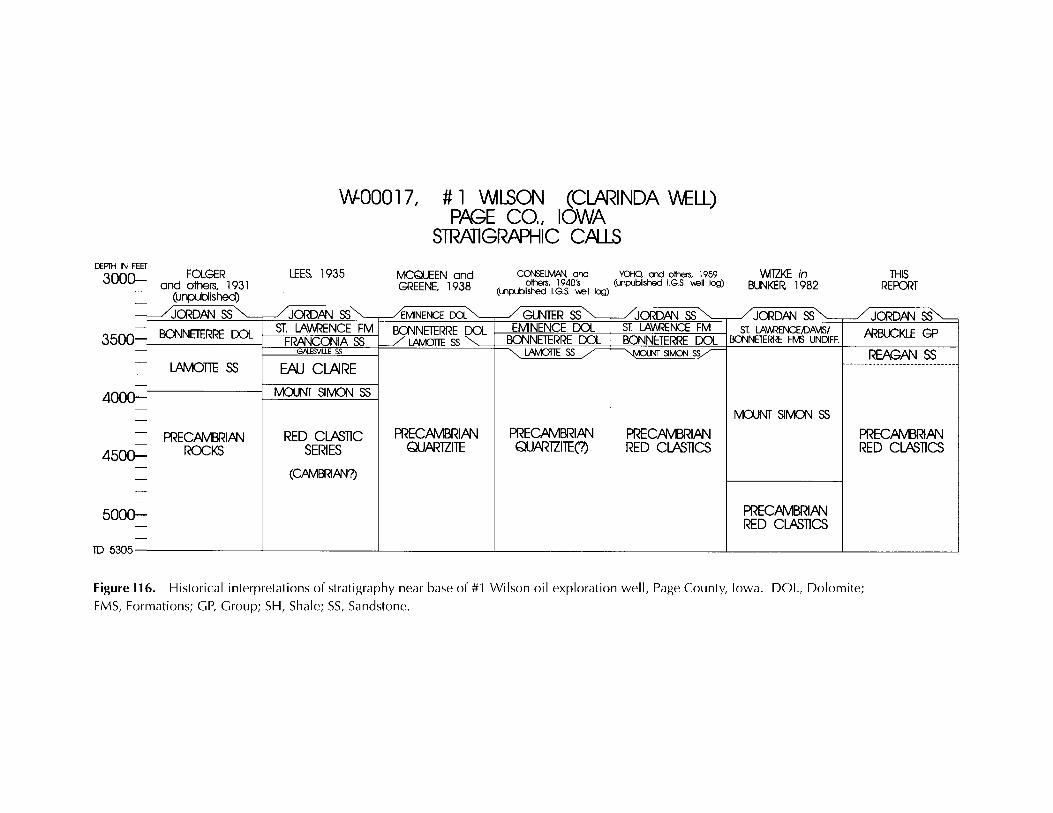
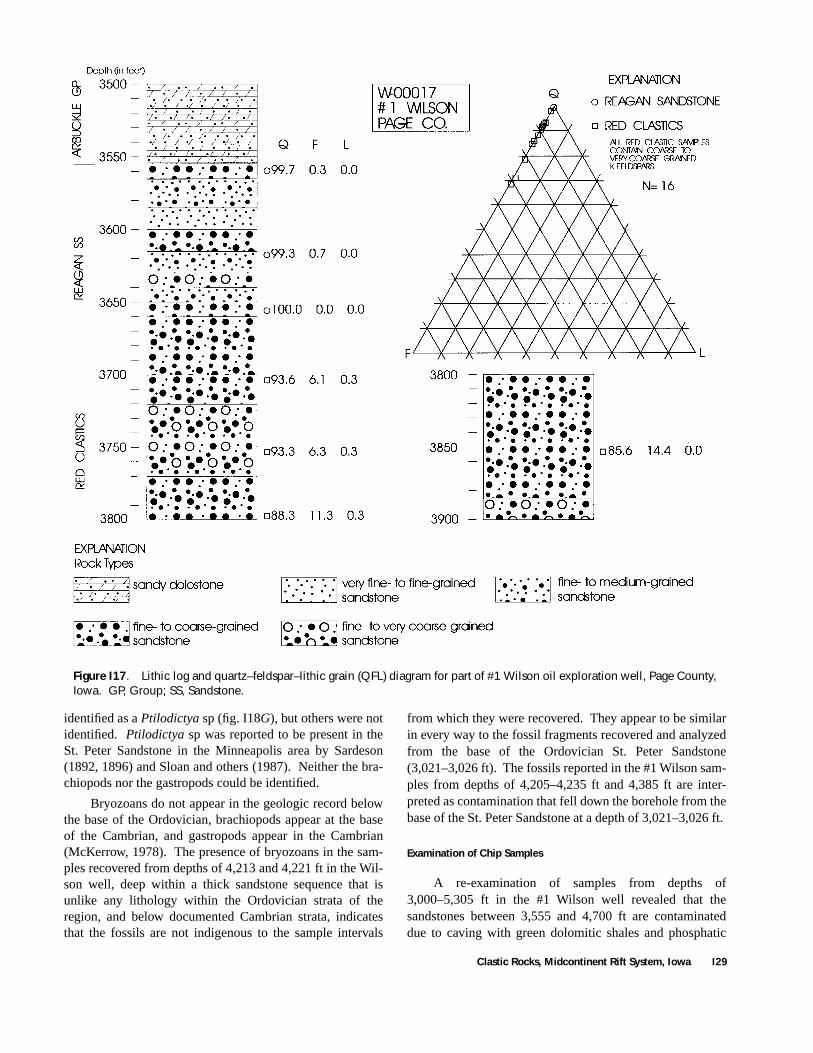
Figure I17. Lithic log and quartz–feldspar–lithic grain (QFL) diagram for part of #1 Wilson oil exploration well, Page County, Iowa. GP, Group; SS, Sandstone.
identified as a Ptilodictya sp (fig. I18G), but others were notidentified. Ptilodictya sp was reported to be present in theSt. Peter Sandstone in the Minneapolis area by Sardeson(1892, 1896) and Sloan and others (1987). Neither the bra-chiopods nor the gastropods could be identified.
Bryozoans do not appear in the geologic record belowthe base of the Ordovician, brachiopods appear at the baseof the Cambrian, and gastropods appear in the Cambrian(McKerrow, 1978). The presence of bryozoans in the sam-ples recovered from depths of 4,213 and 4,221 ft in the Wil-son well, deep within a thick sandstone sequence that isunlike any lithology within the Ordovician strata of theregion, and below documented Cambrian strata, indicatesthat the fossils are not indigenous to the sample intervals
from which they were recovered. They appear to be similarin every way to the fossil fragments recovered and analyzedfrom the base of the Ordovician St. Peter Sandstone(3,021–3,026 ft). The fossils reported in the #1 Wilson sam-ples from depths of 4,205–4,235 ft and 4,385 ft are inter-preted as contamination that fell down the borehole from thebase of the St. Peter Sandstone at a depth of 3,021–3,026 ft.
Examination of Chip Samples
A re-examination of samples from depths of3,000–5,305 ft in the #1 Wilson well revealed that thesandstones between 3,555 and 4,700 ft are contaminateddue to caving with green dolomitic shales and phosphatic
Clastic Rocks, Midcontinent Rift System, Iowa I29
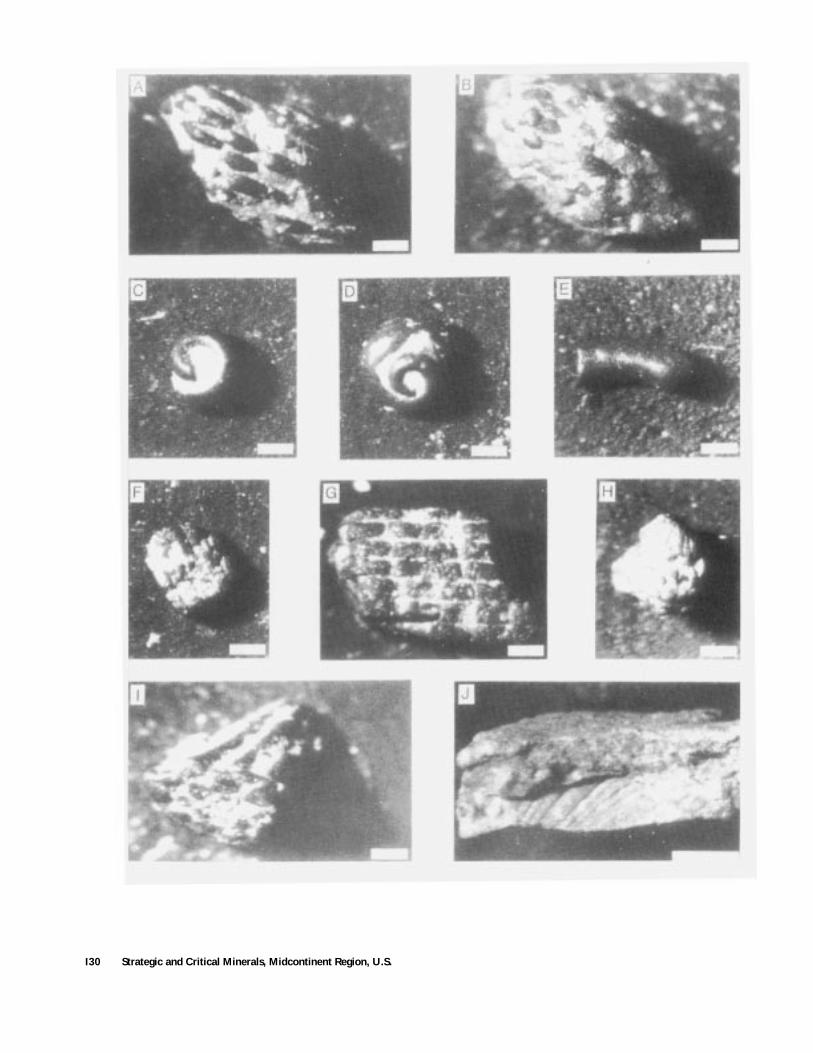
I30 Strategic and Critical Minerals, Midcontinent Region, U.S.
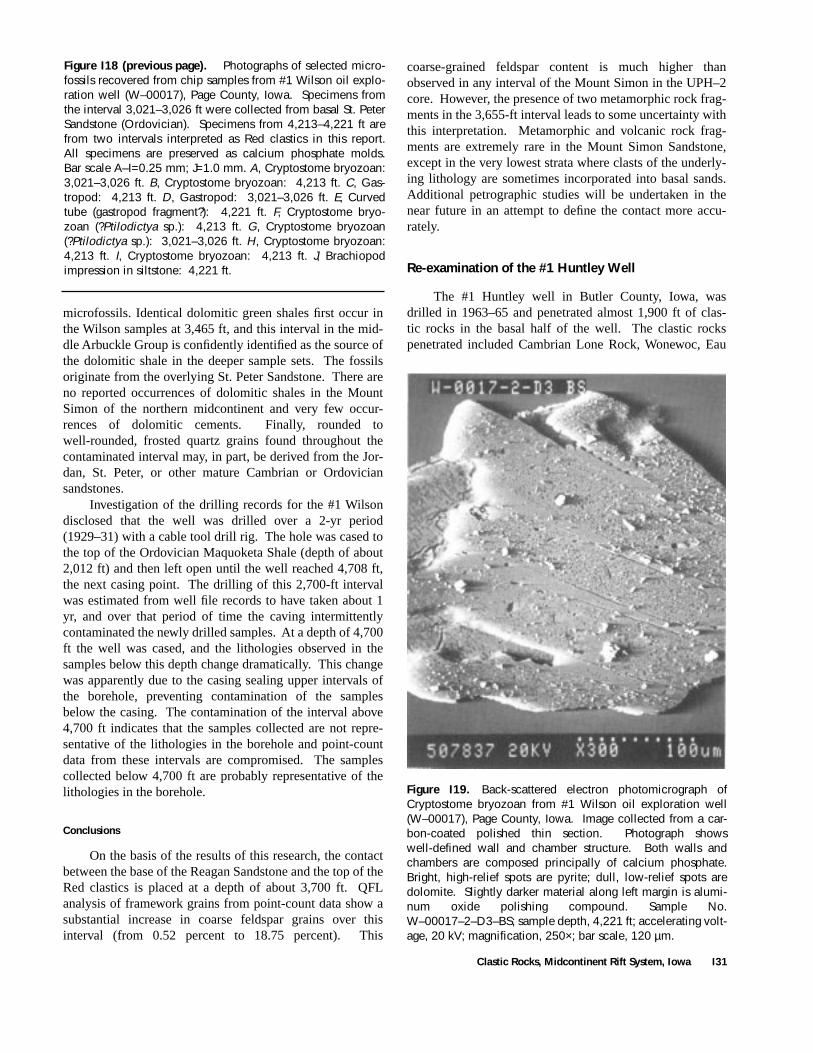
Figure I18 (previous page). Photographs of selected micro-fossils recovered from chip samples from #1 Wilson oil explo-ration well (W–00017), Page County, Iowa. Specimens fromthe interval 3,021–3,026 ft were collected from basal St. PeterSandstone (Ordovician). Specimens from 4,213–4,221 ft arefrom two intervals interpreted as Red clastics in this report.All specimens are preserved as calcium phosphate molds.Bar scale A–I=0.25 mm; J=1.0 mm. A, Cryptostome bryozoan:3,021–3,026 ft. B, Cryptostome bryozoan: 4,213 ft. C, Gas-tropod: 4,213 ft. D, Gastropod: 3,021–3,026 ft. E, Curvedtube (gastropod fragment?): 4,221 ft. F, Cryptostome bryo-zoan (?Ptilodictya sp.): 4,213 ft. G, Cryptostome bryozoan(?Ptilodictya sp.): 3,021–3,026 ft. H, Cryptostome bryozoan:4,213 ft. I, Cryptostome bryozoan: 4,213 ft. J, Brachiopodimpression in siltstone: 4,221 ft.
Figure I19. Back-scattered electron photomicrograph ofCryptostome bryozoan from #1 Wilson oil exploration well(W–00017), Page County, Iowa. Image collected from a car-bon-coated polished thin section. Photograph showswell-defined wall and chamber structure. Both walls andchambers are composed principally of calcium phosphate.Bright, high-relief spots are pyrite; dull, low-relief spots aredolomite. Slightly darker material along left margin is alumi-num oxide polishing compound. Sample No.W–00017–2–D3–BS; sample depth, 4,221 ft; accelerating volt-age, 20 kV; magnification, 250×; bar scale, 120 µm.
microfossils. Identical dolomitic green shales first occur inthe Wilson samples at 3,465 ft, and this interval in the mid-dle Arbuckle Group is confidently identified as the source ofthe dolomitic shale in the deeper sample sets. The fossilsoriginate from the overlying St. Peter Sandstone. There areno reported occurrences of dolomitic shales in the MountSimon of the northern midcontinent and very few occur-rences of dolomitic cements. Finally, rounded towell-rounded, frosted quartz grains found throughout thecontaminated interval may, in part, be derived from the Jor-dan, St. Peter, or other mature Cambrian or Ordoviciansandstones.
Investigation of the drilling records for the #1 Wilsondisclosed that the well was drilled over a 2-yr period(1929–31) with a cable tool drill rig. The hole was cased tothe top of the Ordovician Maquoketa Shale (depth of about2,012 ft) and then left open until the well reached 4,708 ft,the next casing point. The drilling of this 2,700-ft intervalwas estimated from well file records to have taken about 1yr, and over that period of time the caving intermittentlycontaminated the newly drilled samples. At a depth of 4,700ft the well was cased, and the lithologies observed in thesamples below this depth change dramatically. This changewas apparently due to the casing sealing upper intervals ofthe borehole, preventing contamination of the samplesbelow the casing. The contamination of the interval above4,700 ft indicates that the samples collected are not repre-sentative of the lithologies in the borehole and point-countdata from these intervals are compromised. The samplescollected below 4,700 ft are probably representative of thelithologies in the borehole.
Conclusions
On the basis of the results of this research, the contactbetween the base of the Reagan Sandstone and the top of theRed clastics is placed at a depth of about 3,700 ft. QFLanalysis of framework grains from point-count data show asubstantial increase in coarse feldspar grains over thisinterval (from 0.52 percent to 18.75 percent). This
coarse-grained feldspar content is much higher thanobserved in any interval of the Mount Simon in the UPH–2core. However, the presence of two metamorphic rock frag-ments in the 3,655-ft interval leads to some uncertainty withthis interpretation. Metamorphic and volcanic rock frag-ments are extremely rare in the Mount Simon Sandstone,except in the very lowest strata where clasts of the underly-ing lithology are sometimes incorporated into basal sands.Additional petrographic studies will be undertaken in thenear future in an attempt to define the contact more accu-rately.
Re-examination of the #1 Huntley Well
The #1 Huntley well in Butler County, Iowa, wasdrilled in 1963–65 and penetrated almost 1,900 ft of clas-tic rocks in the basal half of the well. The clastic rockspenetrated included Cambrian Lone Rock, Wonewoc, Eau
Clastic Rocks, Midcontinent Rift System, Iowa I31
Claire, and Mount Simon Formations overlying a thicksequence (about 1,280 ft) originally interpreted as Redclastics. A number of brachiopod fragments were reportedto be present at depths of 3,505–3,525 ft near the bottom ofthe well and were originally interpreted as contaminationdue to caving (IGSB unpublished log by D.L. Koch, 1965).
Re-examination of the chips in the late 1970’s led to arevised interpretation of the stratigraphy (Bunker, 1981;1982; and Bunker and others, 1988). The new interpretationplaced the basal 1,465 ft of the clastics in the Mount SimonSandstone. This was based on the lack of a distinct contactwith the Red clastics, the coarse to very coarse sand grainspresent throughout the unit, dolomitic cement, and the fos-sils near the base of the well that were thought to be imbed-ded in a matrix that was unlike any lithology observed inoverlying units. The fossils were, therefore, interpreted tobe in place.
For this study, the history of the drilling of the wellwas investigated (fig. I20); samples were collected from 18intervals of chips, and grain-mount thin sections were pro-duced and point-counted. The data collected (appendix I2)was analyzed to determine QFL framework mineralogy(fig. I21). The QFL analysis of the data produced two pop-ulations. The upper interval (2,150–2,305 ft) was mineral-ogically mature, having a composition of Q98.4F1.6L0.0; no
lithic grains were encountered. This composition is typi-cal of the Mount Simon Sandstone. Point counts of 13 thinsections showed the underlying intervals to have a meanQFL composition of Q78.3F16.2L5.5. This is similar to the
composition of unit H of the Eischeid well. On the basisof the maturity and lithic grain composition of the frame-work grains, examination of the natural gamma-ray log,and feldspar lithic grain size, the contact between theMount Simon and the Red clastics is judged to be at 2,305ft in the #1 Huntley well. This interpretation results in theMount Simon being 175 ft thick, much thinner than theprevious interpretation, which suggested a unit thickness of1,400 ft.
Fossil fragments and their matrix from chip samples ofthe depth interval between 3,505 and 3,575 ft were exam-ined. Fragments of inarticulate brachiopods were identifiedin a greenish, argillaceous, glauconitic, very fine grained tofine-grained sandstone matrix. Using existing lithologiclogs of the well as a guide, chips from selected intervals ofCambrian shales in the well were re-examined, and severalsamples were identified that may have been the source ofthe brachiopods and their matrix. Identical brachiopodsand matrix were observed in the basal Eau Claire anduppermost Mount Simon Sandstones in the depth intervalfrom 2,020 to 2,040 ft. This higher level, brachiopod-richinterval remained uncased, and the open hole caved duringthe drilling to its final depth of 3,595 ft (see fig. I20).Examination of the well file records indicates that the wellwas affected by severe caving through this interval, andsince this caving-prone, brachiopod-bearing interval was
never cased off, it is concluded, therefore, that the inarticu-late brachiopods identified between 3,505 and 3,530 ft inthe Huntley well results from contamination from the basalCambrian Eau Claire Sandstone. On the basis of thisrestudy, the top of the Proterozoic Red clastics is placed ata depth of 2,305 ft.
Evaluation of Criteria for Picking the Mount Simon–Red Clastics Contact
This study of the Mount Simon–pre-Mount Simoncontact in Iowa has led to the identification of severallithostratigraphic correlation characteristics that appear use-ful. Traditionally, several criteria have defined the base ofthe Mount Simon and the top of the Red clastics. Primaryamong these criteria is the change in color from the buffsandstones and gray-green shales of the Mount Simon to thepink, orange, or red sandstone and red siltstone and shale ofthe Red clastics. Other criteria include the lack of fossils inthe Red clastics, the first appearance of red shales and silt-stones, and an increase in consolidation with depth of theRed clastics over the Mount Simon. This study, conductedby Robert McKay, suggests that these criteria may not bevalid. Examination of the UPH–2 core indicates that theMount Simon sandstone can be either red or orange and caninclude interbedded red shales. Additionally, the UPH–2core shows that the Mount Simon can be well lithified.While it is true that no fossils are known to be present inMRS sandstones, caving within a drillhole can bring fossilsfrom Paleozoic units down the hole to mix with Red clasticssamples. The study by McKay identified several criteriathat appear to be useful in delineating the contact:
Feldspar size and shape.—Whereas the Mount SimonSandstone is predominantly a quartz arenite, some intervalsmay contain 30 percent or more feldspar (fig. I22). TheMount Simon feldspar is limited to potassium feldspar;many grains display well-defined potassium feldspar over-growths on detrital potassium feldspar grains that form sub-hedral to euhedral, pore-filling crystals. Detrital feldspargrains in the Mount Simon are always smaller (very finegrained to medium grained) than associated quartz grainsand are rounded to subrounded. Feldspar is a common con-stituent of the Red clastics; potassium feldspar is most com-mon, but minor plagioclase can also be found. Authigenicfeldspar is also present in the Red clastics but much lesscommon than detrital feldspar. Most diagnostic is theobservation that detrital feldspar grains in Red clastics areas large or larger than the quartz grains with which they areassociated. Additionally, detrital feldspar grains are com-monly angular to subangular and generally display pro-nounced cleavage faces.
Cement mineralogy.—The mineralogy of the cementsobserved in the Mount Simon and the Red clastics can alsobe helpful in differentiating the units. The Mount Simon is
I32 Strategic and Critical Minerals, Midcontinent Region, U.S.
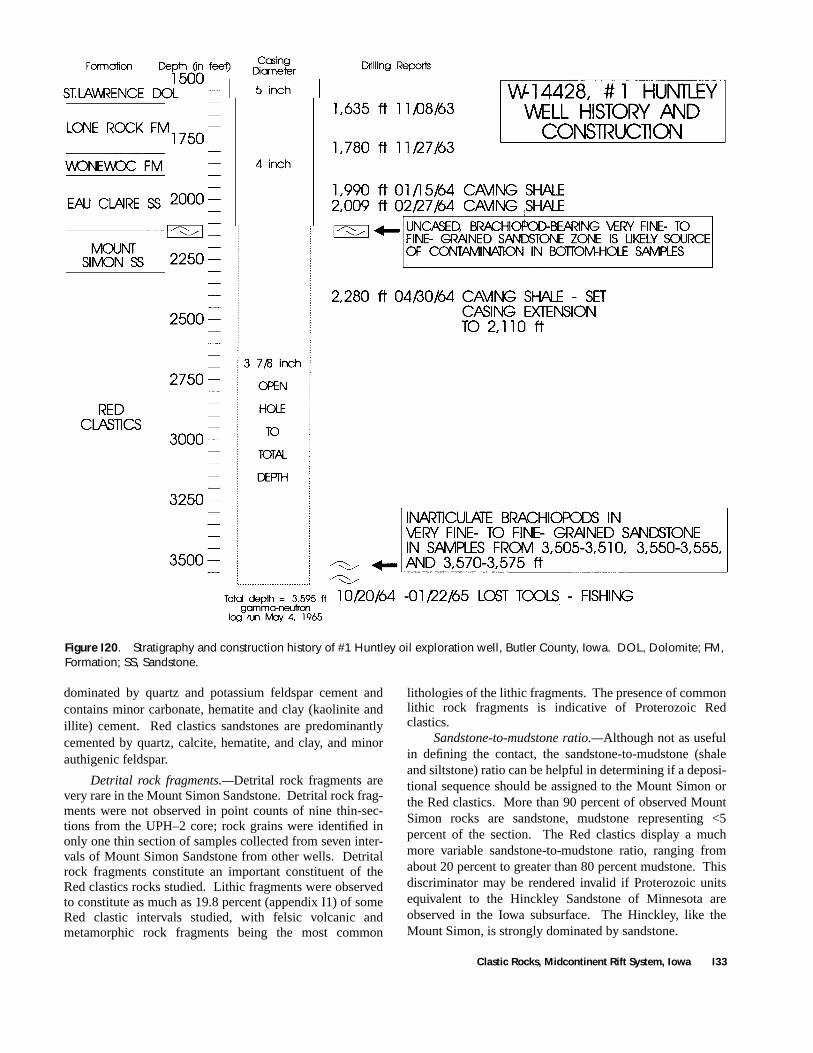
Figure I20. Stratigraphy and construction history of #1 Huntley oil exploration well, Butler County, Iowa. DOL, Dolomite; FM, Formation; SS, Sandstone.
dominated by quartz and potassium feldspar cement andcontains minor carbonate, hematite and clay (kaolinite andillite) cement. Red clastics sandstones are predominantlycemented by quartz, calcite, hematite, and clay, and minorauthigenic feldspar.
Detrital rock fragments.—Detrital rock fragments arevery rare in the Mount Simon Sandstone. Detrital rock frag-ments were not observed in point counts of nine thin-sec-tions from the UPH–2 core; rock grains were identified inonly one thin section of samples collected from seven inter-vals of Mount Simon Sandstone from other wells. Detritalrock fragments constitute an important constituent of theRed clastics rocks studied. Lithic fragments were observedto constitute as much as 19.8 percent (appendix I1) of someRed clastic intervals studied, with felsic volcanic andmetamorphic rock fragments being the most common
lithologies of the lithic fragments. The presence of commonlithic rock fragments is indicative of Proterozoic Redclastics.
Sandstone-to-mudstone ratio.—Although not as usefulin defining the contact, the sandstone-to-mudstone (shaleand siltstone) ratio can be helpful in determining if a deposi-tional sequence should be assigned to the Mount Simon orthe Red clastics. More than 90 percent of observed MountSimon rocks are sandstone, mudstone representing <5percent of the section. The Red clastics display a muchmore variable sandstone-to-mudstone ratio, ranging fromabout 20 percent to greater than 80 percent mudstone. Thisdiscriminator may be rendered invalid if Proterozoic unitsequivalent to the Hinckley Sandstone of Minnesota areobserved in the Iowa subsurface. The Hinckley, like theMount Simon, is strongly dominated by sandstone.
Clastic Rocks, Midcontinent Rift System, Iowa I33
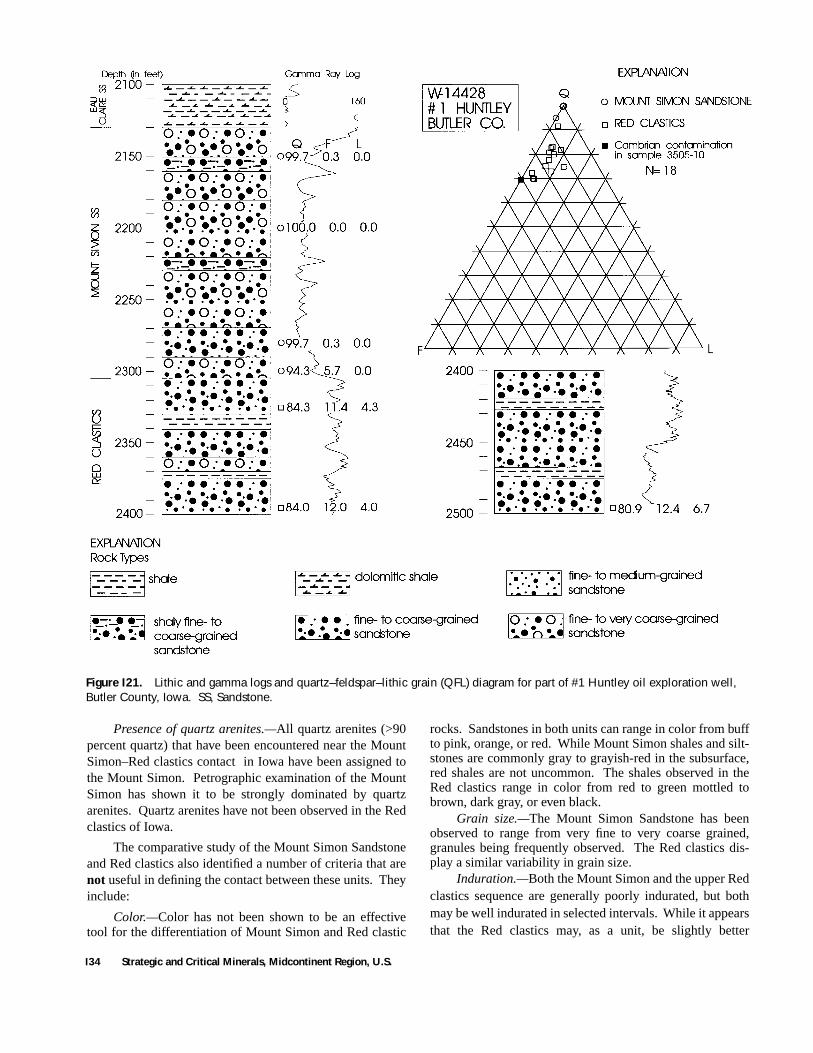
Figure I21. Lithic and gamma logs and quartz–feldspar–lithic grain (QFL) diagram for part of #1 Huntley oil exploration well, Butler County, Iowa. SS, Sandstone.
Presence of quartz arenites.—All quartz arenites (>90percent quartz) that have been encountered near the MountSimon–Red clastics contact in Iowa have been assigned tothe Mount Simon. Petrographic examination of the MountSimon has shown it to be strongly dominated by quartzarenites. Quartz arenites have not been observed in the Redclastics of Iowa.
The comparative study of the Mount Simon Sandstoneand Red clastics also identified a number of criteria that arenot useful in defining the contact between these units. Theyinclude:
Color.—Color has not been shown to be an effectivetool for the differentiation of Mount Simon and Red clastic
rocks. Sandstones in both units can range in color from buffto pink, orange, or red. While Mount Simon shales and silt-stones are commonly gray to grayish-red in the subsurface,red shales are not uncommon. The shales observed in theRed clastics range in color from red to green mottled tobrown, dark gray, or even black.
Grain size.—The Mount Simon Sandstone has beenobserved to range from very fine to very coarse grained,granules being frequently observed. The Red clastics dis-play a similar variability in grain size.
Induration.—Both the Mount Simon and the upper Redclastics sequence are generally poorly indurated, but bothmay be well indurated in selected intervals. While it appearsthat the Red clastics may, as a unit, be slightly better
I34 Strategic and Critical Minerals, Midcontinent Region, U.S.
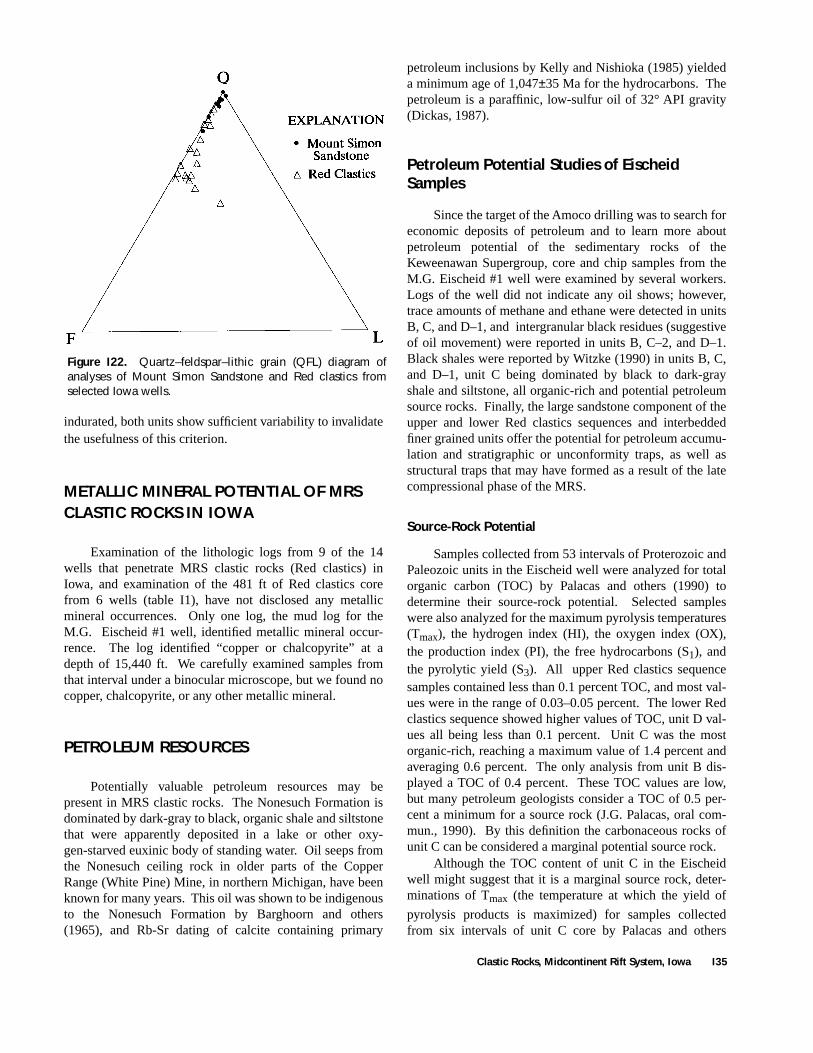
Figure I22. Quartz–feldspar–lithic grain (QFL) diagram ofanalyses of Mount Simon Sandstone and Red clastics fromselected Iowa wells.
indurated, both units show sufficient variability to invalidatethe usefulness of this criterion.
METALLIC MINERAL POTENTIAL OF MRS CLASTIC ROCKS IN IOWA
Examination of the lithologic logs from 9 of the 14wells that penetrate MRS clastic rocks (Red clastics) inIowa, and examination of the 481 ft of Red clastics corefrom 6 wells (table I1), have not disclosed any metallicmineral occurrences. Only one log, the mud log for theM.G. Eischeid #1 well, identified metallic mineral occur-rence. The log identified “copper or chalcopyrite” at adepth of 15,440 ft. We carefully examined samples fromthat interval under a binocular microscope, but we found nocopper, chalcopyrite, or any other metallic mineral.
PETROLEUM RESOURCES
Potentially valuable petroleum resources may bepresent in MRS clastic rocks. The Nonesuch Formation isdominated by dark-gray to black, organic shale and siltstonethat were apparently deposited in a lake or other oxy-gen-starved euxinic body of standing water. Oil seeps fromthe Nonesuch ceiling rock in older parts of the CopperRange (White Pine) Mine, in northern Michigan, have beenknown for many years. This oil was shown to be indigenousto the Nonesuch Formation by Barghoorn and others(1965), and Rb-Sr dating of calcite containing primary
petroleum inclusions by Kelly and Nishioka (1985) yieldeda minimum age of 1,047±35 Ma for the hydrocarbons. Thepetroleum is a paraffinic, low-sulfur oil of 32° API gravity(Dickas, 1987).
Petroleum Potential Studies of Eischeid Samples
Since the target of the Amoco drilling was to search foreconomic deposits of petroleum and to learn more aboutpetroleum potential of the sedimentary rocks of theKeweenawan Supergroup, core and chip samples from theM.G. Eischeid #1 well were examined by several workers.Logs of the well did not indicate any oil shows; however,trace amounts of methane and ethane were detected in unitsB, C, and D–1, and intergranular black residues (suggestiveof oil movement) were reported in units B, C–2, and D–1.Black shales were reported by Witzke (1990) in units B, C,and D–1, unit C being dominated by black to dark-grayshale and siltstone, all organic-rich and potential petroleumsource rocks. Finally, the large sandstone component of theupper and lower Red clastics sequences and interbeddedfiner grained units offer the potential for petroleum accumu-lation and stratigraphic or unconformity traps, as well asstructural traps that may have formed as a result of the latecompressional phase of the MRS.
Source-Rock Potential
Samples collected from 53 intervals of Proterozoic andPaleozoic units in the Eischeid well were analyzed for totalorganic carbon (TOC) by Palacas and others (1990) todetermine their source-rock potential. Selected sampleswere also analyzed for the maximum pyrolysis temperatures(Tmax), the hydrogen index (HI), the oxygen index (OX),the production index (PI), the free hydrocarbons (S1), andthe pyrolytic yield (S3). All upper Red clastics sequencesamples contained less than 0.1 percent TOC, and most val-ues were in the range of 0.03–0.05 percent. The lower Redclastics sequence showed higher values of TOC, unit D val-ues all being less than 0.1 percent. Unit C was the mostorganic-rich, reaching a maximum value of 1.4 percent andaveraging 0.6 percent. The only analysis from unit B dis-played a TOC of 0.4 percent. These TOC values are low,but many petroleum geologists consider a TOC of 0.5 per-cent a minimum for a source rock (J.G. Palacas, oral com-mun., 1990). By this definition the carbonaceous rocks ofunit C can be considered a marginal potential source rock.
Although the TOC content of unit C in the Eischeidwell might suggest that it is a marginal source rock, deter-minations of Tmax (the temperature at which the yield of
pyrolysis products is maximized) for samples collectedfrom six intervals of unit C core by Palacas and others
Clastic Rocks, Midcontinent Rift System, Iowa I35
(1990) indicate that the organic material in the unit isovermature with respect to oil generation. They identifiedTmax values ranging from 497 to 508 °C (averaging 503°C), considerably higher than the 460–465 °C consideredthe maximum temperature at which liquid petroleum is pro-duced. The 503 °C Tmax values for unit C samples placesthe unit in the lower end of the wet gas zone and possiblythe dry gas (metagenetic) zone (Palacas and others, 1990).This advanced stage of thermal maturity was corroboratedby several other studies including homogenization measure-ments on two-phase fluid inclusions in calcite and quartzveins in unit C by Barker (1990). He identified two popula-tions of temperatures, indicating an earlier 200 °C event anda later 140 °C event, which he attributed to deep burial, ele-vated heat flow, or hydrothermal activity. He verified the200 °C event by measuring the peak bitumin reflectance(vitrinite reflectance equivalent) of unit C rocks. Ludvigsonand Spry (1990) measured homogenization temperatures oftwo-phase liquid-vapor fluid inclusions in calcite veins nearthe top of unit C ranging from 125 to 178.6 °C. Pollastroand Finn (1990) used clay geothermometry to calculate aminimum paleotemperature of 175–180 °C for samplesfrom the top of unit C, and to estimate the minimum bottomhole (at 17,851 ft) paleotemperature of 192–197 33 °C.Reflectance measurements on vitrinite-like particles, mea-surements of thermal-alteration index, and indices for chlo-roform-extractable organic matter determined by Palacasand others (1990) indicated that the organic matter in unit Chas advanced well into the gas-generation zone. Palacasand others (1990, p. 119) also calculated genetic potentialsof 0.1–0.4 HG/g and hydrogen indices from 20 to 80 mgHC/g TOC leading them to conclude that “at present, theseshale beds have no potential of generating commercialpetroleum.” They concluded, however, that significantamounts of hydrocarbon may have been generated in thegeologic past.
Porosity
The porosity of the Proterozoic Red clastic rocks in theM.G. Eischeid #1 well was investigated by Schmoker andPalacas (1990) and Ludvigson and others (1990).Schmoker and Palacas utilized a variety of down-hole geo-physical logs to calculate the porosity of sandstonesbetween depths of 11,450 and 17,340 ft (units B and C andthe lower part of unit D). They determined porosity rangingfrom 1 to 6 percent (averaging 2.3 percent) in this interval,with “better” porosity (3.5 percent or more) in about 14 per-cent of the section distributed in their upper (in unit D) andlower (in unit B) zones. The Eischeid mud log noted thedetection of methane and ethane gases in these two zonesand reported intergranular black residue, possibly a bitumenor pyrobitumen-like material (Schmoker and Palacas,1990), in the lower zone.
Ludvigson and others (1990) and Barnes (1990) noted,however, that optically resolvable porosity was not observedin samples below 8,000 ft. The disparity between the lowporosity reported by Schmoker and Palacas and the virtualabsence of porosity noted by Ludvigson and Barnes may bethe presence of micropores (not observable by opticalmicroscopic techniques) or pores as inclusions filled withgas and (or) liquid in calcite and quartz veins and in calcitecements. Also, chips from many intervals included abun-dant loose (not cemented) grains, indicating possible areasof incomplete cementation and higher porosity.
Conclusions
It appears that some intervals of the lower Red clasticssequence in the M.G. Eischeid #1 well, especially unit C,once contained high levels of organic carbon and probablyproduced significant volumes of petroleum. However,hydrocarbon production probably reached its peak relativelyearly in the rock’s history, about 800 Ma (Palacas and oth-ers, 1990). Black intergranular residue reported on the Eisc-heid mud log may identify paths of petroleum migrationthrough overlying and underlying rocks, but no areas of pastpetroleum accumulations were identified. The organic-richrocks in the Eischeid well have realized most of their petro-leum potential and are presently overmature and retain nopotential for producing commercial petroleum. Porosity isalso very low in the Proterozoic clastic rocks in the Eischeidwell. Much of the original pore space may have beendestroyed by compaction and the precipitation ofintergranular cements.
Petroleum Potential of MRS Clastic Rocks
The absence of commercial petroleum and the lowpetroleum potential in the Proterozoic clastic rocks in theM.G. Eischeid #1 well does not preclude the possible pres-ence of commercial quantities of petroleum in other areas ofthe MRS. The advanced state of maturity observed in unit Cby Palacas and others (1990) is the result of high tempera-tures affecting the Proterozoic rocks in the Eischeid well,probably early in their history. The methane-filled fluidinclusions in tectonic veinlets described by Ludvigson andSpry (1990) indicate that late Keweenawan deformation wascoeval with petroleum migration in the Defiance Basin.Pollastro and Finn (1990) estimated minimum paleotemper-atures between 175 and 197 °C for this thermal event, con-siderably higher than the present estimated bottom-holetemperature of 105 °C (Barker, 1990). It seems unlikelythat this thermal regime was the product of deeper burialalone. The heat source was probably elevated heat flowfrom the igneous activity along the trend of the Midconti-nent Rift, and possibly by hydrothermal activity associated
I36 Strategic and Critical Minerals, Midcontinent Region, U.S.
with later stages of this activity. The elevated heat flow andgeothermal activity were most pronounced nearest the axisof the rift.
At more distal areas the maximum temperatures wouldprobably have been lower. Interpretations of seismic dataacquired over the Defiance Basin by Anderson (1992) sug-gest that reflectors assigned to unit C lithologies continuefor at least 7 mi and possibly as far as 15 mi from the IowaHorst (originally the central graben). If unit C also con-tained significant amounts of organic carbon away from thecentral graben, these organic-rich strata may not have beenexposed to the high paleotemperatures affecting rockscloser to the axis of the rift. Consequently, these rocksmight not have released their petroleum as early as rockscloser to the center of the MRS, and petroleum may stillremain, trapped in stratigraphic and (or) structural traps.Citing fluid inclusion and isotopic evidence, Ludvigson andSpry (1990) suggested that during uplift of the axial horst,fluid transport in the Keweenawan sedimentary basins wasaway from the rift axis. The petroleum migrated up dip,generally away from the axis of the rift, suggesting that thebest potential exploration targets may exist on the outerflanks of the MRS (Ludvigson and Spry, 1990).
It appears that some intervals of the lower Red clasticssequence in the M.G. Eischeid #1 well, especially unit C,once contained high levels of organic carbon and may haveproduced large volumes of petroleum. However, hydrocar-bon generation probably reached its peak relatively early inthe rock’s history, about 800 Ma (Palacas and others, 1990).Black intergranular residue reported on the Eischeid mudlog may identify paths of petroleum migration through sur-rounding rocks, but no areas of past petroleum accumula-tions were identified. The organic-rich rocks in the Eischeidwell have realized most of their petroleum potential and arepresently overmature, retaining no potential for producingcommercial petroleum. Porosity is also very low in the Prot-erozoic clastic rocks in the Eischeid well. Much of the orig-inal pore space may have been destroyed by compaction andthe precipitation of intergranular cements.
CONCLUSIONS
This study of the clastic rocks associated with the Mid-continent Rift System in Iowa has yielded significant infor-mation that is useful in understanding these rocks, theirrelationships to the units in their Lake Superior exposurearea, and their mineral potential. Significantly, petrographiccharacteristics have been identified that can be used todescriminate Midcontinent Rift clastics rocks and lithologi-cally similar basal Paleozoic strata. Some of the major con-clusions of this investigation are as follows:
• Cutting samples and cores from the Amoco M.G. Eisc-heid #1 deep oil test were studied. The well penetrated15,049 ft of MRS clastic rocks that were assigned totwo sequences, the upper Red clastics sequence and the
lower Red clastics sequence. The upper sequence wassubdivided into four units; the lower sequence wasdivided into three units. The lower Red clasticssequence is similar in many ways to the Oronto Groupof the Lake Superior area, but a direct correlation is notpossible. The upper Red clastics sequence bears manysimilarities to the Bayfield Group of Wisconsin but alsocannot be directly correlated.
Unit C in the lower Red clastics sequence con-tained abundant dark-gray and black shale and siltstonebeds and is tentatively correlated with the NonesuchFormation of the Oronto Group of Wisconsin andMichigan. They are presently relatively low in TOC(averaging about 0.6 percent) and are overmature withrespect to their source-rock potential. They presentlydo not constitute a potential source of economic quanti-ties of petroleum, but probably produced large amountsof petroleum early in their geologic history. Presenceof black intergranular residues in a number of samplesstrongly suggests the migration of liquid petroleum atsome time in the geologic past.
Reflectors interpreted as the result of strata simi-lar to unit C have been identified in deep seismic data insouthwestern Iowa. These reflectors indicate that theunit may extend for 15 mi or more away from the IowaHorst. This interpretation was strengthened by the dis-covery of unit C rocks on the central peak of the Man-son Impact Structure. In the more distal areas, theeffects of the elevated heat flow and possible hydrother-mal effects associated with the axial regions of the riftmay be less pronounced and the organics in the unitmay not have reached thermal maturity as early in theirhistories. Consequently, the possibility of encounteringeconomic concentrations of petroleum, derived fromMRS clastics rocks, may be greater in these distalareas.
• Red clastic rocks are preserved in a series of basins atthe Precambrian surface of Iowa. Five large half-gra-ben basins flank and deepen towards the Iowa Horst ofthe MRS. These basins—two west of the horst andthree to the east—preserve an estimated volume of35,400 mi3 of upper and lower Red clastic strata. Redclastics are also preserved in several areas on the IowaHorst. These include three basins and onedown-dropped block that preserve an additional 4,400mi3 of Red clastics.
• A reinvestigation of core and chip samples of MRS Redclastic rocks in Iowa did not yield any evidence of eco-nomic mineralization. Copper or chalcopyrite reportedfrom the Eischeid well was not confirmed by our inves-tigation. The lack of mineral occurrences in these rocksdoes not preclude the possibility of its presence in Redclastics in other parts of Iowa, since the availablesample set is extremely limited.
Clastic Rocks, Midcontinent Rift System, Iowa I37
• Well samples previously interpretated as evidence ofdeep basal Cambrian basins overlying the Red clasticsbasins that flank the Iowa Horst were re-examined withpetrographic and SEM techniques. Cambrian fossilspreviously thought to be in place deep in the basal clas-tic sequence in two wells were proven to be contamina-tion by caving of stratigraphically higher units duringthe drilling. Chip samples of the clastics from thesedeeper intervals were shown to be petrographicallysimilar to Red clastics, not basal Cambrian units. Noevidence of the deep Cambrian basins was found.
• Following restudy of samples from a number of wellsin Iowa and Illinois, a series of lithostratigraphic corre-lation characteristics were identified that will proveuseful in determining the contact between the basalCambrian sandstone and the underlying Red clastics inthe region. These distinguishing characteristics weredescribed earlier. One of the most useful characteris-tics is the very mature mineralogy of the frameworkgrains in the Mount Simon Sandstone, which is com-posed of quartz arenites (>90 percent quartz) in almostall intervals, and the very limited number of lithic frag-ments encountered, especially volcanic and metamor-phic grains. The Red clastics framework grains alwaysdisplay a higher feldspar content, and lithic rock frag-ments are a common component of the framework.
ACKNOWLEDGMENTS
The authors wish to acknowledge the persistantencouragement and logistical assistance provided by WarrenDay and the extremely helpful reviews by P.K. Sims, both ofthe U.S. Geological Survey. Additionally, the authorswould like to acknowledge the funding assistance providedby the U.S. Geological Survey Midcontinent Strategic andCritical Minerals Program.
REFERENCES CITED
Anderson, R.R., 1981, Bouguer gravity anomaly map of Iowa: IowaGeological Survey Miscellaneous Map Series 7, scale1:100,000.
———1988, Precambrian geology of Iowa and adjacent areas:Iowa Department of Natural Resources Geological SurveyBureau Open File Map 88–3, scale 1:100,000.
———1990a, The Amoco M.G. Eischeid #1 deep petroleum test,Carroll County, Iowa—Report of preliminary investigations:Iowa Department of Natural Resources, Geological SurveyBureau Special Report Series #2, 185 p.
———1990b, Review of the Precambrian geologic history of thecentral United States and the Midcontinent Rift System, inAnderson, R.R. ed., The Amoco M.G. Eischeid #1 deeppetroleum test, Carroll County, Iowa—Report of preliminaryinvestigations: Iowa Department of Natural Resources, Geo-logical Survey Bureau Special Report Series #2, p. 1–26.
———1990c, Interpretation of geophysical data over the Midcon-tinent Rift System in the area of the M.G. Eischeid #1 oil test,Carroll County, Iowa, in Anderson, R.R. ed., The AmocoM.G. Eischeid #1 deep petroleum test, Carroll County,Iowa—Report of preliminary investigations: Iowa Depart-ment of Natural Resources, Geological Survey Bureau Spe-cial Report Series #2, p. 27–38.
———1992, The Midcontinent Rift System of Iowa: Iowa City,University of Iowa, Ph.D. dissertation, 324 p.
———1995, Keweenawan Supergroup clastic rocks of the Mid-continent Rift System in Iowa, in Ojakangas, R.W., Dickas,A.B., and Green, J.C., eds., Basement tectonics 10; Proceed-ings of the Tenth International Conference on Basement Tec-tonics, held in Duluth, Minnesota, U.S.A., August, 1992:Dordrecht, The Netherlands, Kluwer Academic Publishers,p. 55–59.
———1997, Keweenawan Supergroup clastic rocks in the Mid-continent Rift of Iowa, in Ojakangas, R.W., Dickas, A.B.,and Green, J.C., eds., Middle Proterozoic to Cambrian Rift-ing, central North America: Geological Society of AmericaSpecial Paper 312, p. 211–230.
Barghorn, E.S., Meinschein, W.G., and Schopf, J.W.,1965, Paleo-biology of Precambrian shale: Science, v. 148, p. 461–472.
Barker, C.E., 1990, Reconnaissance fluid inclusion study, AmocoEischeid #1 well, Defiance Basin, Midcontinent Rift System,Iowa, in Anderson, R.R., ed., The Amoco M.G. Eischeid #1deep petroleum test, Carroll County, Iowa—Report of pre-liminary investigations: Iowa Department of NaturalResources, Geological Survey Bureau Special Report Series#2, p. 169–174.
Barnes, D.A., 1990, Sandstone petrology from conventional core inthe M.G. Eischeid #1 well, Carroll County, Iowa, in Ander-son, R.R., ed., The Amoco M.G. Eischeid #1 deep petroleumtest, Carroll County, Iowa—Report of preliminary investiga-tions: Iowa Department of Natural Resources, GeologicalSurvey Bureau Special Report Series #2, p. 113–118.
Bunker, B.B., Witzke, B.J., Watney, W.L., and Ludvigson, G.A.,1988, Phanerozoic history of the central midcontinent, Unit-ed States, in Sloss, L.L., ed., Geology of North America:Geological Society of America, v. DD–2, p. 243–260.
Bunker, B.J., 1981, Phanerozoic structural development in the areaof the Forest City Basin, southwestern Iowa (a brief over-view): Iowa Geological Survey Miscellaneous PublicationMP–27, 20 p.
———1982, Phanerozoic structural development in the area of theForest City Basin, southwestern Iowa (a brief overview), inVan Eck, O.J, ed. Regional tectonics and seismicity of south-western Iowa: Annual report, August 1980–July 1981,NUREG/CR–2548, Nuclear Regulatory Commission,Appendix IV, p. 42 –58.
Burnie, S.W., Schwarcz, H.P., and Crocket, J.H., 1972, A sulphurisotope study of the White Pine Mine, Michigan [abs.]:Geological Society of America Abstracts with Program, v. 4,no. 7, p. 462.
Buschbach, T.C., 1964, Cambrian and Ordovician strata of north-eastern Illinois: Illinois State Geological Survey Report ofInvestigations 218, 90 p.
———1975, Cambrian System, in Willman, H.B., Atherton, E.,Bushbach, T.C., Collinson, C., Frey, J.C., Hopkins, M.E.,Lineback, J.A., and Simon, J.A., Handbook of Illinois
I38 Strategic and Critical Minerals, Midcontinent Region, U.S.
stratigraphy: Illinois State Geological Survey Bulletin 95, p.34–46.
Cannon, W.F., Green, A.G., Hutchinson, D.R., Lee, M., Behrendt,J.C., Halls, H.C., Green, J.C., Dickas, A.B., Morey, G.B.,Sutcliffe, R., and Spencer, C., 1989, The North AmericanMidcontinent Rift beneath Lake Superior from GLIMPCEseismic reflection profiling: Tectonics, v. 8, no. 2, p.305–332.
Carlson, M.P., McKay, R.M., and Palmer A.R., 1990, Faunal zonesand transgression within the Sauk Sequence (Upper Cam-brian–Lower Ordovician), Nebraska-Iowa region [abs.]:Geological Society of America Abstracts with Programs, v.22, no. 7, p. A320.
Carmichael, R.S., and Black, R.A., 1986, Analysis and use ofMAGSAT satellite magnetic data for interpretation of crustalstructure and character in the U.S. Midcontinent: Physics ofthe Earth and Planetary Interiors, v. 44, no. 4, p. 333–347.
Chandler, V.W., McSwiggen, P.L., Morey, G.B., Hinze, W. J., andAnderson, R.R., 1989, Interpretation of seismic reflection,gravity, and magnetic data across the Middle ProterozoicMid-Continent Rift System, northwestern Wisconsin, east-ern Minnesota and central Iowa: American Association ofPetroleum Geologists Bulletin, v. 73, p. 261–275.
Conselman, M., Gardner, D., Carmody, R.A., 1940’s, Well log ofthe #1 Wilson (Clarinda Well): Iowa Geological Surveyunpublished well log.
Dickas, A.B., 1987, The potential for oil and/or gas within the Mid-continent Rift System, in 19th Geology Field ConferenceGuidebook: River Falls (Wisconsin) Geological Society, p.31–37.
Elmore, R.D., 1981, The Copper Harbor Conglomerate and None-such Shale: Sedimentation in a Precambrian intercratonicrift, upper Michigan: Ann Arbor, University of Michigan,Ph.D. dissertation, 200 p.
Folger, A., McQueen, H.S., Edson, F., and Price, G., 1931, Corre-lation of the Clarinda, Iowa well: Iowa Geological Surveyunpublished well file records, 1 p.
Green, J.C., 1982, Geology of Keweenawan extrusive rocks, inWold, R.J., and Hinze, W.J., eds., Geology and tectonics ofthe Lake Superior Basin: Geological Society of AmericaMemoir 156, p. 47–56.
Hall, C.W., Meinzer, O.E., and Fuller, M.L., 1911, Geology andunderground waters of southern Minnesota: U.S. GeologicalSurvey Water Supply Paper 256, 376 p.
Henderson, J.R., and Vargo, J.L., 1965, Aeromagnetic map of cen-tral Iowa: U.S. Geological Survey Geophysical Investiga-tions Map GP–476.
Hershey, H.G., Brown, C.N., van Eck, O.J, and Northup, R.C.,1960, Highway construction materials from the consolidatedrocks of southwestern Iowa: Iowa Highway Research BoardBulletin 15, 151 p.
Hieshima, G.B., and Pratt, L.M., 1991, Sulfur/carbon ratios andextractable organic matter of the Middle Proterozoic None-such Formation, North American Midcontinent rift: Precam-brian Geology, v. 54, p. 65–79.
Heishima, G.B., Zoback, D.A., and Pratt, L.M., 1989, Petroleumpotential of Precambrian Nonesuch Formation, Mid-Conti-nent Rift System in western Lake Superior: American Asso-ciation of Petroleum Geologists Bulletin, v. 73, no. 3, p. 363.
Jirsa, M.A., 1984, Interflow sedimentary rocks in the KeweenawanNorth Shore Volcanic Group, northeastern Minnesota: Min-nesota Geological Survey Report of Investigations 30, 20 p.
Kelly, W.C., and Nishioka, G.K., 1985, Precambrian oil inclusionsin late veins and rht role of hydrocarbons in copper mineral-ization at White Pine, Michigan: Geology, v. 13, p. 334–337.
King, P.B., 1978, Precambrian geology of the United States—Anexplanatory text to accompany the geologic map of the Unit-ed States: U.S. Geological Survey Professional Paper 902,85 p.
King, P.B., and Zietz, Isidore, 1971, Aeromagnetic study of theMidcontinent Gravity High of central United States: Geolog-ical Society of America Bulletin, v. 82, p. 2187–2208.
Kurtz, V.E., Thacker, J.L., Anderson, K.H., and Gerdemann, P.E.,1975, Traverse in Late Cambrian strata from the Ste. Fran-cois Mountains, Missouri to Delaware County, Oklahoma:Missouri Department of Natural Resources, Geological Sur-vey Report of Investigations, no. 55, 118 p.
Lees, J.H., 1935, Additional deep wells: Iowa Geological SurveyAnnual Report, v. 36, p. 365–420.
Ludvigson, G.A., McKay, R.M., and Anderson, R.R., 1990, Petrol-ogy of Keweenawan sedimentary rocks in the M.G. Eischeid#1 Drillhole, in Anderson, R.R., ed., The Amoco M.G. Eisc-heid #1 deep petroleum test, Carroll County, Iowa—Reportof preliminary investigations: Iowa Department of NaturalResources, Geological Survey Bureau, Special Report Series#2, p. 77–112.
Ludvigson, G.A., and Spry, P.G., 1990, Tectonic and hydrologicsignificance of carbonate veinlets in the Keweenawan sedi-mentary rocks of the Amoco M.G. Eischeid #1 drillhole, inAnderson, R.R., ed., The Amoco M.G. Eischeid #1 deeppetroleum test, Carroll County, Iowa—Report of preliminaryinvestigations: Iowa Department of Natural Resources, Geo-logical Survey Bureau Special Report Series #2, p. 153–168.
McKay, R.M., 1990, Regional aspects of the Mount Simon Forma-tion and the placement of the Mount Simon–pre-MountSimon sedimentary contact in the Amoco M.G. Eischeid #1drillhole, in Anderson, R.R., ed., The Amoco M.G. Eischeid#1 deep petroleum test, Carroll County, Iowa—Report ofpreliminary investigations: Iowa Department of NaturalResources, Geological Survey Bureau Special Report Series#2, p. 59–66.
McKerrow, W.S., 1978, Classification of organisms, in McKerrow,W.S., ed., The ecology of fossils: Cambridge, MassachusettsInstitute of Technology Press, p. 30–48.
McQueen, H.S., and Greene, F.C., 1938, The geology of northwestMissouri: Missouri Division of Geological Survey andWater Resources Report, Second Series, v. 25, 110 p.
Milavec, G.J., 1986, The Nonesuch Formation—Precambrian sed-imentation in an intracratonic rift: Norman, University ofOklahoma, M.S. thesis, 142 p.
Mooney, H.M., Craddock, C., Farnham, P.R., Johnson, S.H., andVolz, G., 1970, Refraction seismic investigations of thenorthern midcontinent gravity high: Journal of GeophysicalResearch, v. 75, p. 5056–5086.
Moore, L.R., Moore, J.R., and Spinner, E., 1969, A geo-microbio-logical study of the Precambrian Nonesuch Shale: Proceed-ings of Yorkshire Geological Society, v. 37, p. 1174–1185.
Morey, G.B., and Ojakangas, R.W., 1982, Keweenawan sedimen-tary rocks of eastern Minnesota and northwestern Wisconsin,
Clastic Rocks, Midcontinent Rift System, Iowa I39
in Wold, R.J., and Hinze, W.J., ed., Geology and tectonics ofthe Lake Superior Basin: Geological Society of AmericaMemoir 156, p. 135–146.
Norton, W.H., 1928, Deep wells of Iowa (a supplementary report):Iowa Geological Survey Annual Report XXXIII, p. 9–447.
Norton, W.H., and others, 1912, Underground water resources ofIowa: Iowa Geological Survey Annual Report XXI, p.29–1181.
Ojakangas, R.W., 1986, Reservoir characteristics of theKeweenawan Supergroup, Lake Superior region, in Mudrey,M.G., Jr., ed., Precambrian petroleum potential, Wisconsinand Michigan: Geoscience Wisconsin, v. 11, p. 25–31.
Ojakangas, R.W., and Morey, G.B., 1982a, Proterozoic sedimenta-ry rocks, in Wold, R.J., and Hinze, W.J., eds., Geology andtectonics of the Lake Superior Basin: Geological Society ofAmerica Memoir 156, p. 83.
———1982b, Keweenawan pre-volcanic quartz sandstones andrelated rocks of the Lake Superior region, in Wold, R.J., andHinze, W.J., eds., Geology and tectonics of the Lake Superi-or Basin: Geological Society of America Memoir 156, p.85–96.
Osweiler, D.J., 1982, A geological interpretation of the StratfordGeophysical Anomaly on the Midcontinent paleorift zone,central Iowa: Iowa City, University of Iowa, M.S. thesis, 166p.
Palacas, J.G., Schmoker, J.W., Davis, T. A., Pawlewicz, M.J., andAnderson, R.R. 1990, Petroleum source-rock assessment ofMiddle Proterozoic (Keweenawan) sedimentary rocks, Eisc-heid #1 well, Carroll County, Iowa, in Anderson, R.R., ed.,The Amoco M.G. Eischeid #1 deep petroleum test, CarrollCounty, Iowa—Report of preliminary investigations: IowaDepartment of Natural Resources, Geological Survey BureauSpecial Report Series #2, p. 119–134.
Pollastro, R.M., and Finn, T.M., 1990, Clay mineralogy and bulkrock composition of selected chip samples from the AmocoEischeid #1 well, Carroll County, Iowa—A reconnaissancestudy from X-ray powder diffraction analysis, in Anderson,R.R., ed., The Amoco M.G. Eischeid #1 deep petroleum test,Carroll County, Iowa—Report of preliminary investigations:Iowa Department of Natural Resources, Geological SurveyBureau Special Report Series #2, p. 143–152.
Sardeson, F.W., 1892, Fossils in the St. Peter sandstone: MinnesotaAcademy of Natural Science Bulletin, v. 3, p. 319–326.
———1896, The St. Peter sandstone: Minnesota Academy of Nat-ural Science Bulletin, v. 4, no. 1, pt. 1, p. 64–87, p. 326–343.
Schmoker, J.W., and Palacas, J.G., 1990, Porosity of Precambriansandstones in lower portion of the Eischied #1 well, CarrollCounty, Iowa, in Anderson, R.R., ed., The Amoco M.G. Eis-cheid #1 deep petroleum test, Carroll County, Iowa—Reportof preliminary investigations: Iowa Department of NaturalResources, Geological Survey Bureau Special Report Series#2, p. 135–142.
Sims, P.K., 1990, Precambrian basement map of the northern mid-continent, U.S.A.: U.S. Geological Survey MiscellaneousInvestigations Series Map I–1853–A, scale 1:1,000,000 andaccompanying text, 10 p.
Sloan, R.E., Rice, W.F., Hedblom, E., and Mazzullo, J.M., 1987,The Middle Ordovician of the Twin Cities area, in Balaban,N.H., ed., Field trip guidebook for the Upper MississippiValley, Minnesota, Iowa, and Wisconsin: Minnesota Geo-logical Survey Guidebook Series Number 15, p. 53–69.
Taft, J.A., 1902, Atoka Foleo, Indian Territory: U.S. GeologicalSurvey, Geological Atlas of the United States, Folio 79, 14 p.
Thiel, G.A., 1944, The geology and underground waters of southernMinnesota: Minnesota Geological Survey Bulletin 31, 506 p.
Van Schmus, W.R., and Hinze, W.J., 1985, The Midcontinent RiftSystem: Annual Review of Earth and Planetary Sciences, v.13, p. 345–383.
Van Schmus, W.R., Wallin, E.T., and Shearer, C.T., 1990, Agerelationships for gabbro from the Amoco M.G. Eischeid #1well, in Anderson, R.R., ed., The Amoco M.G. Eischeid #1deep petroleum test, Carroll County, Iowa—Report of pre-liminary investigations: Iowa Department of NaturalResources, Geological Survey Bureau Special Report Series#2, p. 67–76.
Walcott, C.D., 1914, Cambrian geology and paleontology: Smith-sonian Miscellaneous Collection, v. 57, p. 345–412.
Witzke, B.J., 1990, General stratigraphy of the Phanerozoic andKeweenawan sequences, M.G. Eischeid #1 drillhole, CarrollCounty, Iowa, in Anderson, R.R., ed., The Amoco M.G. Eis-cheid #1 deep petroleum test, Carroll County, Iowa—Reportof preliminary investigations: Iowa Department of NaturalResources, Geological Survey Bureau Special Report Series#2, p. 39–58.
Yoho, W.H., Hamilton, T., Conselman, M., 1959, Well log of the#1 Wilson (Clarinda Well): Iowa Geological Survey unpub-lished well log.
Zietz, Isidore, Gilbert, F.P., and Keys, J.R., 1976, Aeromagneticmap of Iowa—Color coded intensities: U.S. GeologicalSurvey Geophysical Investigations Map GP–911.
I40 Strategic and Critical Minerals, Midcontinent Region, U.S.

Clastic Rocks, Midcontinent Rift System, Iowa I41
APPENDIXES
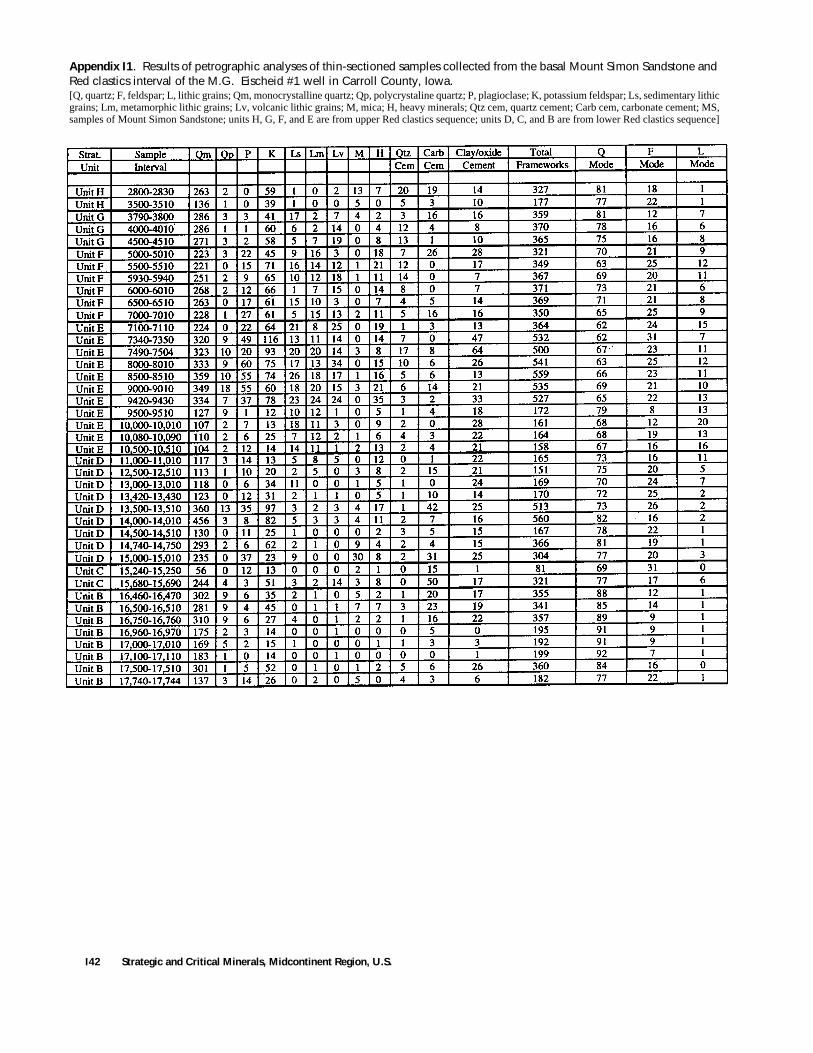
I42 Strategic and Critical Minerals, Midcontinent Region, U.S.
Appendix I1. Results of petrographic analyses of thin-sectioned samples collected from the basal Mount Simon Sandstone and Red clastics interval of the M.G. Eischeid #1 well in Carroll County, Iowa. [Q, quartz; F, feldspar; L, lithic grains; Qm, monocrystalline quartz; Qp, polycrystaline quartz; P, plagioclase; K, potassium feldspar; Ls, sedimentary lithicgrains; Lm, metamorphic lithic grains; Lv, volcanic lithic grains; M, mica; H, heavy minerals; Qtz cem, quartz cement; Carb cem, carbonate cement; MS,samples of Mount Simon Sandstone; units H, G, F, and E are from upper Red clastics sequence; units D, C, and B are from lower Red clastics sequence]
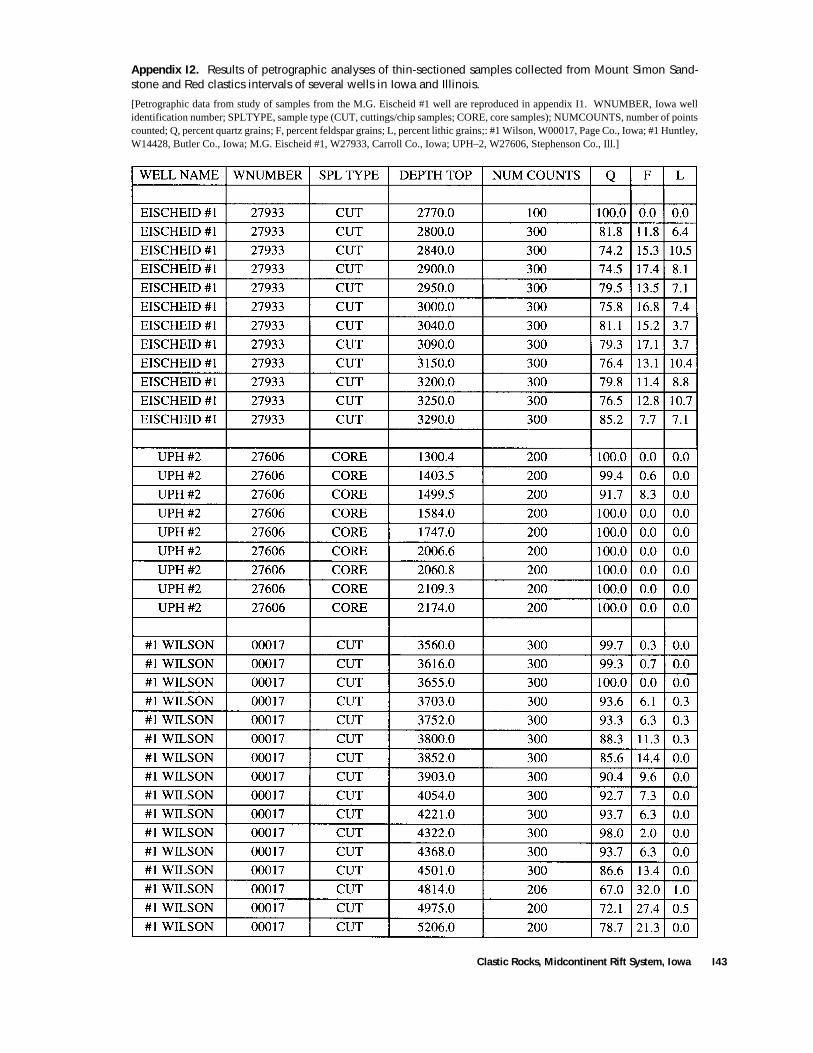
Clastic Rocks, Midcontinent Rift System, Iowa I43
Appendix I2. Results of petrographic analyses of thin-sectioned samples collected from Mount Simon Sand-stone and Red clastics intervals of several wells in Iowa and Illinois.
[Petrographic data from study of samples from the M.G. Eischeid #1 well are reproduced in appendix I1. WNUMBER, Iowa wellidentification number; SPLTYPE, sample type (CUT, cuttings/chip samples; CORE, core samples); NUMCOUNTS, number of pointscounted; Q, percent quartz grains; F, percent feldspar grains; L, percent lithic grains;: #1 Wilson, W00017, Page Co., Iowa; #1 Huntley,W14428, Butler Co., Iowa; M.G. Eischeid #1, W27933, Carroll Co., Iowa; UPH–2, W27606, Stephenson Co., Ill.]
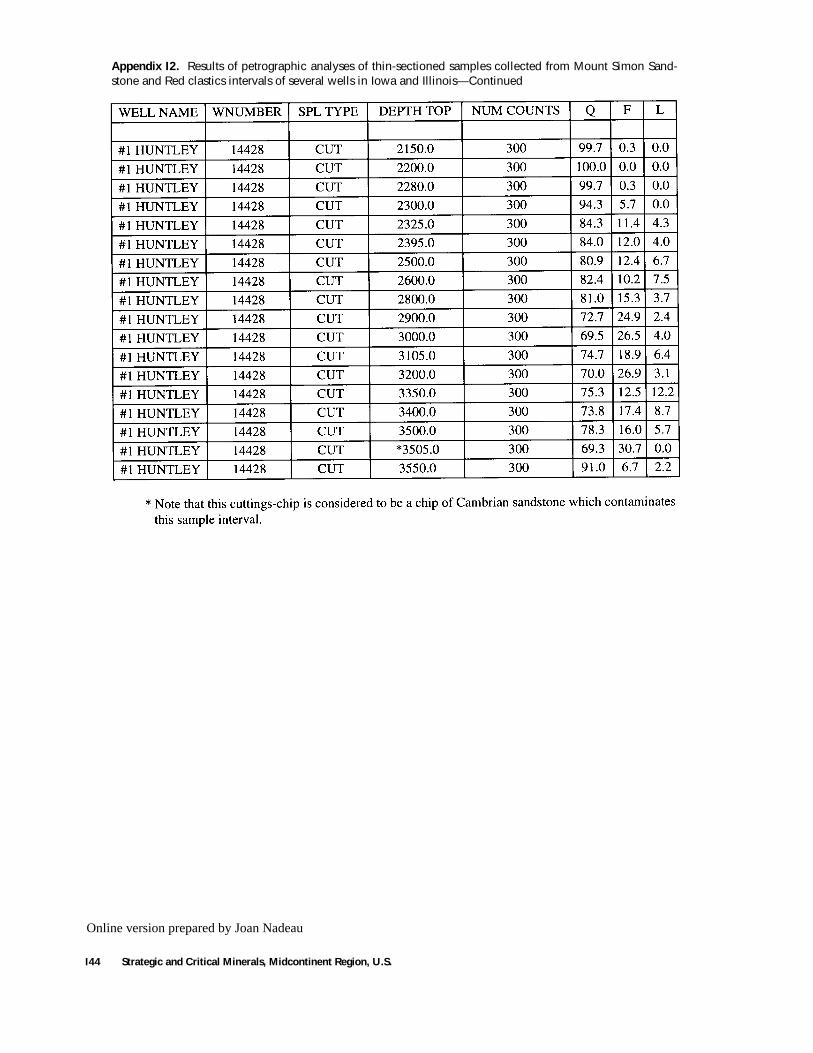
I44 Strategic and Critical Minerals, Midcontinent Region, U.S.
Appendix I2. Results of petrographic analyses of thin-sectioned samples collected from Mount Simon Sand-stone and Red clastics intervals of several wells in Iowa and Illinois—Continued
Online version prepared by Joan Nadeau
AVAILABILITY OF BOOKS AND MAPS OF THE U.S. GEOLOGICAL SURVEY
Instructions on ordering publications of the U.S. Geological Survey, along with prices of the last offerings, are given in the current-yearissues of the monthly catalog “New Publications of the U.S. Geological Survey.” Prices of available U.S. Geological Survey publications re-leased prior to the current year are listed in the most recent annual “Price and Availability List.” Publications that may be listed in various U.S.Geological Survey catalogs (
see back inside cover) but not listed in the most recent annual “Price and Availability List” may no longer beavailable.
Reports released through the NTIS may be obtained by writing to the National Technical Information Service, U.S. Department ofCommerce, Springfield, VA 22161; please include NTIS report number with inquiry.
Order U.S. Geological Survey publications by mail or over the counter from the offices listed below.
BY MAIL
Books
Professional Papers, Bulletins, Water-Supply Papers, Tech-niques of Water-Resources Investigations, Circulars, publications ofgeneral interest (such as leaflets, pamphlets, booklets), single copiesof Earthquakes & Volcanoes, Preliminary Determination of Epicen-ters, and some miscellaneous reports, including some of the forego-ing series that have gone out of print at the Superintendent ofDocuments, are obtainable by mail from
U.S. Geological Survey, Information ServicesBox 25286, Federal Center
Denver, CO 80225
Subscriptions to periodicals (Earthquakes & Volcanoes andPreliminary Determination of Epicenters) can be obtained ONLYfrom the
Superintendent of DocumentsGovernment Printing Office
Washington, DC 20402
(Check or money order must be payable to Superintendent ofDocuments.)
Maps
For maps, address mail orders to
U.S. Geological Survey, Information ServicesBox 25286, Federal Center
Denver, CO 80225
Residents of Alaska may order maps from
U.S. Geological Survey, Earth Science Information Center101 Twelfth Ave., Box 12
Fairbanks, AK 99701
OVER THE COUNTER
Books and Maps
Books and maps of the U.S. Geological Survey are availableover the counter at the following U.S. Geological Survey offices, allof which are authorized agents of the Superintendent of Documents.
•
ANCHORAGE, Alaska
–Rm. 101, 4230 University Dr.
•
LAKEWOOD, Colorado
–Federal Center, Bldg. 810
•
MENLO PARK, California
–Bldg. 3, Rm. 3128,345 Middlefield Rd.
•
RESTON, Virginia
–USGS National Center, Rm. 1C402, 12201 Sunrise Valley Dr.
•
SALT LAKE CITY, Utah
–Federal Bldg., Rm. 8105,125 South State St.
•
SPOKANE, Washington
–U.S. Post Office Bldg., Rm. 135,West 904 Riverside Ave.
•
WASHINGTON, D.C
.–Main Interior Bldg., Rm. 2650,18th and C Sts., NW.
Maps Only
Maps may be purchased over the counter at the followingU.S. Geological Survey offices:
•
FAIRBANKS, Alask
a–New Federal Bldg, 101 Twelfth Ave.
•
ROLLA, Missouri
–1400 Independence Rd.
•
STENNIS SPACE CENTER, Mississippi
–Bldg. 3101
SELECTED SERIES OF U.S. GEOLOGICAL SURVEY PUBLICATIONS
Periodicals
Earthquakes & Volcanoes
(issued bimonthly).
Preliminary Determination of Epicenters
(issued monthly).
Technical Books and Reports
Professional Papers
are mainly comprehensive scientific reportsof wide and lasting interest and importance to professional scientists andengineers. Included are reports on the results of resource studies and oftopographic, hydrologic, and geologic investigations. They also includecollections of related papers addressing different aspects of a single sci-entific topic.
Bulletins
contain significant data and interpretations that are oflasting scientific interest but are generally more limited in scope or geo-graphic coverage than Professional Papers. They include the results of re-source studies and of geologic and topographic investigations; as well ascollections of short papers related to a specific topic.
Water-Supply Paper
s are comprehensive reports that present sig-nificant interpretive results of hydrologic investigations of wide interestto professional geologists, hydrologists, and engineers. The series coversinvestigations in all phases of hydrology, including hydrology, availabil-ity of water, quality of water, and use of water.
Circulars
present administrative information or important scientif-ic information of wide popular interest in a format designed for distribu-tion at no cost to the public. Information is usually of short-term interest.
Water-Resources Investigations Reports
are papers of an inter-pretive nature made available to the public outside the formal USGS pub-lications series. Copies are reproduced on request unlike formal USGSpublications, and they are also available for public inspection at deposi-tories indicated in USGS catalogs.
Open-File Reports
include unpublished manuscript reports, maps,and other material that are made available for public consultation at de-positories. They are a nonpermanent form of publication that may be cit-ed in other publications as sources of information.
Maps
Geologic Quadrangle Maps
are multicolor geologic maps on to-pographic bases in 7 1/2- or 15-minute quadrangle formats (scales main-ly 1:24,000 or 1:62,500) showing bedrock, surficial, or engineeringgeology. Maps generally include brief texts; some maps include structureand columnar sections only.
Geophysical Investigations Maps
are on topographic or planimet-ric bases at various scales, they show results of surveys using geophysicaltechniques, such as gravity, magnetic, seismic, or radioactivity, which re-flect subsurface structures that are of economic or geologic significance.Many maps include correlations with the geology.
Miscellaneous Investigations Series Maps
are on planimetric ortopographic bases of regular and irregular areas at various scales; theypresent a wide variety of format and subject matter. The series also in-cludes 7 1/2-minute quadrangle photogeologic maps on planimetricbases which show geology as interpreted from aerial photographs. Theseries also includes maps of Mars and the Moon.
Coal Investigations Maps
are geologic maps on topographic orplanimetric bases at various scales showing bedrock or surficial geology,stratigraphy, and structural relations in certain coal-resource areas.
Oil and Gas Investigations Charts
show stratigraphic informa-tion for certain oil and gas fields and other areas having petroleum poten-tial.
Miscellaneous Field Studies Maps
are multicolor or black-and-white maps on topographic or planimetric bases on quadrangle or irreg-ular areas at various scales. Pre-1971 maps show bedrock geology in re-lation to specific mining or mineral-deposit problems; post-1971 mapsare primarily black-and-white maps on various subjects such as environ-mental studies or wilderness mineral investigations.
Hydrologic Investigations Atlases
are multicolored or black-and-white maps on topographic or planimetric bases presenting a wide rangeof geohydrologic data of both regular and irregular areas; the principalscale is 1:24,000, and regional studies are at 1:250,000 scale or smaller.
Catalogs
Permanent catalogs, as well as some others, giving comprehensivelistings of U.S. Geological Survey publications are available under theconditions indicated below from USGS Map Distribution, Box 25286,Building 810, Denver Federal Center, Denver, CO 80225. (See latestPrice and Availability List.)
“Publications of the Geological Survey, 1879-1961”
may be pur-chased by mail and over the counter in paperback book form and as a setmicrofiche.
“Publications of the Geological Survey, 1962-1970”
may be pur-chased by mail and over the counter in paperback book form and as a setof microfiche.
“Publications of the U.S. Geological Survey, 1971-1981”
may bepurchased by mail and over the counter in paperback book form (two vol-umes, publications listing and index) and as a set of microfiche.
Supplements
for 1982, 1983, 1984, 1985, 1986, and for subse-quent years since the last permanent catalog may be purchased by mailand over the counter in paperback book form.
State catalogs
, “List of U.S. Geological Survey Geologic and Wa-ter-Supply Reports and Maps For (State),” may be purchased by mail andover the counter in paperback booklet form only.
“Price and Availability List of U.S. Geological Survey Publica-tions,”
issued annually, is available free of charge in paperback bookletform only.
Selected copies of a monthly catalog
“New Publications of theU.S. Geological Survey” is available free of charge by mail or may be ob-tained over the counter in paperback booklet form only. Those wishing afree subscription to the monthly catalog “New Publications of the U.S.Geological Survey” should write to the U.S. Geological Survey, 582 Na-tional Center, Reston, VA 22092.
Note.
–Prices of Government publications listed in older catalogs,announcements, and publications may be incorrect. Therefore, the pricescharged may differ from the prices in catalogs, announcements, and pub-lications.