Embed Size (px)
Citation preview
Title: Can we identify older people most vulnerable to living in cold homes during winter?
Authors’ names and affiliations
Claudio Sartini1 *, Peter Tammes2, Alastair D Hay2, Ian Preston3, Daniel Lasserson4, Peter H
Whincup5, S Goya Wannamethee1, and Richard W Morris2
1 University College London, Department of Primary Care & Population Health, London, UK2 Centre for Academic Primary Care, School of Social and Community Medicine, University of
Bristol, Bristol, UK3 Centre for Sustainable Energy, Bristol, UK4 Nuffield Department of Medicine, University of Oxford, UK5 Population Health Research Institute, St George's University of London, UK
* Corresponding author
Email: [email protected]
1
2
3
4
5
7
8
9
10
11
12
14
15
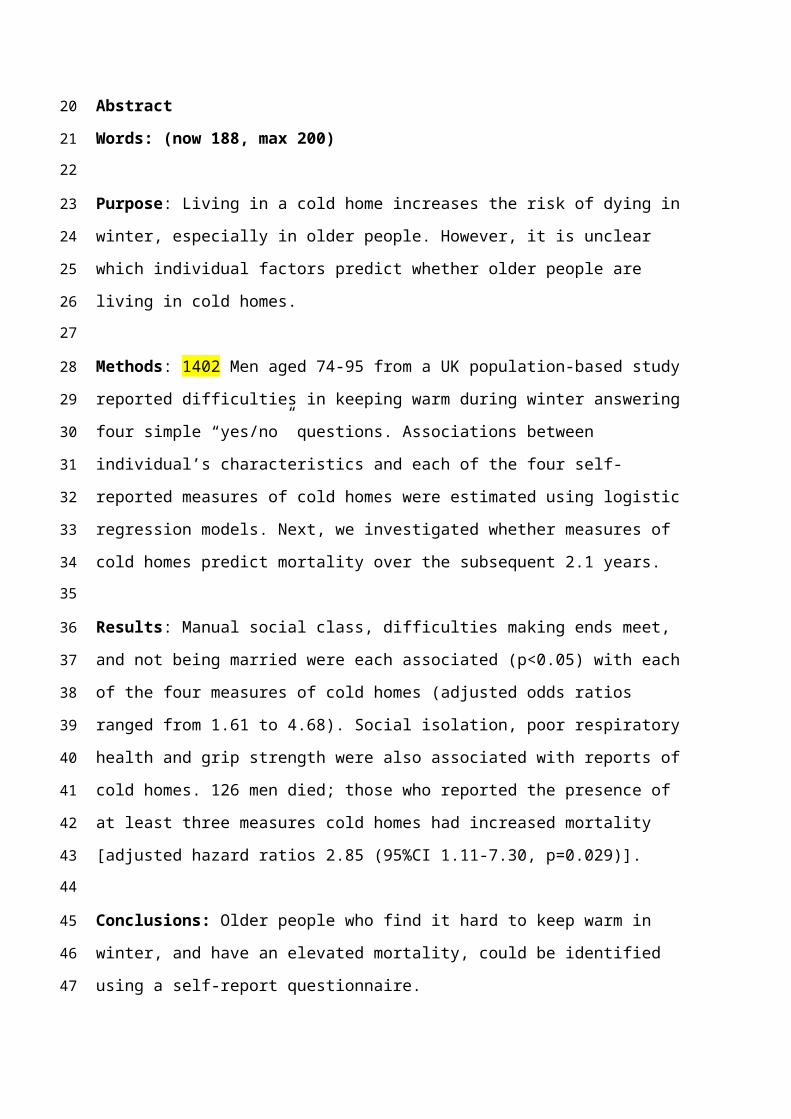
Abstract
Words: (now 188, max 200)
Purpose: Living in a cold home increases the risk of dying in winter, especially in older
people. However, it is unclear which individual factors predict whether older people are
living in cold homes.
Methods: 1402 Men aged 74-95 from a UK population-based study reported difficulties in
keeping warm during winter answering four simple “yes/no” questions. Associations
between individual’s characteristics and each of the four self-reported measures of cold
homes were estimated using logistic regression models. Next, we investigated whether
measures of cold homes predict mortality over the subsequent 2.1 years.
Results: Manual social class, difficulties making ends meet, and not being married were each
associated (p<0.05) with each of the four measures of cold homes (adjusted odds ratios
ranged from 1.61 to 4.68). Social isolation, poor respiratory health and grip strength were
also associated with reports of cold homes. 126 men died; those who reported the presence
of at least three measures cold homes had increased mortality [adjusted hazard ratios 2.85
(95%CI 1.11-7.30, p=0.029)].
Conclusions: Older people who find it hard to keep warm in winter, and have an elevated
mortality, could be identified using a self-report questionnaire.
Word count of manuscript text: 2442 words (+ 3 tables embedded in this file)
16
17
18
19
20
21
22
23
24
25
26
27
28
29
30
31
32
33
34
35
36
37
38
39
Background
Excess winter mortality in the United Kingdom (UK) has been partially attributed to cold
housing (1, 2), with an extra 5500 more deaths occurring annually in the coldest homes than
would occur if those homes were warm (3). Greater susceptibility of older people to cold
has been suggested (4) as they have worse cardiovascular and respiratory profiles at lower
indoor (5) and outdoor (6) temperatures. However, it is unclear how to identify older people
who particularly find it hard to keep warm in winter (7). Existing evidence including
qualitative (8-10) and quantitative (1, 9, 11, 12) study designs and different measures of cold
homes (e.g. self-reported (8, 9) and indoor temperature (5, 11)), do not identify factors
related to living in cold homes.
Using data from a UK population-based study of older men, we aim to highlight factors
independently associated with living in cold homes to identify vulnerable older people who
find it hard to keep warm (13). We investigate the associations between (i) socio-
demographic measures, (ii) health factors, (iii) behavioural factors, (iv) other personal
circumstances, and (v) house characteristics with four self-reported measures of cold homes
during winter. As it is unclear which measures of cold homes best predict those at risk of
death (11), we also investigated whether reports of cold homes in our study relate to
mortality.
Material and methods
Sample
The British Regional Heart Study (BRHS) is a prospective, population-based cohort study
following up 7735 men (99% Caucasian) recruited from primary care practices in 24 British
towns in 1978–80. In 2014, 2820 surviving men aged 74-96 years were invited to complete a
comprehensive health status and life style questionnaire including self-reported measures
of cold homes (14). 1655 men responded (99% between April and October) and 1402 had
complete data on all covariables of interest; also, depending on both covariables and
outcome of interest, the number of observations available for analyses varied from 1385 to
1402. The National Research Ethics Service (NRES) Committee London provided ethical
approval. Participants provided informed written consent to the investigation, in accordance
40
41
42
43
44
45
46
47
48
49
50
51
52
53
54
55
56
57
58
60
61
62
63
64
65
66
67
68
69
70
71
with the Declaration of Helsinki.
Self-reported measures of cold homes
Men were asked whether they were (i) having difficulties in meeting the heating/fuel costs;
(ii) staying in bed longer in order to stay warm during the previous winter; (iii) unable to
keep the living room comfortably warm during the cold winter weather, and (iv) turning the
heating off even when cold because of worries about the costs during the previous winter.
Having difficulties in meeting the heating/fuel costs was chosen as our main outcome, as an
overall proxy measure of cold housing.
Individual factors
The individual factors selected in this study were investigated as previous evidence from
qualitative (8-10) and quantitative (1, 9, 11, 12) studies suggested their potential association
with cold homes. For example, we hypothesized that an association of proxies of fuel
poverty (e.g. social class, making ends meet and marital status) with cold homes could be
found as these associations were more consistently reported in the literature (1). The
factors investigated in this study were categorised consistently with previous published
work from the BRHS (14-19), and represented five different domains: (i) socio-demographic
(age, social class, and region of residence), (ii) general health (number of chronic conditions,
respiratory health, mobility limitations outdoors, grip strength, depression, and feeling of
social isolation), (iii) behavioural factors (smoking and alcohol consumption), (iv) personal
circumstances (having increasing financial difficulties and house ownership), and (v) house
characteristics (types of home insulation, heating system). Also, a proxy measure of the
house energy efficiency (Energy Efficiency rating (20), aggregated from households within
participants’ Lower Super Output Area [LSOA]) was linked to each of the BRHS men. Energy
Efficiency (EE) rating was investigated using descriptive statistics only; as a graded trend in
association with the main outcome of interest was not found, this variable was considered
as unimportant and not included in final models.
Statistical analyses
We examined the distribution of all variables of interest according to self-reported
measures of cold homes. As the Energy Efficiency rating did not show a graded linear
72
73
74
75
76
77
78
79
80
81
82
83
84
85
86
87
88
89
90
91
92
93
94
95
96
97
98
99
100
101
102
103

relationship with self-reported difficulties in keeping warm, we preferred to include house
characteristics collected at individual level (e.g. types of home insulation and heating) in
further analysis.
Logistic regression models
Logistic regression was used to estimate the associations of individual factors with each of
the cold home measures, firstly unadjusted, then mutually adjusted. The mutually adjusted
models were performed to narrow down the list of factors which were independently
associated with each of the four self-reported measures of cold homes collected in this
study.
Subsidiary analyses
As older people are less active in winter (21), they are also likely to spend most time at
home during this period [7]; therefore, a subsidiary analysis was carried out to find out
which individual factors were associated with men both having difficulties in meeting the
heating/fuel costs and also being inactive or occasionally active. Physical activity levels were
derived from a self-reported questionnaire validated against objectively measured physical
activity in a previous study (15).
As it is unclear which measures of cold homes best predict those at risk of death (11), we
also investigated whether self-reported measures of cold homes, alone or in combination,
predicted mortality using Cox proportional hazard models; estimates (hazard ratios) were
adjusted for potential confounding factors such as age, social class, marital status, chronic
conditions, respiratory health, and region. We were interested in a specific combination of
measures of cold homes; the question about men having difficulties in meeting the
heating/fuel cost was always included in such combinations as it represented an overall
proxy measure of cold housing. This question was combined with the one about “inability of
keeping the living room warm”; the living room gets used the most by older people, and
therefore it was relevant to the objective. Additionally, we wanted to include the
information about the bedroom (“staying in bed longer in order to stay warm”) because it is
a further and distinct part of the house. We excluded the fourth measure of cold homes
104
105
106
107
108
109
110
111
112
113
114
115
116
117
118
119
120
121
122
123
124
125
126
127
128
129
130
131
132
133
134
135
from the combinations we tested (“Turning the heating off because of worries of the costs”)
because it was less informative than “having difficulties in meeting the heating/fuel costs”
and it did not give any specific information about the room where the heating was turned
on or off.
Results
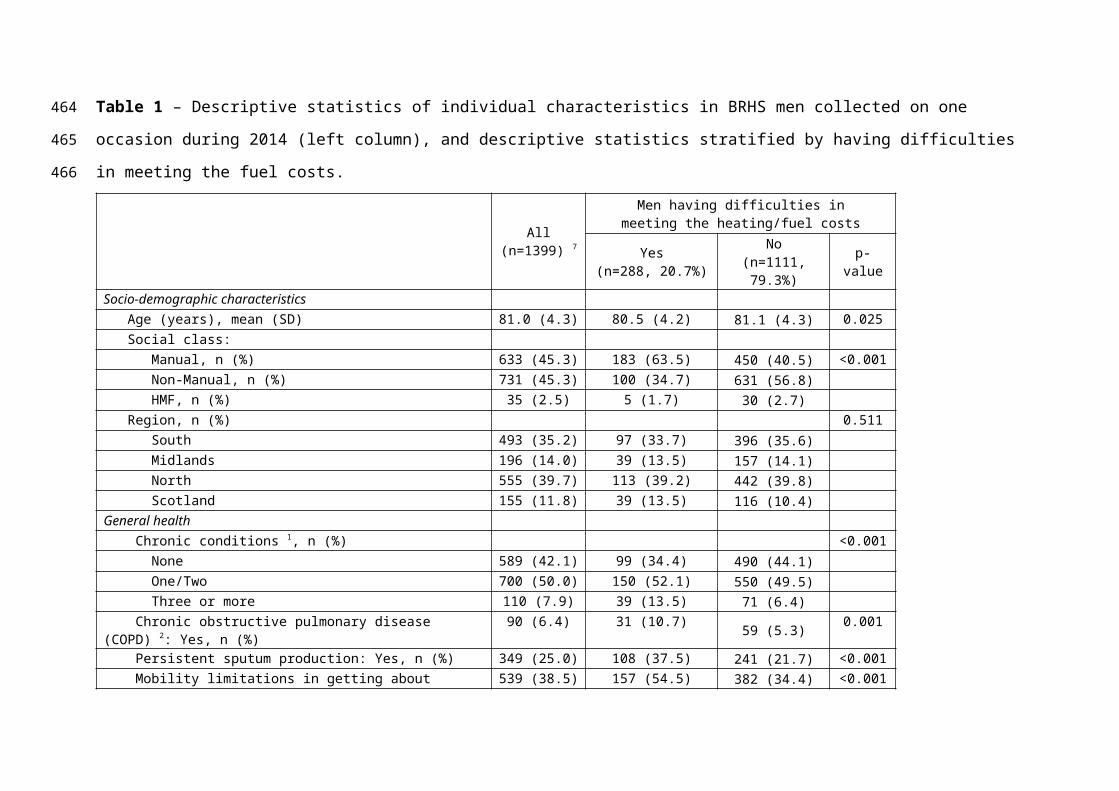
We found (i) 288 (20.7%) men had difficulties in meeting the heating/fuel costs; (ii) 173
(12.4%) stayed in bed longer in order to stay warm; (iii) 47 (3.3%) could not keep
comfortably warm in the living room, and (iv) 130 (9.4%) turned heating off because of
worries about the costs. Manual social class, increasing financial difficulties, poor health in
general, and being not married were more common in men who were having difficulties in
meeting the heating/fuel costs (Table 1). Similar findings were found for other self-reported
measures of cold homes (results not shown).
Logistic regression models
In unadjusted models (Table 2, left column), many individual factors were associated with
having difficulties in meeting the heating/fuel costs. However, in fully adjusted models
(Table 2, right column), fewer associations were found. Having increasing financial
difficulties showed the strongest association (OR= 4.68, 95%CI 3.74-5.87, p<0.001). Also,
men who were of manual social class, not married, feeling socially isolated, having three or
more chronic conditions, persistent sputum production, and who were younger were more
likely to have difficulties in meeting the heating/fuel costs (all p<0.05).
Overall, only three individual factors showed consistent associations with each of the four
outcomes of interest: manual social class, having increasing financial difficulties, and being
not married (see Table 2 and supplementary Table 2). Other less consistent associations
were found in fully adjusted models: poor respiratory health (persistent sputum
production), lower grip strength and social isolation were associated with at least two out of
four measures of cold homes. Increasing age and drinking alcohol daily (vs occasionally)
were also inversely associated with cold homes (Table 2 and supplementary Table 2). The
absence of cavity/solid wall insulation in the house increased the odds of living in cold
homes, (adjusted OR=1.87, 95%CI 0.98-3.55, p=0.057 for inability to keep the living room
136
137
138
139
140
141
142
143
144
145
146
147
148
149
150
151
152
153
154
155
156
157
158
159
160
161
162
163
164
165
166
167

comfortably warm, and OR=1.47, 95%CI 0.97-2.22, p=0.072 for turning the heating off when
cold because of worries about costs, see supplementary Table 2 – Part C). Overall, other
factors such as smoking, region of residence, and heating system were not consistently
associated with cold home reports.
Subsidiary analyses
129 (9.5%) men had both difficulties in meeting the heating/fuel costs and were inactive or
occasionally active. Three individual factors showed statistically significant associations with
this outcome: having mobility limitations (OR=3.60, 95%CI 2.15-6.04), persistent sputum
production (OR=2.07, 95%CI 1.31-3.27), and having increasing financial difficulties (OR=
3.77, 95%CI 2.78-5.11). No associations were found between other individual factors and
this outcome (results not shown).
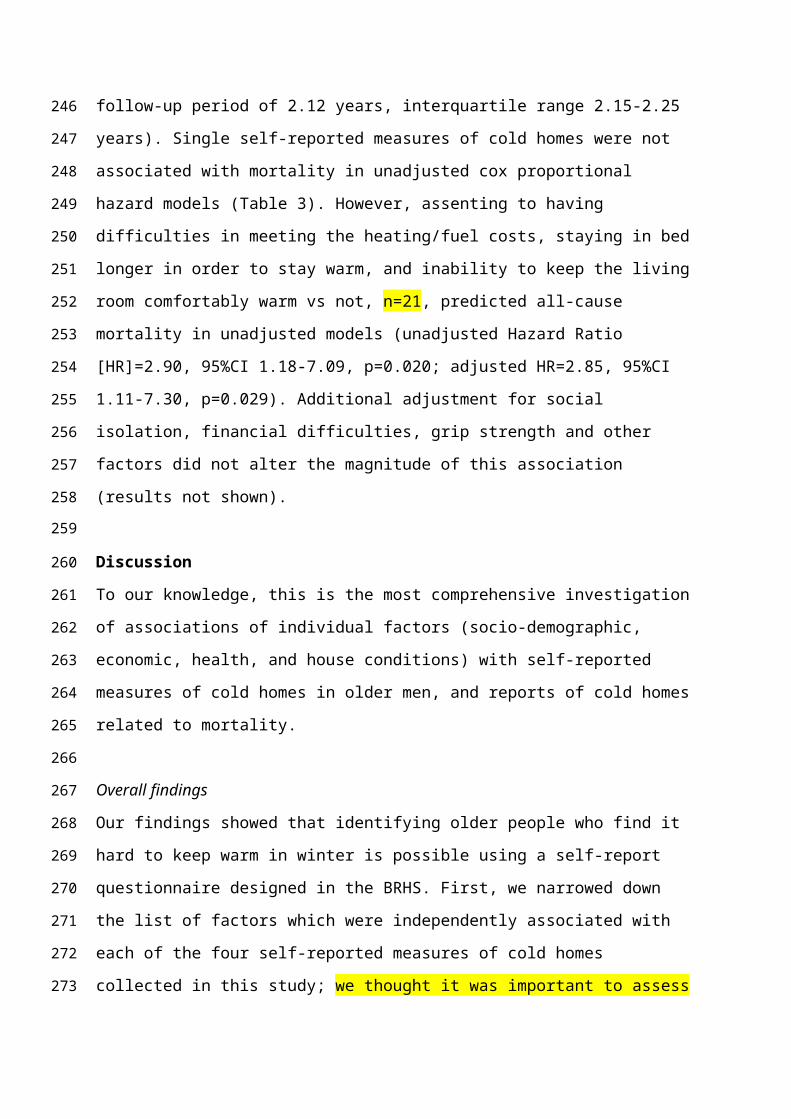
126 men died after completing the questionnaire (median follow-up period of 2.12 years,
interquartile range 2.15-2.25 years). Single self-reported measures of cold homes were not
associated with mortality in unadjusted cox proportional hazard models (Table 3). However,
assenting to having difficulties in meeting the heating/fuel costs, staying in bed longer in
order to stay warm, and inability to keep the living room comfortably warm vs not, n=21,
predicted all-cause mortality in unadjusted models (unadjusted Hazard Ratio [HR]=2.90,
95%CI 1.18-7.09, p=0.020; adjusted HR=2.85, 95%CI 1.11-7.30, p=0.029). Additional
adjustment for social isolation, financial difficulties, grip strength and other factors did not
alter the magnitude of this association (results not shown).
Discussion
To our knowledge, this is the most comprehensive investigation of associations of individual
factors (socio-demographic, economic, health, and house conditions) with self-reported
measures of cold homes in older men, and reports of cold homes related to mortality.
Overall findings
Our findings showed that identifying older people who find it hard to keep warm in winter is
possible using a self-report questionnaire designed in the BRHS. First, we narrowed down
the list of factors which were independently associated with each of the four self-reported
168
169
170
171
172
173
174
175
176
177
178
179
180
181
182
183
184
185
186
187
188
189
190
191
192
193
194
195
196
197
198
199

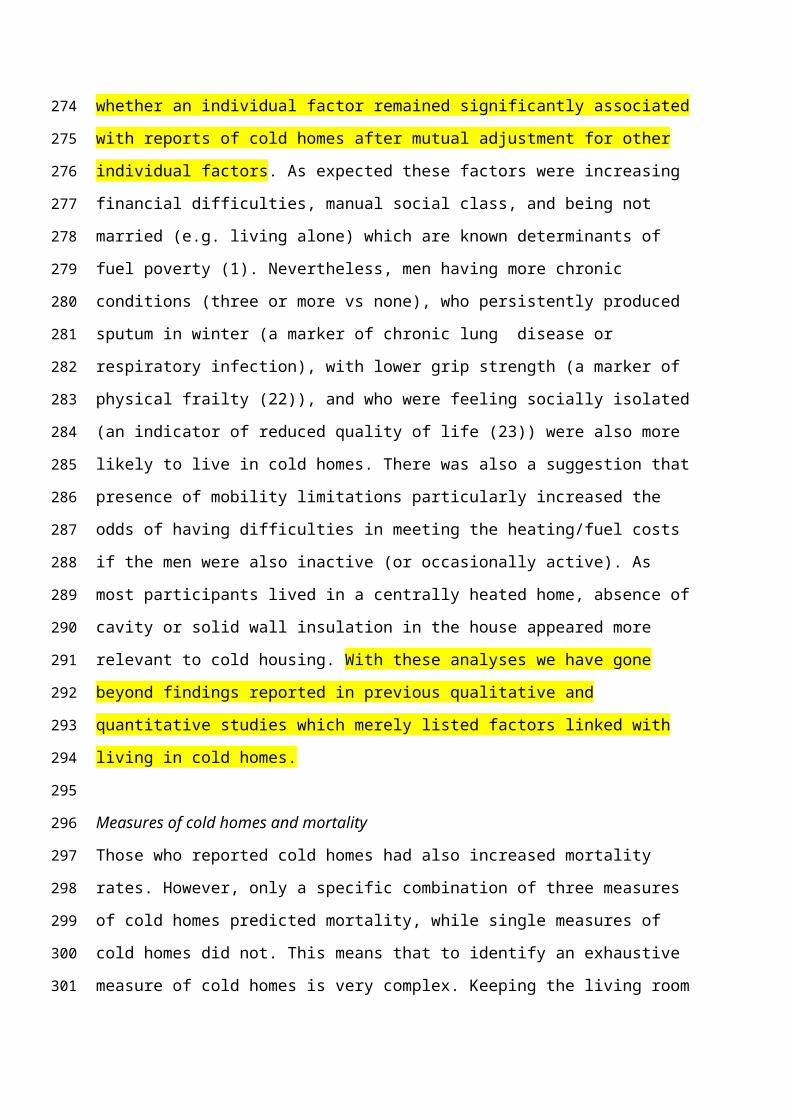
measures of cold homes collected in this study; we thought it was important to assess
whether an individual factor remained significantly associated with reports of cold homes
after mutual adjustment for other individual factors. As expected these factors were
increasing financial difficulties, manual social class, and being not married (e.g. living alone)
which are known determinants of fuel poverty (1). Nevertheless, men having more chronic
conditions (three or more vs none), who persistently produced sputum in winter (a marker
of chronic lung disease or respiratory infection), with lower grip strength (a marker of
physical frailty (22)), and who were feeling socially isolated (an indicator of reduced quality
of life (23)) were also more likely to live in cold homes. There was also a suggestion that
presence of mobility limitations particularly increased the odds of having difficulties in
meeting the heating/fuel costs if the men were also inactive (or occasionally active). As most
participants lived in a centrally heated home, absence of cavity or solid wall insulation in the
house appeared more relevant to cold housing. With these analyses we have gone beyond
findings reported in previous qualitative and quantitative studies which merely listed factors
linked with living in cold homes.
Measures of cold homes and mortality
Those who reported cold homes had also increased mortality rates. However, only a specific
combination of three measures of cold homes predicted mortality, while single measures of
cold homes did not. This means that to identify an exhaustive measure of cold homes is very
complex. Keeping the living room warm was more strongly related to mortality than other
single measures, possibly because the living room gets used the most by older people.
Comparison with previous studies
Consistent with our main findings, previous studies identified highest levels of fuel poverty
in households occupied by a single person over 60 years old (vs couples over 60) with low
income (12). The English Longitudinal Study of Ageing (ELSA) also found that age in older
adults was inversely associated with living in cold homes; the authors reported that ELSA
participants under 80 years who were living in cold homes had a worse cardiovascular risk
profile including higher blood pressure, and were less likely to have blood pressure checked
(5). Interestingly, we also found that men who were drinking alcohol daily (vs occasionally)
were less likely to stay in bed longer in order to stay warm, and less likely to turn the
200
201
202
203
204
205
206
207
208
209
210
211
212
213
214
215
216
217
218
219
220
221
222
223
224
225
226
227
228
229
230
231
heating off because of worries of the costs. To our knowledge these findings were not
previously reported and may indicate reduced sensitivity of alcohol consumers to cold (24)
or an indicator of greater financial resources. It is also plausible that daily drinkers spent
more time outside and thus required less home heating.
Strengths and limitations
Previous investigations of cold homes have been at household levels (12), while the current
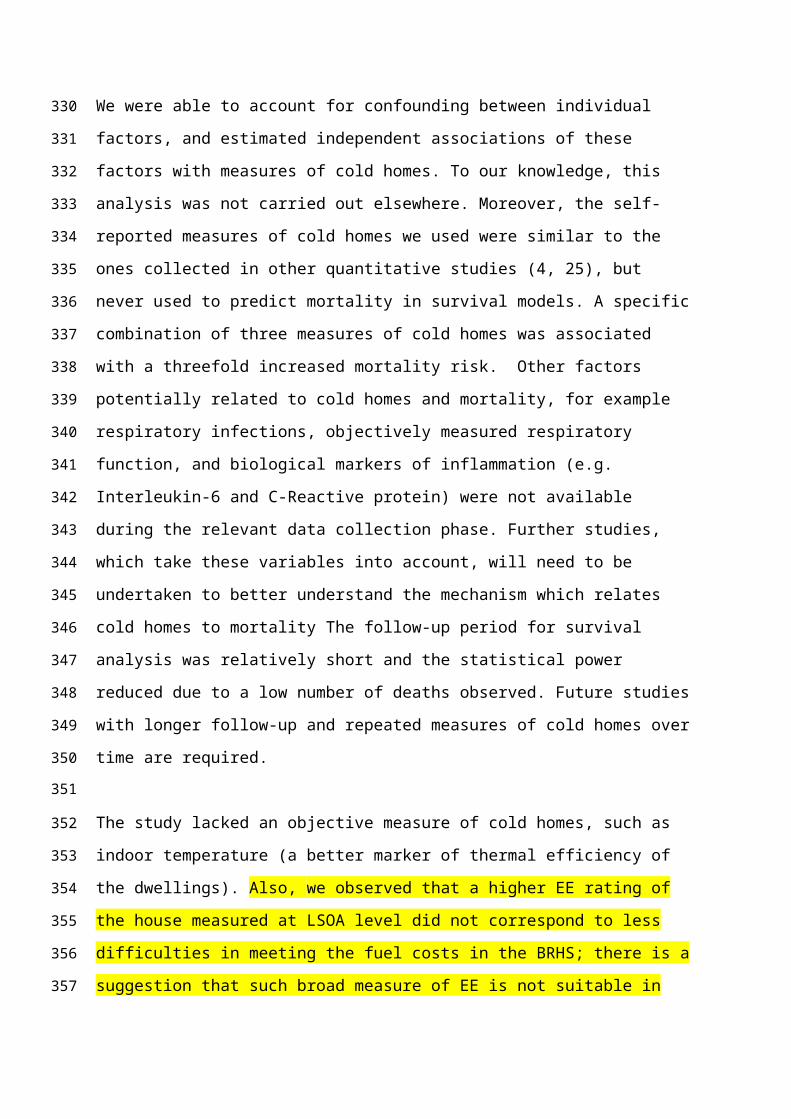
study was a large population-based study of older men, thus applying at individual level. We
were able to account for confounding between individual factors, and estimated
independent associations of these factors with measures of cold homes. To our knowledge,
this analysis was not carried out elsewhere. Moreover, the self-reported measures of cold
homes we used were similar to the ones collected in other quantitative studies (4, 25), but
never used to predict mortality in survival models. A specific combination of three measures
of cold homes was associated with a threefold increased mortality risk. Other factors
potentially related to cold homes and mortality, for example respiratory infections,
objectively measured respiratory function, and biological markers of inflammation (e.g.
Interleukin-6 and C-Reactive protein) were not available during the relevant data collection
phase. Further studies, which take these variables into account, will need to be undertaken
to better understand the mechanism which relates cold homes to mortality The follow-up
period for survival analysis was relatively short and the statistical power reduced due to a
low number of deaths observed. Future studies with longer follow-up and repeated
measures of cold homes over time are required.
The study lacked an objective measure of cold homes, such as indoor temperature (a better
marker of thermal efficiency of the dwellings). Also, we observed that a higher EE rating of
the house measured at LSOA level did not correspond to less difficulties in meeting the fuel
costs in the BRHS; there is a suggestion that such broad measure of EE is not suitable in
studies were the information is collected at individual level as in the BRHS. However, we
acknowledge its relevance in other studies on cold homes at household or macro-area level.
A further minor limitation is the inclusion of only male participants; in the UK and in
comparison to men, a higher proportion of the female population are aged 75 and over (9%,
232
233
234
235
236
237
238
239
240
241
242
243
244
245
246
247
248
249
250
251
252
253
254
255
256
257
258
259
260
261
262
263

compared with 7% of males in 2013 (26)), so we would expect a higher absolute number of
women exposed to cold weather, and so cold housing, than men. We would expect that a
cold homes-mortality relationship could be found in the female population; previous reports
found that women were more likely to suffer fatal events in a cold period than men (1, 4).
However, such finding could not be confirmed by our study. Lastly, although our measure of
grip strength was self-reported, our finding was consistent with one from a previous study
(5).
We also acknowledge the potential importance of factors which were not measured nor
reported in our study, such as biological markers of inflammation and influenza rates. This is
a limitation of our study; to measure those factors could have helped in understanding the
biological pathways linking cold homes with mortality (5). Larger studies may explore this
important scientific questions in the future. However, our work makes an important
contribution to the literature and enhance the understanding of which profiles of older men
live in cold homes, and the implications for their future mortality.
Implications
Our findings suggest that experiencing increasing financial difficulties and lower social class,
known to be strongly associated with fuel poverty (27), are not the only factors which
increase older people’s difficulties in keeping warm during winter. With an aging population,
UK policies should acknowledge the detrimental contribution of multiple risk factors which
increase with age and are more common in people living in cold homes such as social
isolation, poor respiratory health or lower physical function in general. Interventions
developed at address these could also reduce winter mortality, as well as interventions to
lower fuel payments.
Our findings also suggest that a few simple questions, such as the ones on grip strength and
persistent sputum production, may be a useful tool in identifying those who find it hard to
keep warm in winter in primary care. Present studies are already evaluating the feasibility of
implementing grip strength measurement into routine clinical practice, because it is
inexpensive and simple to measure (22). Other factors related to cold homes in our study
are already collected in primary care (e.g. chronic conditions, marital status, and alcohol
264
265
266
267
268
269
270
271
272
273
274
275
276
277
278
279
280
281
282
283
284
285
286
287
288
289
290
291
292
293
294
295
consumption), while others can be potentially routinely collected in the future (e.g.
spirometry to measure lung function (28), or a single item question rather than a complex
score to measure social isolation (29)), as part of an admission procedure during winter. This
would help primary care teams in identifying, or improving the assessment of heating needs
of, older people who find it hard to keep warm without visit them at home, as the National
Institute for Health and Care Excellence (NICE) have recommended in England (2, 13).
Conclusions
Identifying older people who find it hard to keep warm in winter and have an increased
mortality risk is possible. Increasing financial difficulties and lower social class are not the
only factors which increase older people’s difficulties in keeping warm during winter. With
an increasing aging population, UK policies need to tackle the adverse effect of multiple risk
factors which increase with age and are more common in people living in cold homes, such
as social isolation, poor respiratory health and physical frailty.
AUTHORS CONTRIBUTIONS
CS processed the data, performed statistical analyses, drafted and revised the manuscript,
and incorporated revisions of co-authors. RWM contributed to the study design and
supervised the statistical analyses. SGW, PHW, and RWM contributed to the BRHS design
and the acquisition of data. IP contributed to the acquisition of the data from the Centre of
Sustainable Energy. All authors provided an important intellectual contribution to the work,
revised the manuscript, and approved the final version.
Acknowledgements
This paper presents independent research funded by the National Institute of Health
Research School for Primary Care Research (NIHR SPCR grant reference number 281). The
NIHR programme grant was awarded to RWM, and supported CS and PT. DSL is funded by
the NIHR Oxford Biomedical Research Centre. The British Regional Heart study is supported
by a British Heart Foundation (BHF) programme grant (RG/13/16/30528). The funders had
no role in the design and conduct of the study; collection, management, analysis, and
interpretation of the data; preparation, review, or approval of the manuscript; and the
296
297
298
299
300
301
302
303
304
305
306
307
308
309
310
311
312
313
314
315
316
317
318
319
320
321
322
323
324
325
326
327
decision to submit the manuscript for publication. The views expressed in this publication
are those of the author(s) and not necessarily those of the NIHR, the Department of Health,
the NHS or BHF.
Conflict of interest statement
The authors report no relationships that could be construed as a conflict of interest
328
329
330
331
332
333
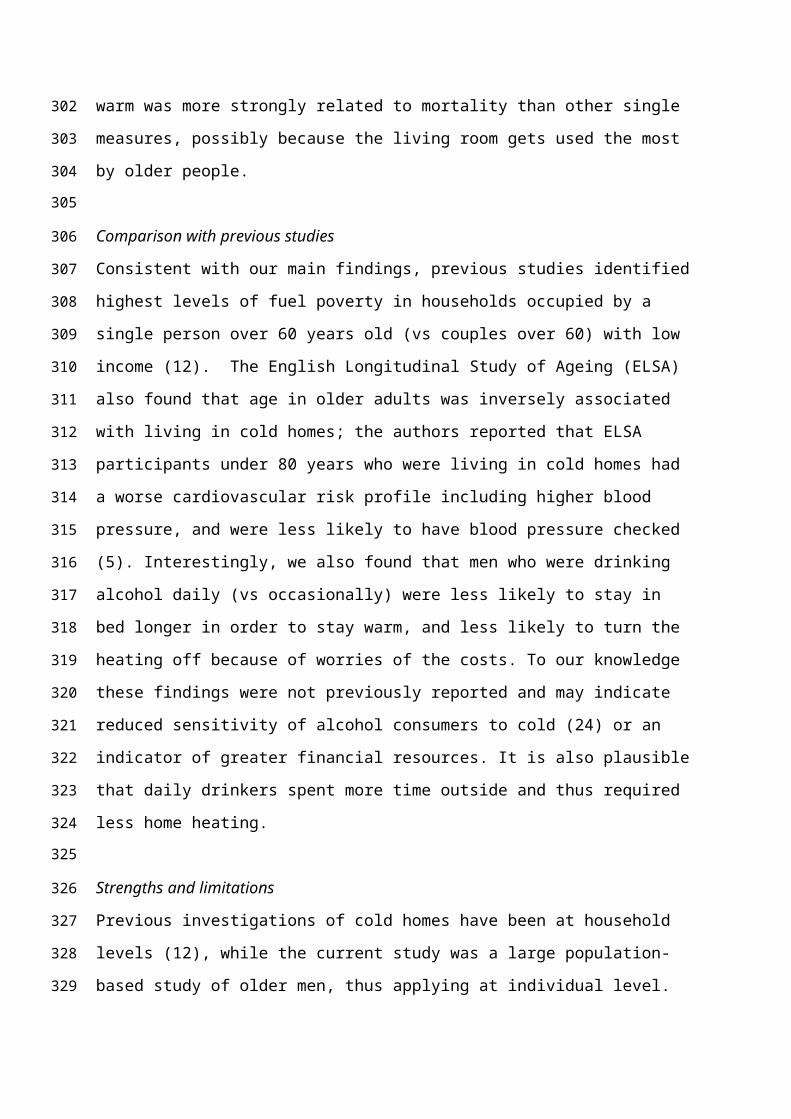
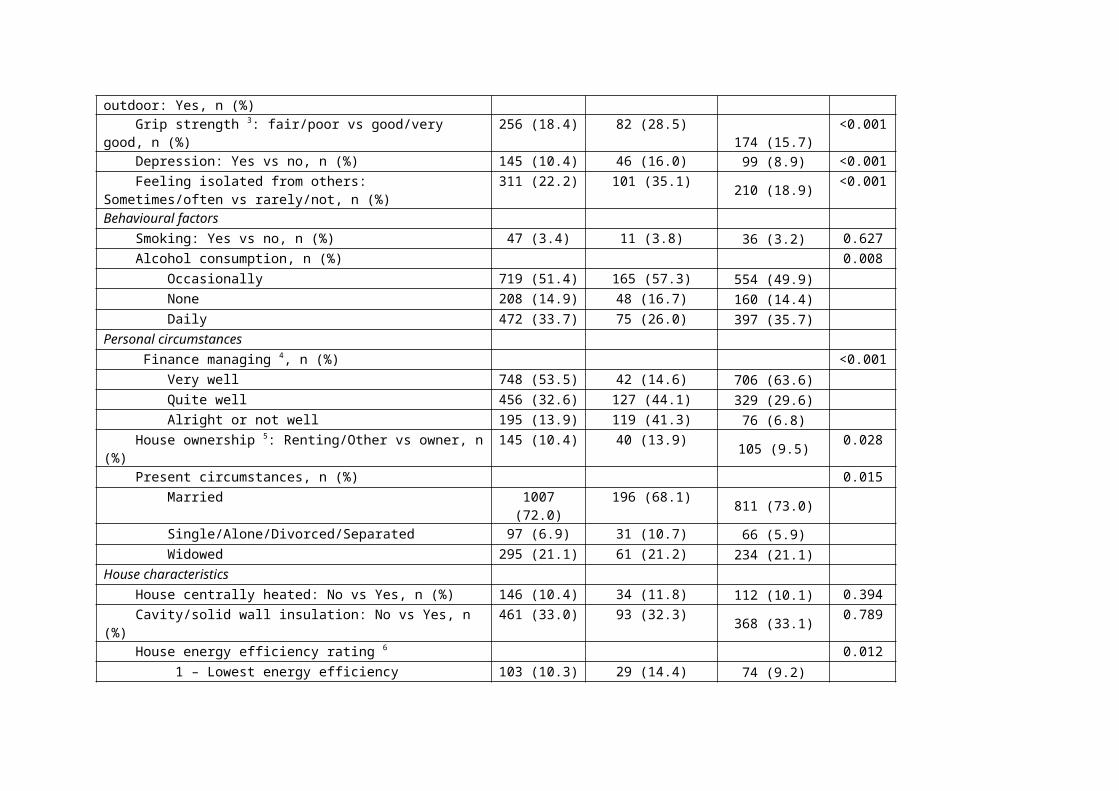
Table 1 – Descriptive statistics of individual characteristics in BRHS men collected on one occasion during 2014 (left column), and descriptive
statistics stratified by having difficulties in meeting the fuel costs.
All (n=1399) 7
Men having difficulties in meeting the heating/fuel costs
Yes(n=288, 20.7%)
No(n=1111, 79.3%) p-value
Socio-demographic characteristics Age (years), mean (SD) 81.0 (4.3) 80.5 (4.2) 81.1 (4.3) 0.025 Social class: Manual, n (%) 633 (45.3) 183 (63.5) 450 (40.5) <0.001 Non-Manual, n (%) 731 (45.3) 100 (34.7) 631 (56.8) HMF, n (%) 35 (2.5) 5 (1.7) 30 (2.7) Region, n (%) 0.511 South 493 (35.2) 97 (33.7) 396 (35.6) Midlands 196 (14.0) 39 (13.5) 157 (14.1) North 555 (39.7) 113 (39.2) 442 (39.8) Scotland 155 (11.8) 39 (13.5) 116 (10.4)General health Chronic conditions 1, n (%) <0.001 None 589 (42.1) 99 (34.4) 490 (44.1) One/Two 700 (50.0) 150 (52.1) 550 (49.5) Three or more 110 (7.9) 39 (13.5) 71 (6.4) Chronic obstructive pulmonary disease (COPD) 2: Yes, n (%) 90 (6.4) 31 (10.7) 59 (5.3) 0.001 Persistent sputum production: Yes, n (%) 349 (25.0) 108 (37.5) 241 (21.7) <0.001 Mobility limitations in getting about outdoor: Yes, n (%) 539 (38.5) 157 (54.5) 382 (34.4) <0.001 Grip strength 3: fair/poor vs good/very good, n (%) 256 (18.4) 82 (28.5) 174 (15.7) <0.001 Depression: Yes vs no, n (%) 145 (10.4) 46 (16.0) 99 (8.9) <0.001 Feeling isolated from others: Sometimes/often vs rarely/not, n (%) 311 (22.2) 101 (35.1) 210 (18.9) <0.001
334
335
Behavioural factors Smoking: Yes vs no, n (%) 47 (3.4) 11 (3.8) 36 (3.2) 0.627 Alcohol consumption, n (%) 0.008 Occasionally 719 (51.4) 165 (57.3) 554 (49.9) None 208 (14.9) 48 (16.7) 160 (14.4) Daily 472 (33.7) 75 (26.0) 397 (35.7)Personal circumstances Finance managing 4, n (%) <0.001 Very well 748 (53.5) 42 (14.6) 706 (63.6) Quite well 456 (32.6) 127 (44.1) 329 (29.6) Alright or not well 195 (13.9) 119 (41.3) 76 (6.8) House ownership 5: Renting/Other vs owner, n (%) 145 (10.4) 40 (13.9) 105 (9.5) 0.028 Present circumstances, n (%) 0.015 Married 1007 (72.0) 196 (68.1) 811 (73.0) Single/Alone/Divorced/Separated 97 (6.9) 31 (10.7) 66 (5.9) Widowed 295 (21.1) 61 (21.2) 234 (21.1)House characteristics House centrally heated: No vs Yes, n (%) 146 (10.4) 34 (11.8) 112 (10.1) 0.394 Cavity/solid wall insulation: No vs Yes, n (%) 461 (33.0) 93 (32.3) 368 (33.1) 0.789 House energy efficiency rating 6 0.012 1 – Lowest energy efficiency 103 (10.3) 29 (14.4) 74 (9.2) 2 173 (17.3) 34 (16.9) 139 (17.3) 3 371 (37.0) 77 (38.3) 294 (36.7) 4 143 (14.3) 34 (16.9) 109 (13.6) 5 – Highest energy efficiency 213 (21.2) 27 (13.4) 186 (23.2)
1 Men were asked if their doctor had ever diagnosed chronic conditions including angina, heart attack, heart failure, claudication, stroke, diabetes, cancer, chronic kidney disease, osteoporosis, Parkinson´s disease. 2 Doctor’s diagnosis of COPD 3 Rating in comparison with men of same age
336337338339340

4 Men were asked to describe how they were managing financially at present5 Renting from local authorities or privately. Category other included living in residential or nursing home (n=5 men), or living in sheltered accommodation (n=9 men), or unspecified accommodation (n=24 men)
6 The rating was not self-reported by the BRHS men, but aggregated from households within participants’ Lower Super Output Area [LSOA]).7 Descriptive statistics in this table were from 1399 men with complete data on all variables and who answered the question about difficulties in meeting the heating/fuel costs
341342343344345346347348349
350
Table 2 - Cross-sectional associations from logistic regression models between individual
characteristics and difficulties in meeting the heating/fuel costs in BRHS men (aged 74-95)
who completed a questionnaire in 2014. Per each of the individual characteristics the
associations are reported as Odds Ratios (ORs) in comparison to the reference category. The
statistically significant results are reported in bold.
Difficulties in meeting your heating/fuel costs? Yes vs NoUnadjusted model 6 Full adjusted model 7
OR (95%CI) p-value OR (95%CI) p-valueSocio-demographic characteristics Age (years) 0.97(0.94,1.00) 0.026 0.94(0.90,0.98) 0.003 Social class: Non-manual (ref.) 1 1 Manual 2.57(1.95,3.37) <0.001 1.66(1.20,2.31) 0.002 HMF 1.05(0.40,2.77) 0.919 1.00(0.34,2.91) 0.998 Region: South (ref.) 1 1 Midlands 1.01(0.67,1.54) 0.947 1.00(0.61,1.64) 0.999 North 1.04(0.77,1.41) 0.782 0.89(0.62,1.28) 0.541 Scotland 1.37(0.90,2.10) 0.144 1.03(0.62,1.72) 0.903General health Chronic conditions 1: None (ref.) 1 1 One/Two 1.35(1.02,1.79) 0.037 1.21(0.87,1.70) 0.261 Three or more 2.72(1.74,4.25) <0.001 2.13(1.19,3.82) 0.011 COPD 2: No (ref.) 1 1 Yes 2.15(1.36,3.39) 0.001 1.00(0.54,1.86) 0.994 Persistent sputum production: No (ref.) 1 1 Yes 2.17(1.64,2.86) <0.001 1.83(1.29,2.59) 0.001 Difficulties in getting outdoor: None (ref.) 1 1 Yes 2.29(1.76,2.97) <0.001 1.22(0.85,1.74) 0.274 Grip Strength 3: Good/Very good (ref.) 1 1 Fair/Poor 2.13(1.58,2.89) <0.001 1.25(0.85,1.82) 0.253 Depression (van Marwijk score): No (ref.) 1 1 Yes 1.94(1.33,2.83) 0.001 1.03(0.62,1.71) 0.896 Feeling isolated from others: No/rarely (ref.) 1 1 Sometimes/often 2.32(1.74,3.08) <0.001 1.61(1.10,2.37) 0.014Behavioural factors Smoking: No (ref.) 1 1 Yes 1.19(0.60,2.36) 0.627 0.60(0.25,1.43) 0.249 Alcohol consumption: Occasionally (ref.) 1 1 None 1.01(0.70,1.45) 0.969 0.81(0.52,1.26) 0.344 Daily 0.63(0.47,0.86) 0.003 0.82(0.57,1.18) 0.294Personal circumstances Finance managing (score 1-3) 4: Well/Quite well/alright or not well 5.10(4.15,6.28) <0.001 4.68(3.74,5.87) <0.001
House ownership: Owner (ref.) 1 1
351
352
353
354
355
356
Renting/Other 5 1.55(1.05,2.28) 0.029 0.64(0.39,1.05) 0.076 Present circumstances: Married (ref.) 1 1 Single/Alone/Divorced/Separated 1.94(1.23,3.06) 0.004 2.20(1.25,3.89) 0.006 Widowed 1.08(0.78,1.49) 0.645 1.10(0.72,1.68) 0.653House characteristics
House centrally heated, Yes (ref.) 1 1
No 1.19(0.79,1.79) 0.394 0.96(0.57,1.61) 0.874 Cavity/solid wall insulation, Yes (ref.) 1 1 No 0.96(0.73,1.27) 0.789 1.07(0.76,1.50) 0.690
1 Men were asked if their doctor had ever diagnosed chronic conditions including angina, heart attack, heart failure, claudication, stroke, diabetes, cancer, chronic kidney disease, osteoporosis, Parkinson´s disease. 2 Doctor’s diagnosis of COPD 3 Rating in comparison with men of same age4 Men were asked to describe how they were managing financially at present5 Renting from local authorities or privately. Category other included living in residential or nursing home (n=5 men), or living in sheltered accommodation (n=9 men), or unspecified accommodation (n=24 men)6 Variables included one at a time. Number of observation in all models = 13997 All listed variables included in the model. Number of observation = 1399
357358359360361362363364365366
368
Table 3 – Prospective associations between self-reported measures of cold homes with all-cause mortality in men aged 74-96 years from the BRHS. Results were reported as Hazard Ratios (HR) with 95% Confidence Intervals (CI) from Cox proportional hazard models. Statistically significant HRs are marker in bold.
All-cause Mortality 1
Model 1 Model 2Unadjusted
Model Full adjusted model 2
HR (95% CI) HR (95%CI)Self-reported measures of cold homes during previous winter
(1) Having difficulties in meeting the heating/fuel costs 1.14 (0.75, 1.73)p=0.547
1.04 (0.67,1.60) p=0.861
(2) Staying in bed longer in order to stay warm 1.15 (0.69, 1.91)p=0.601
1.05 (0.62, 1.78)p=0.857
(3) Can’t keep the living room comfortably warm 1.81 (0.84, 3.88)p=0.127
1.38 (0.64, 3.01)p=0.406
(4) Turning the heating off because of worries about the costs 0.69 (0.33, 1.40)p=0.302
0.62 (0.30, 1.29)p=0.202
Combination of measures
Assenting to (1) and (2) vs others 3 1.47 (0.80, 2.74)p=0.217
1.34 (0.71, 2.54)p=0.372
Assenting to (1) and (3) vs others 4 2.22 (0.98, 5.04)p=0.056
1.80 (0.77, 4.18)p=0.172
Assenting to (1), (2) and (3) vs others 5 2.90 (1.18, 7.09)p=0.020
2.85(1.11, 7.30)p=0.029
1 Median follow-up period of 2.12 years during years 2014-2016; 126 men died during this period (the total number of men included in each of the survival models was 1385).2 Adjusted models for age, social class, region, marital status, number of chronic conditions, and persistent sputum production
369370371372
373374375376
3 Men assenting to (1) and (2) were n=894 Men assenting to (1) and (3) were n=345 Men assenting to (1), (2) and (3) were n=21
377378379
References
1. Marmot Review Team. The Health Impacts of Cold Homes and Fuel Poverty. 2011. Available from https://www.foe.co.uk/sites/default/files/downloads/cold_homes_health.pdf.2. National Institute for Heath and Care Excellence (NICE) guidelines. Excess winter deaths and illness and the health risks associated with cold homes. Published date: March 2015. Available from https://www.nice.org.uk/guidance/ng6/chapter/1-Recommendations 3. Dear KB, McMichael AJ. The health impacts of cold homes and fuel poverty. BMJ. 2011;342:d2807.4. Wilkinson P, Pattenden S, Armstrong B, Fletcher A, Kovats RS, Mangtani P, et al. Vulnerability to winter mortality in elderly people in Britain: population based study. BMJ. 2004;329(7467):647-53.5. Shiue I. Cold homes are associated with poor biomarkers and less blood pressure check-up: English Longitudinal Study of Ageing, 2012-2013. Environmental science and pollution research international. 2016;23(7):7055-9.6. Sartini C, Barry SJ, Whincup PH, Wannamethee SG, Lowe GD, Jefferis BJ, et al. Relationship between outdoor temperature and cardiovascular disease risk factors in older people. European journal of preventive cardiology. 2017;24(4):349-56.7. McCartney M. Margaret McCartney: can doctors fix cold homes? BMJ. 2015;350:h1595.8. Tod A, Lusambili A, Cooke J, Homer C, Abbott J, Stocks A, et al. Barriers to keeping warm in later life. Nursing older people. 2013;25(10):22-9.9. Burholt V, Windle G. Keeping warm? Self-reported housing and home energy efficiency factors impacting on older people heating homes in North Wales. Energy Policy. 2006;34(10):1198-208.10. Grey CN, Jiang S, Nascimento C, Rodgers SE, Johnson R, Lyons RA, et al. The short-term health and psychosocial impacts of domestic energy efficiency investments in low-income areas: a controlled before and after study. BMC Public Health. 2017;17(1):140.11. Wilkinson P, Landon M, Armstrong B, Stevenson S, McKee M. Cold comfort: the social and environmental determinants of excess winter death in England, 1986-1996: Joseph Rowntree Foundation, York; 2001.12. Department for Business, Energy & Industrial Strategy. Annual fuel poverty statistics report: 2016. Office of National Statistics. Available from https://www.gov.uk/government/statistics/annual-fuel-poverty-statistics-report-2016.13. Kmietowicz Z. GPs should identify and visit people at risk from cold homes, says NICE. BMJ. 2015;350:h1183.14. Lennon LT, Ramsay SE, Papacosta O, Shaper AG, Wannamethee SG, Whincup PH. Cohort Profile Update: The British Regional Heart Study 1978–2014: 35 years follow-up of cardiovascular disease and ageing. International Journal of Epidemiology. 2015;44(3):826a-g.15. Jefferis BJ, Sartini C, Ash S, Lennon LT, Wannamethee SG, Whincup PH. Validity of questionnaire-based assessment of sedentary behaviour and physical activity in a population-based cohort of older men; comparisons with objectively measured physical activity data. Int J Behav Nutr Phys Act. 2016;13(1):14.16. Walker M, Whincup P, Shaper A. The British Regional Heart Study 1975–2004. International Journal of Epidemiology. 2004;33(6):1185-92.17. Sartini C, Wannamethee SG, Iliffe S, Morris RW, Ash S, Lennon L, et al. Diurnal patterns of objectively measured physical activity and sedentary behaviour in older men. BMC Public Health. 2015;15:609.18. Shaper AG, Pocock SJ, Walker M, Cohen NM, Wale CJ, Thomson AG. British Regional Heart Study: cardiovascular risk factors in middle-aged men in 24 towns. BMJ. 1981;283(6285):179-86.19. Jefferis BJ, Sartini C, Lee IM, Choi M, Amuzu A, Gutierrez C, et al. Adherence to physical activity guidelines in older adults, using objectively measured physical activity in a population-based study. BMC Public Health. 2014;14:382.
380
381382383384385386387388389390391392393394395396397398399400401402403404405406407408409410411412413414415416417418419420421422423424425426427428429430

20. Centre for Sustainable Energy. Mapping domestic energy efficiency in Great Britain. March 2015. Available from https://www.cse.org.uk/projects/view/1305.21. Sartini C, Morris RW, Whincup PH, Wannamethee SG, Ash S, Lennon L, et al. Association of Maximum Temperature With Sedentary Time in Older British Men. J Phys Act Health. 2017;14(4):265-9.22. Ibrahim K, May C, Patel HP, Baxter M, Sayer AA, Roberts H. A feasibility study of implementing grip strength measurement into routine hospital practice (GRImP): study protocol. Pilot Feasibility Stud. 2016;2(27):2-10.23. Findlay RA. Interventions to reduce social isolation amongst older people: where is the evidence? Ageing and Society. 2003;23(05):647-58.24. Freund BJ, Obrien C, Young AJ. Alcohol Ingestion and Temperature Regulation during Cold-Exposure. Journal of Wilderness Medicine. 1994;5(1):88-98.25. Rudge J, Gilchrist R. Excess winter morbidity among older people at risk of cold homes: a population-based study in a London borough. J Public Health (Oxf). 2005;27(4):353-8.26. Office of National Statistics (ONS) bulletin. Excess Winter Mortality in England and Wales: 2013-14 and 2012-13. Available from https://www.ons.gov.uk/peoplepopulationandcommunity/birthsdeathsandmarriages/deaths/bulletins/excesswintermortalityinenglandandwales/2014-11-28.27. Iparraguirre J. Have winter fuel payments reduced excess winter mortality in England and Wales? J Public Health (Oxf). 2015;37(1):26-33.28. Rothnie KJ, Mullerova H, Goss H, Chandan J, Quint JK. Validity and Interpretation of Spirometry for Patients in Primary Care. Thorax. 2015;70(Suppl 3):A188-A90.29. Steptoe A, Shankar A, Demakakos P, Wardle J. Social isolation, loneliness, and all-cause mortality in older men and women. Proc Natl Acad Sci. 2013;110(15):5797-801.
431432433434435436437438439440441442443444445446447448449450451452453454
455