Embed Size (px)
Citation preview
PROJECT DESIGN DOCUMENT FORM (CDM PDD) - Version 02 CDM – Executive Board page 1
This template shall not be altered. It shall be completed without modifying/adding headings or logo, format or font.
CLEAN DEVELOPMENT MECHANISM PROJECT DESIGN DOCUMENT FORM (CDM-PDD)
Version 02 - in effect as of: 1 July 2004)
CONTENTS A. General description of project activity B. Application of a baseline methodology C. Duration of the project activity / Crediting period D. Application of a monitoring methodology and plan E. Estimation of GHG emissions by sources F. Environmental impacts G. Stakeholders’ comments
Annexes Annex 1: Contact information on participants in the project activity Annex 2: Information regarding public funding Annex 3: Baseline information
Annex 4: Monitoring plan
Appendix 1: Overview of Palm Crude Oil Production process Appendix 2: Overview of Cement Production Process Appendix 3: SD Policy

PROJECT DESIGN DOCUMENT FORM (CDM PDD) - Version 02 CDM – Executive Board page 2
This template shall not be altered. It shall be completed without modifying/adding headings or logo, format or font.
SECTION A. General description of project activity A.1 Title of the project activity: >> Project for high quality fuelisation and advanced utilization of waste biomass in Indonesia Indonesia: High quality fuelisation of waste biomass and its advanced utilisation (Version 01 – Date: 10 April 2006) A.2. Description of the project activity: >> <Purpose>
In a palm oil mill, a large amount of palm oil cake, such as empty fruit brunches (EFBs), shells, and fibres, is discarded. Shells and fibres have lower moisture content and are easier to handle, so they are used as fuels for boiler generators generating steam and electric power in the premises. On the other hand, EFBs contain about 60% of moisture because fresh fruit bunches (FFBs) are streamed. Streaming is performed to make fruits easier to be separated from FFBs and deactivate enzymes to prevent deterioration of palm oil. The high moisture content EFBs are difficult to be used as a fuel, and currently incinerated without collecting energy or piled outdoors in the palm farm or the vicinity of the oil mill. Appendix 1 shows the production process of the palm oil mill targeted in this project.
EFBs are incinerated by the 4 incinerators, but they are not sufficient to process all the EFBs produced due to expansion of the plant scale, and a large amount of EFBs is piled outdoors in the premises. The EFBs piled outdoors decay, emitting methane into the air. The methane produced due to decay will be reduced by turning the EFBs that are simply incinerated or piled outdoors into a carbonized fuel. The EFB carbonized fuel replaces fossil fuel to reduce coal consumption to achieve reduction of green house gases (GHG). In this PDD, the carbonized fuels made from EFBs and pruned leaves are called EFB carbonized fuel (ECF: EFB Carbonised Fuel).
As users of the carbonized fuel, cement factories that consume a large amount of coal are targeted. As a heat source for clinker manufacturing, a large amount of coal produced domestically is consumed. By replacing part of it with the carbonized fuel originated from EFBs, GHG originated from coal will be reduced. Appendix 2 shows the cement manufacturing process. <Contribution>
Reduction of GHG will be achieved by turning EFBs piled outdoors into a carbonized fuel and replacing coal with the EFB carbonized fuel. By utilizing the unused energy of EFBs, coal that has been consumed domestically in Indonesia can be exported or used domestically to improve the life standard of citizens in Indonesia.
In the carbonization process introduced in this project, the bag filter will be installed to suppress emission of fine particles. The current EFB incinerators have no smoke control equipment, and fine particles are emitted into the air, resulting in concern over air pollution. Actually, the rain water used by the local residents as drinking water is contaminated by the fine particles. Also, the carbonization process will dramatically reduce the amount of carbon monoxide (CO) emitted from the incinerators due to imperfect combustion. <SD policy> This project will contribute to the below SD policy. The Indonesian government has the following measures and policies for promotion of renewable energy. >Removing price subsidy

PROJECT DESIGN DOCUMENT FORM (CDM PDD) - Version 02 CDM – Executive Board page 3
This template shall not be altered. It shall be completed without modifying/adding headings or logo, format or font.
>Rationalizing energy price >Ratio electrification at 90% in 2020 >Increasing share of renewable energy (non big scale hydro) at least 5% in 2020 (especially
geothermal, biomass and micro/mini hydro) >Increasing share of coal including low rank coal >Improving energy efficiency >Increasing local content, including human resources The presentation material of the Energy and Mineral Resources Minister is shown in Appendix 3. A.3. Project participants: >>
Participating country Project participant Is the country willing to be a project participant?
Republic of Indonesia (host) PT. SEMEN PADANG (PTSP) PT. AMP PLANTATION (PTAMP)
NO
Japan Ishikawajima-Harima Heavy Industries Co., Ltd. (IHI)
NO
A.4. Technical description of the project activity: A.4.1. Location of the project activity: >> Host Country: Indonesia A.4.1.1. Host Party(ies): >> PT. AMP Plantation
PT. Semen Padang A.4.1.2. Region/State/Province etc.: >> Province of West Sumatra A.4.1.3. City/Town/Community etc: >> PT. AMP Plantation: Jorong Koto Gadang Tapian Kandis, District of Agam
PT. Semen Padang : Indarung Padang 25237, A.4.1.4. Detail of physical location, including information allowing the unique identification of this project activity (maximum one page): >>
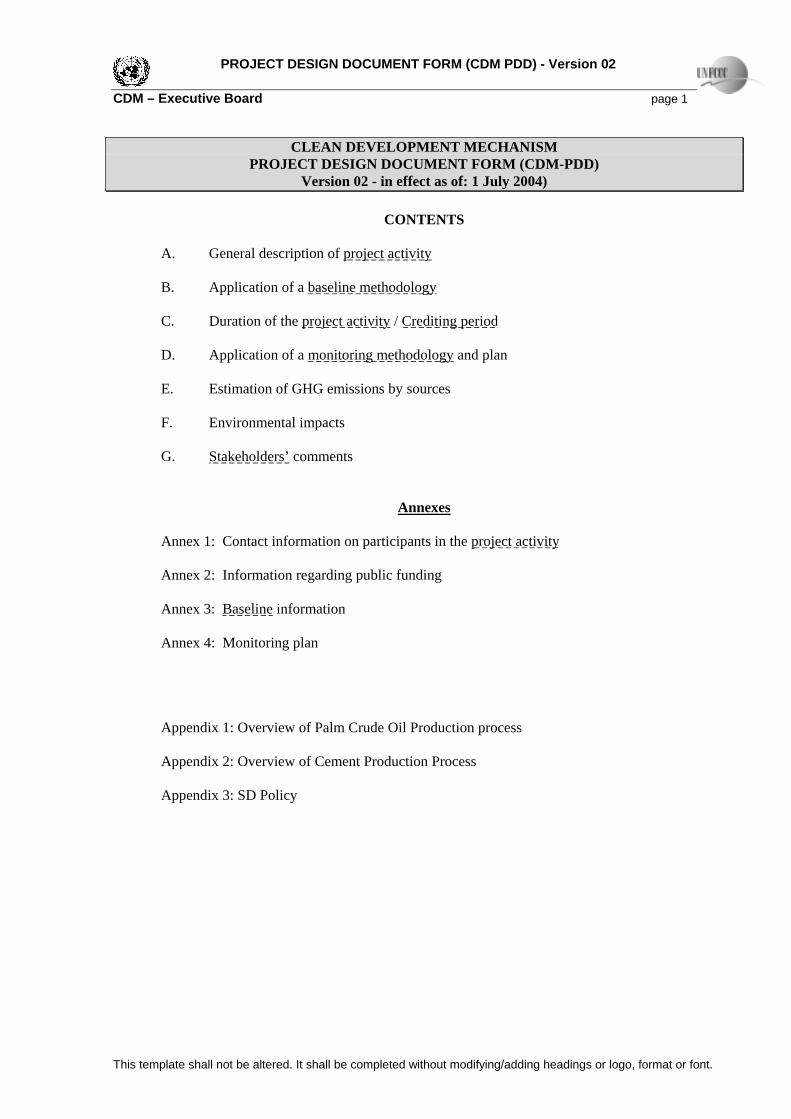
The PT. Semen Padang to use the EFB carbonized fuel as a substitute for coal is located in Pedang City in West Sumatra. The CPO mill of the PT. AMP Plantation, discarding waste biomass EFBs, is located in Kabupaten Agam, 120km northwest of the PT. Semen Padang. It receives FFB from the palm farm of the own company and farms around it. The carbonization plant will be installed in the premises or
PROJECT DESIGN DOCUMENT FORM (CDM PDD) - Version 02 CDM – Executive Board page 4
This template shall not be altered. It shall be completed without modifying/adding headings or logo, format or font.
neighbouring land of the palm oil mill of the PT. AMP Plantation, and the carbonized fuel will be transported to the PT. Semen Padang by land.
A.4.2. Category(ies) of project activity: >> The project is a large-scale project. Category of Manufacturing Industries. Sectoral scope 4: Manufacturing industries A.4.3. Technology to be employed by the project activity: >>
The technology used for this project is the carbonization technology, which is mature in the world including Japan. In Japan, there are many commercial plants operating for reduction of city waste. The carbonization technology itself is similar to production of charcoal. In the non-Annex-I countries such as Indonesia, simple structures with a space formed by bricks and one chimney stack are widely used.

PROJECT DESIGN DOCUMENT FORM (CDM PDD) - Version 02 CDM – Executive Board page 5
This template shall not be altered. It shall be completed without modifying/adding headings or logo, format or font.
However, such carbonization furnaces often emit volatile gas components produced in the carbonization process. The major components of the volatile gases are carbon monoxide, hydrogen, and methane, which have harmful effects on the environment and may result in global warming. This project will eliminate GHG emission in the carbonization process by using the kiln-type carbonization technology to separate the volatilization process and volatile gas component combustion process and achieve energy independence by controlling the retention time of the raw materials for carbonization in the kiln.
The technologies to utilize EFBs other than the carbonization furnace include composting and utilization for direct power generation. For composting, there is not sufficient demand for it that requires processing and use of the entire amount of wasted EFBs. In addition, methane gas is produced in anaerobic fermentation in the composting process. The fluidized bed boiler technology can be used to generate power using EFBs directly as fuels. However, only a combustion experiment in an experimental plant in a limited period has been done, and it is known that the high ash adherability due to K content of 30% or more in the EFB ash aggregates the fluid sand and inhibit the flow, which makes it hard to operate continuously. Therefore, the technology is hardly a proven technology.
The characteristics of ECF, EFB carbonized fuel, are equivalent to those of coal, and its grindability is better than coal, so there are a few technological problems in use in the cement manufacturing process. ECF will be mixed with coal or powdered coal and fed into the kiln.
Environmental advantages
In the current system of the palm oil mill, wasted EFBs are incinerated by the 4 incinerators, and the exhaust gas is emitted directly into the air from the chimney stack located at the top of the incinerator made from bricks. The incinerators are the fixed-bed type, and EFBs are continuously dropped from the top of the furnace. The air for combustion is supplied via natural convection from the opening of the fender of the fixed bed. This method results in imperfect combustion, emitting carbon monoxide (CO), hydrogen (H), and methane (CH4). In addition, soot and fine particles are also directly emitted to the air. When the smoke emitted from the chimney stack is observed, black smoke is emitted periodically. This situation results in particulate substance contamination of rain water used by the local residents as drinking water.
As production of crude palm oil (CPO) increases year by year, production of waste EFBs also increases, and the capacity of the current facilities is getting insufficient. The overflown EFBs are not incinerated, and piled outdoors in the premises of the palm oil mill. The EFBs piled outdoors quickly decay under the high-temperature and humidity environment of Indonesia. Inside the pile of EFBs, oxygen in the air is consumed by decaying and an anaerobic environment occurs, where methane (CH4) produced in anaerobic fermentation is emitted.
For the current situation described above, EFB carbonization of this project will reduce the EFBs piled outdoors, resulting in reduction of fermentation methane (CH4) emission due to decay. Also, the pyrolysis gas combustion furnace and bug filter will be installed in the carbonization process to reduce emission of CO, CH4, and fine particles due to imperfect combustion.
On the other hand, in the cement factory that consumes coal in the cement kiln, part of the coal will be replaced with the carbonized fuel, reducing carbon dioxide (CO2) emission from coal. Technology transfer
Indonesia’s equipment and technologies for carbonization of biomass including EFBs involves feeding raw material biomass into a small space formed by bricks and carbonizing it in partial combustion. This method has no movable part, and manufacturing and operation of the equipment is easy. However, partial combustion and carbonization process are difficult to control, and there are problems such as emission of pyrolysis gases (including methane) due to imperfect combustion into the air and unstable characteristics of the carbide.
PROJECT DESIGN DOCUMENT FORM (CDM PDD) - Version 02 CDM – Executive Board page 6
This template shall not be altered. It shall be completed without modifying/adding headings or logo, format or font.
For the kiln type carbonization furnace adopted in this project, transfer of technologies and expertises is mandatory. The materials and parts comprising the carbonization furnace can be procured in Indonesia, except for clad steel, although it depends on the degree of automation of operation of the carbonization furnace. Clad steel can be procured overseas if not possible in Indonesia. A.4.4. Brief explanation of how the anthropogenic emissions of anthropogenic greenhouse gas (GHGs) by sources are to be reduced by the proposed CDM project activity, including why the emission reductions would not occur in the absence of the proposed project activity, taking into account national and/or sectoral policies and circumstances: >>
There are 3 types of solid biomass discarded in the production process of crude palm oil (CPO); shells, fibres, and EFBs. Shells and fibres have lower moisture content and are easier to handle, so they are used as fuels for boiler generators generating steam and electric power in the premises. By using discarded shells and fibres as fuels, the entire demands for steam and electric power in the CPO mill can be met. In addition to the fact that there is no demand for more steam or electric power, the moisture content of EFBs is high, so they are incinerated or piled outdoors without being used as fuels. This project will achieve reduction of CO2 by turning the wasted EFBs into a carbonized fuel and using it in the cement factory that consumes a large amount of coal as a substitute, reducing CO2 as a result. The project can also reduce emission of methane gas produced due to incineration of incompletely decayed EFBs piled outdoors.
This project proposes carbonization of wasted EFBs and replacement of coal by linking the CPO Mill and cement factory, which are not directly related, and regard it as a driving force for realization.
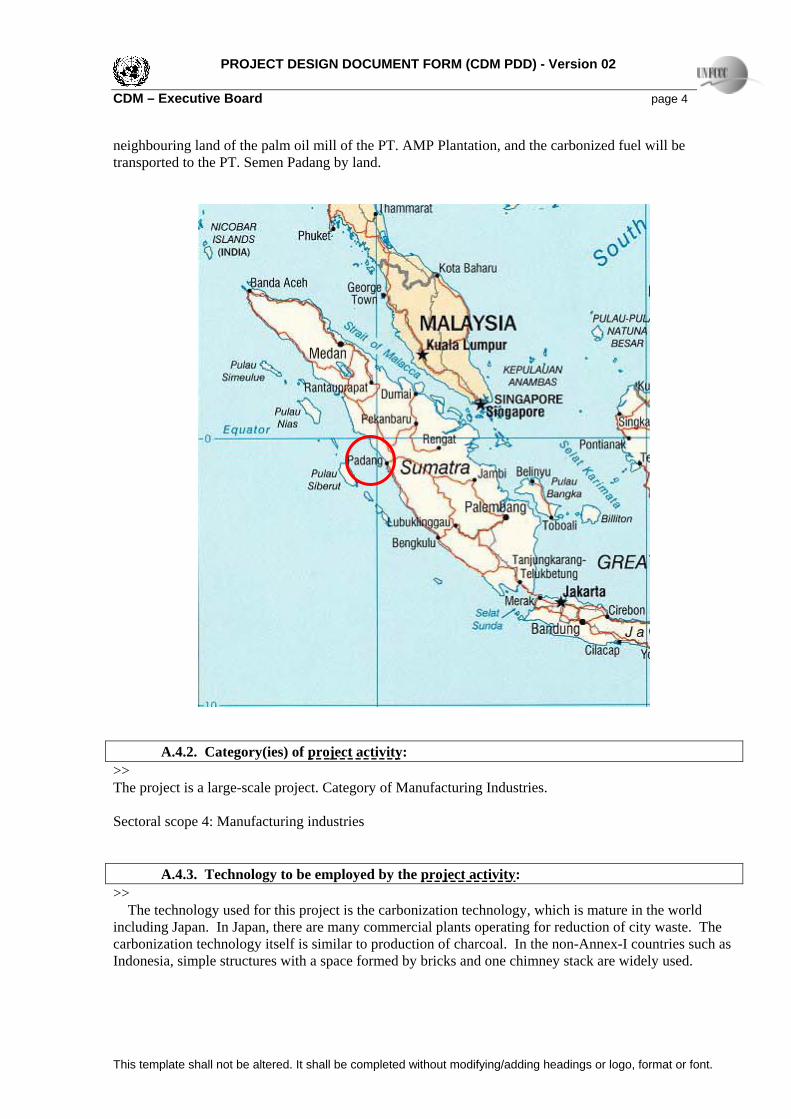
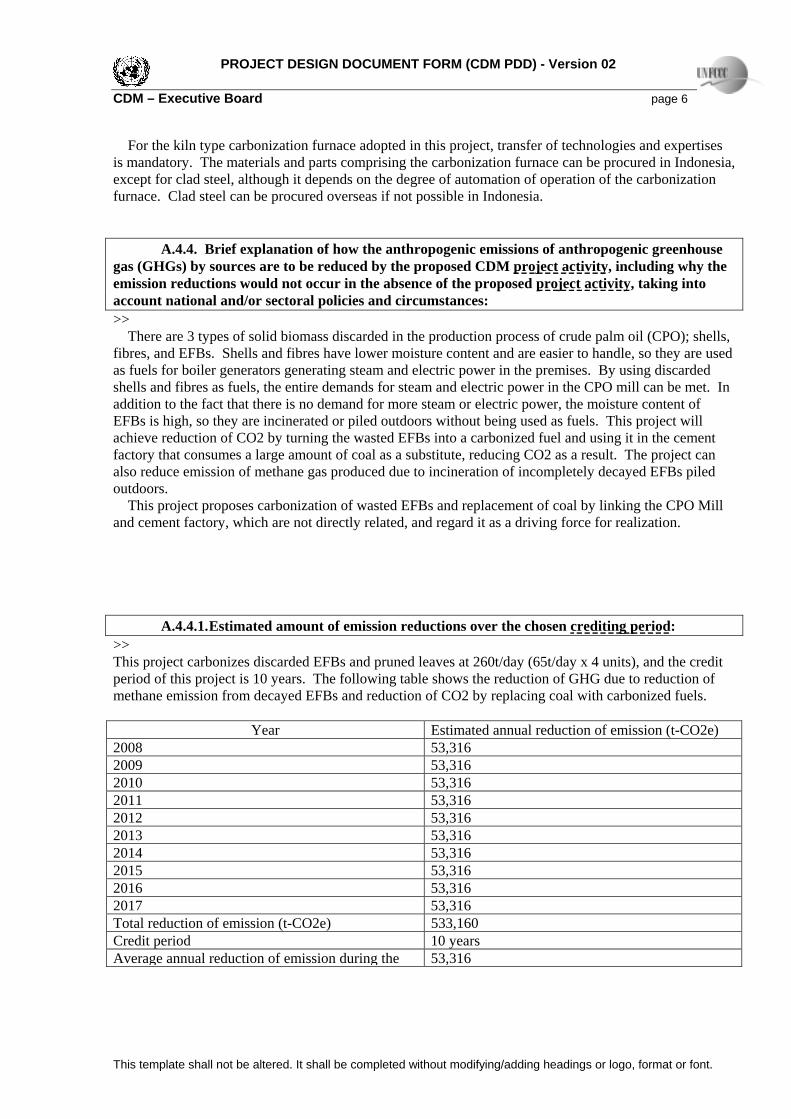
A.4.4.1. Estimated amount of emission reductions over the chosen crediting period: >> This project carbonizes discarded EFBs and pruned leaves at 260t/day (65t/day x 4 units), and the credit period of this project is 10 years. The following table shows the reduction of GHG due to reduction of methane emission from decayed EFBs and reduction of CO2 by replacing coal with carbonized fuels.
Year Estimated annual reduction of emission (t-CO2e) 2008 53,316 2009 53,316 2010 53,316 2011 53,316 2012 53,316 2013 53,316 2014 53,316 2015 53,316 2016 53,316 2017 53,316 Total reduction of emission (t-CO2e) 533,160 Credit period 10 years Average annual reduction of emission during the 53,316

PROJECT DESIGN DOCUMENT FORM (CDM PDD) - Version 02 CDM – Executive Board page 7
This template shall not be altered. It shall be completed without modifying/adding headings or logo, format or font.
credit period (t-CO2) A.4.5. Public funding of the project activity: >>
There is no ODA or public aid/support for this project. SECTION B. Application of a baseline methodology B.1. Title and reference of the approved baseline methodology applied to the project activity: >> ACM0003: Emissions reduction through partial substitution of fossil fuels with alternative fuels in cement manufacture B.1.1. Justification of the choice of the methodology and why it is applicable to the project activity: >>
The selected baseline methodology ACM0003 reduces GHG by replacing part of fossil fuels with alternative fuels in the cement industry. The baseline GHG emission of this project is decay methane emission from the EFB piled outdoors of the CPO mill and reduction of CO2 by replacing coal in the cement factory, each of which can be calculated using the formulas listed in ACM0003: Emissions reduction through partial substitution of fossil fuels with alternative fuels in cement manufacture. The methodology ACM0003 is applicable to the cement industry with the following conditions: Fossil fuel(s) used in cement manufacture are partially replaced by the following alternative fuels:
(a) Wastes originating from fossil sources, such as tires, plastics, textiles from polymers, or rubber; The carbonized fuel used in this project is produced from EFB, not from fossil sources.
(b) Biomass residues where they are available in surplus and would in the absence of the project activity
be dumped or left to decay or burned in an uncontrolled manner without utilizing them for energy purposes; The carbonized fuel used in this project replaces about 5% of the consumed heat value of coal. Currently, the EFB to be used as a raw material for the carbonized fuel is incinerated and not used effectively. The steam and power required in the CPO process is supplied by the shells and fibres discarded from the CPO process as EFB which are used as the boiler fuel. There is a surplus of shells and fibres for the steam and power demands.
CO2 emissions reduction relates to CO2 emissions generated from fuel burning requirements only
and is unrelated to the CO2 emissions from decarbonisation of raw materials (i.e. CaCO3 and MgCO3 bearing minerals);
The carbonized fuel replaces coal combustion in the cement manufacturing process. The methodology is applicable only for installed capacity (expressed in tonnes clinker/year) that
exists by the time of validation of the project activity;

PROJECT DESIGN DOCUMENT FORM (CDM PDD) - Version 02 CDM – Executive Board page 8
This template shall not be altered. It shall be completed without modifying/adding headings or logo, format or font.
In this project, the carbonization plant is newly constructed, but the carbonized fuel is used in the existing cement kiln. This project does not consider any future addition of kilns. The amount of alternative fuels available for the project is at least 1.5 times the amount required to
meet the consumption of all users consuming the same alternative fuels, i.e. the project and other alternative fuel users. (←This criterion require extra caution.)
This project does not meet the 4th criterion. Currently, EFB energy is not utilized at all, not limited to the CPO mill. That is, there is no user consuming EFB. Therefore, this criterion is regarded unnecessary. B.2. Description of how the methodology is applied in the context of the project activity: >>
The approved consolidated methodology ACM0003 is applied to this project along with the measured values, estimated values, and IPCC default values.
The baseline CH4 emitted from combustion of coal in the kiln can be ignored because of the high combustion temperature and long retention time. The baseline emission from the outside of the project boundary includes CO2 emission from open burning of EFBs and CH4 emission due to decay of EFBs piled outdoors. They are reported as leakage.
The EFB carbonized fuel is the only alternative fuel replacing coal, and fossil fuels and electric power are consumed in manufacturing of the carbonized fuel. Light oil is consumed as a heat source only upon startup of the carbonization plant. Upon startup and during normal operation, power is consumed for rotation of the ventilator and kiln, which is handled as leakage. Also, emission of CO2, CH4, and N2O from transportation of the carbonized fuel is also reported as leakage. The carbonized fuel replaces about 5% of coal on a weight basis, reducing the corresponding emission from the transportation. However, calculation of emission is difficult because coal is transported from multiple sites. Therefore, the reduction of transportation emission due to reduction of coal consumption is not counted, which is conservative.
ACM0003 states that combustion of coarse biomass requires more biomass than combustion of fine powdered coal for cement manufacturing of the same amount due to inhibition of heat transfer, and reports 10% of total heat input as moisture penalty. In this project, the alternative fuel replacing coal used in the cement manufacturing process is the carbonized fuel, whose granularity and moisture content are less than or equal to powdered coal. Therefore, this penalty is not required, and emission from manufacturing of the carbonized fuel is reported as leakage. Reduction of GHG emission
The reduction of GHG obtained from the implementation of this project is described in the baseline methodology. The implementation of the project, i.e. carbonization of EFBs, reduces production of methane due to decay by eliminating EFBs piled outdoors. On the other hand, fossil fuels need to be combusted upon startup of the carbonization furnace, which generates CO2 and N2O. In the cement factory, reduction of CO2 by replacing coal with the carbonized fuel and reduction of GHG by reducing coal consumption in transportation will be achieved. However, CO2, CH4, and N2O are produced in transportation of the carbonized fuel. Baseline
Without implementation of this project, EFBs will be incinerated or piled outdoors, and a large amount of coal consumed in the cement factory as it is. The baseline emission is calculated by the method described in methodology.

PROJECT DESIGN DOCUMENT FORM (CDM PDD) - Version 02 CDM – Executive Board page 9
This template shall not be altered. It shall be completed without modifying/adding headings or logo, format or font.
B.3. Description of how the anthropogenic emissions of GHG by sources are reduced below those that would have occurred in the absence of the registered CDM project activity: >> Additionality The applicable baseline methodology analyzes the additionality of the project using a flowchart. Step 0. Preliminary screening based on the starting date of the project activity
This project constructs plants from now on and does not go back to the start of the credit period. Step 1. Identification of alternatives to the project activity consistent with current laws and regulations Sub-step 1a. Define alternatives to the project activity: In Sub-step 1a, this project and other realistic and economical alternative projects are discriminated. The alternative projects include the following: ・The same project not implemented as CDM (i.e. EFB carbonization/utilization projects)
・Alternative plans providing a quality, scope, and characteristics equivalent to those of this project ・Maintenance of the status quo The possible methods treating EFBs and pruned leaves are ① incineration (EFB)/mulching (pruned leaves), which are the current treatment methods, ② electric power generation using them as fuels directly, ③ landfill, and ④ making them high-grade fuels by carbonization. Scenario 1: Continuation of the current practice In this scenario, the PT. Semen Padang continues to manufacture cement with the current equipment and technologies. Scenario 2 : Likely evolving fuel mix portfolios (promotion of mixed combustion) Possible fuels are coal, fuel oil, and natural gas. Fuel Price Heating value Price [Rp./GJ] Source Coal (2003)
38.63 US$/ton (export price)
7,100 kcal/kg 11,695 Indonesia Energy outlook & statistics 2004
Fuel Oil (01.03.2004)
1,560 Rp./litter 38.68 GJ/m3 40,330 Indonesia Energy outlook & statistics 2004
Natural Gas (2002-2003)
2.70-3.00 US$/MMBTU
37.23 MJ/m3 23,030-25,590 Indonesia Energy outlook & statistics 2004
* assumption: 1US$ = Rp. 9,000 When the prices are compared, the most inexpensive fuel is coal. The enterprise is willing to reduce the cost of cement manufacturing. In terms of environmental aspects, natural gas is attractive although it is more expensive than coal. However, there is no gas infrastructure in Pedang where the PT. Semen Padang is located, which makes it impossible to supply natural gas via a pipe line. It is unlikely that they

PROJECT DESIGN DOCUMENT FORM (CDM PDD) - Version 02 CDM – Executive Board page 10
This template shall not be altered. It shall be completed without modifying/adding headings or logo, format or font.
invest on the infrastructure considering the high price of natural gas even if it is advantageous in terms of the environment. Considering the current facilities (coal acceptance, coal-storage yard, conveyer, etc.) of the PT. Semen Padang and the price, it can be determined that they will continue to use coal. This is the same as Scenario 1. Scenario 3: Proposed project activity In this scenario, 5.2% of coal heat input is replaced with the EFB carbonized fuel. The most important things in continuation of this scenario are the price of coal and price setting of the EFB carbonized fuel. A sensibility analysis of Scenario 3 was performed using the prices of coal and carbonized fuels as parameters. Because Scenario 1 and Scenario 2 are equivalent, they were integrated into Scenario 1. The further examination was done for Scenarios 1 and 3. Sub-step 1b. Enforcement of applicable laws and regulations There is no law or standard that restricts use of the fossil fuels above, and it is likely that use of fossil fuels continues into the future. The price of fuel oil increased as a result of gradual reduction government subsidies for fuel oil in 2005, driving transition from oil to coal more in Indonesia and affecting the coal price. The emission gas from coal combustion in the PT. Semen Padang satisfies the laws and regulations. In this project, it will be done and monitored based on the laws and regulations as it is currently done. Step 2. Investment analysis Because Step 3 is selected, this step does not have to be examined. Step 3. Barrier analysis Sub-step 3a. Identify barriers that would prevent the implementation of type of the proposed project activity: (1) Investment barrier: The proposed project is not economically attractive without additional contribution from CDM. If there is no revenue from CER, the project IRR for 10 years is negative, -4.51%. It is -0.23% even when USD5.0/ton-CO2 is taken into consideration, indicating existence of an investigation barrier. To examine investigation effects in an abbreviated manner, only the EFB carbonization project is taken into account. That is, it is assumed that the carbonization business receives EFBs from the palm oil mill, carbonizes them, and sells the resulting fuel to the cement manufacturer. Scenario 1 Scenario 3 Scenario 3 CER credit N/A exclude include Investment N/A USD 8.6 million USD 8.6 million Project life time N/A 10 years 10 years Project IRR N/A -4.5% -0.23 %

PROJECT DESIGN DOCUMENT FORM (CDM PDD) - Version 02 CDM – Executive Board page 11
This template shall not be altered. It shall be completed without modifying/adding headings or logo, format or font.
(b) Technological barrier: Because the characteristics of the carbonized fuel are equivalent to those of coal, there is no technological barrier in mixed combustion with coal in the cement kiln. The carbonization technology to manufacture the carbonized fuel from EFBs itself is a proven technology as carbonization of waste in Japan, but the technology to change biomass into carbonized fuels stably without inputting external heat energy may have experimental aspects. (c) Barrier due to prevailing practice: This project, inputting biomass carbonized fuels to the cement kiln as a substitute for coal, is the first trial of its kind, not limited to Indonesia. No other enterprises have knowledge about manufacturing of carbonized fuels and inputting them into the cement kiln. Sub-step 3b. Identify barriers would not prevent the implementation of at least one of the alternatives: The other fuels mentioned in scenario 2 are fuels that have been commonly used in the cement industry and thus the technologies has been developed and applied elsewhere. Therefore, the above listed barriers do not strongly affect the alternatives. Step 4. Common practice analysis There is at least one project, which try to utilise palm shell in the cement industry in Indonesia. However in the planed project, palm shell will be directory burnt in the cement kiln as an alternative fuel. No other activities similar to the proposed project, which carbonise the waste biomass, have been implemented or are currently underway in the cement industries in Indonesia. The proposed project activity is covering only one cement factory. Most of palm oil mill, palm shell is utilised as a boiler fuel in own mill for electricity and steam in-house use. If there is any excess shell, it is sold in the market for small boiler and so on. As no other similar projects have been identified, it can be concluded that the common practice is to continue the use of coal in the Indonesian cement industry. Step 5. Impact of CDM registration The approval and registration of the CDM project activity will alleviate financial hurdles and the identified barriers that will enable the project to be undertaken. Below is the explanation of the impacts of the CDM registration. * Contribute to the company environmental policy to reduce anthropogenic greenhouse gas emission
reductions by development of CDM project * Additional income from CER is required in order to make the project economically viable. * The project activity improves the environmental condition such as reducing the particulate emissions
surrounding of the palm oil mill. * Reducing the consumption of Indonesian coal in domestically. It can be concluded that the project is additional as:

PROJECT DESIGN DOCUMENT FORM (CDM PDD) - Version 02 CDM – Executive Board page 12
This template shall not be altered. It shall be completed without modifying/adding headings or logo, format or font.
- it is not viable without economic contribution from CDM - there are barriers for the project implementation - and common practice is it to use and continue to use coal as main fuel in the cement industries, which is
the baseline to the proposed project activity. B.4. Description of how the definition of the project boundary related to the baseline methodology selected is applied to the project activity: >>
In this project, CDM combines the generator of EFBs and consumer of the carbonized fuel. Manufacturing of the carbonized fuel is treated as pre-processing for alternative fuels for coal, and the project boundary is the cement factory. The schematic is shown below. This project considers ECF co-combustion with coal in the kiln. Amount of ECF and coal used will be recorded and emissions will be calculated according to the approved methodology. In the carbonization process of EFBs, fuels and electric power are consumed upon startup of the plant, and GHG is emitted in the transportation process of ECF and coal. These elements are outside of the project boundary, which only includes mixing of ECF and coal and combustion in the kiln. B.5. Details of baseline information, including the date of completion of the baseline study and the name of person (s)/entity (ies) determining the baseline: >> Date of completing the final draft of this baseline section: 10/04/06. Name of person/entity determining the baseline: Hidekazu Kasai / Manager of business control of power plant division Ishikawajima-Harima Heavy Industries Co., Ltd., Tokyo, Japan 1-1, Toyosu 3-chome, Koto-ku, Tokyo 135-8710 TEL: 03-6204-7800
Fuel Mixing Kiln
Project boundary
Carbonising of EFB and pruned leaves at Palm Oil Mill
ECF Transportation
ECF Storage
Fossil fuel (Coal) storage
Fossil fuel Transportation
PROJECT DESIGN DOCUMENT FORM (CDM PDD) - Version 02 CDM – Executive Board page 13
This template shall not be altered. It shall be completed without modifying/adding headings or logo, format or font.
The above entity is included as project participant in Annex 1. SECTION C. Duration of the project activity / Crediting period C.1 Duration of the project activity: C.1.1. Starting date of the project activity: >> Starting date of the project: 01/01/2008 C.1.2. Expected operational lifetime of the project activity: >>
10 years C.2 Choice of the crediting period and related information: C.2.1. Renewable crediting period C.2.1.1. Starting date of the first crediting period: >> N.A. C.2.1.2. Length of the first crediting period: >> N.A. C.2.2. Fixed crediting period: C.2.2.1. Starting date: >> The credit period starts on the starting date of the project, which is 01/01/2008. C.2.2.2. Length: >> 10 years SECTION D. Application of a monitoring methodology and plan D.1. Name and reference of approved monitoring methodology applied to the project activity: >> Approved monitoring methodology ACM0003, “Emissions reduction through partial substitution of fossil fuels with alternative fuels in cement manufacture”
PROJECT DESIGN DOCUMENT FORM (CDM PDD) - Version 02 CDM – Executive Board page 14
This template shall not be altered. It shall be completed without modifying/adding headings or logo, format or font.
D.2. Justification of the choice of the methodology and why it is applicable to the project activity: >> The project meets the criteria of this monitoring methodology. The detail description is explained in Annex 4. The methodology ACM0003 is applicable to the cement industry with the following conditions: Fossil fuel(s) used in cement manufacture are partially replaced by the following alternative fuels:
(a) Wastes originating from fossil sources, such as tires, plastics, textiles from polymers, or rubber; The carbonized fuel used in this project is produced from EFB, not from fossil sources.
(b) Biomass residues where they are available in surplus and would in the absence of the project activity
be dumped or left to decay or burned in an uncontrolled manner without utilizing them for energy purposes; The carbonized fuel used in this project replaces about 5% of the consumed heat value of coal. Currently, the EFB to be used as a raw material for the carbonized fuel is incinerated and not used effectively. The steam and power required in the CPO process is supplied by the shells and fibres discarded from the CPO process as EFB which are used as the boiler fuel. There is a surplus of shells and fibres for the steam and power demands.
CO2 emissions reduction relates to CO2 emissions generated from fuel burning requirements only
and is unrelated to the CO2 emissions from decarbonisation of raw materials (i.e. CaCO3 and MgCO3 bearing minerals); The carbonized fuel replaces coal combustion in the cement manufacturing process.
The methodology is applicable only for installed capacity (expressed in tonnes clinker/year) that
exists by the time of validation of the project activity; In this project, the carbonization plant is newly constructed, but the carbonized fuel is used in the existing cement kiln. This project does not consider any future addition of kilns.
The amount of alternative fuels available for the project is at least 1.5 times the amount required to
meet the consumption of all users consuming the same alternative fuels, i.e. the project and other alternative fuel users. (←This criterion require extra caution.) This project does not meet the 4th criterion. Currently, EFB energy is not utilized at all, not limited to the CPO mill. That is, there is no user consuming EFB. Therefore, this criterion is regarded unnecessary.

PROJECT DESIGN DOCUMENT FORM (CDM PDD) - Version 02 CDM – Executive Board page 15
This template shall not be altered. It shall be completed without modifying/adding headings or logo, format or font.
D.2. 1. Option 1: Monitoring of the emissions in the project scenario and the baseline scenario D.2.1.1. Data to be collected in order to monitor emissions from the project activity, and how this data will be archived: ID number (Please use numbers to ease cross-referencing to D.3)
Data variable
Source of data
Data unit
Measured (m), calculated (c) or estimated (e)
Recording frequency
Proportion of data to be monitored
How will the data be archived? (electronic/ paper)
Comment
1 Clinker production amount
PTSP Ton m Monthly (aggregate)
100% Electronic / paper
Minimum of two years after last issuance of CERs
2 Amount of ECF consumed
Project record
Ton-ECF m Monthly (aggregate)
100% Electronic / paper
Minimum of two years after last issuance of CERs
3 Amount of coal consumed
PTSP Ton-Coal m Monthly (aggregate)
100% Electronic / paper
Minimum of two years after last issuance of CERs
4 Heating value of ECF
Project record
MJ/kg m Minimum of 4 time per 1 year
- Electronic / paper
Minimum of two years after last issuance of CERs
5 Heating value of Coal
PTSP MJ/kg m Minimum of 4 time per 1 year
- Electronic / paper
Minimum of two years after last issuance of CERs
6 Carbon content of ECF
Project record
wt% m Minimum of 4 time per 1 year
- Electronic / paper
Minimum of two years after last issuance of CERs
7 Carbon content of Coal
PTSP wt% m Minimum of 4 time per 1 year
- Electronic / paper
Minimum of two years after last issuance of CERs
D.2.1.2. Description of formulae used to estimate project emissions (for each gas, source, formulae/algorithm, emissions units of CO2 equ.) >>

PROJECT DESIGN DOCUMENT FORM (CDM PDD) - Version 02 CDM – Executive Board page 16
This template shall not be altered. It shall be completed without modifying/adding headings or logo, format or font.
CO2 emission from Fuel combustion Yearly CO2 released from Coal = Coal used by project × Calorific value × CO2 emission factor (ton-CO2/year) (ton/year) (TJ/ton) (ton-CO2/TJ) Yearly CO2 released from ECF = ECF used by project × Calorific value × CO2 emission factor (ton-CO2/year) (ton/year) (TJ/ton) (ton-CO2/TJ) ECF is made from biomass, therefore CO2 released from ECF does not need to count as GHG emission from project activity. CH4 emissions due to anaerobic decomposition of EFB on field Yearly CH4 emission (LWCH4) = QAF-L×DOC×DOCF×MCF×F×C× (1-OX)×NFL×GWP_CH4 (ton-CO2/year) QAF-L : amount of EFB used as alternative fuel that would be piled outdoors in the absence of the project (ton/year) DOC : degradable organic carbon content of EFB (%) DOCF : portion of DOC that is converted to landfill gas (0.77 default value) MCF : methane conversion factor fro landfill (0.4 default value) F : fraction of CH4 in landfill gas (0.5 default value) C : carbon to methane conversion factor (16/12) OX : oxidation factor (default is 0) NFL : non-flared portion of the landfill gas produced (%) GWP_CH4 : global warming potential of methane (21)

PROJECT DESIGN DOCUMENT FORM (CDM PDD) - Version 02 CDM – Executive Board page 17
This template shall not be altered. It shall be completed without modifying/adding headings or logo, format or font.
GHG emissions from off-site transport of ECF Step 1: Total distance travelled for ECF = Total ECF consumed ÷ Truck capacity × distance to supply site (km/year) (ton/year) (ton/truck) (km) Step 2: Emission factor = CO2 emission factor + CH4 emission factor × GWP_CH4 + N2O emission factor ×GWP_N2O (ton-CO2/km) (ton-CO2/km) (ton-CH4/km) (ton-CO2/ton-CH4) (ton-N2O/km) (ton-CO2/ton-N2O) Step 3: Yearly emission = Emission factor × total distance travelled (ton-CO2/year) (ton-CO2/km) (km/year) CO2 emission from fossil fuel for plant start-up Yearly emission = Consumed light fuel oil × Heating value of light fuel oil × Emission factor (ton-CO2/year) (ton/year) (GJ/ton) (ton-CO2/GJ) CO2 emission from grid electricity consumption for plant operation Yearly emission = Consumed grid electricity × CO2 emission factor (ton-CO2/year) (MWh/year) (ton-CO2/MWh)

PROJECT DESIGN DOCUMENT FORM (CDM PDD) - Version 02 CDM – Executive Board page 18
This template shall not be altered. It shall be completed without modifying/adding headings or logo, format or font.
D.2.1.3. Relevant data necessary for determining the baseline of anthropogenic emissions by sources of GHGs within the project boundary and how such data will be collected and archived :
ID number (Please use numbers to ease cross-referencing to table D.3)
Data variable
Source of data
Data unit
Measured (m), calculated (c), estimated (e),
Recordingfrequency
Proportion of data to
be monitored
How will the data be archived? (electronic/
paper)
Comment
N/A
D.2.1.4. Description of formulae used to estimate baseline emissions (for each gas, source, formulae/algorithm, emissions units of CO2 equ.) >> Step 1: Coal used in the baseline = Coal used by project + ECF used by project× Calorific value of ECF ÷ Calorific value of Coal (ton/year) (ton/year) (ton/year) (TJ/ton) (TJ/ton) Step 2: Yearly CO2 released = Coal used in the baseline × Calorific value × CO2 emission factor (ton-CO2/year) (ton/year) (TJ/ton) (ton-CO2/TJ) D. 2.2. Option 2: Direct monitoring of emission reductions from the project activity (values should be consistent with those in section E). N/A – Option 1 above is applied.

PROJECT DESIGN DOCUMENT FORM (CDM PDD) - Version 02 CDM – Executive Board page 19
This template shall not be altered. It shall be completed without modifying/adding headings or logo, format or font.
D.2.2.1. Data to be collected in order to monitor emissions from the project activity, and how this data will be archived: ID number(Please use numbers to ease cross-referencing
to table D.3)
Data variable
Source of data
Data unit
Measured (m), calculated (c), estimated (e),
Recordingfrequency
Proportion of data to
be monitored
How will the data be archived? (electronic/
paper)
Comment
N/A
D.2.2.2. Description of formulae used to calculate project emissions (for each gas, source, formulae/algorithm, emissions units of CO2 equ.): >> N/A
PROJECT DESIGN DOCUMENT FORM (CDM PDD) - Version 02 CDM – Executive Board page 20
This template shall not be altered. It shall be completed without modifying/adding headings or logo, format or font.
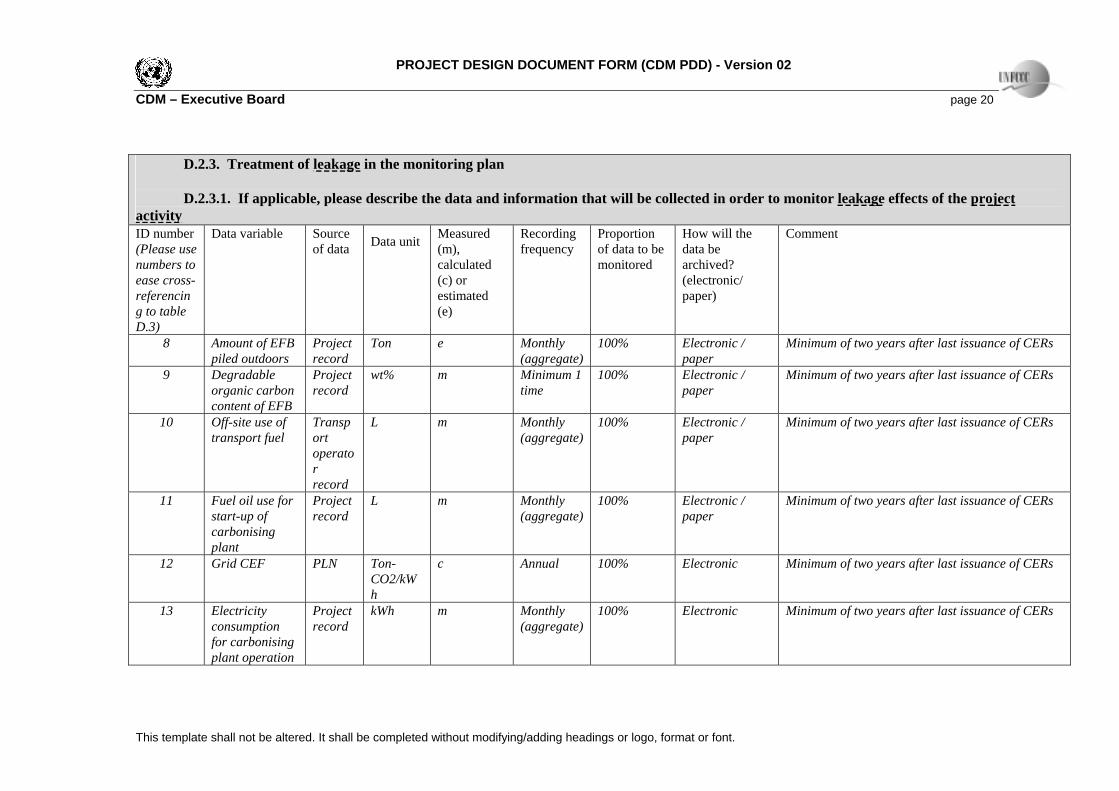
D.2.3. Treatment of leakage in the monitoring plan D.2.3.1. If applicable, please describe the data and information that will be collected in order to monitor leakage effects of the project activity ID number(Please use numbers to ease cross-referencing to table D.3)
Data variable
Source of data Data unit Measured
(m), calculated (c) or estimated (e)
Recording frequency
Proportion of data to be monitored
How will the data be archived? (electronic/ paper)
Comment
8 Amount of EFB piled outdoors
Project record
Ton e Monthly (aggregate)
100% Electronic / paper
Minimum of two years after last issuance of CERs
9 Degradable organic carbon content of EFB
Project record
wt% m Minimum 1 time
100% Electronic / paper
Minimum of two years after last issuance of CERs
10 Off-site use of transport fuel
Transport operator record
L m Monthly (aggregate)
100% Electronic / paper
Minimum of two years after last issuance of CERs
11 Fuel oil use for start-up of carbonising plant
Project record
L m Monthly (aggregate)
100% Electronic / paper
Minimum of two years after last issuance of CERs
12 Grid CEF PLN Ton-CO2/kWh
c Annual 100% Electronic Minimum of two years after last issuance of CERs
13 Electricity consumption for carbonising plant operation
Project record
kWh m Monthly (aggregate)
100% Electronic Minimum of two years after last issuance of CERs
PROJECT DESIGN DOCUMENT FORM (CDM PDD) - Version 02 CDM – Executive Board page 21
This template shall not be altered. It shall be completed without modifying/adding headings or logo, format or font.
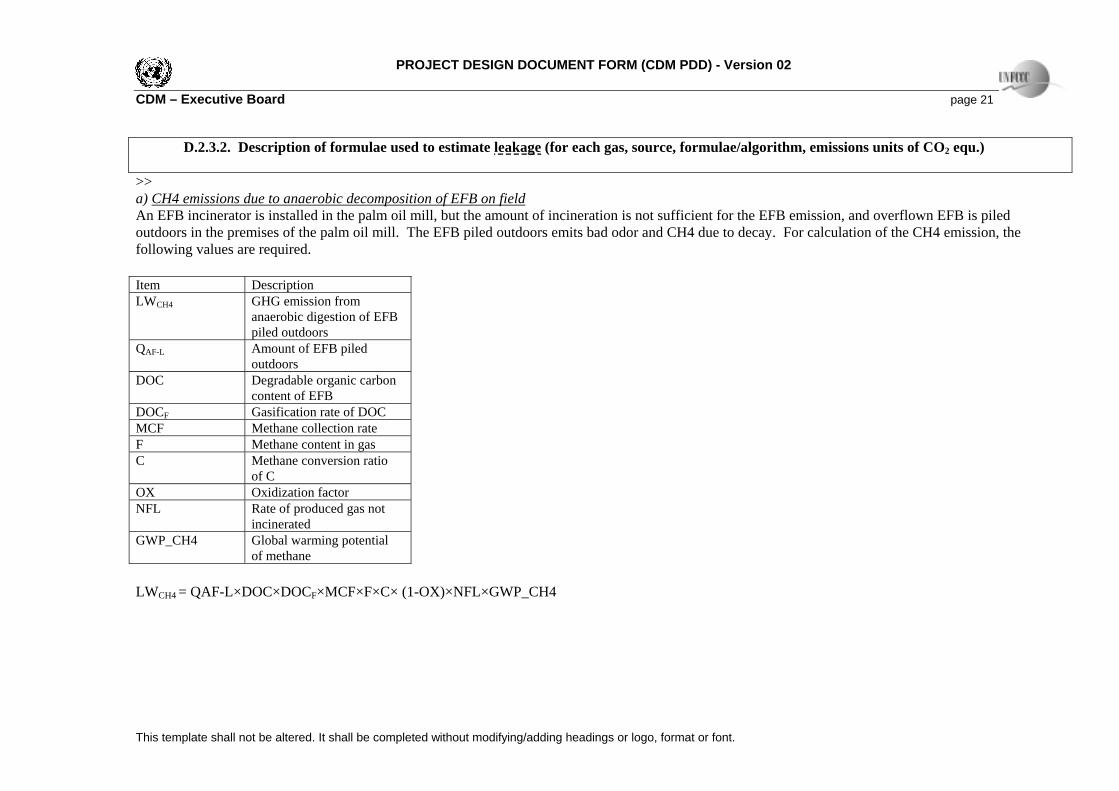
D.2.3.2. Description of formulae used to estimate leakage (for each gas, source, formulae/algorithm, emissions units of CO2 equ.) >> a) CH4 emissions due to anaerobic decomposition of EFB on field An EFB incinerator is installed in the palm oil mill, but the amount of incineration is not sufficient for the EFB emission, and overflown EFB is piled outdoors in the premises of the palm oil mill. The EFB piled outdoors emits bad odor and CH4 due to decay. For calculation of the CH4 emission, the following values are required. Item Description LWCH4 GHG emission from
anaerobic digestion of EFB piled outdoors
QAF-L Amount of EFB piled outdoors
DOC Degradable organic carbon content of EFB
DOCF Gasification rate of DOC MCF Methane collection rate F Methane content in gas C Methane conversion ratio
of C OX Oxidization factor NFL Rate of produced gas not
incinerated GWP_CH4 Global warming potential
of methane LWCH4 = QAF-L×DOC×DOCF×MCF×F×C× (1-OX)×NFL×GWP_CH4

PROJECT DESIGN DOCUMENT FORM (CDM PDD) - Version 02 CDM – Executive Board page 22
This template shall not be altered. It shall be completed without modifying/adding headings or logo, format or font.
b) GHG emissions from off-site transport of ECF A B C=(B/5)×A D E=C/D F G=E×F Transportation distance(km)
Amount of carbonized fuel (ton)
Transportation distance of 20ton truck (km)
Fuel consumption of truck (km/t)
Total fuel consumption of truck (ton)
Emission factor t-CO2/t-Fuel IPCC
CO2 emission (t-CO2/year)
c) CO2 emission from fossil fuel for plant start-up Heat source of the carbonization plant does not require new additional energy in normal operation because it uses the pyrolysis gas emitted in the carbonization process of EFB and pruned leaves to be carbonized. However, light oil is required to start up the plant. A B C=A×B D E F=C×D×(E×106) Light oil consumption upon startup (ton/times)
Annual number of times of startup (times)
Light oil consumption for startup(ton/year)
Heating value of light oil (MJ/ton)
Emission factor (t-CO2/TJ) IPCC
CO2 emission (t-CO2/year)
d) CO2 emission from grid electricity consumption for plant operation The GHG emission of the system power consumed in the operation of the carbonization plant needs to be calculated. CO2 emission due to system power consumption = GHG emission factor of the system power × power consumption of the plant D.2.4. Description of formulae used to estimate emission reductions for the project activity (for each gas, source, formulae/algorithm, emissions units of CO2 equ.) >> a) Combustion emission from ECF and Coal burning Yearly CO2 released from Coal = Coal used by project × Calorific value × CO2 emission factor (ton-CO2/year) (ton/year) (TJ/ton) (ton-CO2/TJ)

PROJECT DESIGN DOCUMENT FORM (CDM PDD) - Version 02 CDM – Executive Board page 23
This template shall not be altered. It shall be completed without modifying/adding headings or logo, format or font.
Yearly CO2 released from ECF = ECF used by project × Calorific value × CO2 emission factor (ton-CO2/year) (ton/year) (TJ/ton) (ton-CO2/TJ) b) Leakage Based on the calculation formula as described in D.2.3 above. D.3. Quality control (QC) and quality assurance (QA) procedures are being undertaken for data monitored Data (Indicate table and ID number e.g. 3.-1.; 3.2.)
Uncertainty level of data (High/Medium/Low)
Explain QA/QC procedures planned for these data, or why such procedures are not necessary.
1 Low This data is already a part of QA/QC system in PTSP. 2 Low The measurement equipment will be newly installed for this project and be included into PTSP QA/QC system. 3 Low This data is already a part of QA/QC system in PTSP. 4 Low This data will be obtained from the standard analysis procedure and has enough accuracy. 5 Low This data will be obtained from the standard analysis procedure and has enough accuracy. 6 Low This data will be obtained from the standard analysis procedure and has enough accuracy. 7 Low This data will be obtained from the standard analysis procedure and has enough accuracy. 8 High EFB piled outdoors is equal to the overflowed EFB. This amount is estimated value. 9 High If the IPCC default value was applied, this data is fixed value. But the data accuracy is low when this data is
obtained from the experimental method. 10 Medium The data quality depends on the transport operator. 11 Low Meter with industrial standard will be newly installed for this project. 12 Low This data can be available from the official report from the power generation company. 13 Low Meter with industrial standard will be newly installed for this project.

PROJECT DESIGN DOCUMENT FORM (CDM PDD) - Version 02 CDM – Executive Board page 24
This template shall not be altered. It shall be completed without modifying/adding headings or logo, format or font.
D.4 Please describe the operational and management structure that the project operator will implement in order to monitor emission reductions and any leakage effects, generated by the project activity >> Data collection for monitoring is performed by the enterprises performing the carbonized fuel manufacturing operation. The plant manager is responsible, and the management such as the Board of Directors (BOD) has the ultimate responsibility. In the carbonized fuel manufacturing operation, the quality assurance department is assigned for monitoring of raw material acceptance and fuel characteristics. The quality assurance department also checks the quality of the base data for calculation of GHG for CDM. Data is collected from the following 3 entiries. If deviation from the estimated values is excessive, the cause needs to be examined and a check for errors is to be performed. ① PTSP ② Carrier ③ OWN company D.5 Name of person/entity determining the monitoring methodology:
>> The contact information for the entity that has determined the monitoring methodology is given below. Hidekazu Kasai / Manager of business control of Power Plant Division Ishikawajima-Harima Heavy Industries Co., Ltd., Tokyo, Japan 1-1, Toyosu 3-chome, Koto-ku, Tokyo 135-8710 TEL:03-6204-7800 The above entity is included as project participant in Annex 1.

PROJECT DESIGN DOCUMENT FORM (CDM PDD) - Version 02 CDM – Executive Board page 25
This template shall not be altered. It shall be completed without modifying/adding headings or logo, format or font.
SECTION E. Estimation of GHG emissions by sources E.1. Estimate of GHG emissions by sources: >> CO2 emissions from Coal combustion and from ECF combustion are considered for the project activity. ECF is made from biomass and its combustion is considered carbon free. Therefore ECF combustion does not produce any GHG. The following GHG emissions must be considered within the project boundary. a) Combustion emission from ECF and Coal burning The yield of the carbonization furnace is calculated as 49.5% on an anhydrous biomass basis based on a carbonization experiment. The amount of carbide produced is 20,560 ton/year. The characteristics are specified as follows based on the experimental result.
Item Carbonized fuel (wt%) Water 0.0 Ash 11.1 C Carbon 66.78 H Hydrogen 4.50 N Nitrogen 1.46 O Oxygen 15.76 S Sulfur 0.18 Cl Chlorine 0.22
Characteristics
Total 100.00 Heating value (TJ/ton) 0.02563
Therefore, the CO2 emission factor of ECF is 95.5 = 0.6678×44/12 / 0.02563 (ton-CO2/TJ). a) Combustion emission from ECF and Coal burning The project requires 341,449 tons of Coal and 20,560 tons for yearly clinker production. Yearly CO2 released from Coal = Coal used by project × Calorific value × CO2 emission factor (ton-CO2/year) (ton/year) (TJ/ton) (ton-CO2/TJ) = 341,449 × 0.02533 × 94.6 = 818,186 (ton-CO2/year) Yearly CO2 released from ECF = ECF used by project × Calorific value × CO2 emission factor (ton-CO2/year) (ton/year) (TJ/ton) (ton-CO2/TJ) = 20,560 × 0.02563 × 95.5 = 50,323 (ton-CO2/year) ECF is made from biomass, therefore CO2 released from ECF does not need to count as GHG emission from project activity.

PROJECT DESIGN DOCUMENT FORM (CDM PDD) - Version 02 CDM – Executive Board page 26
This template shall not be altered. It shall be completed without modifying/adding headings or logo, format or font.
Annual CO2 released = 818,186 (ton-CO2/year) E.2. Estimated leakage: >> The main source of potential leakage from this project is GHG emissions from ECF production process. The carbonising process is shown in the following drawing. The process requires the small amount light oil only for a start-up process and does not require any other fuel during ordinarily operation. The following GHG emissions are considered as Leakages on this project. a) CH4 emissions due to anaerobic decomposition of EFB on field An EFB incinerator is installed in the palm oil mill, but the amount of incineration is not sufficient for the EFB emission, and overflown EFB is piled outdoors in the premises of the palm oil mill. The EFB piled outdoors emits bad odor and CH4 due to decay. For calculation of the CH4 emission, the following values are required. Item Description Value Unit Source LWCH4 GHG emission from anaerobic
digestion of EFB piled outdoors -8,731 ton-
CO2e/year
QAF-L Amount of EFB piled outdoors 6,750 ton/year Currently checking
DOC Degradable organic carbon content of EFB
0.3 - Value for wood and straw
DOCF Gasification rate of DOC 0.77 - IPCC default MCF Methane collection rate 0.4 - IPCC default F Methane content in gas 0.5 - IPCC default C Methane conversion ratio of C 16/12 - OX Oxidization factor 0 - IPCC default NFL Rate of produced gas not incinerated 1 - GWP_CH4 Global warming potential of methane 21 - LWCH4 = QAF-L×DOC×DOCF×MCF×F×C× (1-OX)×NFL×GWP_CH4 = 6,750×0.3×0.77×0.4×0.5×16/12× (1-0)×1×21 = 8,731 t-CO2e/year b) GHG emissions from off-site transport of ECF
Stack
Steam
ECF
Raw materials
Dryer Carboniser
Combustor Boiler
Recycle gas

PROJECT DESIGN DOCUMENT FORM (CDM PDD) - Version 02 CDM – Executive Board page 27
This template shall not be altered. It shall be completed without modifying/adding headings or logo, format or font.
The assumed installation location of the carbonization plant is a palm farm. The carbonized fuel produced there is consumed in a cement factory 120km away. Because of a low specific gravity of the carbonized fuel, 5 tons of carbonized fuel is carried by a 20-ton truck. A B C=(B/5)×A D E=C/D F G=E×F Transportation distance(km)
Amount of carbonized fuel (ton)
Transportation distance of 20ton truck(km)
Fuel consumption of truck (km/t)
Total fuel consumption of truck (ton)
Emission factor t-CO2/t-Fuel IPCC
CO2 emission (t-CO2/year)
120 20,560 493,440 2,500 198 3.21 636 c) CO2 emission from fossil fuel for plant start-up Heat source of the carbonization plant does not require new additional energy in normal operation because it uses the pyrolysis gas emitted in the carbonization process of EFB and pruned leaves to be carbonized. However, use of light oil is required to start up the plant. A B C=A×B D E F=C×D×(E
×106) Light oil consumption upon startup (ton/times)
Annual number of times of startup (times)
Light oil consumption for startup(ton/year)
Heating value of light oil (MJ/ton)
Emission factor (t-CO2/TJ) IPCC
CO2 emission (t-CO2/year)
22 1 22 42.71 74.1 0.07 d) CO2 emission from grid electricity consumption for plant operation In operation of the carbonization plant, electric power is consumed by the ventilator, kiln, grinder, and boiler auxiliary machine. The power consumption is 80kWh/t-biomass×85,960 = 6,869,440 kWh/year. The CO2 emission from the system power in Indonesia is as shown in the table below. Fuel type or generation type
A: Percentage in grid(%)
B: Emission factor (kg-CO2/kWh)
C=A×B (kg-CO2/kWh)
Heavy Fuel Oil 1.38 0.721 0.0099 Light Fuel Oil 8.86 0.717 0.0635 Coal 52.58 0.930 0.4890 Natural Gas Simple cycle
0.00 0.610 0.0
Natural Gas Combined cycle
28.05 0.398 0.1116
Hydro 9.14 0.0 0.0 Renewable Energy 0.00 0.0 0.0 Total 100 - 0.6740 CO2 emission due to system power consumption = 0.6740×6,869,440/1,000 = 4,630 ton/year Leakage GHG = -8,731 + 636 + 0.07 + 4,630 = -3,465 t-CO2e/year

PROJECT DESIGN DOCUMENT FORM (CDM PDD) - Version 02 CDM – Executive Board page 28
This template shall not be altered. It shall be completed without modifying/adding headings or logo, format or font.
E.3. The sum of E.1 and E.2 representing the project activity emissions: >> The emissions from the project activity are given in the table below. Year 2008 2009 2010 2011 2012 2013 2014 2015 2016 2017 Project emissions (as per E.1)
818,186 818,186 818,186 818,186 818,186 818,186 818,186 818,186 818,186 818,186
Leakage (as per E.2)
-2,667 -2,667 -2,667 -2,667 -2,667 -2,667 -2,667 -2,667 -2,667 -2,667
Sum of above E.1 & E.2
814,721 814,721 814,721 814,721 814,721 814,721 814,721 814,721 814,721 814,721
E.4. Estimated anthropogenic emissions by sources of greenhouse gases of the baseline: >> As described in the accompanying baseline methodology, the following GHG emissions are considered for the baseline. a) Combustion emission from Coal burning 362,253 ton/year coal is required for clinker production. Yearly CO2 released from Coal = Coal used by project × Calorific value × CO2 emission factor (ton-CO2/year) (ton/year) (TJ/ton) (ton-CO2/TJ) = 362,253 × 0.02533 × 94.6 = 868,037 (ton-CO2/year) b) On-site transportation emissions of Coal About 5% of total heat input is replaced by ECF and coal consumption is reduced accordingly, so the GHG emission from transportation of coal is reduced. However, the amount of GHG is so small that calculation and measurement are difficult, so it is not included in GHG reduction, which is conservative. The baseline emission is given in the table below. Year 2008 2009 2010 2011 2012 2013 2014 2015 2016 2017 Baseline emissions, ton-CO2/year
868,037 868,037 868,037 868,037 868,037 868,037 868,037 868,037 868,037 868,037
E.5. Difference between E.4 and E.3 representing the emission reductions of the project activity: >>

PROJECT DESIGN DOCUMENT FORM (CDM PDD) - Version 02 CDM – Executive Board page 29
This template shall not be altered. It shall be completed without modifying/adding headings or logo, format or font.
The difference between E.4 and E.3, representing the emission reductions of the project activity, is given in the table below. Year 2008 2009 2010 2011 2012 2013 2014 2015 2016 2017 Baseline emissions, ton-CO2/year, E.4
868,037 868,037 868,037 868,037 868,037 868,037 868,037 868,037 868,037 868,037
Project emissions, ton-CO2/year, E.3
814,721 814,721 814,721 814,721 814,721 814,721 814,721 814,721 814,721 814,721
CERs, ton-CO2/year, E.4-E.3
53,316 53,316 53,316 53,316 53,316 53,316 53,316 53,316 53,316 53,316
Total CERs 533,160 E.6. Table providing values obtained when applying formulae above: >> Values obtained when applying the formulae are given below. Year Project activity
Emissions, ton-CO2/year
Baseline emissions, ton-CO2/year
Leakage, ton-CO2/year Emission reduction, ton-CO2/year
2008 814,721 868,037 -3,465 53,316 2009 814,721 868,037 -3,465 53,316 2010 814,721 868,037 -3,465 53,316 2011 814,721 868,037 -3,465 53,316 2012 814,721 868,037 -3,465 53,316 2013 814,721 868,037 -3,465 53,316 2014 814,721 868,037 -3,465 53,316 2015 814,721 868,037 -3,465 53,316 2016 814,721 868,037 -3,465 53,316 Total 8,147,210 8,680,370 -34,650 533,160

PROJECT DESIGN DOCUMENT FORM (CDM PDD) - Version 02 CDM – Executive Board page 30
This template shall not be altered. It shall be completed without modifying/adding headings or logo, format or font.
SECTION F. Environmental impacts F.1. Documentation on the analysis of the environmental impacts, including transboundary impacts: >> The project activity is considered to have negligible impact on the environment. Analysis of environmental impact will be carried out later. F.2. If environmental impacts are considered significant by the project participants or the host Party, please provide conclusions and all references to support documentation of an environmental impact assessment undertaken in accordance with the procedures as required by the host Party: >> No negative environmental impacts have been identified by the project participants. SECTION G. Stakeholders’ comments >> This project activity will replace EFB carbonised fuel for some part of coal consumption of the existing coal consuming cement production plant. As mentioned above sections, the environmental impact of the project is not significant on the surrounding environment and community. Meetings should be held again upon project implementation. G.1. Brief description how comments by local stakeholders have been invited and compiled: >> The project boundary is cement production activity in the PT. Semen Padang. This time, a stakeholder meeting was held in the PT. AMP Plantation where the carbonization plant is installed for question and answer as well as collection of comments via questionnaires. Stakeholder Meeting in PT. AMP Plantation An invitation letter is sent from the PT. AMP Plantation to the persons listed below, and a meeting was held on December 7, 2005 in a meeting room of the PT. AMP Plantation.
1. The local government authority represented ・Environmental Protection Agency of West Sumatra Province ・City Government of Agam Region ・Head of Agam Sub-District ・Head of Jorong - Kandis Village
2. Informal Community Leaders and local community 3. NGO
Stakeholder Meeting in PT. Semen Padang

PROJECT DESIGN DOCUMENT FORM (CDM PDD) - Version 02 CDM – Executive Board page 31
This template shall not be altered. It shall be completed without modifying/adding headings or logo, format or font.
An invitation letter is sent from the PT. Semen Padang to the persons listed below, and a meeting was held on February 9, 2006 in a meeting room of Bumi Minang Hotel in Pedang.
1. The local government authority represented ・Environmental Protection Agency of West Sumatra Province ・Environmental Protection Agency of Padang City ・Representative of Padang Mayor ・Representative of Padang National Land Bureau ・Representative of Department of Industry, Energy and Mining ・Head of Indarung Sub-District ・Head of Indarung Village, Lubuk Kilangan District
2. Informal Community Leaders and local community 3. Academician (Andalas University) 4. Journalists (local newspaper and national newspaper)
G.2. Summary of the comments received: >> The questions received in each of the stakeholder meetings are listed below. Stakeholder Meeting in PT. AMP Plantation 1. Mr. Syamsudin (Environmental Protection Agency of West Sumatra Province)
a. The EPA of West Sumatra Province is very supportive with this project. Currently, most of the EFBs disposal in Palm Oil Mill is through incineration process that generates a high amount of particulate matter that could cause the decline of air quality in the surrounding area.
b. Could you please explain further about the carbonization process? If the process needs energy for heating, where does it come from? What kind of waste that will be generated from the process? And what is the effect on the environment?
c. If the bio-fuel will be used for the cement industry, will it affect the condition in the stack? (The gas emission from the cement industry-red.), because usually if the cement industry uses low-quality-coal, it will effect the emission gas quality.
d. If the CDM project goes through and the project is rewarded a funding from the CER credit, will it be distributed only for project developers or the government will also received the funding?
e. Why is the project period last until 2012? Why it took so long? f. What about Environmental Impact Assessment (EIA)? Will it be PDD first or EIA first? g. Could you please explain more on Kyoto Protocol and 21st Agenda?
2. Mr. Ismal (City Government of Agam Region) a. This project will need a special meeting between the city governments with PT. AMP
Plantation to discuss it further. What is the city share on this project? And what is the city government role?
b. From CPO production, which chain of process that generates the most waste? And why can’t it be reduced?
c. Why do you choose carbonization process? Why don’t you process it using organic process? d. If the Japanese government must lower their GHGs emission by 6% annually, what is the
benefit to the city government if this project goes through? e. Most of the problems in this area (PT. AMP Plantation. red) are the waste water from POME.
Why not concentrate on processing this type of waste? 3. Dr. H Bandaro (Informal Community Leaders)
PROJECT DESIGN DOCUMENT FORM (CDM PDD) - Version 02 CDM – Executive Board page 32
This template shall not be altered. It shall be completed without modifying/adding headings or logo, format or font.
a. From the community leaders point of view, basically we agreed that the EFB waste problems must be solved
b. The leaders will need a special session to discuss it further between the leaders, city government, and PT. AMP Plantation.
4. Mr. Faisal (Environmental Protection Agency of Agam Region) a. PT. AMP since it’s inception have not perform an Environmental Impact Assessment, and
according to the Governor Decree, every business that is required to perform an EIA that had been operating before 1 January 2000 but have not yet perform an EIA, is compulsory to make DPL (Environmental Management Document). This DPL have similar process compared to EIA but simpler.
5. Mr. Gamblang (Local community) a. The surrounding community of PT. AMP Plantation has suffered the negative effect of the
waste water and the flue gas from the CPO production. If this project goes through, how can you be sure that the pollution in the surrounding areas can be reduced?
b. Up until now, many surrounding community does not yet have access to clean water. We collect clean water from rainwater, but if you look into the rainwater tank, the sedimentation is very thick (± 30 cm in rainy season and ± 60 cm in dry season). This is because the high particulate matter discharged from incineration process. We hope that if this project can substitute the incineration process, the flue gas won’t worsen our environmental quality.
Stakeholder Meeting in PT. Semen Padang 1. Mr. Indang Dewata (Environmental Protection Agency City of Padang, West Sumatra Province)
a. In my opinion, I strongly support the concept of energy conversion of Bio-fuel to substitute coal at PT Semen Padang.
b. Why the concept of Project Design Document (PDD) is compulsory ? What its law foundation, in fact we have the AMDAL (Environmental Impact Assessment) already ?
c. We have sent PT. Semen Padang a letter asking the revised AMDAL. What is the responce ?
2. Mr. Yantonius (Environmental Protection Agency of West Sumatra Province) a. We strongly support the concept of energy conservation at PT semen Padang; b. From the environmental requirements, the decree of Minister of Environment (Kepmen
KLH) No.13 ,1995 regarding Standard of Emission, the Electrostatic Precipitator (EP) of unit 2 and 3 of PT Semen Padang should be modified.
c. Particulate emission of bio-fuel vs. coal of EP requires SEMDAL since it is not appropriate anymore? Will particulate emission from bio-fuel plant change ?
d. How long the supply of EFB will be available ? 3. Marhadi Zein (National Land Bureau)
a. In principle I support this project. For your information, at present there are 450,000 ha of palm oil plantation at West Sumatera with the period of Enterprise Utilization Right is from 1 to 35 years for the first phase, 25 years for the second phase and 35 years for the third phase.
b. Why should this project with PT AMP only and is it possible also to others? 4. Mr. Alfian (Department of Industry, Mining & Energy of Padang City)
b. I agree with this project since there will be a transfer of technology and this also shows that PT. Semen Padang cares of environment.
c. With this project won’t it cause a higher cost ? 5. Mr. Yantonius (Environmental Protection Agency of West Sumatra Province)
a. This is a repeated question regarding particulate issue, how is the EP performance under coal ?
PROJECT DESIGN DOCUMENT FORM (CDM PDD) - Version 02 CDM – Executive Board page 33
This template shall not be altered. It shall be completed without modifying/adding headings or logo, format or font.
G.3. Report on how due account was taken of any comments received: >> For the questions above, the following answers were given in the meetings. Stakeholder Meeting in PT. AMP Plantation 1. Mr. Dzulham (PT. AMP Plantation)
a. Because this project is still on an FS phase, the coordination with the city government won’t be necessary, but once the project has achieved final decision, there will be coordination between the local governments with PT. AMP Plantation.
2. Mr. Sahat (PT. AMP Plantation) a. This project will not go through without the consent of all stakeholders and all of the
discussions will be held transparently. 3. Mr. Dzulham
a. Waste water from POME will be treated by using land application, in cooperation with Andalas University.
4. Mr. Tamura (IHI) a. On this planning stage, the EFB process is still focuses on carbonization. For heating process,
fuel will be used only for start up process, afterward there won’t be needed extra fuel. The emission gas will also be used for heating process.
b. Effluent gas that will be emitted from the carbonization process will be less polluted then the current process. Also, we will install a bag filter to reduce the amount of particulate matter emission.
c. Shareholders of this project are still need to be determined later, because the project is still on an FS phase.
d. Bio fuel composition is similar with carbon composition so the effect, if it used, will be similar too.
5. Dr. Lolo Panggabean and Dr. Petrus Panaka (YBUL) a. CDM project is only concentrate on the reduction of GHGs emission and not other pollutants. b. A CER buyer wants a long-term contract so that is why the contract can be extended until
2012. c. PDD construction can be started anytime, but before the implementation of the projects,
there has to be an Environmental Impact Assessment first in accordance with the government regulation.
6. Mr. Sahat: a. At this time, PT. AMP Plantation have performed UKL and UPL documents and reported to
EPA of West Sumatra Province therefore they won’t need a DPL document. But in order to make things straight, this matter requires a special session between EPA of West Sumatra Province, EPA of Agam Resion and PT. AMP Plantation.

PROJECT DESIGN DOCUMENT FORM (CDM PDD) - Version 02 CDM – Executive Board page 34
This template shall not be altered. It shall be completed without modifying/adding headings or logo, format or font.
7. Mr. Tamura (IHI) a. If this project goes through, particulate mater in the flue gas will be significantly reduced.
8. Mr. Sahat: a. This project is one of our efforts to reduce the particulate emission from the incineration
process. From the environmental monitoring activity, our gas emission is still in the range with the environmental standards. On access of clean water, we will follow up this matter to top management
9. Mr. Lolo: a. The CDM projects specially focuses on the proposed project and the process that will be
substituted. It is our job (YBUL) to gather the comments and feedbacks from all stakeholders of this project.
Stakeholder Meeting in PT. Semen Padang 1. Mr. Minto (PT.Semen Padang)
a. Regarding letter from the Environmental Protection Agency City of Padang, West Sumatra Province) (Bapedalda) we will convey this message to Environment Department of PT.Semen Padang (Mr. Novril);
b. The reduction of particulate emission from EPs will be carried out in stages; c. The revised AMDAL is being carried out with the cooperation of UNAND and now we are
waiting of the results/report. 2. Mr. Tamura (IHI)
a. The particulate emission will not change since the use of biomass is only 5% from the total use of coal.
b. At present, the existing incinerators at PT. AMP do not apply special treatment therefore the amount of gas and particulate emitted directly into open air is also high. However, by convert it to biofuel plant we don’t need incinerators anymore and the emission (mg/m3) will be much lower;
c. We will also work with other companies, but for now just with PT AMP since this the first project.
d. In principle the use of bio-fuel will be cheaper than coal. This project is the first time in Indonesia, IHI will ask for Japanese Government to support in the investment of this project.
3. Mr. Petrus Panaka (YBUL) a. Regarding the compulsory concept of PDD is required by the Executive Board (EB) of
UNFCC when we propose a CDM project. Whereas document of AMDAL or RPL and RKL will require when we propose for constructing a plant which will have an impact to the environment. This document is issued by the Ministry of Environment.
4. Mr. Yusril Yahya (Environmental Division of PT. Semen Padang) a. Regarding AMDAL, currently we are discussing periodically in the internal of PT. Semen
Padang; b. We have received a letter from Bapedalda Padang city since a week ago and now is in the
process. We will inform the progress to Bapedalda Padang City.
PROJECT DESIGN DOCUMENT FORM (CDM PDD) - Version 02 CDM – Executive Board page 35
This template shall not be altered. It shall be completed without modifying/adding headings or logo, format or font.
5. Mr. Petrus Panaka (YBUL) a. In practice, the performance of EP will be satisfy if particulate (fly ash) diameter greater than
5 micron and if less than that the fines can escape through EP and emit to the air, however, recently research data in Japan shows if coal mixed with biomass, the fly ash generated will be fused together and form the bigger size so that EP can do the job well in retaining the fines escape to the air.
6. Mr. Minto (PT. Semen Padang) a. The survey/research on the impact of health surrounding the factory will be carried out in
stages (It has stages) b. The location of bio-fuel plant will not be at PT Semen Padang.
7. Mr. Tamura (IHI) a. The palm oil waste is mainly EFB. The percentage of biomass is 5%; b. The plant will not generate neither solid waste nor liquid waste, but gas which is cleaner than
present come out from the incinerators. 8. Mr. Petrus Panaka (YBUL)
a. The monitoring methodology should be stated in PDD since CER can be sold to the CER buyers and the buyers would like to know in detail how the monitoring is performed.

PROJECT DESIGN DOCUMENT FORM (CDM PDD) - Version 02 CDM – Executive Board page 36
This template shall not be altered. It shall be completed without modifying/adding headings or logo, format or font.
Annex 1
CONTACT INFORMATION ON PARTICIPANTS IN THE PROJECT ACTIVITY Organization: Ishikawajima-Harima Heavy Industries Co., Ltd. Street/P.O.Box: 2-16, Toyosu 3-chome Building: City: Tokyo State/Region: Koto-ku Postfix/ZIP: 135-8733 Country: Japan Telephone: +81-3-6204-7504 FAX: +81-3-6204-8788 E-Mail: [email protected] URL: www.ihi.co.jp Represented by: Hidekazu Kasai Title: Manager of Business development, Power Plant Division Salutation: Mr. Last Name: Masato Middle Name: First Name: Tamura Department: Research and development Department, Power Plant Division Mobile: Direct FAX: +81-3-6204-7506 Direct tel: +81-3-6204-8788 Personal E-Mail: [email protected]
PROJECT DESIGN DOCUMENT FORM (CDM PDD) - Version 02 CDM – Executive Board page 37
This template shall not be altered. It shall be completed without modifying/adding headings or logo, format or font.
Annex 2
INFORMATION REGARDING PUBLIC FUNDING
There is no public fund involved in this project.
PROJECT DESIGN DOCUMENT FORM (CDM PDD) - Version 02 CDM – Executive Board page 38
This template shall not be altered. It shall be completed without modifying/adding headings or logo, format or font.
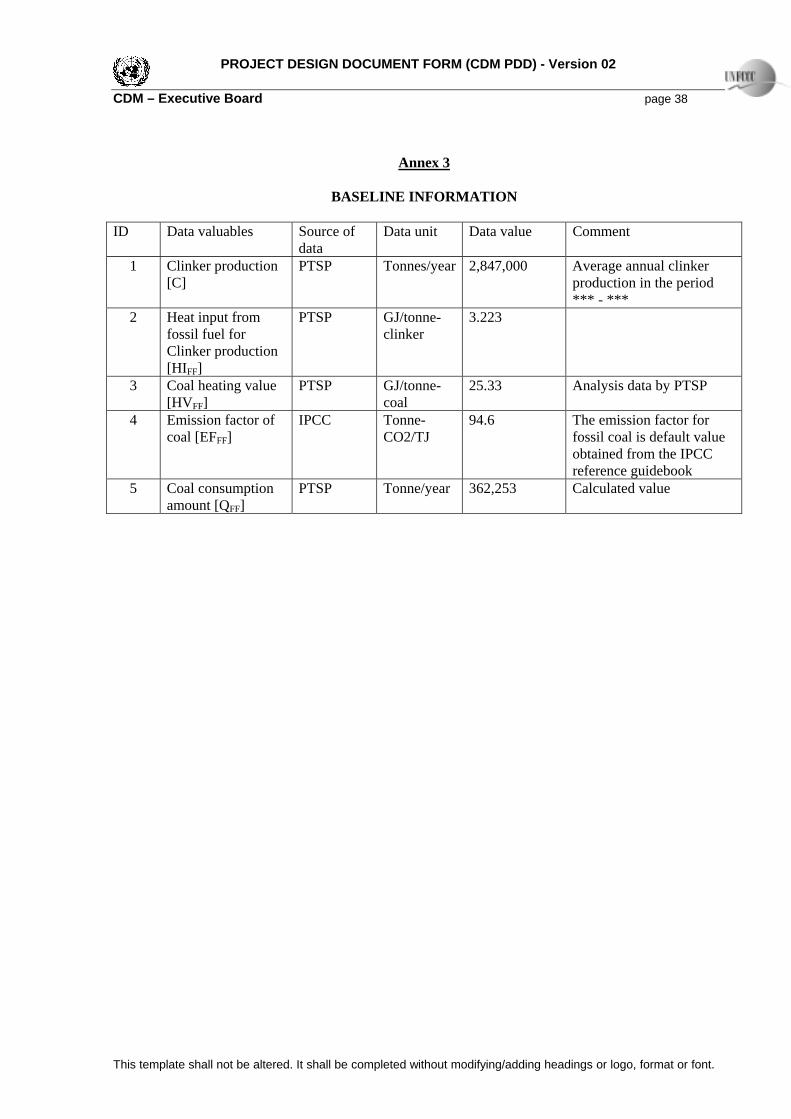
Annex 3
BASELINE INFORMATION
ID Data valuables Source of
data Data unit Data value Comment
1 Clinker production [C]
PTSP Tonnes/year 2,847,000 Average annual clinker production in the period *** - ***
2 Heat input from fossil fuel for Clinker production [HIFF]
PTSP GJ/tonne-clinker
3.223
3 Coal heating value [HVFF]
PTSP GJ/tonne-coal
25.33 Analysis data by PTSP
4 Emission factor of coal [EFFF]
IPCC Tonne-CO2/TJ
94.6 The emission factor for fossil coal is default value obtained from the IPCC reference guidebook
5 Coal consumption amount [QFF]
PTSP Tonne/year 362,253 Calculated value

PROJECT DESIGN DOCUMENT FORM (CDM PDD) - Version 02 CDM – Executive Board page 39
This template shall not be altered. It shall be completed without modifying/adding headings or logo, format or font.
Annex 4
MONITORING PLAN
The monitoring data is collected from production reports from the cement manufacturers and palm oil mills. This data, along with the data collected in this project, is managed by the plant manager and approved by the BOD. The table below shows monitored parameters source of reference and frequency of monitoring. ID number
Data variable Source of data
Data unit Frequency of monitoring
Comment
2 Amount of ECF consumed
Project record
Ton-ECF Monthly 1) This value is required to calculate the GHG emission reductions from coal to ECF.
3 Amount of Coal consumed
PTSP Ton Monthly 1) This figure is required to estimate share of alternative fuels.
4 Heating value of ECF
Project record
MJ/kg Min. 4 times per 1 year
1) This figure is required to estimate share of alternative fuels. 2) Heating value is based on as-fired basis.
5 Heating value of Coal
PTSP MJ/kg Min. 4 times per 1 year
1) This figure is required to estimate share of alternative fuels. 2) Heating value is based on as-fired basis. 3) IPCC lower heat values can be used if no data is available.
6 Carbon content of ECF
Project record
wt% Min. 4 times per 1 year
1) This value is required to calculate GHG emission.
7 Carbon content of Coal
PTSP wt% Min. 4 times per 1 year
1) This value is required to calculate GHG emission. 2) IPCC emission factor can be used for GHG emission calculation with ID No.5, if no data is available.

PROJECT DESIGN DOCUMENT FORM (CDM PDD) - Version 02 CDM – Executive Board page 40
This template shall not be altered. It shall be completed without modifying/adding headings or logo, format or font.
Appendix 1
OVERVIEW OF PALM CRUDE OIL PRODUCTION PROCESS
Palm trees become mature in 5 years after being planted, and FFB can be gathered for about 20 years after that. The following diagram shows the production process of palm oil.
The FFB brought to the palm oil mill is steamed after measurement. This makes separation of the fruits easier and prevents deterioration of CPO due to oxygen deactivation. Oil is obtained by compression of the fruits, and seeds and fibres are eliminated. Seeds consist of shells and cores, and shells after collection of kernel oil are eliminated as process waste. Because shells and fibres have lower water content than the EFB, they are consumed as fuel for the house boiler. The EFB has higher water content due to the steaming, and is incinerated in most palm oil mills or mulched in farms. The EFB is incinerated in the palm oil mills of this project. About 10% of the EFB overflows the incineration capacity and piled outdoors. The material balance is shown below.
CPO production processFFB 100
CPO FFB×0.203
Fibre FFB×0.130
Shell FFB×0.078
EFB FFB×0.220 (of which×0.022 is piled outdoors)
FFB Steaming Fruit
EFB
Compression CPO Refin
ing
POME
seed
fibre
Compression Kernel oil
shell
Incineration Fuel for house boiler
Outdoor piling

PROJECT DESIGN DOCUMENT FORM (CDM PDD) - Version 02 CDM – Executive Board page 41
This template shall not be altered. It shall be completed without modifying/adding headings or logo, format or font.
Appendix 2
OVERVIEW OF CEMENT PRODUCTION PROCESS
The cement production process consists of 3 processes; ① grinding of raw materials, ② firing, and ③finish. ①Grinding of raw materials The raw materials such as limestone, clay, and slag are ground to the specified granularity using the roller mill. ②Firing After heating by the preheating equipment, clinker is generated by high-temperature firing in the rotary kiln. ③Finish The clinker is mixed with a small amount of plaster, and then ground by the ball mill to become cement. The CO2 emission from the cement production process consists of emission from firing of limestone and emission from burning of powdered coal fed into the kiln as a heat source. In this project, about 5wt% of the powdered coal consumption used as a heat source for the kiln is replaced with the EFB carbonized fuel.
Limestone
Roller Mill Calcination Incinera
tionClay
Slag
Ball Mill
Plaster
Grinding of raw materials
Firing Finish

PROJECT DESIGN DOCUMENT FORM (CDM PDD) - Version 02 CDM – Executive Board page 42
This template shall not be altered. It shall be completed without modifying/adding headings or logo, format or font.
Appendix 3
SD policy
The presentation material of the Energy and Mineral Resources Minister at ECOLOGICAL POWER GENERATION 2005 held in Jakarta on January 19, 2005 is provided below.

PROJECT DESIGN DOCUMENT FORM (CDM PDD) - Version 02 CDM – Executive Board page 43
This template shall not be altered. It shall be completed without modifying/adding headings or logo, format or font.

PROJECT DESIGN DOCUMENT FORM (CDM PDD) - Version 02 CDM – Executive Board page 44
This template shall not be altered. It shall be completed without modifying/adding headings or logo, format or font.