Embed Size (px)
Citation preview

PROJECT DESIGN DOCUMENT FORM (CDM PDD) - Version 03.1.
CDM – Executive Board page 1
CLEAN DEVELOPMENT MECHANISM
PROJECT DESIGN DOCUMENT FORM (CDM-PDD)
Version 03 - in effect as of: 28 July 2006
CONTENTS
A. General description of project activity
B. Application of a baseline and monitoring methodology
C. Duration of the project activity / crediting period
D. Environmental impacts
E. Stakeholders’ comments
Annexes
Annex 1: Contact information on participants in the project activity
Annex 2: Information regarding public funding
Annex 3: Baseline information
Annex 4: Monitoring Plan
Annex 5: Malaysian National CDM Criteria
Appendix 1: Analytical Method for estimating decay factor “k”
PROJECT DESIGN DOCUMENT FORM (CDM PDD) - Version 03.1.
CDM – Executive Board page 2
SECTION A. General description of project activity
A.1 Title of the project activity:
>>
Inno-Abedon - Palm Oil Mill Waste Recycle Scheme, Malaysia
Version number: 1.0
Date: December 19th
2007
A.2. Description of the project activity:
>>
Project background
The growth of the palm oil industry in Malaysia has been phenomenal over the last 50 years. From
merely 54,000 hectares in 1960 to 4 million hectares in 2005, when over 70 million tonnes of fresh fruit
bunches (“FFB”) were processed and 15 million tonnes of crude palm oil (“CPO”) produced. The
process of extracting CPO in the palm oil mills (“POM”) produces a large amount of wastes
predominately in the form of empty fruit bunches (“EFB”) – 23% of FFB, palm oil mills effluents
(“POME”) – 0.70m3 per tonne FFB and decanter sludge – approximately 3% of FFB. As a result of the
remote locations of palm oil mills in general, these wastes, especially POME, which has an extremely
high content of degradable organic matter, may have adverse pollution impact in the event that they are
not treated properly. There are also the environmental implications and typical environmental problems
associated with plantation agriculture ie. soil erosion and water pollution due to application of chemical
fertilisers and pesticides.
Objective of the project activity
The objective of the project is to provide a total waste treatment solution for the Abedon Oil Mill Sdn
Bhd (“Abedon”) palm oil mill located near Sandakan in the state of Sabah, Malaysia, whereby the project
activity will build, operate and own a waste treatment plant next to the palm oil mill. The project activity
will:
1) use the bioorganic solid waste EFB(100%), decanter sludge (100%) and 60% of the
pre-treated (as described in point 2) organic wastewater POME via an In-Vessel co-
composting facility integrated with a special bio-formulation technology, to turn these
waste into bio-organic fertiliser that will be utilized on the plantations that supply the
mill with FFB. This bio-organic fertilizer has a commercial market in the palm oil
plantations, fruits and vegetables farms in Malaysia and the region;
2) pre-treat 100% of organic wastewater POME using a suspended solids removal
treatment to eliminate the solid particles and reduce the Chemical Oxygen Demand
(“COD”) content before application to the co-composting process. The sludge
resulting from this pre-treatment process will be added to bio-organic solid waste mix.
The remaining 40% of the pre-treated POME will pass through an aerobic pond
system to achieve a final discharge with a BOD and COD level meeting the regulatory
requirement.
The key by-product of this waste treatment process is the identified blends of bio-organic fertiliser that
will be sold and used by the surrounding palm oil estates, thus providing a full recycle of the waste
resources back to the plantations that produce the FFB.
Greenhouse gas mitigation potential
Due to the prevailing practices and associated high cost of transportation (in remote locations), the EFB
bio-mass is commonly piled up in the vicinity of the palm oil mills or on landfill sites on the mill
plantation and left to decay, which leads to uncontrolled methane emission and putrid odours. Common
practice is also to treat POME in deep anaerobic lagoons before discharge, releasing a further large
quantity of methane into the atmosphere in an uncontrolled manner.
PROJECT DESIGN DOCUMENT FORM (CDM PDD) - Version 03.1.
CDM – Executive Board page 3
The project activity will reduce greenhouse gas emissions by reducing methane emissions from the
rotting EFB waste piles and anaerobic POME treatment lagoons.
Sustainable development contribution of the project activity
The project will contribute to sustainable development in the Malaysia Palm Oil Industry through:
(1) Comprehensive recycling of palm oil process waste. The project activities encourage the
effective use of bio-technology to deal with the large amount of agricultural/green waste from the
palm oil process for the production of bio-organic fertilisers that will be recycled back to the
plantations.
(2) Due to the efficacy of these bio-organic fertilisers, this recycle process will enable a significant
reduction in the use of chemical fertilisers by the plantations. This reduction in chemical
fertilisers’ usage will reduce the amount of these to be transported into these remote locations.
Malaysia imports most of its chemical fertilisers. The use of these bio-organic fertilisers will
also improve the soil conditions and plant health.
(3) Bio-organic fertilizers reduce chemical fertilizer run off that is causing extensive problems in
rivers and estuaries in Sabah and the Malaysian peninsula.
Environmental benefits and sustainable rural development
This project is in line with the Malaysian Government’s direction in the 9th Malaysian Plan published in
2006, in which the government encourages privately led sustainable development in agro-based industry
and bio-technology through environmentally friendly waste treatment and recycling. Chapter 22 of the 9th
Malaysian Plan states that: “Greater focus will be placed on preventive measures to mitigate negative
environmental effects at source, intensifying conservation efforts and sustainable management of natural
resources. Emphasis will be given to the fostering of closer cooperation between stakeholders in
addressing environmental concerns.”
The availability of a consistent supply of single-sourced uncontaminated bio-organic fertilisers will also
contribute to the sustainable development in the agricultural sector especially in the production of
greener/organic food crops in palm oil plantations and in local rural communities. The project activity
also provides additional employment opportunities for local communities.

PROJECT DESIGN DOCUMENT FORM (CDM PDD) - Version 03.1.
CDM – Executive Board page 4
A.3. Project participants:
>>
Name of Party involved (*)
((host) indicates a host Party)
Private and/or public
entity(ies)
project participants (*)
(as applicable)
Kindly indicate if
the Party involved
wishes to be
considered as
project participant
(Yes/No)
Malaysia (host) Inno Integrasi Sdn Bhd
(Private Entity)
No
UK Climate Change Capital Carbon
Fund II S.à r.l
(Private Entity)
No
(*) In accordance with the CDM modalities and procedures, at the time of making the CDM-PDD public
at the stage of validation, a Party involved may or may not have provided its approval. At the time of
requesting registration, the approval by the Party(ies) involved is required.
A.4. Technical description of the project activity:
A.4.1. Location of the project activity:
>>
Abedon Palm Oil Mill
A.4.1.1. Host Party(ies):
>>
Malaysia
A.4.1.2. Region/State/Province etc.:
>>
State of Sabah, Malaysia
A.4.1.3. City/Town/Community etc:
>>
Near the town of Sandakan, Sabah
A.4.1.4. Detail of physical location, including information allowing the
unique identification of this project activity (maximum one page):
>>
The waste treatment plant is located on-site, next to a palm oil mill owned and operated by Abedon Oil
Mill Sdn Bhd (“Abedon”) at Kawasan Kg Paris, KM122 Sandakan-Lahad Datu Highway, Kinabatangan,
Sabah.

PROJECT DESIGN DOCUMENT FORM (CDM PDD) - Version 03.1.
CDM – Executive Board page 5
A.4.2. Category(ies) of project activity:

PROJECT DESIGN DOCUMENT FORM (CDM PDD) - Version 03.1.
CDM – Executive Board page 6
>>
The category of the project activity is: 13 – Waste Handling and Disposal
A.4.3. Technology to be employed by the project activity:
>>
The two main technologies employed by the project activity, 1) In-Vessel biomass composting and 2)
waste water pre-treatment using a suspended solids separator, are proven technologies, and are known to
be environmentally friendly and safe. However, the deployment of these technologies in the palm oil
industry is still in its early stages. The project developers intend to combine these processes into an
integrated technology for one-stop treatment on palm oil process wastes.
The project activity will involve the construction and operation of a waste treatment plant next to the
existing Abedon palm oil mill, thereby reducing transport costs for the waste materials used in the
treatment process. The waste treatment plant will consist of a pre-composting section, in-vessel
composting, and post-composting sections with a total covered area of approximately 0.8 hectares. The
plant layout is shown in the following figure.
Waste water treatment process
All of the raw POME discharge from the palm oil mill will be pre-treated via suspended solids
separators. This process will separate suspended solids in POME to capture nutrient solids to feed into
composting pre-mix and substantially reduce the BOD/COD of the pre-treated POME. The pre-treated
POME will be injected into composting vessel in the automated process to maintain constant moisture
content in the composting feedstock. As the In-Vessel composting process consumes some 60% of the

PROJECT DESIGN DOCUMENT FORM (CDM PDD) - Version 03.1.
CDM – Executive Board page 7
pre-treated POME, the remaining 40% of de-sludged POME will be treated in aerobic lagoons and/or
recycled back to the estate as irrigation water. In the aerobic lagoons or in land application the bulk of the
remaining BOD/COD in the POME is converted to CO2 without the formation of methane. The treatment
plant process and follow up aerobic treatment of some 40% of the pre-treated POME essentially treats all
of the POME effluent (including the decanter sludge – a first stage pre-treatment of the POME) under
aerobic conditions.
In-Vessel biomass composting
The waste EFBs from the palm oil mill will be shredded to a predetermined size in the pre-composting
section and then mixed with sludge (from both decanter and suspended solids removal treatment) and
boiler ash. The resulting biomass mixture will then be transferred by front end loader into the In-Vessel
composting tunnels and piled into heaps of approx 2 m height along the full width (6 m) and length (25
m) of the tunnels. Once filled the tunnel will be sealed off and the air blowers started under computer
control to ensure optimum composting process conditions according to a pre-determined batch
processing temperature schedule. The composting process is activated using a mixture of specially
formulated microorganisms mixed with the pre-treated POME and sprayed on to the composting heap.
The computer managed control system will enable completion of the composting process in the vessel in
2 to 4 weeks by careful control of oxygen levels in the biomass as well as the temperature and moisture
levels. At the high temperatures in the process large quantities of POME are sprayed onto the composting
waste and evaporated, thereby maintaining the optimum moisture levels. After 2 to 4 weeks the
composted waste will be removed by a front end loader from the vessel and matured in piles for a further
7 days to allow the curing process to continue and temperature to reduce by natural cooling.
Feed Stock preparation In-Vessel co-composting Curing
After the maturation period the composted waste is mixed with special bio-formulations and then bagged
for distribution to the plantation or other end users. The process will utilise 100% of the EFB, 100% of
sludges (from decanter and suspended solids removal treatment) and 60% of the pre-treated POME. The
In-Vessel co-composting process flow diagram is shown below.

PROJECT DESIGN DOCUMENT FORM (CDM PDD) - Version 03.1.
CDM – Executive Board page 8
Diagram 1 : In-Vessel co-composting process flow diagram
Operation and maintenance training requirements
The project activity will require both high skilled and medium/low skilled work force in order to operate
the proposed technology and maintain the facilities and installations.
While a majority of the less skilled workers is expected to be outsourced from the existing staff operating
the palm oil mill, these workers will receive specific training including training on the following matters:
- Purpose of the project and objective of the project activities
- General description of the operation of the composting facility
- Operation and maintenance of individual equipment and mechanical elements
- Quality control and quality assurance procedures
- Recording of performance metrics
- Health and security issues
More skilled workers will be selected among the trained resources available in the country. It is expected
that the technical staff will be a combination of mechanical engineers and biologists. Mechanical
engineers will manage on site operations as well as ensure the quality of the operation and final product.
The bio-technology experts will be in charge of supervising the application of the bio-formulations to
ensure the maximum benefits. The project participants intend to retain qualified and experienced
personnel that are ready to start operations soon after the project implementation. While training
requirements will be reduced it is expected that project specific information sessions as well as training
from equipment manufacturers will be required. Time and ad hoc training will be provided to all staff
members to ensure the optimal ability in the operation of the different segments that form the project
activities.
Consultants to the project, as well as servicing contracts from vendors and equipment manufacturers will
be arranged to ensure the optimal operation of the plant and to maximize the reliability of operations to
achieve up to a 95% plant availability during the crediting period.
Personnel, training and maintenance provisions have been made for the duration of the project and have
been included in the viability analysis of the project
PROJECT DESIGN DOCUMENT FORM (CDM PDD) - Version 03.1.
CDM – Executive Board page 9
A.4.4 Estimated amount of emission reductions over the chosen crediting period:
>>
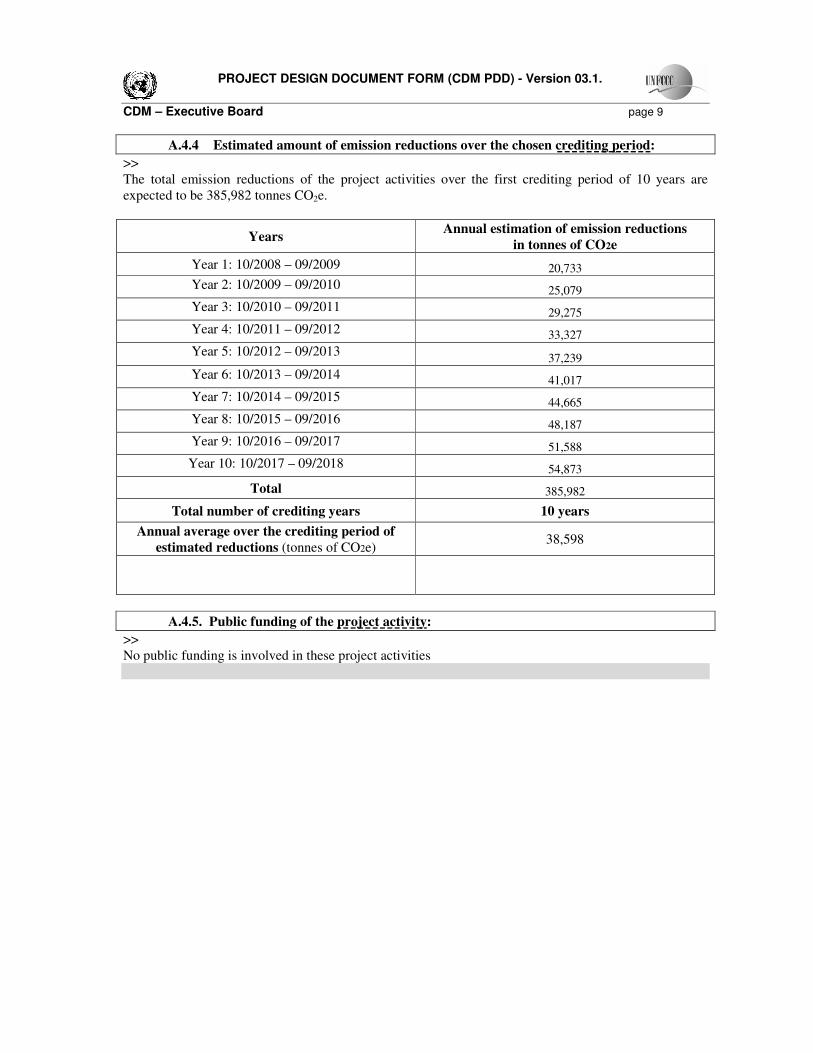
The total emission reductions of the project activities over the first crediting period of 10 years are
expected to be 385,982 tonnes CO2e.
Years Annual estimation of emission reductions
in tonnes of CO2e
Year 1: 10/2008 – 09/2009 20,733
Year 2: 10/2009 – 09/2010 25,079
Year 3: 10/2010 – 09/2011 29,275
Year 4: 10/2011 – 09/2012 33,327
Year 5: 10/2012 – 09/2013 37,239
Year 6: 10/2013 – 09/2014 41,017
Year 7: 10/2014 – 09/2015 44,665
Year 8: 10/2015 – 09/2016 48,187
Year 9: 10/2016 – 09/2017 51,588
Year 10: 10/2017 – 09/2018 54,873
Total 385,982
Total number of crediting years 10 years
Annual average over the crediting period of
estimated reductions (tonnes of CO2e) 38,598
A.4.5. Public funding of the project activity:
>>
No public funding is involved in these project activities
PROJECT DESIGN DOCUMENT FORM (CDM PDD) - Version 03.1.
CDM – Executive Board page 10
SECTION B. Application of a baseline and monitoring methodology
B.1. Title and reference of the approved baseline and monitoring methodology applied to the
project activity:
>>
The approved baseline and monitoring methodology AM0039, version 2, “Methane emissions reduction
from organic waste water and bioorganic solid waste using co-composting” is applied to this project
activity.
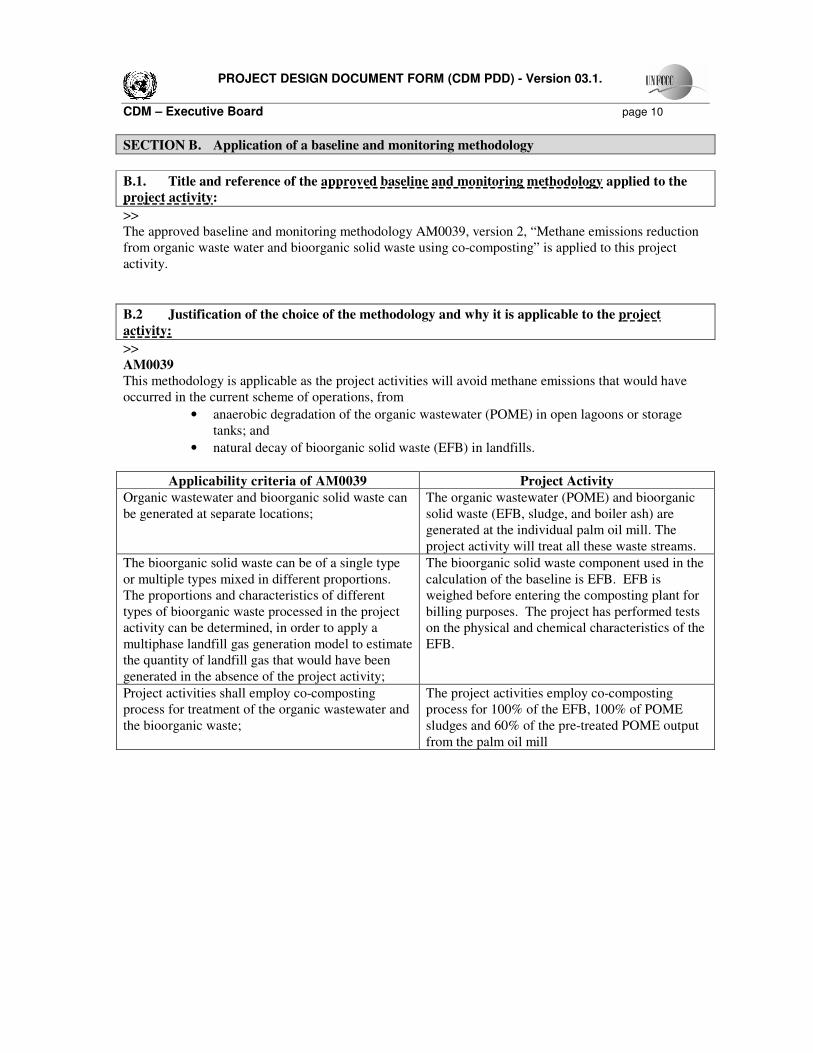
B.2 Justification of the choice of the methodology and why it is applicable to the project
activity:
>>
AM0039
This methodology is applicable as the project activities will avoid methane emissions that would have
occurred in the current scheme of operations, from
• anaerobic degradation of the organic wastewater (POME) in open lagoons or storage
tanks; and
• natural decay of bioorganic solid waste (EFB) in landfills.
Applicability criteria of AM0039 Project Activity
Organic wastewater and bioorganic solid waste can
be generated at separate locations;
The organic wastewater (POME) and bioorganic
solid waste (EFB, sludge, and boiler ash) are
generated at the individual palm oil mill. The
project activity will treat all these waste streams.
The bioorganic solid waste can be of a single type
or multiple types mixed in different proportions.
The proportions and characteristics of different
types of bioorganic waste processed in the project
activity can be determined, in order to apply a
multiphase landfill gas generation model to estimate
the quantity of landfill gas that would have been
generated in the absence of the project activity;
The bioorganic solid waste component used in the
calculation of the baseline is EFB. EFB is
weighed before entering the composting plant for
billing purposes. The project has performed tests
on the physical and chemical characteristics of the
EFB.
Project activities shall employ co-composting
process for treatment of the organic wastewater and
the bioorganic waste;
The project activities employ co-composting
process for 100% of the EFB, 100% of POME
sludges and 60% of the pre-treated POME output
from the palm oil mill
PROJECT DESIGN DOCUMENT FORM (CDM PDD) - Version 03.1.
CDM – Executive Board page 11
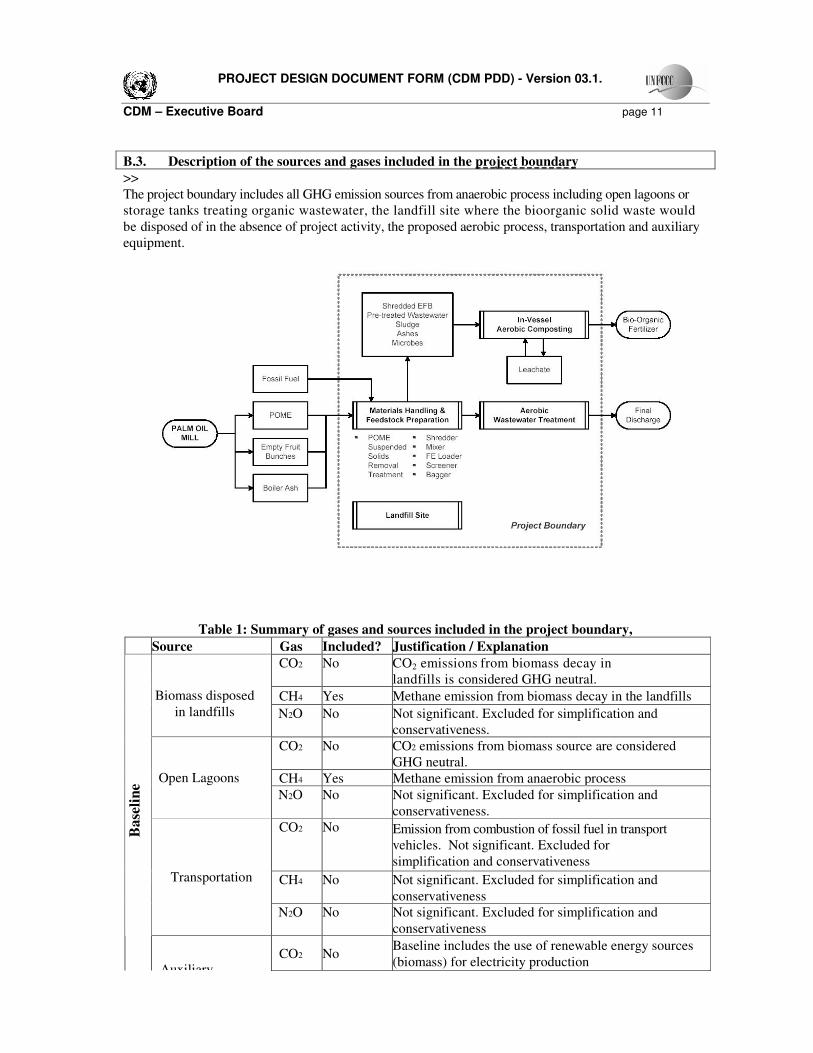
B.3. Description of the sources and gases included in the project boundary
>>
The project boundary includes all GHG emission sources from anaerobic process including open lagoons or
storage tanks treating organic wastewater, the landfill site where the bioorganic solid waste would
be disposed of in the absence of project activity, the proposed aerobic process, transportation and auxiliary
equipment.
Table 1: Summary of gases and sources included in the project boundary,
Source Gas Included? Justification / Explanation
CO2 No CO2 emissions from biomass decay in
landfills is considered GHG neutral.
CH4 Yes Methane emission from biomass decay in the landfills Biomass disposed
in landfills N2O No Not significant. Excluded for simplification and
conservativeness.
CO2 No CO2 emissions from biomass source are considered
GHG neutral.
CH4 Yes Methane emission from anaerobic process Open Lagoons
N2O No Not significant. Excluded for simplification and
conservativeness.
CO2 No Emission from combustion of fossil fuel in transport
vehicles. Not significant. Excluded for
simplification and conservativeness
CH4 No Not significant. Excluded for simplification and
conservativeness
Transportation
N2O No Not significant. Excluded for simplification and
conservativeness
Ba
seli
ne
Auxiliary
CO2 No Baseline includes the use of renewable energy sources
(biomass) for electricity production

PROJECT DESIGN DOCUMENT FORM (CDM PDD) - Version 03.1.
CDM – Executive Board page 12
CH4 No Not significant. Excluded for simplification and
conservativeness
N2O No
Not significant. Excluded for simplification and
conservativeness
Source Gas Included? Justification / Explanation
CO2 No CO2 emissions from composting process are considered
GHG neutral.
CH4 Yes Methane emissions from anaerobic pockets during
composting process Composting
process N2O Yes N2O emissions from loss of N2O-N during composting
process and during application of the compost
CO2 No CO2 emission from biomass source and considered
GHG neutral.
CH4 No There is no methane emission from anaerobic
process of wastewater collected after the
project activity as all the water is pre-treated
and managed aerobically or used for irrigation
Leaked Waste
Water
N2O No Not significant, excluded for simplification
CO2 No Emission from combustion of fossil fuel in transport
vehicles. Not significant, excluded for simplification
CH4 No Not significant, excluded for simplification
Additional
Transportation due
to Project Activity N2O No Not significant, excluded for simplification
CO2 Yes Emissions from fossil fuels used in the compost
manufacturing process
CH4 No Not significant, excluded for simplification
P
roje
ct
Act
ivit
ies
Auxiliary
Equipment N2O No Not significant, excluded for simplification
B.4. Description of how the baseline scenario is identified and description of the identified
baseline scenario:
>>
As indicated in the combined tool to demonstrate the baseline scenarios and demonstrate additionality
the most plausible baseline scenario shall be determined for both, organic wastewater and bioorganic
solid waste, separately.
Step 1: Listing a range of potential baseline options
Step 1.a. For bio-organic solid waste:
1) Waste used for co-composting (the project activity implemented without CDM);
2) Uncontrolled open burning
3) Waste returned to the plantation for mulching
4) Waste incinerated in controlled conditions or used for energy purposes including power
generation
5) Continuation of waste disposed on a landfill without the capture of landfill gas;

PROJECT DESIGN DOCUMENT FORM (CDM PDD) - Version 03.1.
CDM – Executive Board page 13
6) Waste disposed on a landfill where landfill gas is captured and flared;
7) Waste disposed on a landfill where landfill gas is captured and electricity generated;
8) Waste disposed on a landfill where landfill gas is captured and delivered to nearby industries for
heat generation.
For organic wastewater:
1) Continuation of current practice of using anaerobic lagoons or open storage tanks without
methane recovery and flaring;
2) Wastewater used for co-composting (the project activity implemented without CDM);
3) Anaerobic lagoons or storage tanks with methane recovery and flaring;
4) Anaerobic lagoons or storage tanks with methane recovery and utilization for electricity or heat
5) generation;
6) Building of a new anaerobic lagoon or open storage tanks without methane recovery and flaring;
7) Building of a new anaerobic lagoon or open storage tanks with methane recovery and flaring;
8) Direct release of waste to nearby waterways
9) Aerobic treatment facilities
Step 1.b: Eliminate alternatives that are not complying with applicable laws and regulations
For bio-organic solid waste, the uncontrolled open burning is illegal and not permitted; hence this
scenario will not be taken into consideration throughout this analysis.
For organic waste water, the direct release of waste water to nearby water way is illegal and not
permitted; hence this scenario will not be taken into consideration in the following analysis.
Step 2: Barrier Analysis
Step 2.a.&b. Eliminate alternatives that face prohibitive barriers
Scenarios that face prohibitive barriers will be eliminated by applying step 2 of the latest version of the
“combined tool to demonstrate the baseline scenarios and demonstrate additionality” agreed by the CDM
Executive Board. The main types of barriers for project implementation can be classified as technical,
financial, social and business culture. The technical and financial barriers are considered as the most
significant barrier in any business investment decision. These barriers, either real or perceived, can lead
to cultural barriers such as barrier against change in “common practice” even if the technical and
financial barriers have been overcome.
The plausible alternative project activities identified in Step 1 are then analysed by assessing them
against the identified barriers.
For bio-organic solid waste
Waste used for co-composting (the project activity implemented without CDM);
Without CDM support this is not a plausible alternative, due to business culture, financial and technical
barriers.
As palm oil mills are profitable, especially with current high palm oil prices, and dispose of all waste in
line with industry and environmental regulations, there is consequently limited incentive to change
business practice.
Moreover, this is an early deployment of this technology in Malaysia in the Palm Oil industry. While the
individual technologies that will be used in the process are proven in other applications, the joint
application to treat these waste streams has yet to be accepted by the palm oil industry. It will provide an
opportunity for future technology transfer within the industry and consequently will bring exposure to all
PROJECT DESIGN DOCUMENT FORM (CDM PDD) - Version 03.1.
CDM – Executive Board page 14
the technology and financial risks that are associated with being the early adopter of a new technology
application. To develop the project without the assistance of CDM finance, mill owners would have to
risk their own investment capital, increase operating costs, significantly reduce medium term profitability
and change business practices, without a driving business need.
CDM was developed with just such projects in mind, whereby CDM finance reduces the risk of
introducing and applying new low carbon emission technologies until the penetration achieves a critical
mass in the industry that changes the prevailing business practice.
Waste returned to the plantation for mulching
The Abedon plantations do not use EFBs for mulching, as it has limited fertilizer value, can remove
nitrogen from the soil and the cost of application/distribution into the estate is relatively high as the
volume to be mulched and distributed on a daily basis is substantial. It can also spread plant diseases
which is a constant source of concern for all palm oil growers. Financial barriers and business culture
barriers are high for the adoption of this scenario. Moreover, it does not solve the problem of aerobically
co-disposing of the POME waste. It is not considered as a plausible alternative.
Waste incinerated in controlled conditions or used for energy purposes including power generation
The characteristics of EFB – a high moisture and low calorific heating value – make it difficult to use as
fuel for steam and power generation. Advanced technologies and additional measures to pre-treat the
EFB to reduce the moisture content to below 40% are required. The history of biomass use in the palm
oil industry is that milling factories prefer to use fibre and shells for boiler fuel due to their higher
heating value, and little or no use has been made of EFB for this purpose, except where additional
revenue from the CDM makes such an alternative financially viable. The Abedon mill generates all of its
energy and power needs from the mesocarp fibre and shells that it produces and its remote location does
not favour power generation for other users. Hence this alternative is not viable for this mill, and again it
does not solve the problem of aerobically co-disposing of the POME waste.
Continuation of waste disposed on a landfill without the capture of landfill gas;
In earlier times this biomass was burned in the open air leading to extensive air pollution from the heavy
white smoke that was produced. As a result the Malaysian Government has banned open air burning of
EFB. However, many mills face a problem in disposing the waste as they do not possess any plantation,
but only operate a mill. Plantation owners supplying the fresh palm oil fruit bunches are typically not
interested in collecting the waste at the mill and disposing of it in their plantation. Thus some of the mills
are left with only the option to dispose the EFB in piles to naturally decompose at their mill site, or into
natural valleys where it decays, emitting biogas containing methane, a potent greenhouse gas. Due to the
remote locations of these landfills the Government has not promulgated regulations requiring the capture
and flaring of this gas for safety or other environmental reasons. The current practice of waste treatment
of the bio-organic solid waste including the EFB, decanter sludge and boiler ashes at Abedon is to
transport the waste from mill site and deposit in a managed landfill. The palm oil mill owner incurs the
cost of transporting the waste to the landfill. This is a plausible alternative for disposal of the biomass
waste from the palm oil mill and represents business as usual.
Waste disposed on a landfill where landfill gas is captured and flared;
Waste disposed on a landfill where landfill gas is captured and electricity generated;
Waste disposed on a landfill where landfill gas is captured and delivered to nearby industries for heat
generation.
Due to the remote locations of most palm oil mills and the cost involved in installing systems to capture
the landfill gas, there were no landfills that have such facilities and it is not a regulatory requirement for
the palm oil mill owners to install such facilities in Malaysia. Moreover, in this remote location there is
no market for any electricity or heat generated by capturing and use of the LFG. Abedon mill already has
excess power capacity from in-mill boilers using mesocarp fibres and shells as fuels. The excess power
generation capacity can be absorbed by the proposed in-vessel co-composting plant.
PROJECT DESIGN DOCUMENT FORM (CDM PDD) - Version 03.1.
CDM – Executive Board page 15
For organic waste water
Continuation of current practice of using anaerobic lagoons or open storage tanks without methane
recovery and flaring
Wastewater treatment of POME in an open pond system more than 5 m in depth is the prevalent practice
in palm oil mills in Malaysia. Despite numerous revisions to the allowable discharge level, the
combination of anaerobic ponds and aerobic/facultative ponds has been able to meet the current
permitted discharge level of biological oxygen demand (BOD) of 5,000mg/l for land application and
100mg/l for water way discharge. Pond systems are the technology of choice in the Malaysian palm oil
industry as they are very low risk, and utilise a low-tech process suitable for remote installation that is
typical of palm oil mills in the country. It represents business as usual at Abedon and will continue in the
absence of a CDM financed alternative.
Wastewater used for co-composting (the project activity implemented without CDM);
Without CDM support this is not a plausible alternative for treatment of the POME as has been argued
for bio-organic solid waste (see Step 3, “For bio-organic waste”).
Anaerobic lagoons or storage tanks with methane recovery and flaring;
Anaerobic lagoons or storage tanks with methane recovery and utilization for electricity or heat
generation;
Though anaerobic ponds are used in existing wastewater treatment systems, these are more like retaining
ponds with minimal interference from the operator. As in the case of the biomass these alternatives are
not mandated by Malaysian Government regulations and therefore have not been adopted by the
Malaysian Palm Oil Industry. In addition, in this remote location there is no market for electricity or heat
generated by the capturing of biogas from these lagoons
Building of a new anaerobic lagoon or open storage tanks without methane recovery and flaring;
Building of a new anaerobic lagoon or open storage tanks with methane recovery and flaring;
There are existing lagoons so there is no need to build a new facility to treat wastewater.
Aerobic treatment facility
Aerobic waste water treatments systems are suitable for relatively low BOD/COD wastes but not for the
high BOD/COD wastes generated by the palm oil industry. They are used for polishing treatment after
anaerobic treatment to reduce the BOD/COD to a level that is acceptable for discharge to surface waters.
A fully aerobic waste water treatment process for raw POME is not technically feasible, nor would it be
economically feasible at the Abedon site.
In Summary:
For Abedon the most plausible baseline scenario for treatment of the wastewater is the continuation of
the use of open anaerobic lagoons or storage tanks throughout the crediting period and the most plausible
baseline for treating bioorganic waste is the continuation of waste disposal at a managed landfill.
B.5. Description of how the anthropogenic emissions of GHG by sources are reduced below
those that would have occurred in the absence of the registered CDM project activity (combined
tool to demonstrate the baseline scenarios and demonstrate additionality):
>>
PROJECT DESIGN DOCUMENT FORM (CDM PDD) - Version 03.1.
CDM – Executive Board page 16
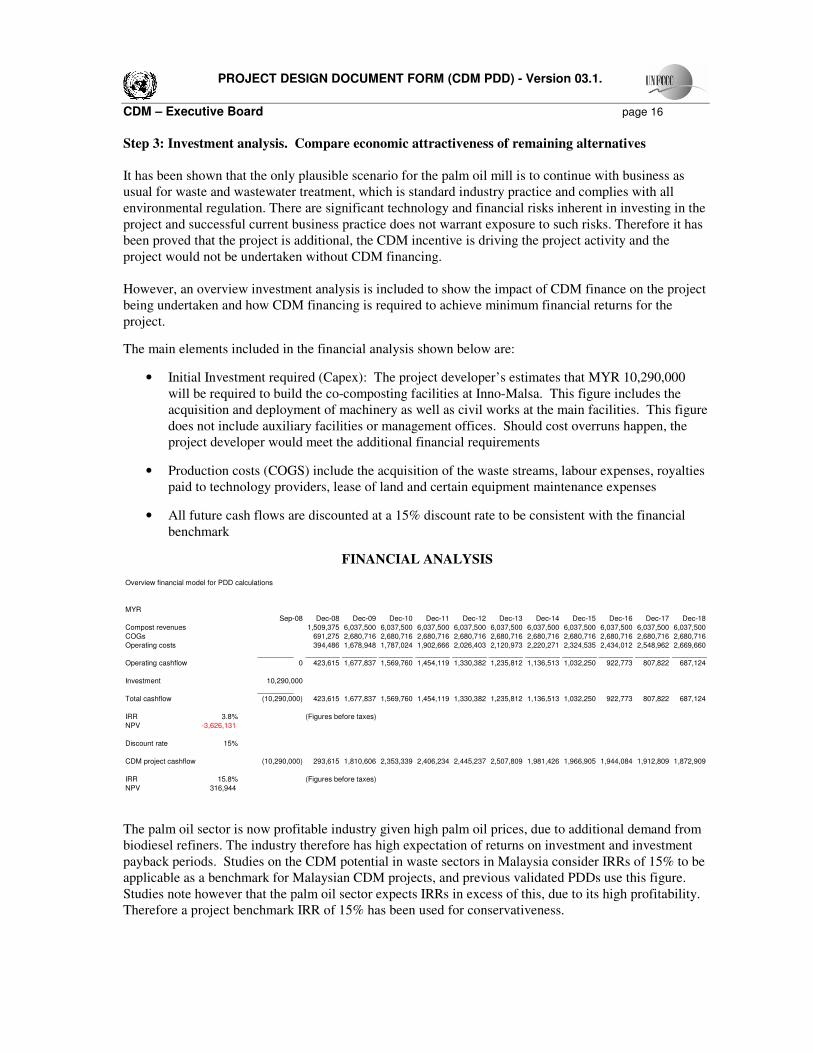
Step 3: Investment analysis. Compare economic attractiveness of remaining alternatives
It has been shown that the only plausible scenario for the palm oil mill is to continue with business as
usual for waste and wastewater treatment, which is standard industry practice and complies with all
environmental regulation. There are significant technology and financial risks inherent in investing in the
project and successful current business practice does not warrant exposure to such risks. Therefore it has
been proved that the project is additional, the CDM incentive is driving the project activity and the
project would not be undertaken without CDM financing.
However, an overview investment analysis is included to show the impact of CDM finance on the project
being undertaken and how CDM financing is required to achieve minimum financial returns for the
project.
The main elements included in the financial analysis shown below are:
• Initial Investment required (Capex): The project developer’s estimates that MYR 10,290,000
will be required to build the co-composting facilities at Inno-Malsa. This figure includes the
acquisition and deployment of machinery as well as civil works at the main facilities. This figure
does not include auxiliary facilities or management offices. Should cost overruns happen, the
project developer would meet the additional financial requirements
• Production costs (COGS) include the acquisition of the waste streams, labour expenses, royalties
paid to technology providers, lease of land and certain equipment maintenance expenses
• All future cash flows are discounted at a 15% discount rate to be consistent with the financial
benchmark
FINANCIAL ANALYSIS
Overview financial model for PDD calculations
MYR
Sep-08 Dec-08 Dec-09 Dec-10 Dec-11 Dec-12 Dec-13 Dec-14 Dec-15 Dec-16 Dec-17 Dec-18
Compost revenues 1,509,375 6,037,500 6,037,500 6,037,500 6,037,500 6,037,500 6,037,500 6,037,500 6,037,500 6,037,500 6,037,500
COGs 691,275 2,680,716 2,680,716 2,680,716 2,680,716 2,680,716 2,680,716 2,680,716 2,680,716 2,680,716 2,680,716
Operating costs 394,486 1,678,948 1,787,024 1,902,666 2,026,403 2,120,973 2,220,271 2,324,535 2,434,012 2,548,962 2,669,660
_________ ___________________________________________________________________________________________________
Operating cashflow 0 423,615 1,677,837 1,569,760 1,454,119 1,330,382 1,235,812 1,136,513 1,032,250 922,773 807,822 687,124
Investment 10,290,000
_________ ___________________________________________________________________________________________________
Total cashflow (10,290,000) 423,615 1,677,837 1,569,760 1,454,119 1,330,382 1,235,812 1,136,513 1,032,250 922,773 807,822 687,124
IRR 3.8% (Figures before taxes)
NPV -3,626,131
Discount rate 15%
CDM project cashflow (10,290,000) 293,615 1,810,606 2,353,339 2,406,234 2,445,237 2,507,809 1,981,426 1,966,905 1,944,084 1,912,809 1,872,909
IRR 15.8% (Figures before taxes)
NPV 316,944
The palm oil sector is now profitable industry given high palm oil prices, due to additional demand from
biodiesel refiners. The industry therefore has high expectation of returns on investment and investment
payback periods. Studies on the CDM potential in waste sectors in Malaysia consider IRRs of 15% to be
applicable as a benchmark for Malaysian CDM projects, and previous validated PDDs use this figure.
Studies note however that the palm oil sector expects IRRs in excess of this, due to its high profitability.
Therefore a project benchmark IRR of 15% has been used for conservativeness.

PROJECT DESIGN DOCUMENT FORM (CDM PDD) - Version 03.1.
CDM – Executive Board page 17
The project requires significant upfront investment in the composting vessel and related equipment, with
revenue generated from selling fertilizer to the plantation. An overview of the NPVs and IRRs for the
project, both with and without CDM revenue is shown below:
Project scenario NPV IRR
Without CDM financing - MYR 3.6 million* 3.8%*
With CDM financing MYR 0.3 million* 15.8%* *Figures shown before taxes
There is a low return for the project, without including CDM financing, so the industry benchmark is not
relevant.
Furthermore, the sensitivities shown below, indicate that either increasing revenue, or reducing costs, by
more than 10% would be required to obtain an IRR in the absence of CDM financing that would reach
the industry benchmark.
IRR sensitivities tables*
Change in fertilizer revenue
-10% -5% 0% 5% 10%
Without CDM
financing -11.0% -2.4% 3.8% 8.9% 13.4%
With CDM financing 7.8% 12.0% 15.8% 19.4% 22.8%
Change in operating costs
-10% -5% 0% 5% 10%
Without CDM
financing 7.4% 5.6% 3.8% 1.8% -0.5%
With CDM financing 18.2% 17.0% 15.8% 14.5% 13.2% *Figures shown before taxes
Step 4: Assessment whether the identified baseline scenario is common practice
The existing solid waste disposal at landfill and POME wastewater treatment system at the mill is able to
comply with the legal discharge standards as stipulated by the Department of Environment, Malaysia.
The open anaerobic pond system is the most common and standard practices at most palm oil mills in
Malaysia. There is no legal requirement or financial incentive to compel the Abedon mill owners to
implement other treatment options that will require additional investment. For Abedon the most plausible
baseline scenario for treatment of the wastewater is the continuation of the use of open anaerobic lagoons
or storage tanks throughout the crediting period and the most plausible baseline for treating bioorganic
waste is a managed landfill.
Step 5: Impact of CDM Registration
CDM Registration of this project activity overcomes the financial and technical barriers that have so far
prevented investors with experience in aerobic co-composting waste treatment and bio-organic fertilizers
to come together to build and operate a treatment facility which will eliminate methane emissions from
the disposal of biomass and organic liquid wastes that represent business as usual at the Abedon site.
The experience brought by carbon investors together with their technology expertise and technical and
financial resources will make possible the implementation of the proposed CDM project.
B.6. Emission reductions:

PROJECT DESIGN DOCUMENT FORM (CDM PDD) - Version 03.1.
CDM – Executive Board page 18
B.6.1. Explanation of methodological choices:
>>
The methodology to be used is AM0039 “Methane emissions reduction from organic waste water and
bioorganic solid waste using co-composting”. The proposed project activity meets all the applicability
requirements stipulated by the approved methodology AM0039.
Baseline emissions
The following types of baseline emissions will be accounted under this methodology.
(a) Methane (CH4) emissions from waste water in anaerobic lagoons or open storage tanks;
(b) Methane (CH4) emissions from decay of bioorganic solid waste in disposal sites;
(c) CO2 emissions from transportation of organic wastewater and bioorganic solid waste;
(d) CO2 emissions from fossil fuels used for energy requirements and
(e) CO2 emissions from grid electricity consumption.
Total baseline emissions are expressed as:
where:
BEy is the total baseline emissions during the year y, (tCO2e)
BECH4,WW,y is the baseline methane emissions from existing open lagoon or open storage tanks
during the year y (tCO2e)
BECH4,SW,y is the baseline methane emissions from decay of bio-organic solid waste during the year
y (tCO2e)
BECO2,Trans,y is the baseline CO2 emissions from transportation of organic wastewater and bioorganic
solid waste during the year y (tCO2e)
BECO2,FF,y is the baseline CO2 emissions from use of fossil fuels during the year y (tCO2)
BECO2,Elec,y is the baseline CO2 emissions from grid electricity consumption during the year y
(tCO2)
The above emissions are calculated as explained below:
(a) Methane (CH4) emissions from wastewater in open storage systems (BECH4,WW,y)
The baseline methane emissions from anaerobic lagoons or storage tanks are estimated based on the
chemical oxygen demand (COD) of the effluent that would enter the lagoon in the absence of the project
activity, the maximum methane producing capacity (Bo) and a methane conversion factor (MCF) that
expresses what proportion of the effluent would be anaerobically digested in the open lagoons.
The baseline methane emissions are calculated using the following equation:
where:
BECH4,WW,m is the baseline monthly methane emissions from wastewater (tCO2e)

PROJECT DESIGN DOCUMENT FORM (CDM PDD) - Version 03.1.
CDM – Executive Board page 19
CODavailable,m is the monthly Chemical Oxygen Demand available for conversion which is equal to the
monthly COD of the wastewater used for co-composting CODbaseline,m plus COD
carried on from the previous month (tCOD)
CODbaseline,m is the monthly Chemical Oxygen Demand of effluent entering anaerobic lagoons or
storage tanks (measured in the project activity) (tCOD)
Bo is the maximum methane producing capacity of the inlet effluent (tCH4/tCOD)
MCFbaseline is the methane conversion factor of the baseline storage system (fraction)
GWPCH4 is the Global Warming Potential of methane, default value 21
CODbaseline,m is to be directly measured in the project as the baseline activity level since the effluent that
goes into the anaerobic lagoon or storage tanks in the baseline situation is the same as the one that goes
into the project. CODbaseline,m is calculated as the product of CODc,baseline concentration (kgCOD/m3) in the
wastewater input to the project and the flow rate Fdig (m3/month).
Since the effluent resides in the Abedon lagoons for more than 30 days, the amount of organic matter
available for conversion to methane CODavailable,m is assumed to be equal to the amount of organic matter
produced during the month (CODbaseline,m input to the project) plus the organic matter that may remain in
the system from previous months.
The amount of organic matter consumed during the month is equal to the amount available for
conversion CODavailable,m multiplied by MCFmonthly. The amount of organic matter carried over from one
month to the next equals to the amount available for conversion minus the amount consumed and minus
the amount removed from the anaerobic lagoon or storage tank. In the case of the emptying of the
anaerobic lagoon or storage tank, the accumulation of organic matter restarts with the next inflow.
The default IPCC value for Bo is 0.25kg CH4/kg COD. Taking into account the uncertainty of this
estimate, a value of 0.21 kg CH4/kg COD is assumed for this project activity as a conservative
assumption for Bo.
MCFbaseline,m is estimated as the product of the fraction of anaerobic degradation due to depth (fd) and the
fraction of anaerobic degradation due to temperature (ft,monthly):
where:
fd is the fraction of anaerobic degradation due to depth as following Table
ft,monthly is the fraction of anaerobic degradation due to temperature
0.89 is an uncertainty conservativeness factor (for an uncertainty range of 30% to 50%) to account for
the fact that the equation used to estimate ft,monthly assumes full anaerobic degradation at 30 ºC.
Deep
> 5m
Medium
Depth 1-5m
Small depth
< 1 m
Fraction of degradation
under anaerobic
conditions due to depth of
anaerobic lagoons or
70%
50%
0

PROJECT DESIGN DOCUMENT FORM (CDM PDD) - Version 03.1.
CDM – Executive Board page 20
storage tank
ft,monthly is calculated as follows:
where:
E Activation energy constant (15,175 cal/mol)
T2 Ambient temperature (Kelvin) for the climate
T1 303.16 (273.16° + 30°)
R Ideal gas constant (1.987 cal/ K mol).
(1) The monthly average temperature for the area is obtained from published national weather service
information (See Annex 3).
(2) Monthly temperatures are used to calculate a monthly van’t Hoff – Arrhenius ‘ft,monthly’ factor above.
A minimum temperature of 10 °C is used. Months where the average temperature is less than 10 ºC,
ft,monthly = 0. The value of ft,monthly to be used cannot exceed unity. Monthly values are used in the
calculations for this project activity.
(b) Methane (CH4) emissions from decay of bioorganic solid waste in disposal sites (BECH4,SW,y)
The amount of methane that would be generated each year in absence of project activity (BECH4,SW,y) is
calculated as per the following equation:
BECH4,SW,y = BECH4,SWDS,y - MDreg
Where:
BECH4,SWDS,y is the methane generation from the landfill in the absence of the project activity at year “y”
calculated as per the “Tool to determine methane emissions avoided from dumping waste at a solid waste disposal site”. And
MDreg is the methane that would be destroyed in the absence of the project activity in year y (tCH4)
The tool estimates methane generation adjusted for, using adjustment factor (f) any landfill gas in the baseline
that would have been captured and destroyed to comply with relevant regulations or contractual requirements,
or to address safety and odour concerns. As this is already accounted for in the equation directly above, “f” in
the tool shall be assigned a value 0.
In the calculation of type of waste streams, we are only using EFB as the only waste stream, although, we
also include sludge and boiler ashes as well. The model calculates the methane generation based on the
actual waste streams Wj,x diverted from the landfill in the most recent year and all previous years since
the project start (x=1 to x=y).
The amount of methane produced in a year is calculated as follows:
where:
PROJECT DESIGN DOCUMENT FORM (CDM PDD) - Version 03.1.
CDM – Executive Board page 21
BE CH4,SWDS,y is the amount of methane emissions avoided during the year y from preventing waste
disposal at the solid waste disposal site (SWDS) during the period from the start of the
project activity to the end of the year y (tCO2e)
φ is the model correction factor (default 0.9) to correct for the model-uncertainties
F is the fraction of methane in the SWDS gas, IPCC default value 0.5
DOCj is the percentage of degradable organic carbon (by weight) in the waste type j
DOCf is the fraction of DOC that can decompose, default value 0.5
MCF is the Methane Correction Factor (fraction)
GWPCH4 is the global warming potential for Methane, IPCC default value 21
Wj,x is the amount of organic waste type j prevented from disposal in the SWDS during the
year x (tons)
kj is the decay rate for waste stream type j
j is the waste type distinguished into the waste categories (from A to D), as illustrated in
the Table 4 below.
x is the year during the crediting period: x runs from the first year of first crediting period
(x=1) to the year for which emissions are calculated (x=y)
y is the year for which methane emissions are calculated
f Fraction of methane captured at the SWDS and flared, combusted or used in another
manner, assigned value of 0
OX Oxidation factor (reflecting the amount of methane from the landfill that is oxidised in the
soil or other material covering the waste)
In cases where regulatory or contractual requirements do not specify MDreg,y, an Adjustment Factor (AF)
shall be used and justified, taking into account the project context. In doing so, the project participant
should take into account that some of the methane generated by the landfill may be captured and
destroyed to comply with other relevant regulations or contractual requirements, or to address safety and
odor concerns.
MDreg,y = BECH4,SW,y * AF
where:
AF is Adjustment Factor for BECH4,SW,y (%)
AF is defined as the ratio of the destruction efficiency of the collection and destruction system mandated
by regulatory or contractual requirement to that of the collection and destruction system in the project
activity.
Model Correction Factor (φ)
Oonk et el. have validated several landfill gas models based on 17 realized landfill gas projects3. The
mean relative error of multi-phase models was assessed to be 18%. Given the uncertainties associated
with the model and in order to estimate emission reductions in a conservative manner, a discount of 10%
should be applied to the model results, i.e. φ = 0.9.
Methane correction factor (MCF)
The methane correction factor (MCF) accounts for the fact that unmanaged landfills produce less
methane from a given amount of waste than managed landfills, because a larger fraction of waste
decomposes aerobically in the top-layers of unmanaged landfills. The proposed default values for MCF
are listed in the table below.
Solid Waste Disposal Site (SDWS) Classification and Methane Correction Factors
PROJECT DESIGN DOCUMENT FORM (CDM PDD) - Version 03.1.
CDM – Executive Board page 22
Degradable carbon content in waste (DOCj) and decay rates (kj)
In the “Tool to determine methane emissions avoided from dumping waste at a solid waste disposal site”, it is
recommended that in the case of empty fruit bunches, project participants use the IPCC default value for
DOCj that corresponds with wood. This equates to 0.43.
For the decay rate kj, the IPCC suggested value is that used for wood, until the empty fruit bunches are
appropriately characterized by an adequate laboratory test. This is 0.035.
Calculation of F
This factor reflects the fact that some degradable organic carbon does not degrade, or degrades very slowly,
under anaerobic conditions in the SWDS. A default value of 0.5 is recommended by IPCC.
Fraction of degradable organic carbon dissimilated (DOCf)
The decomposition of degradable organic carbon does not occur completely and some of the potentially
degradable material always remains in the site even over a very long period of time. The revised IPCC
Guidelines propose a default value of 0.5 for DOCf.
Oxidation Factor (OX)
The “Tool to determine methane emissions avoided from dumping waste at a solid waste disposal site”
recommends using an OX of 0.1 for managed solid waste disposal sites that are covered with oxidizing
material such as soil or compost, and 0 for other types of solid waste disposal sites. As there is no covering
oxidizing material in this case, 0 is used as the oxidation factor in this case.
(c) CO2 emissions from transportation of organic wastewater and bioorganic solid waste
(BECO2,Trans,y)
The baseline emissions from transportation are to be calculated using distance travelled by trucks and the
fuel emission factor, as follows:
where:
Nvehicles,i,y is the number of vehicle trips used for transportation, with similar loading capacity
Disti,y is the average distance per trip travelled by transportation vehicles type i in the baseline
scenario during the year y (km)
FCi is the vehicle fuel consumption in volume or mass units per km for vehicle type i
NCVi is the net calorific value of fuel type i in TJ per volume or mass units
EFCO2,i is the CO2 emission factor of the fossil fuel type i used in transportation vehicles,
(tCO2e/TJ)
(d) CO2 emissions from fossil fuels used for energy requirements (BECO2,FF,y)

PROJECT DESIGN DOCUMENT FORM (CDM PDD) - Version 03.1.
CDM – Executive Board page 23
CO2 emissions from fossil fuel used in the baseline for energy requirements such as heating shall be
calculated as follows:
where:
FCi,y is the baseline fossil fuels consumed of type i for energy requirements during the year y
in mass or volume units
NCVi is the Net Calorific Value (energy content) in TJ of fuel type i, per mass unit or volume
unit
EFCO2,i is the CO2 emission factor per unit of energy of the fuel i (tCO2e/TJ)
Where available, local values of NCVi and EFCO2,i should be used. If no such values are available, country
specific values (see e.g. IPCC Good Practice Guidance) are preferable to latest versions of IPCC
Guidelines values.
(e) CO2 emissions from grid electricity consumption (BECO2,Elec,y)
In case electricity is consumed for energy requirements in the baseline, CO2 emissions from electricity
consumption shall be calculated as follows:
where:
ECy is the baseline electricity consumption during the year y (MWh)
EFGridElec,y is the grid electricity emission factor for the year y (tCO2/MWh)
In cases where electricity is purchased from the grid, the emission factor EFGridElec,y should be calculated
according to the “Tool for calculation of emission factor for electricity systems”.
Project emissions
The following types of project emissions will be accounted under this methodology:
(a) N2O emissions from composting process
(b) CH4 emissions from composting process
(c) CH4 emissions from leaked waste water
(d) CO2 emissions from transportation
(e) CO2 emissions from fossil fuels consumption
(f) CO2 emissions from grid electricity consumption
Total project emissions are expressed as
where:
PEy is the total project emissions during the year y, (tCO2e)
PE N2O,Comp,y is the N2O emissions from composting of bio-organic solid waste during the year y
(tCO2e)
PE CH4,Comp,y is the CH4 emissions from composting of bio-organic solid waste during the year y

PROJECT DESIGN DOCUMENT FORM (CDM PDD) - Version 03.1.
CDM – Executive Board page 24
(tCO2e)
PE CH4,Bww,y is the CH4 emissions from leaked waste water discharged after the project activity during
the year y (tCO2e)
PE CO2,Trans,y is the CO2 emissions from transportation in the project situation during the year y
(tCO2e)
PE CO2,FF,y is the CO2 emissions from use of fossil fuels in the project situation during the year y
(tCO2)
PE CO2,Elec,y is the CO2 emissions from grid electricity consumption in project situation during the
year y (tCO2)
The above emissions will be calculated as explained below:
(a) N2O emissions from composting (PEN2O,Comp,y):
N2O emissions from composting during the year y are calculated as follows:
During the storage of waste in collection containers as part of the composting process itself and during
the application of compost, N2O emissions might occur. A default N2O emission factor of 0.043 kg N2O
per tonne of compost and calculate emissions as follows:
where:
Q Compost,y is the total quantity of compost produced during the year y, (tons of compost)
EF N2O,Comp is the emission factor for N2O emissions from composting process (tN2O/ton of
compost)
GWP N2O is the global warming potential of N2O, default value 310
(b) CH4 emissions from composting (PECH4,Comp,y):
During the composting process, aerobic conditions are neither completely reached in all areas nor at all
times. Pockets of anaerobic conditions – isolated areas in the composting heap where oxygen
concentrations are so low that the biodegradation process turns anaerobic – may occur. The emission
behavior of such pockets is comparable to the anaerobic situation in a landfill. This is a potential
emission source for methane similar to anaerobic conditions which occur in unmanaged landfills.
Through predetermined sampling procedures the percentage of waste that degrades under anaerobic
conditions can be determined. Using this percentage, project methane emissions from composting
process are calculated, as follows:
where:
PECH4,Anaerobic,y is the quantity of methane that would be generated from anaerobic pockets in the
composting process, during the year y (tCH4)
GWPCH4 is the global warming potential of CH4, default value 21
Sa,y is the share of waste that degrades under anaerobic conditions in the composting plant
during the year y (%)
The amount of methane that is generated in anaerobic pockets (PECH4,Anaerobic,y) is calculated for each year
PROJECT DESIGN DOCUMENT FORM (CDM PDD) - Version 03.1.
CDM – Executive Board page 25
with a multi-phase model. The model is based on a first order decay equation. It differentiates between
the different types of waste j with respectively different decay rates kj (fast, moderate, slow) and fraction
of degradable organic carbon (DOCj). The model calculates the methane generation based on the actual
waste streams Aproject,j,x disposed in the most recent year (y) and all previous years since the project start
(x=1 to x=y). The amount of methane produced is calculated as follows:
Variables used in the above equation are analogous to those of the similar equation above.
Calculation of Sa,y:
Sa,y is determined by a combination of measurements and calculations. Bokhorst et al6 and Richard et al
show that if oxygen content is below 5% - 7.5%, aerobic composting processes are replaced by anaerobic
processes. To determine the oxygen content during the process, project participants shall measure the
oxygen content according to a predetermined sampling scheme and frequency.
These measurements should be undertaken for each year of the crediting period and recorded each year.
The percentage of the measurements that show oxygen content below 10%8 is presumed to be equal to
the share of waste that degrades under anaerobic conditions (i.e. that degrades as if it were landfilled),
hence the emissions caused by this share are calculated as project emissions ex-post on an annual basis:
Sa,y = SOD,y / Stotal,y
where:
SOD,y is the number of samples in year y with an oxygen deficiency (i.e. oxygen content below
10%)
Stotal,y is the total number of samples taken in year y, where Stotal,y should be chosen in a manner
that ensures the estimation of Sa,y with 20% uncertainty at a 95% confidence level.
(c) CH4 emissions from the leaked wastewater (PECH4,bww,y):
Projects such as composting will usually have no wastewater discharge but there is a possibility that a
small quantity of leaked wastewater is collected from windrows or as a balance of waste water and this
leak wastewater may cause CH4 emissions.
CH4 emissions from leak and/or balance of waste water shall be calculated as follows.
where:
PECH4,BWW,y is the project methane emissions from wastewater during the year y (tCO2e)
CODoutlet,total,y is the outlet total COD of the wastewater during the year y (tCOD)
Bo is the outlet maximum methane producing capacity of wastewater (tCH4/tCOD)
MCFoutlet is the methane conversion factor of the storage system (fraction)
GWPCH4 is the Global Warming Potential of methane
MCFoutet is to be estimated in the same manner as that of MCFbaseline,m in the baseline.
(d) CO2 emissions from transportation (PECO2,Trans,y):

PROJECT DESIGN DOCUMENT FORM (CDM PDD) - Version 03.1.
CDM – Executive Board page 26
The project emissions from transportation are to be calculated using the total distance and local, national
or latest version of IPCC Guidelines default values for transportation fuel, as follows:
where:
Nvehicles,i,y is the number of vehicle trips used for transportation, with similar loading capacity
Disti,y is the average distance per trip travelled by transportation vehicles type i in the project
scenario during the year y (km)
FCi is the vehicle fuel consumption in volume or mass units per km for vehicle type i
NCVi is the net calorific value of fuel type i in TJ per volume or mass units
EFCO2,i is the CO2 emission factor of the fossil fuel type i used in transportation vehicles,
(tCO2e/TJ)
(e) CO2 emissions from fossil fuels used for energy requirements (PECO2,FF,y):
CO2 emissions from fossil fuel used in the project for energy requirements such as heating shall be
calculated as follows:
where:
FCi,project,y is the fossil fuels consumed of type i for energy requirements during the year y in mass
or volume units
NCVi is the Net Calorific Value (energy content) in TJ of fuel type i, per mass unit or volume
unit
EFCO2,i is the CO2 emission factor per unit of energy of the fuel i. (tCO2e/TJ)
Where available, local values of NCVi and EFCO2,i should be used. If no such values are available, country
specific values (see e.g. IPCC Good Practice Guidance) are preferable to the latest version of IPCC
Guidelines world-wide default values.
(f) CO2 emissions from electricity consumption (PECO2,Elec,y):
In case electricity is consumed for energy requirements in the baseline, CO2 emissions from electricity
consumption shall be calculated as follows:
where:
ECproject,y is the project electricity consumption during the year y (MWh)
EFGridElec,y is the grid electricity emission factor for the year y (tCO2/MWh)
In cases where electricity is purchased from the grid, the emission factor EFGridElec,y should be calculated
according to the “Tool for calculation of emission factor for electricity systems”.
Leakage
PROJECT DESIGN DOCUMENT FORM (CDM PDD) - Version 03.1.
CDM – Executive Board page 27
No leakage effects need to be accounted under this methodology.
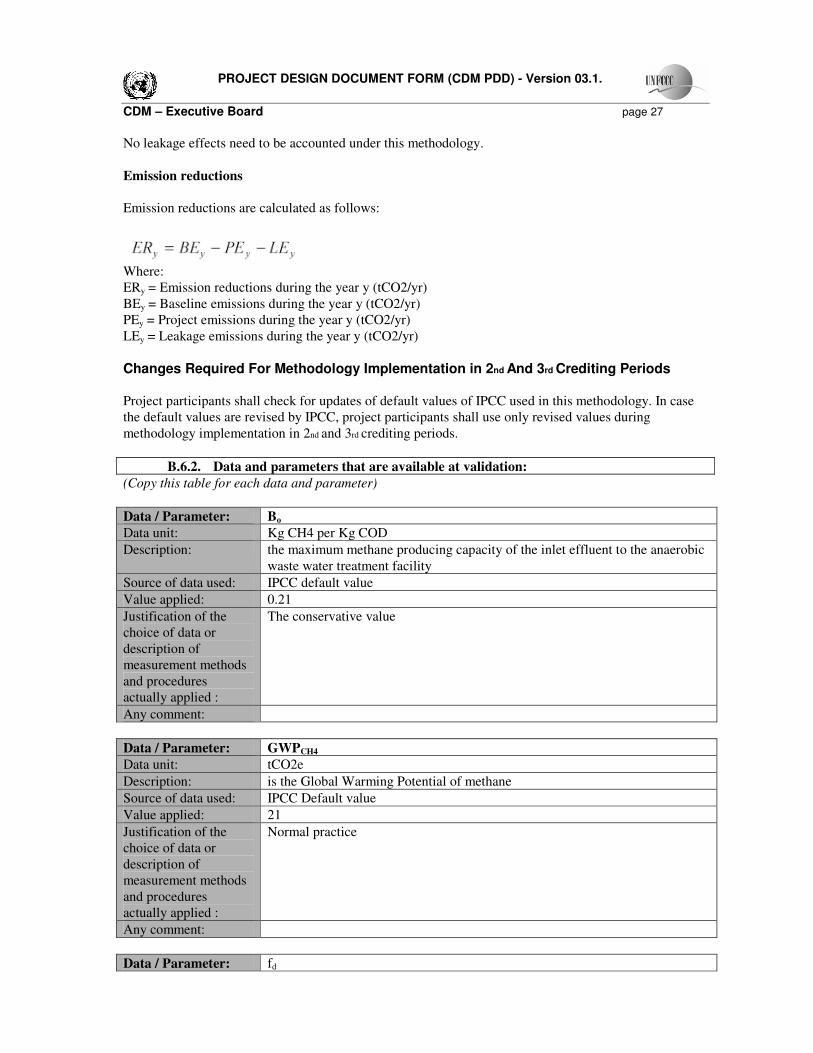
Emission reductions
Emission reductions are calculated as follows:
Where:
ERy = Emission reductions during the year y (tCO2/yr)
BEy = Baseline emissions during the year y (tCO2/yr)
PEy = Project emissions during the year y (tCO2/yr)
LEy = Leakage emissions during the year y (tCO2/yr)
Changes Required For Methodology Implementation in 2nd And 3rd Crediting Periods
Project participants shall check for updates of default values of IPCC used in this methodology. In case
the default values are revised by IPCC, project participants shall use only revised values during
methodology implementation in 2nd and 3rd crediting periods.
B.6.2. Data and parameters that are available at validation:
(Copy this table for each data and parameter)
Data / Parameter: Bo
Data unit: Kg CH4 per Kg COD
Description: the maximum methane producing capacity of the inlet effluent to the anaerobic
waste water treatment facility
Source of data used: IPCC default value
Value applied: 0.21
Justification of the
choice of data or
description of
measurement methods
and procedures
actually applied :
The conservative value
Any comment:
Data / Parameter: GWPCH4
Data unit: tCO2e
Description: is the Global Warming Potential of methane
Source of data used: IPCC Default value
Value applied: 21
Justification of the
choice of data or
description of
measurement methods
and procedures
actually applied :
Normal practice
Any comment:
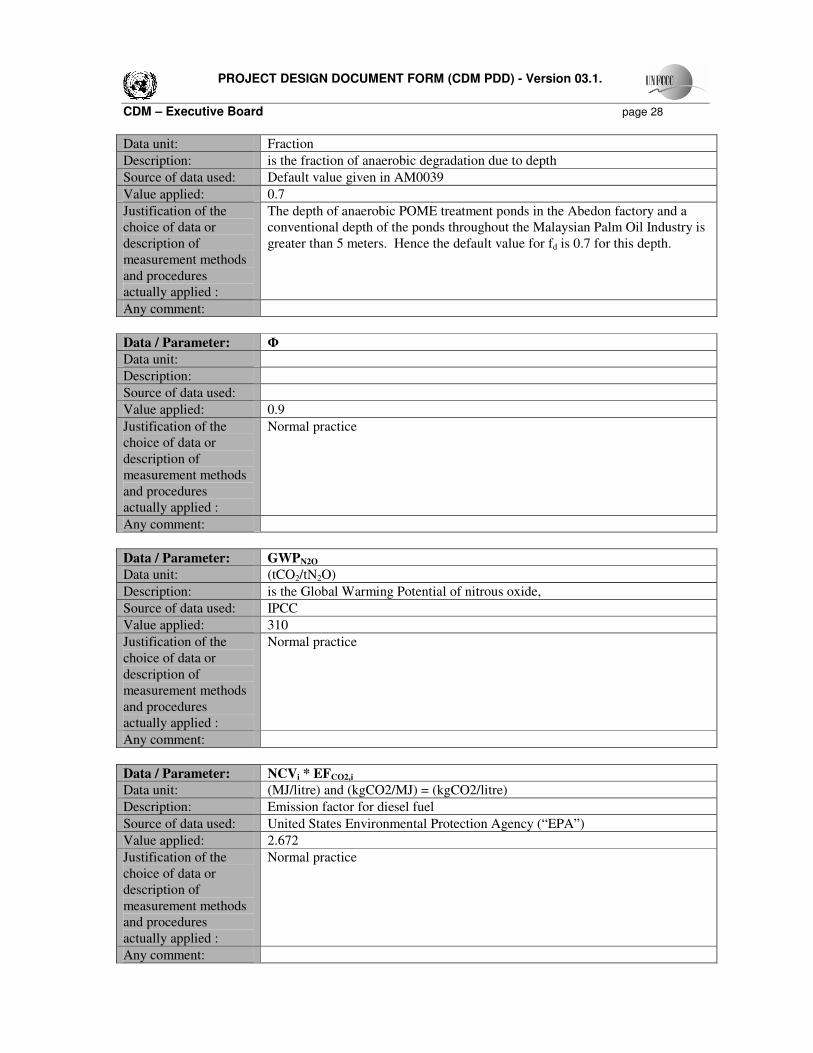
Data / Parameter: fd
PROJECT DESIGN DOCUMENT FORM (CDM PDD) - Version 03.1.
CDM – Executive Board page 28
Data unit: Fraction
Description: is the fraction of anaerobic degradation due to depth
Source of data used: Default value given in AM0039
Value applied: 0.7
Justification of the
choice of data or
description of
measurement methods
and procedures
actually applied :
The depth of anaerobic POME treatment ponds in the Abedon factory and a
conventional depth of the ponds throughout the Malaysian Palm Oil Industry is
greater than 5 meters. Hence the default value for fd is 0.7 for this depth.
Any comment:
Data / Parameter: Φ
Data unit:
Description:
Source of data used:
Value applied: 0.9
Justification of the
choice of data or
description of
measurement methods
and procedures
actually applied :
Normal practice
Any comment:
Data / Parameter: GWPN2O
Data unit: (tCO2/tN2O)
Description: is the Global Warming Potential of nitrous oxide,
Source of data used: IPCC
Value applied: 310
Justification of the
choice of data or
description of
measurement methods
and procedures
actually applied :
Normal practice
Any comment:
Data / Parameter: NCVi * EFCO2,i
Data unit: (MJ/litre) and (kgCO2/MJ) = (kgCO2/litre)
Description: Emission factor for diesel fuel
Source of data used: United States Environmental Protection Agency (“EPA”)
Value applied: 2.672
Justification of the
choice of data or
description of
measurement methods
and procedures
actually applied :
Normal practice
Any comment:

PROJECT DESIGN DOCUMENT FORM (CDM PDD) - Version 03.1.
CDM – Executive Board page 29
Data / Parameter: Dfuel Data unit: kg/l
Description: Density of diesel fuel
Source of data used: http://www.simetric.co.uk/si_liquids.htm
Value applied: 0.82 kg/l at 20o C
Justification of the
choice of data or
description of
measurement methods
and procedures
actually applied :
Any comment:
Data / Parameter: EFc,N2O
Data unit: (tN2O/t compost)
Description: Emission factor for N2O emissions from the composting process
Source of data used: AM0025
Value applied: 0.043
Justification of the
choice of data or
description of
measurement methods
and procedures
actually applied :
Default value recommended in AM0025
Any comment:
Data / Parameter: MCF
Data unit: Factor
Description: Methane Correction Factor
Source of data used: IPCC
Value applied: 0.8
Justification of the
choice of data or
description of
measurement methods
and procedures
actually applied :
The Abedon landfill is unmanaged with levelling of waste and some
compaction and is 7 meters in depth
Any comment:
Data / Parameter: F
Data unit: Fraction
Description: is the fraction of methane in the landfill gas, IPCC default value 0.5
Source of data used: IPCC default
Value applied: 0.5
Justification of the
choice of data or
description of
measurement methods
and procedures
actually applied :
This is the conservative value
PROJECT DESIGN DOCUMENT FORM (CDM PDD) - Version 03.1.
CDM – Executive Board page 30
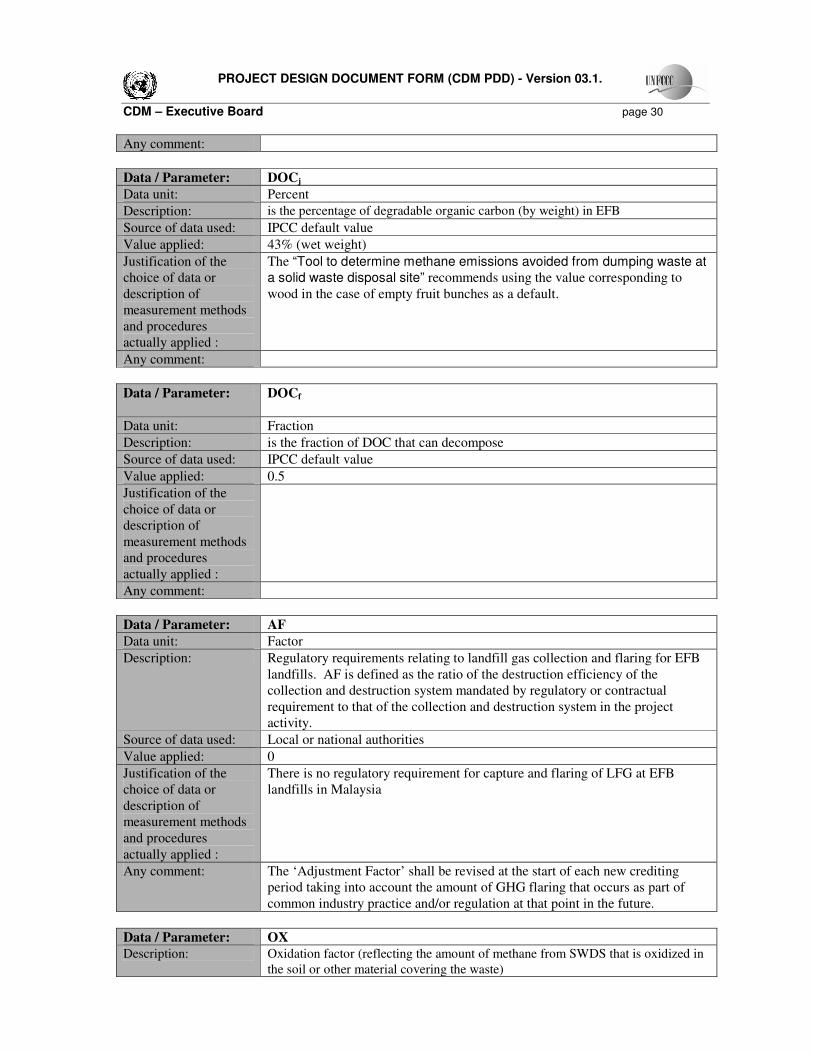
Any comment:
Data / Parameter: DOCj
Data unit: Percent
Description: is the percentage of degradable organic carbon (by weight) in EFB
Source of data used: IPCC default value
Value applied: 43% (wet weight)
Justification of the
choice of data or
description of
measurement methods
and procedures
actually applied :
The “Tool to determine methane emissions avoided from dumping waste at
a solid waste disposal site” recommends using the value corresponding to
wood in the case of empty fruit bunches as a default.
Any comment:
Data / Parameter: DOCf
Data unit: Fraction
Description: is the fraction of DOC that can decompose
Source of data used: IPCC default value
Value applied: 0.5
Justification of the
choice of data or
description of
measurement methods
and procedures
actually applied :
Any comment:
Data / Parameter: AF
Data unit: Factor
Description: Regulatory requirements relating to landfill gas collection and flaring for EFB
landfills. AF is defined as the ratio of the destruction efficiency of the
collection and destruction system mandated by regulatory or contractual
requirement to that of the collection and destruction system in the project
activity.
Source of data used: Local or national authorities
Value applied: 0
Justification of the
choice of data or
description of
measurement methods
and procedures
actually applied :
There is no regulatory requirement for capture and flaring of LFG at EFB
landfills in Malaysia
Any comment: The ‘Adjustment Factor’ shall be revised at the start of each new crediting
period taking into account the amount of GHG flaring that occurs as part of
common industry practice and/or regulation at that point in the future.
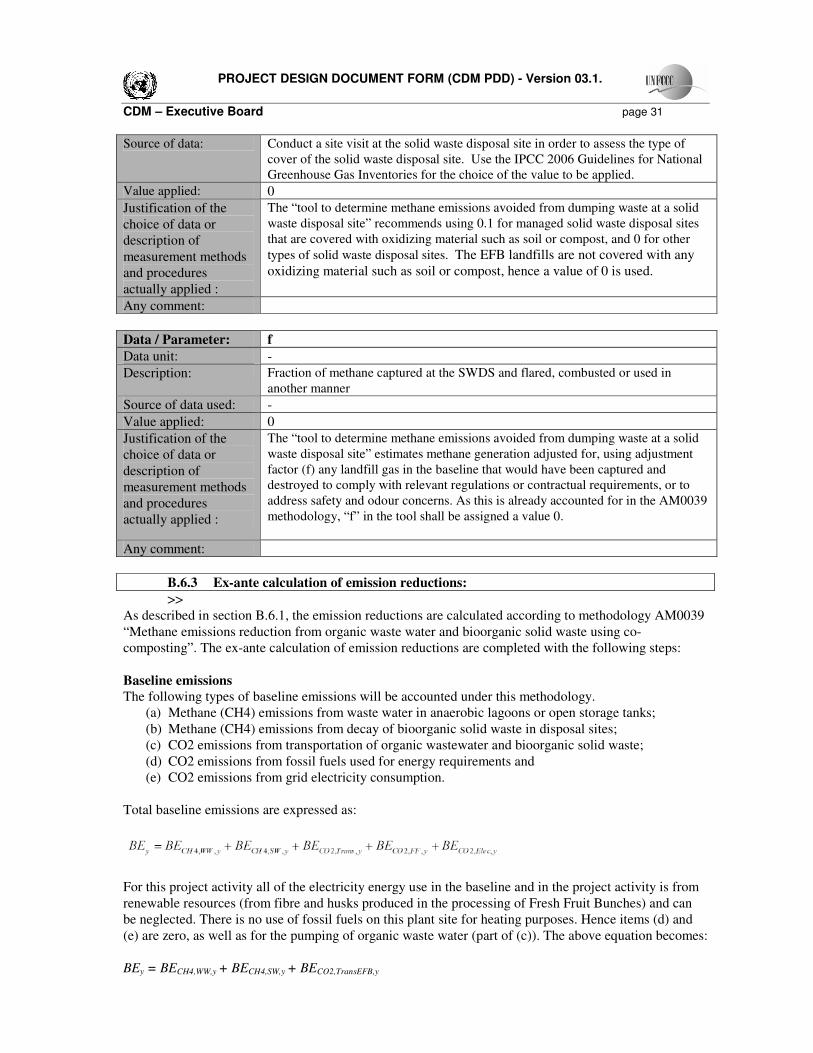
Data / Parameter: OX
Description: Oxidation factor (reflecting the amount of methane from SWDS that is oxidized in
the soil or other material covering the waste)
PROJECT DESIGN DOCUMENT FORM (CDM PDD) - Version 03.1.
CDM – Executive Board page 31
Source of data: Conduct a site visit at the solid waste disposal site in order to assess the type of
cover of the solid waste disposal site. Use the IPCC 2006 Guidelines for National
Greenhouse Gas Inventories for the choice of the value to be applied.
Value applied: 0
Justification of the
choice of data or
description of
measurement methods
and procedures
actually applied :
The “tool to determine methane emissions avoided from dumping waste at a solid
waste disposal site” recommends using 0.1 for managed solid waste disposal sites
that are covered with oxidizing material such as soil or compost, and 0 for other
types of solid waste disposal sites. The EFB landfills are not covered with any
oxidizing material such as soil or compost, hence a value of 0 is used.
Any comment:
Data / Parameter: f
Data unit: -
Description: Fraction of methane captured at the SWDS and flared, combusted or used in
another manner
Source of data used: -
Value applied: 0
Justification of the
choice of data or
description of
measurement methods
and procedures
actually applied :
The “tool to determine methane emissions avoided from dumping waste at a solid
waste disposal site” estimates methane generation adjusted for, using adjustment
factor (f) any landfill gas in the baseline that would have been captured and
destroyed to comply with relevant regulations or contractual requirements, or to
address safety and odour concerns. As this is already accounted for in the AM0039
methodology, “f” in the tool shall be assigned a value 0.
Any comment:
B.6.3 Ex-ante calculation of emission reductions:
>>
As described in section B.6.1, the emission reductions are calculated according to methodology AM0039
“Methane emissions reduction from organic waste water and bioorganic solid waste using co-
composting”. The ex-ante calculation of emission reductions are completed with the following steps:
Baseline emissions
The following types of baseline emissions will be accounted under this methodology.
(a) Methane (CH4) emissions from waste water in anaerobic lagoons or open storage tanks;
(b) Methane (CH4) emissions from decay of bioorganic solid waste in disposal sites;
(c) CO2 emissions from transportation of organic wastewater and bioorganic solid waste;
(d) CO2 emissions from fossil fuels used for energy requirements and
(e) CO2 emissions from grid electricity consumption.
Total baseline emissions are expressed as:
For this project activity all of the electricity energy use in the baseline and in the project activity is from
renewable resources (from fibre and husks produced in the processing of Fresh Fruit Bunches) and can
be neglected. There is no use of fossil fuels on this plant site for heating purposes. Hence items (d) and
(e) are zero, as well as for the pumping of organic waste water (part of (c)). The above equation becomes:
BEy = BECH4,WW,y + BECH4,SW,y + BECO2,TransEFB,y
PROJECT DESIGN DOCUMENT FORM (CDM PDD) - Version 03.1.
CDM – Executive Board page 32
Baseline Assumptions:
1. Raw POME concentration is 50,000 mg/L (before the POME sludge decanter) and after
anaerobic/aerobic treatment the concentration of COD in the effluent is less than 100 mg/l.
2. The average amount of FFB processed by the Abedon palm oil mill is estimated to be 210,000
t/year
3. The average amount of POME generated is 0.70 m3/t Fresh Fruit Bunches (as published by the
Malaysian Department of Environment. Industrial Processes & the environment. Handbook
number 3. Crude Palm Oil Industry). With the present production level of 210,000 t
FFB/year (WFFB,y ), the annual volume of POME (VPOME,y ) is 147,000 m3 /year. Ex-ante
calculations assume constant monthly amount throughout the year.
4. The average amount of EFB generated is 0.23 /t of FFB, the annual amount of EFB is 48,300
t/year
5. Average monthly temperatures are taken from the nearest meteorological station at Sandakan
(see Annex 3)
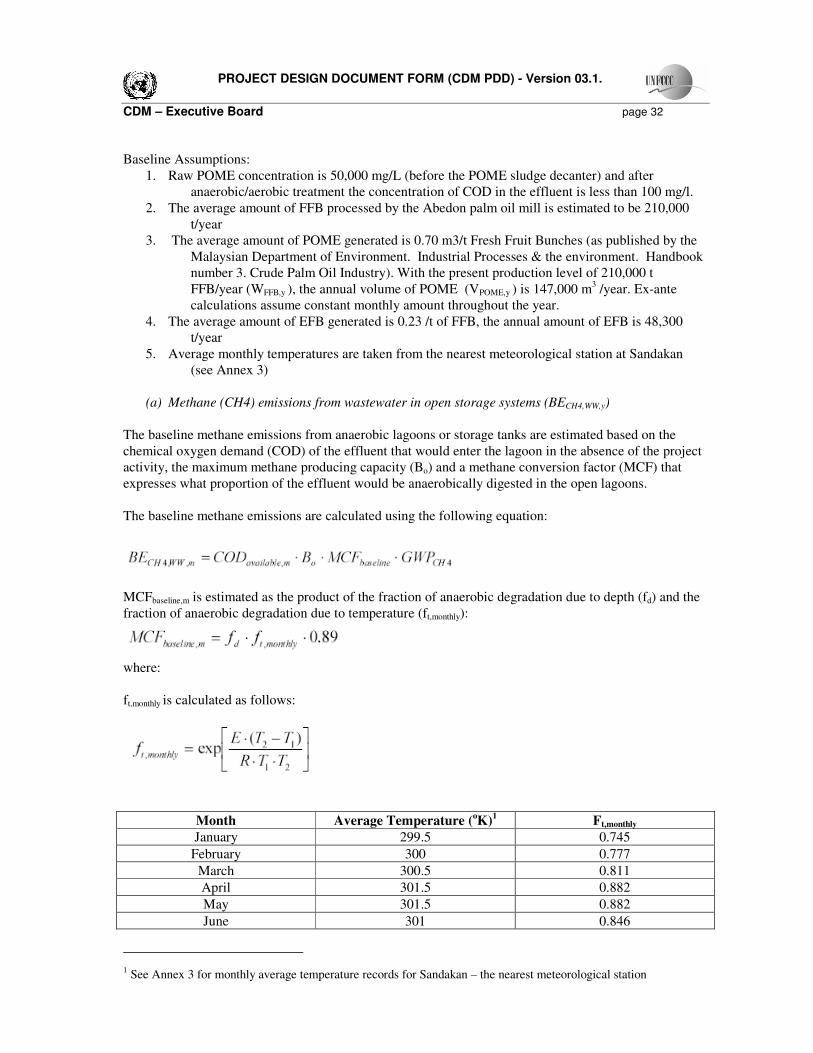
(a) Methane (CH4) emissions from wastewater in open storage systems (BECH4,WW,y)
The baseline methane emissions from anaerobic lagoons or storage tanks are estimated based on the
chemical oxygen demand (COD) of the effluent that would enter the lagoon in the absence of the project
activity, the maximum methane producing capacity (Bo) and a methane conversion factor (MCF) that
expresses what proportion of the effluent would be anaerobically digested in the open lagoons.
The baseline methane emissions are calculated using the following equation:
MCFbaseline,m is estimated as the product of the fraction of anaerobic degradation due to depth (fd) and the
fraction of anaerobic degradation due to temperature (ft,monthly):
where:
ft,monthly is calculated as follows:
Month Average Temperature (oK)
1 Ft,monthly
January 299.5 0.745
February 300 0.777
March 300.5 0.811
April 301.5 0.882
May 301.5 0.882
June 301 0.846
1 See Annex 3 for monthly average temperature records for Sandakan – the nearest meteorological station
PROJECT DESIGN DOCUMENT FORM (CDM PDD) - Version 03.1.
CDM – Executive Board page 33
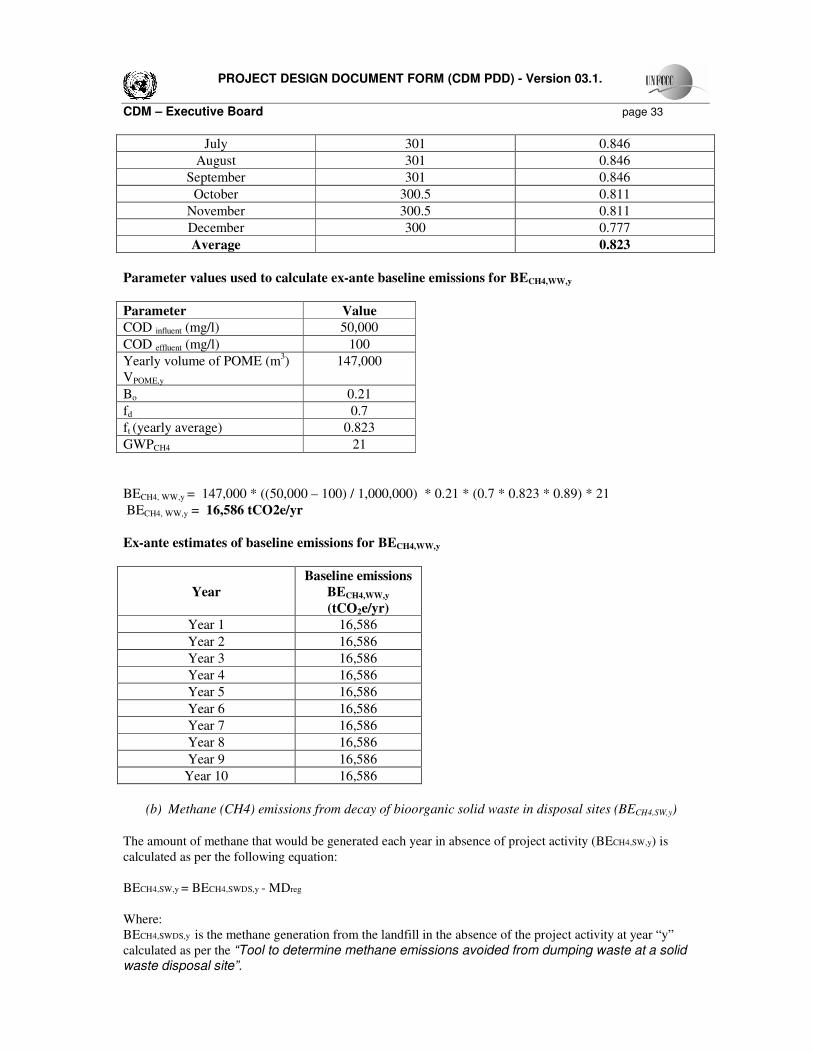
July 301 0.846
August 301 0.846
September 301 0.846
October 300.5 0.811
November 300.5 0.811
December 300 0.777
Average 0.823
Parameter values used to calculate ex-ante baseline emissions for BECH4,WW,y
Parameter Value
COD influent (mg/l) 50,000
COD effluent (mg/l) 100
Yearly volume of POME (m3)
VPOME,y
147,000
Bo 0.21
fd 0.7
ft (yearly average) 0.823
GWPCH4 21
BECH4, WW,y = 147,000 * ((50,000 – 100) / 1,000,000) * 0.21 * (0.7 * 0.823 * 0.89) * 21
BECH4, WW,y = 16,586 tCO2e/yr
Ex-ante estimates of baseline emissions for BECH4,WW,y
Year
Baseline emissions
BECH4,WW,y
(tCO2e/yr)
Year 1 16,586
Year 2 16,586
Year 3 16,586
Year 4 16,586
Year 5 16,586
Year 6 16,586
Year 7 16,586
Year 8 16,586
Year 9 16,586
Year 10 16,586
(b) Methane (CH4) emissions from decay of bioorganic solid waste in disposal sites (BECH4,SW,y)
The amount of methane that would be generated each year in absence of project activity (BECH4,SW,y) is
calculated as per the following equation:
BECH4,SW,y = BECH4,SWDS,y - MDreg
Where:
BECH4,SWDS,y is the methane generation from the landfill in the absence of the project activity at year “y”
calculated as per the “Tool to determine methane emissions avoided from dumping waste at a solid waste disposal site”.

PROJECT DESIGN DOCUMENT FORM (CDM PDD) - Version 03.1.
CDM – Executive Board page 34
And
MDreg is the methane that would be destroyed in the absence of the project activity in year y (tCH4)
MDreg,y = BECH4,SW,y * AF
The amount of methane produced in a year is calculated as follows:
There is no regulatory requirement in Malaysia to capture and flare landfill gas and no provision has
been made to capture and flare LFG at the Abedon EFB landfill site. Hence AF = 0 and MDreg,y = 0.
Parameter values used to calculate ex-ante baseline emissions for BECH4,SW,y
Parameter Value
Φ 0.9
Aj,x 48,300
MCF 0.8
DOCf 0.5
AF 0
GWPCH4 21
F 0.5
DOCj 0.43
kj 0.035
OX 0
f 0
Table B.6.3-8. Ex-ante estimates of baseline emissions for BECH4,SW,y
Year
Baseline
emissions
BECH4,SW,y
(tCO2e/yr)
Year 1 4,500
Year 2 8,846
Year 3 13,042
Year 4 17,094
Year 5 21,006
Year 6 24,784
Year 7 28,432
Year 8 31,954
Year 9 35,356
Year 10 38,640
(c) CO2 emissions from transportation of organic wastewater and bioorganic solid waste
(BECO2,Trans,y)
The baseline emissions from transportation are to be calculated using distance travelled by trucks and the
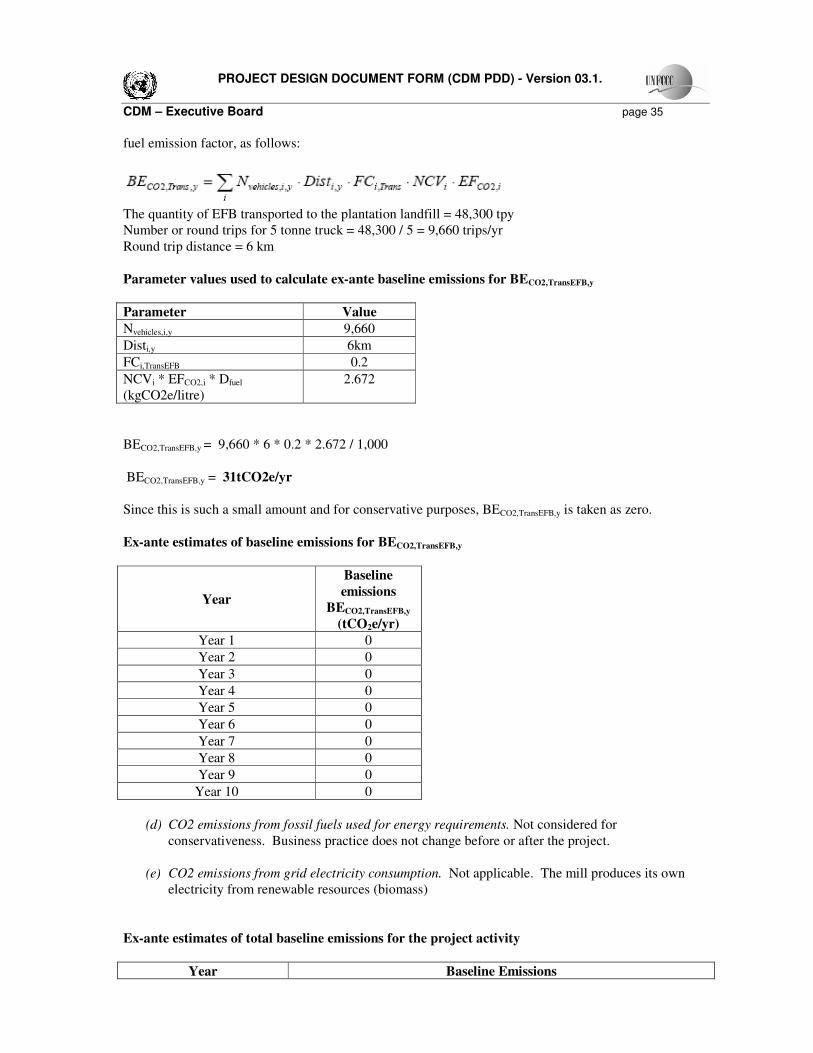
PROJECT DESIGN DOCUMENT FORM (CDM PDD) - Version 03.1.
CDM – Executive Board page 35
fuel emission factor, as follows:
The quantity of EFB transported to the plantation landfill = 48,300 tpy
Number or round trips for 5 tonne truck = 48,300 / 5 = 9,660 trips/yr
Round trip distance = 6 km
Parameter values used to calculate ex-ante baseline emissions for BECO2,TransEFB,y
Parameter Value
Nvehicles,i,y 9,660
Disti,y 6km
FCi,TransEFB 0.2
NCVi * EFCO2,i * Dfuel
(kgCO2e/litre)
2.672
BECO2,TransEFB,y = 9,660 * 6 * 0.2 * 2.672 / 1,000
BECO2,TransEFB,y = 31tCO2e/yr
Since this is such a small amount and for conservative purposes, BECO2,TransEFB,y is taken as zero.
Ex-ante estimates of baseline emissions for BECO2,TransEFB,y
Year
Baseline
emissions
BECO2,TransEFB,y
(tCO2e/yr)
Year 1 0
Year 2 0
Year 3 0
Year 4 0
Year 5 0
Year 6 0
Year 7 0
Year 8 0
Year 9 0
Year 10 0
(d) CO2 emissions from fossil fuels used for energy requirements. Not considered for
conservativeness. Business practice does not change before or after the project.
(e) CO2 emissions from grid electricity consumption. Not applicable. The mill produces its own
electricity from renewable resources (biomass)
Ex-ante estimates of total baseline emissions for the project activity
Year Baseline Emissions
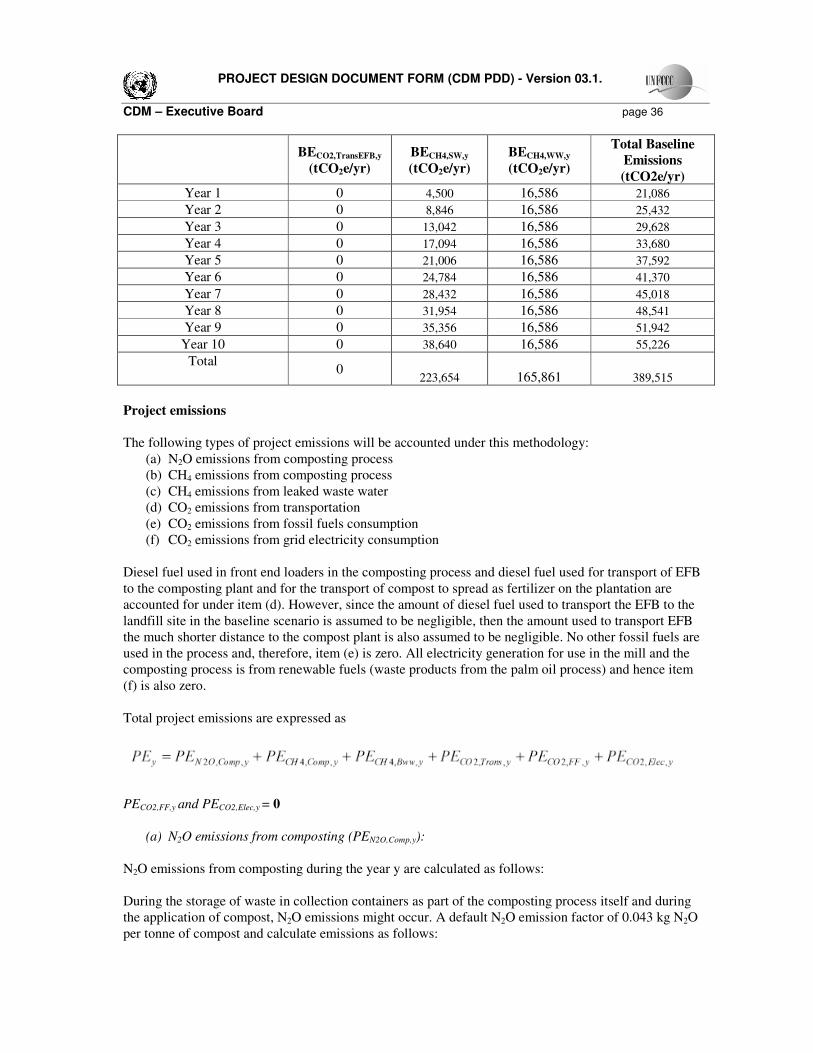
PROJECT DESIGN DOCUMENT FORM (CDM PDD) - Version 03.1.
CDM – Executive Board page 36
BECO2,TransEFB,y
(tCO2e/yr)
BECH4,SW,y
(tCO2e/yr)
BECH4,WW,y
(tCO2e/yr)
Total Baseline
Emissions
(tCO2e/yr)
Year 1 0 4,500 16,586 21,086
Year 2 0 8,846 16,586 25,432
Year 3 0 13,042 16,586 29,628
Year 4 0 17,094 16,586 33,680
Year 5 0 21,006 16,586 37,592
Year 6 0 24,784 16,586 41,370
Year 7 0 28,432 16,586 45,018
Year 8 0 31,954 16,586 48,541
Year 9 0 35,356 16,586 51,942
Year 10 0 38,640 16,586 55,226
Total 0
223,654
165,861 389,515
Project emissions
The following types of project emissions will be accounted under this methodology:
(a) N2O emissions from composting process
(b) CH4 emissions from composting process
(c) CH4 emissions from leaked waste water
(d) CO2 emissions from transportation
(e) CO2 emissions from fossil fuels consumption
(f) CO2 emissions from grid electricity consumption
Diesel fuel used in front end loaders in the composting process and diesel fuel used for transport of EFB
to the composting plant and for the transport of compost to spread as fertilizer on the plantation are
accounted for under item (d). However, since the amount of diesel fuel used to transport the EFB to the
landfill site in the baseline scenario is assumed to be negligible, then the amount used to transport EFB
the much shorter distance to the compost plant is also assumed to be negligible. No other fossil fuels are
used in the process and, therefore, item (e) is zero. All electricity generation for use in the mill and the
composting process is from renewable fuels (waste products from the palm oil process) and hence item
(f) is also zero.
Total project emissions are expressed as
PECO2,FF,y and PECO2,Elec,y = 0
(a) N2O emissions from composting (PEN2O,Comp,y):
N2O emissions from composting during the year y are calculated as follows:
During the storage of waste in collection containers as part of the composting process itself and during
the application of compost, N2O emissions might occur. A default N2O emission factor of 0.043 kg N2O
per tonne of compost and calculate emissions as follows:
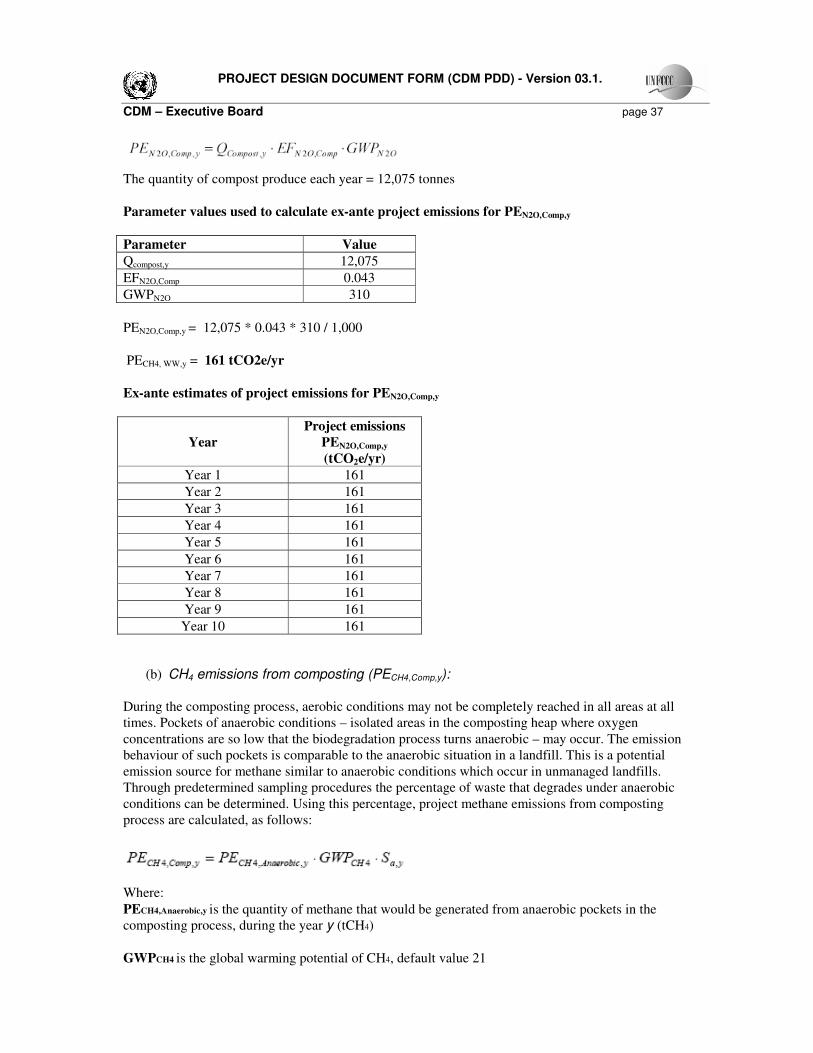
PROJECT DESIGN DOCUMENT FORM (CDM PDD) - Version 03.1.
CDM – Executive Board page 37
The quantity of compost produce each year = 12,075 tonnes
Parameter values used to calculate ex-ante project emissions for PEN2O,Comp,y
Parameter Value
Qcompost,y 12,075
EFN2O,Comp 0.043
GWPN2O 310
PEN2O,Comp,y = 12,075 * 0.043 * 310 / 1,000
PECH4, WW,y = 161 tCO2e/yr
Ex-ante estimates of project emissions for PEN2O,Comp,y
Year
Project emissions
PEN2O,Comp,y
(tCO2e/yr)
Year 1 161
Year 2 161
Year 3 161
Year 4 161
Year 5 161
Year 6 161
Year 7 161
Year 8 161
Year 9 161
Year 10 161
(b) CH4 emissions from composting (PECH4,Comp,y):
During the composting process, aerobic conditions may not be completely reached in all areas at all
times. Pockets of anaerobic conditions – isolated areas in the composting heap where oxygen
concentrations are so low that the biodegradation process turns anaerobic – may occur. The emission
behaviour of such pockets is comparable to the anaerobic situation in a landfill. This is a potential
emission source for methane similar to anaerobic conditions which occur in unmanaged landfills.
Through predetermined sampling procedures the percentage of waste that degrades under anaerobic
conditions can be determined. Using this percentage, project methane emissions from composting
process are calculated, as follows:
Where:
PECH4,Anaerobic,y is the quantity of methane that would be generated from anaerobic pockets in the
composting process, during the year y (tCH4)
GWPCH4 is the global warming potential of CH4, default value 21

PROJECT DESIGN DOCUMENT FORM (CDM PDD) - Version 03.1.
CDM – Executive Board page 38
Sa,y Is the share of waste that degrades under anaerobic conditions in the composting plant
during the year y (%). Sa, y = SOD,y / Stotal,y = Number of Samples with oxygen level <10% / Number of
samples taken for oxygen measurement. SOD,y & Stotal,y will be determined as described in section B.7,
Monitoring plan
The proposed tunnel composting process maintains a high concentration of oxygen by a very consistent
and even distribution of airflow throughout the mass of composting waste. Hence it is expected that Sa,y =
0.
Therefore:
PECH4,Comp,y = 0
(c) CH4 emissions from the leaked wastewater (PECH4,bww,y):
Projects such as composting will usually have no wastewater discharge but there is a possibility that a
small quantity of leaked wastewater is collected from windrows or as a balance of waste water and this
leak wastewater may cause CH4 emissions.
CH4 emissions from leak and/or balance of waste water shall be calculated as follows.
However, in this project the proposed tunnel composting process collects all leachate and recycles it back
to the process.
Therefore:
PECH4,BWW,y = 0
(d) CO2 emissions from transportation (PECO2,Trans,y):
The project emissions from transportation are to be calculated using the total distance and local, national
or local version of IPCC Guidelines default values for transportation fuel, as follows:
Transport fuel is used in the composting process as fuel for front end loaders and for the transport of
compost to spread on the plantation as fertilizer.
Fuel for front end loaders
Number of front end loaders = 2
Yearly operating hours of front end loaders = 4 hours/day x 300 days = 1,200 hours
Diesel Fuel use per operating hr = 30x2 = 60 litres
Total yearly fuel use by front end loaders (Fcompost,y ) = 72,000 litres
NCVi * EFCO2,i (kgCO2e/litre) = 2.672 (United States Environmental Protection Agency (“EPA”)
Then: PECO2,Trans,y I = 72,000 * 2.672 / 1,000 = 192
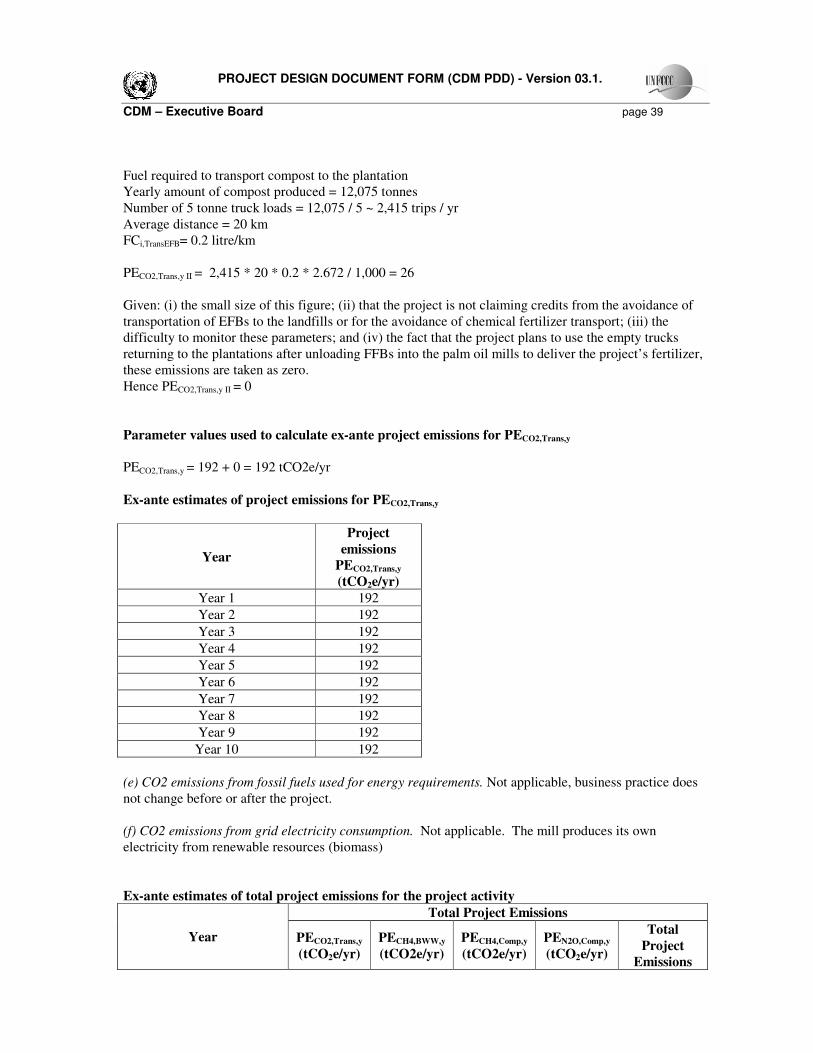
PROJECT DESIGN DOCUMENT FORM (CDM PDD) - Version 03.1.
CDM – Executive Board page 39
Fuel required to transport compost to the plantation
Yearly amount of compost produced = 12,075 tonnes
Number of 5 tonne truck loads = 12,075 / 5 ~ 2,415 trips / yr
Average distance = 20 km
FCi,TransEFB= 0.2 litre/km
PECO2,Trans,y II = 2,415 * 20 * 0.2 * 2.672 / 1,000 = 26
Given: (i) the small size of this figure; (ii) that the project is not claiming credits from the avoidance of
transportation of EFBs to the landfills or for the avoidance of chemical fertilizer transport; (iii) the
difficulty to monitor these parameters; and (iv) the fact that the project plans to use the empty trucks
returning to the plantations after unloading FFBs into the palm oil mills to deliver the project’s fertilizer,
these emissions are taken as zero.
Hence PECO2,Trans,y II = 0
Parameter values used to calculate ex-ante project emissions for PECO2,Trans,y
PECO2,Trans,y = 192 + 0 = 192 tCO2e/yr
Ex-ante estimates of project emissions for PECO2,Trans,y
Year
Project
emissions
PECO2,Trans,y
(tCO2e/yr)
Year 1 192
Year 2 192
Year 3 192
Year 4 192
Year 5 192
Year 6 192
Year 7 192
Year 8 192
Year 9 192
Year 10 192
(e) CO2 emissions from fossil fuels used for energy requirements. Not applicable, business practice does
not change before or after the project.
(f) CO2 emissions from grid electricity consumption. Not applicable. The mill produces its own
electricity from renewable resources (biomass)
Ex-ante estimates of total project emissions for the project activity
Total Project Emissions
Year PECO2,Trans,y
(tCO2e/yr)
PECH4,BWW,y
(tCO2e/yr)
PECH4,Comp,y
(tCO2e/yr)
PEN2O,Comp,y
(tCO2e/yr)
Total
Project
Emissions

PROJECT DESIGN DOCUMENT FORM (CDM PDD) - Version 03.1.
CDM – Executive Board page 40
(tCO2e/yr)
Year 1 192 0 0 161 353
Year 2 192 0 0 161 353
Year 3 192 0 0 161 353
Year 4 192 0 0 161 353
Year 5 192 0 0 161 353
Year 6 192 0 0 161 353
Year 7 192 0 0 161 353
Year 8 192 0 0 161 353
Year 9 192 0 0 161 353
Year 10 192 0 0 161 353
Total 1,923 0 0 1,610 3,533
Leakage
No leakage effects need to be accounted under this methodology.
B.6.4 Summary of the ex-ante estimation of emission reductions:
>>
Emission reductions
Emission reductions are calculated as follows:
Ex-Ante Estimate of Emission Reductions for the project activity
Year
Estimation
of baseline
emissions
(tCO2e)
Estimation of
project activity
emissions (tCO2e)
Estimation
of leakage
(tCO2e)
Estimation of
emission
reductions
(tCO2e)
Year 1 21,086 353 0 20,733
Year 2 25,432 353 0 25,079
Year 3 29,628 353 0 29,275
Year 4 33,680 353 0 33,327
Year 5 37,592 353 0 37,239
Year 6 41,370 353 0 41,017
Year 7 45,018 353 0 44,665
Year 8 48,541 353 0 48,187
Year 9 51,942 353 0 51,588
Year 10 55,226 353 0 54,873
Total
389,515
3,533 0
385,982
B.7 Application of the monitoring methodology and description of the monitoring plan:
B.7.1 Data and parameters monitored:
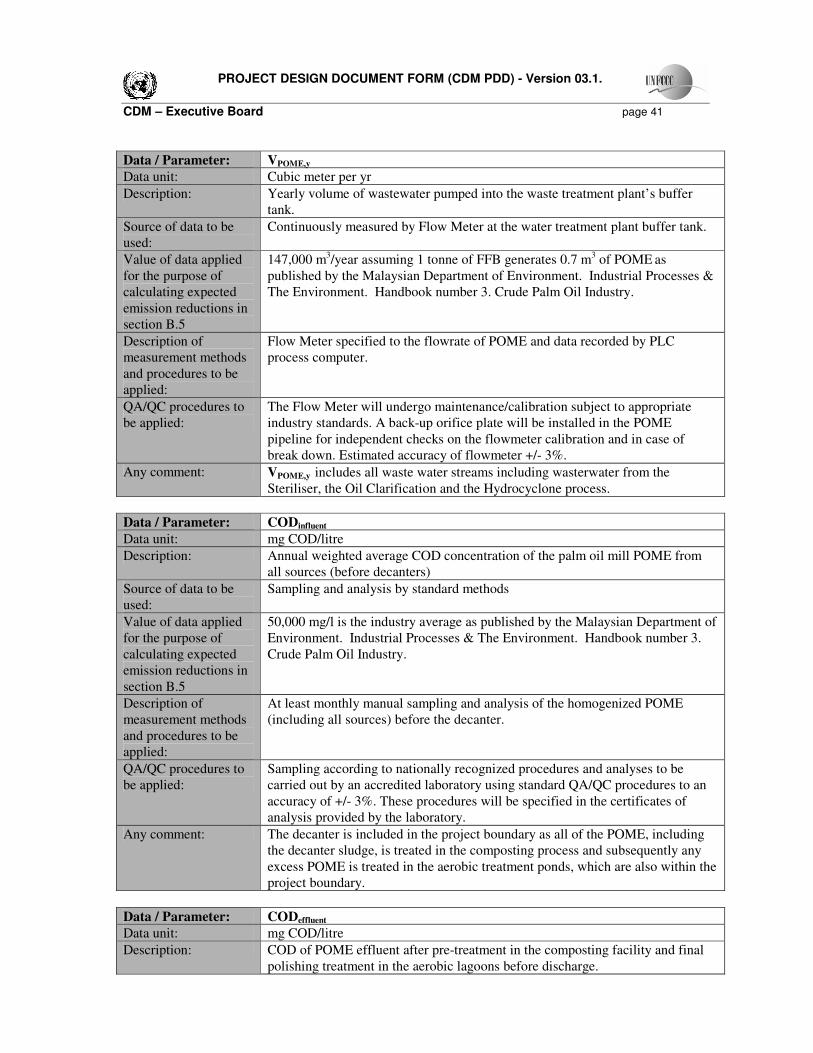
PROJECT DESIGN DOCUMENT FORM (CDM PDD) - Version 03.1.
CDM – Executive Board page 41
Data / Parameter: VPOME,y
Data unit: Cubic meter per yr
Description: Yearly volume of wastewater pumped into the waste treatment plant’s buffer
tank.
Source of data to be
used:
Continuously measured by Flow Meter at the water treatment plant buffer tank.
Value of data applied
for the purpose of
calculating expected
emission reductions in
section B.5
147,000 m3/year assuming 1 tonne of FFB generates 0.7 m3 of POME as
published by the Malaysian Department of Environment. Industrial Processes &
The Environment. Handbook number 3. Crude Palm Oil Industry.
Description of
measurement methods
and procedures to be
applied:
Flow Meter specified to the flowrate of POME and data recorded by PLC
process computer.
QA/QC procedures to
be applied:
The Flow Meter will undergo maintenance/calibration subject to appropriate
industry standards. A back-up orifice plate will be installed in the POME
pipeline for independent checks on the flowmeter calibration and in case of
break down. Estimated accuracy of flowmeter +/- 3%.
Any comment: VPOME,y includes all waste water streams including wasterwater from the
Steriliser, the Oil Clarification and the Hydrocyclone process.
Data / Parameter: CODinfluent
Data unit: mg COD/litre
Description: Annual weighted average COD concentration of the palm oil mill POME from
all sources (before decanters)
Source of data to be
used:
Sampling and analysis by standard methods
Value of data applied
for the purpose of
calculating expected
emission reductions in
section B.5
50,000 mg/l is the industry average as published by the Malaysian Department of
Environment. Industrial Processes & The Environment. Handbook number 3.
Crude Palm Oil Industry.
Description of
measurement methods
and procedures to be
applied:
At least monthly manual sampling and analysis of the homogenized POME
(including all sources) before the decanter.
QA/QC procedures to
be applied:
Sampling according to nationally recognized procedures and analyses to be
carried out by an accredited laboratory using standard QA/QC procedures to an
accuracy of +/- 3%. These procedures will be specified in the certificates of
analysis provided by the laboratory.
Any comment: The decanter is included in the project boundary as all of the POME, including
the decanter sludge, is treated in the composting process and subsequently any
excess POME is treated in the aerobic treatment ponds, which are also within the
project boundary.
Data / Parameter: CODeffluent
Data unit: mg COD/litre
Description: COD of POME effluent after pre-treatment in the composting facility and final
polishing treatment in the aerobic lagoons before discharge.

PROJECT DESIGN DOCUMENT FORM (CDM PDD) - Version 03.1.
CDM – Executive Board page 42
Source of data to be
used:
Sampling and analysis by standard methods.
Value of data applied
for the purpose of
calculating expected
emission reductions in
section B.5
100 mg/l
Description of
measurement methods
and procedures to be
applied:
At least monthly manual sampling and analysis of the POME effluent discharge
from the aerobic treatment ponds.
QA/QC procedures to
be applied:
Sampling according to nationally recognized procedures and analyses to be
carried out by an accredited laboratory using standard QA/QC procedures to an
accuracy of +/- 3%. These procedures will be specified in the certificates of
analysis provided by the laboratory.
Any comment: A large percentage of the COD will be eliminated from the POME in the
suspended solids removal treatment as a pre-treatment in the co-composting
facility, while some 60% of the POME will be dissipated in the composting
process. The remaining pre-treated POME will receive a final polishing
treatment in aerobic lagoons prior to discharge.
Data / Parameter: Aj,x
Data unit: metric tonne (t)
Description: The amount of EFB processed by the waste treatment plant
Source of data to be
used:
Weight of FFB entering the mill on a daily basis with application of a standard
23% factor relating the amount of EFB produced to the quantity of FFB.
Value of data applied
for the purpose of
calculating expected
emission reductions in
section B.5
48,300 t/year per plant (1 tonne of FFB produces 0.23 t of EFB)
Description of
measurement methods
and procedures to be
applied:
The weight of FFB will be based on the measurement recorded by mill at their
weighbridge as part of the mills inventory management.
QA/QC procedures to
be applied:
Calibration and maintenance of weighing bridge subject to appropriate industry
standards at an estimated accuracy of +/- 3%.
Any comment: The Malaysian Department of Environment has published a process mass
balance for Oil Palm mills in Malaysia which also applies to the Abedon mill.
The reference is included in Annex 3 and shows that 0.23 tonne of EFB is
produced for every tonne of FFB. All of the EFB will be processed in the
composting plant on a daily basis for 365 days per year. The plant is designed to
allow regular and periodic maintenance without having to shut down the process
for any extended period.
Data / Parameter: Fcons
Data unit: Litres
Description: Fuel consumption for equipment used in the composting process
Source of data to be
used:
Purchase invoices for dedicated fuel depot at compost plant

PROJECT DESIGN DOCUMENT FORM (CDM PDD) - Version 03.1.
CDM – Executive Board page 43
Value of data applied
for the purpose of
calculating expected
emission reductions in
section B.5
72,000 litres/yr
Description of
measurement methods
and procedures to be
applied:
Fuel consumed to be defined by billing figures from fuel suppliers with a high
level of accuracy estimated at +/- 1%.
QA/QC procedures to
be applied:
The amount of fuel will be derived from the paid fuel invoices with appropriate
management auditing.
Any comment:
Data / Parameter: Qcompost,y
Data unit:
Description: Total quantity of compost produced in the year.
Source of data to be
used:
Continual, daily records of production inventory, typically measured by standard
40kg bags or 1-tonne PP bulk bags.
Value of data applied
for the purpose of
calculating expected
emission reductions in
section B.5
12,075 tonnes/yr (Assumes 75% volume reduction during composting process)
Description of
measurement methods
and procedures to be
applied:
The measurement will be based on the measurements taken at the
packaging/distribution plant
QA/QC procedures to
be applied:
Scales at packaging/distribution plant to be regularly maintained and calibrated
according to manufacturer’s instructions with an estimated accuracy of +/- 3%.
Any comment:
Data / Parameter: SOD,y
Data unit: Number
Description: Number of samples with oxygen level < 10%
Source of data to be
used:
Oxygen sensor and transmitter
Value of data applied
for the purpose of
calculating expected
emission reductions in
section B.5
0
Description of
measurement methods
and procedures to be
applied:
n/a
QA/QC procedures to
be applied:
Oxygen sensor and transmitter to be calibrated on a regular basis according to
the manufacturer’s instructions. Measurement itself to be continuous and
automated by using PLC/SCADA process control system. A statistically
significant sampling procedure will be set up that consists of multiple
measurements throughout the different stages of the composting process
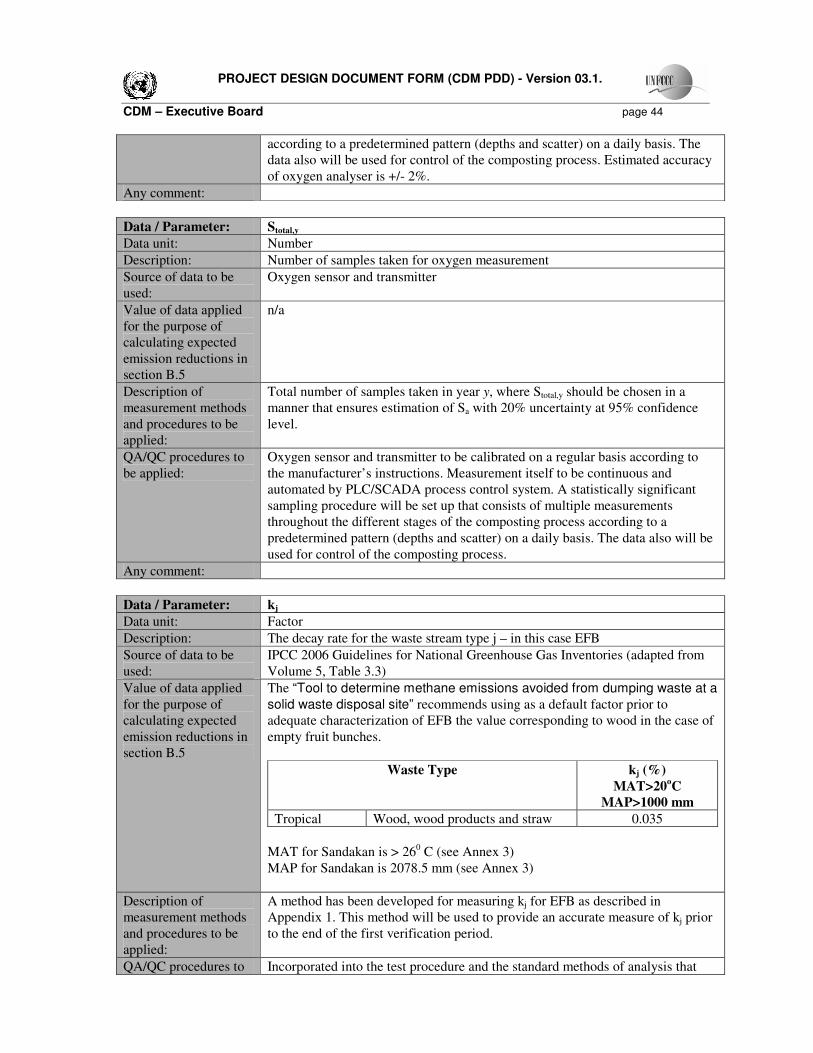
PROJECT DESIGN DOCUMENT FORM (CDM PDD) - Version 03.1.
CDM – Executive Board page 44
according to a predetermined pattern (depths and scatter) on a daily basis. The
data also will be used for control of the composting process. Estimated accuracy
of oxygen analyser is +/- 2%.
Any comment:
Data / Parameter: Stotal,y
Data unit: Number
Description: Number of samples taken for oxygen measurement
Source of data to be
used:
Oxygen sensor and transmitter
Value of data applied
for the purpose of
calculating expected
emission reductions in
section B.5
n/a
Description of
measurement methods
and procedures to be
applied:
Total number of samples taken in year y, where Stotal,y should be chosen in a
manner that ensures estimation of Sa with 20% uncertainty at 95% confidence
level.
QA/QC procedures to
be applied:
Oxygen sensor and transmitter to be calibrated on a regular basis according to
the manufacturer’s instructions. Measurement itself to be continuous and
automated by PLC/SCADA process control system. A statistically significant
sampling procedure will be set up that consists of multiple measurements
throughout the different stages of the composting process according to a
predetermined pattern (depths and scatter) on a daily basis. The data also will be
used for control of the composting process.
Any comment:
Data / Parameter: kj
Data unit: Factor
Description: The decay rate for the waste stream type j – in this case EFB
Source of data to be
used:
IPCC 2006 Guidelines for National Greenhouse Gas Inventories (adapted from
Volume 5, Table 3.3)
Value of data applied
for the purpose of
calculating expected
emission reductions in
section B.5
The “Tool to determine methane emissions avoided from dumping waste at a
solid waste disposal site” recommends using as a default factor prior to
adequate characterization of EFB the value corresponding to wood in the case of
empty fruit bunches.
Waste Type kj (%)
MAT>20oC
MAP>1000 mm
Tropical Wood, wood products and straw 0.035
MAT for Sandakan is > 260 C (see Annex 3)
MAP for Sandakan is 2078.5 mm (see Annex 3)
Description of
measurement methods
and procedures to be
applied:
A method has been developed for measuring kj for EFB as described in
Appendix 1. This method will be used to provide an accurate measure of kj prior
to the end of the first verification period.
QA/QC procedures to Incorporated into the test procedure and the standard methods of analysis that
PROJECT DESIGN DOCUMENT FORM (CDM PDD) - Version 03.1.
CDM – Executive Board page 45
be applied: have been specified. QA/QC procedures of the accredited laboratory carrying out
the tests will be provided with the test data
Any comment: Due to the very high annual rainfall and temperature in this area of Malaysia and
the highly biodegradable nature of EFB, the decay rate factor for EFB under
anaerobic conditions in a landfill will be significantly higher than the value
recommended for wood waste at MAT > 200 C and MAP > 1000 mm in the
IPCC 2006 Guidelines. It is necessary, therefore, to carry out a test to accurately
determine this value. The default value above as defined by IPCC would be used
should the proposed tests prove not adequate to test the specific characteristics of
this waste stream.
PROJECT DESIGN DOCUMENT FORM (CDM PDD) - Version 03.1.
CDM – Executive Board page 46
B.7.2 Description of the monitoring plan:
>>
MONITORING PLAN
1. Introduction
A special purpose vehicle (SPV) has been set up to own and operate the composting plant. The purpose
of the Monitoring Plan (MP) is to provide a standard by which the SPV will conduct monitoring and
verification of the proposed CDM project activity. The MP will be in accordance with all relevant rules
and regulations of the CDM. The MP forms an integral part of this PDD and will facilitate accurate and
consistent monitoring of the Project’s Certified Emission Reductions (CERs). The SPV will use the MP
for the duration of the project activity and will refine and expand it from time to time, as required. A
CDM Management Unit has been established within the SPV organizational structure to manage the
preparation and implementation phases of the proposed CDM project activity. During implementation it
will be responsible for organizing and supervising all of the monitoring activities required for accurate
and timely verification and reporting of the CERs generated.
2. Specific Objectives of the Monitoring Plan
Specifically, the objectives of the MP are the following:
• Establishing and maintaining a reliable and accurate monitoring system
• Provide guidance for the implementation of necessary measurement and record management
operations
• Guidance for meeting CDM requirements for verification and certification
3. Operational and Monitoring Obligations
The MP will be supported by a CDM Operations and Monitoring Manual which will be prepared before
the start of the first crediting period and will be tested during start up of the components of the project
activity. This will provide an opportunity to correct any deficiencies and further refine the monitoring
and recording procedures. It will also provide an opportunity to train laboratory and operating personnel
in the strict requirements for accuracy in collecting and recording data for CDM purposes.
4. Management and Operational Systems
In order to ensure a successful operation of the Project and the credibility and verifiability of the CERs
achieved, the Project will have a well-defined management and operational system. A system will be put
in place for the project activity and include the operation and management of the monitoring and record
keeping system that is described in the MP.
The first line of responsibility for implementing the MP will be the Board and Managing Director of the
SPV. The CDM coordinator reports directly to the Managing Director. The coordinator’s primary
responsibility is to ensure that all monitoring and data recording for the project activity meet the
requirements for CER verification and certification. This will involve:
• The establishment of transparent systems for the collection, computation and storage of data,
including adequate record keeping and data monitoring systems.
• Setting internal auditing procedures for data verification consistent with CDM requirements
• Setting up a regular reporting system meeting internal and external requirements
• Establishing quality control procedures for all monitorable parameters
• Evaluating training needs and carrying out training programs
PROJECT DESIGN DOCUMENT FORM (CDM PDD) - Version 03.1.
CDM – Executive Board page 47
• Monitoring and reviewing safety and environmental aspects of the CDM operations
• Community and stakeholder consultation.
The monitoring requirements for the project activity are described in detail in Annex 4 and are not
repeated here.
B.8 Date of completion of the application of the baseline study and monitoring methodology
and the name of the responsible person(s)/entity(ies)
>>
Date of completion: 8/06/2007
Person/entity determining the baseline:
Climate Change Capital Ltd. acting on behalf of Climate Change Capital Carbon Fund II S.a.r.l
3 More London Riverside, London, SE1 2AQ
Javier Rojo
Tel: +44 (0)20 7939 5229
Fax: +44 (0)20 7939 5030
Climate Change Capital Carbon Fund II S.à r.l is the Project CDM investor and also a Project Participant
SECTION C. Duration of the project activity / crediting period
C.1 Duration of the project activity:
C.1.1. Starting date of the project activity:
>>
07/12/2006 is the date that marks the formation of project team and the date when the project participants
started to consider the implementation of the proposed technology.
Physical implementation of the project activity is expected to start in May 2008 with the preparation of a
tender process for the construction of the required facilities. Construction works are expected to be
completed in September 2008 and the start of operations is expected by October 2008.
C.1.2. Expected operational lifetime of the project activity:
>>
10 years
C.2 Choice of the crediting period and related information:
C.2.1. Renewable crediting period
C.2.1.1. Starting date of the first crediting period:
>>
N/A
C.2.1.2. Length of the first crediting period:
>>
N/A

PROJECT DESIGN DOCUMENT FORM (CDM PDD) - Version 03.1.
CDM – Executive Board page 48
C.2.2. Fixed crediting period:
C.2.2.1. Starting date:
>>
01/10/2008 (Expected)
C.2.2.2. Length: >>
10 years
SECTION D. Environmental impacts
>>
D.1. Documentation on the analysis of the environmental impacts, including transboundary
impacts:
>>
The project activity will not have any adverse environmental impacts. Furthermore the activity does not
fall under those that require Environmental Impact Assessment (EIA) by the host country. The project
activity will provide the following environment benefits:
• Reduction of methane and other odorous emissions from the EFB landfill and the anaerobic
POME lagoons
• Control of odours in the tunnel composting process with treatment of any air emissions through a
compost bio-filter
• No leachate emissions from the tunnel composting process as all leachate is collected a recycled
to the process
• Recycling of waste back to the plantation as an enriched compost
• Reduced use of chemical fertilisers
• Improve soil conditions in the oil palm plantation
• Prevent BSR disease in the oil palm plantation
• Prevent leachate runoff into streams from EFB landfill
D.2. If environmental impacts are considered significant by the project participants or the host
Party, please provide conclusions and all references to support documentation of an environmental
impact assessment undertaken in accordance with the procedures as required by the host Party:
>>
Environmental impacts of the process are negligible, while the environmental benefits are substantial.

PROJECT DESIGN DOCUMENT FORM (CDM PDD) - Version 03.1.
CDM – Executive Board page 49
SECTION E. Stakeholders’ comments
>>
E.1. Brief description how comments by local stakeholders have been invited and compiled:
>>
A public forum was organized in conjunction with the requirement for a consultation of local
stakeholders in the design for the CDM Project on waste recycling through integrated waste
management at Abedon Oil Mill, Kinabatangan, Sabah. The public forum was held at the Sabah
Hotel, Sandakan on 9th
May from 9.00 a.m. to 12.00 noon.
The potential stakeholders were identified, including government, industry and business, non-
government organisations (NGOs), academia, civil society and the media. Invitations were sent directly
to more than 50 potential stakeholders about 3 weeks before the date of the forum. In addition, an
advertisement, announcing the public forum, was placed in a local newspaper, the Daily Express.
A total of 47 participants attended the public forum. A brief introduction was given by the Chairman, Mr.
Shen Lim of Inno Integrasi, before presentations as follows:
• The Clean Development Mechanism - Javier Rojo of Climate Change Capital,
• The background of the Palm Oil Industry, waste management, bio-products generated from
integrated waste management, and the proposed project at Abedon Oil Mill - Shen Lim of Inno
Integrasi
• The technology of the EcoRegen system for integrated waste management at the palm oil mill -
Mr. Khai Yip Mun of EcoRegen
E.2. Summary of the comments received:
>>
Comments and questions received covered issues such as project sustainability, approval from the
Department of Environment, resource depletion, discharges/emissions into the environment, economic
benefits to the industry, impact to the local community and clarification of the relevance of CDM. These
comments are questions are detailed in the following section E.3.
Following the Q&A the Chairman thanked the participants, and informed that the relevant issues and
concerns raised would be taken into account for the finalizing of the PDD and the full PDD would be
posted on the website by the Project Validator, SGS, for 30 days on completion of the validation report,
for comments and feedback from all interested stakeholders.
E.3. Report on how due account was taken of any comments received:
>>
PROJECT DESIGN DOCUMENT FORM (CDM PDD) - Version 03.1.
CDM – Executive Board page 50
Question/Comment Response
1. Is the technology approved by the Department of
Environment (DOE)?
EcoRegen has met and presented to the DOE Sabah
and received an encouraging response. The application
submission process for approval of the technology for
Abedon Oil Mill is currently in progress.
2. How sustainable is the project in terms of
energy consumption – will more fossil fuel be
required to operate the technology?
In Abedon there is excess power capacity from
renewable sources in the current operation that can be
used by the waste treatment system, which is far in
excess of the level of power required by the waste
treatment plant.
3. How does CDM apply to this project? The project activities qualify for CDM through
avoiding the release of methane emissions. In the
business as usual scenario methane is released through
the anaerobic degradation of both the solid and liquid
wastes.
4. This project does not result in zero-discharge. This process does not result in zero-discharge, but does
treat 100% of the waste from the palm oil mill and
reduces leachate to zero. The fertilizer is produced
from 60% of the POME volume, 100% of the EFB and
solids removed from the remaining 40% of the POME.
The residual water from the 40% POME has
significantly reduced COD following the removal of
suspended solids and is finally treated aerobically.
5. During high season of production, there is
excess power available for the waste treatment
plant, but during low production season, will the
project have to resort to fossil fuel for energy?
The waste treatment plant does need a limited amount
of power to operate at night. During high season the
power requirement of the waste treatment plant can be
met fully by normal operation of the palm oil mill.
During low season the waste treatment plant will
require power supply at times when the palm oil mill
will not be operational. At these times the existing
renewable energy supply will still be more than
adequate to cover requirement. However, in the event
that back-up power from diesel is required, then the
diesel usage will be included in the project emissions
calculation.
6. Does the project meet Malaysia’s policy on
sustainable development?
Yes, in the 3 areas of environmental, social and
economic sustainability. These are attained through
treating 100% of the wastes, creating new and skilled
jobs and producing bio-organic fertilisers.
7. What is the impact on the local community,
especially on the communities downstream of the
project.
Job creation and more opportunities for developing and
transfer of skills. Pest reduction due to removal of
wastes will benefit the local communities.
8. Apart from using it internally can the owner sell
the bio-organic fertiliser to the open market?
There is an economic value for the bio-organic
fertiliser and selling it to the open market could be an
option.
9. What is the economic benefit of such a project
to business in term of investment costs and
returns?
This would vary on a case-to-case basis and should be
discussed on a one-to-one-basis.

PROJECT DESIGN DOCUMENT FORM (CDM PDD) - Version 03.1.
CDM – Executive Board page 51
Annex 1
CONTACT INFORMATION ON PARTICIPANTS IN THE PROJECT ACTIVITY
Organization: Climate Change Capital acting on behalf of Climate Change Capital Carbon
Fund II S.à r.l
Street/P.O.Box: 3 More London Riverside
Building:
City: London
State/Region:
Postfix/ZIP: SE1 2AQ
Country: United Kingdom
Telephone: +44 (0)20 7939 5000
FAX:
E-Mail:
URL:
Represented by:
Title: Transaction Manager
Salutation: Mr.
Last Name: Rojo Alvarez
Middle Name:
First Name: Javier
Department: Carbon Finance
Mobile: +44 (0)7776 227 591
Direct FAX: +44 (0)20 7939 5000
Direct tel: +44 (0)20 7939 5229
Personal E-Mail: [email protected]
Organization: Inno Integrasi Sdn Bhd
Street/P.O.Box: 108, Jalan Tun H.S. Lee,
Building: 3rd floor, Bangunan Fung Keong
City: Kuala Lumpur
State/Region:
Postfix/ZIP: 50000
Country: Malaysia
Telephone: +60320324522
FAX: +60320315188
E-Mail:
URL:
Represented by:
Title: Director
Salutation: Mr.
Last Name: Lim
Middle Name:
First Name: Shen
Department:
Mobile: +6012-2100848
Direct FAX:
Direct tel:
Personal E-Mail: [email protected]

PROJECT DESIGN DOCUMENT FORM (CDM PDD) - Version 03.1.
CDM – Executive Board page 52
Annex 2
INFORMATION REGARDING PUBLIC FUNDING
NO PUBLIC FUNDING IS INVOLVED IN THIS PROJECT
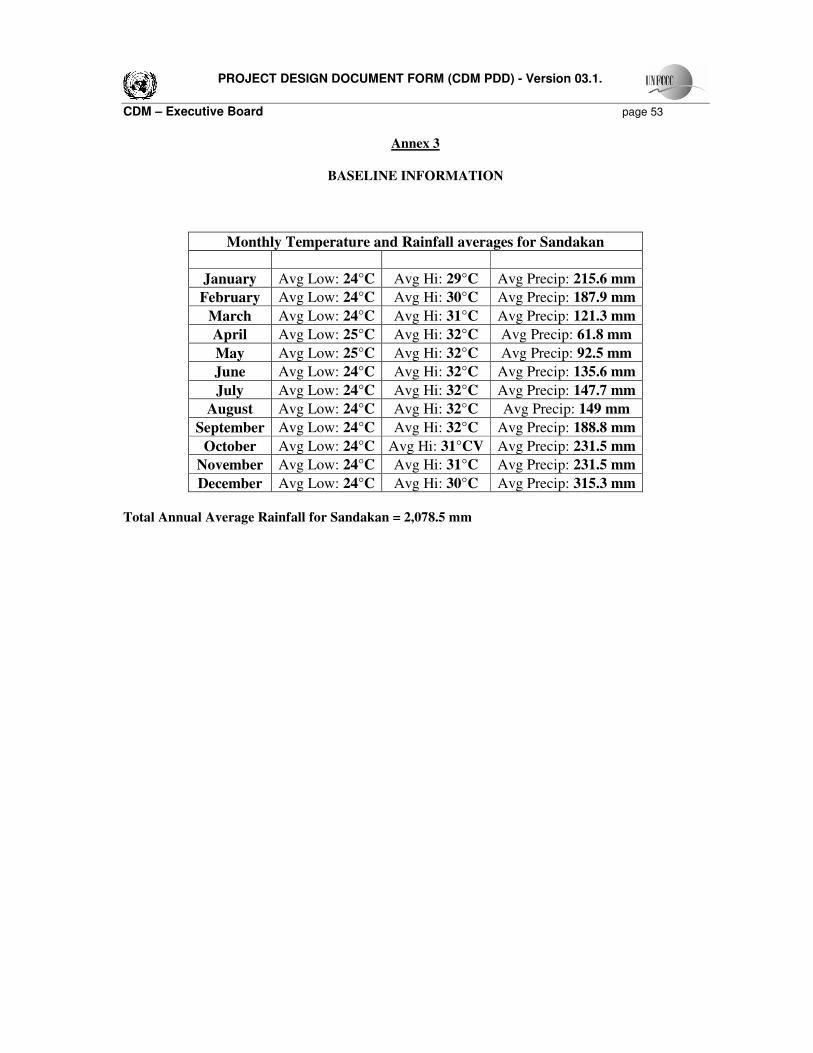
PROJECT DESIGN DOCUMENT FORM (CDM PDD) - Version 03.1.
CDM – Executive Board page 53
Annex 3
BASELINE INFORMATION
Monthly Temperature and Rainfall averages for Sandakan
January Avg Low: 24°C Avg Hi: 29°C Avg Precip: 215.6 mm
February Avg Low: 24°C Avg Hi: 30°C Avg Precip: 187.9 mm
March Avg Low: 24°C Avg Hi: 31°C Avg Precip: 121.3 mm
April Avg Low: 25°C Avg Hi: 32°C Avg Precip: 61.8 mm
May Avg Low: 25°C Avg Hi: 32°C Avg Precip: 92.5 mm
June Avg Low: 24°C Avg Hi: 32°C Avg Precip: 135.6 mm
July Avg Low: 24°C Avg Hi: 32°C Avg Precip: 147.7 mm
August Avg Low: 24°C Avg Hi: 32°C Avg Precip: 149 mm
September Avg Low: 24°C Avg Hi: 32°C Avg Precip: 188.8 mm
October Avg Low: 24°C Avg Hi: 31°CV Avg Precip: 231.5 mm
November Avg Low: 24°C Avg Hi: 31°C Avg Precip: 231.5 mm
December Avg Low: 24°C Avg Hi: 30°C Avg Precip: 315.3 mm
Total Annual Average Rainfall for Sandakan = 2,078.5 mm
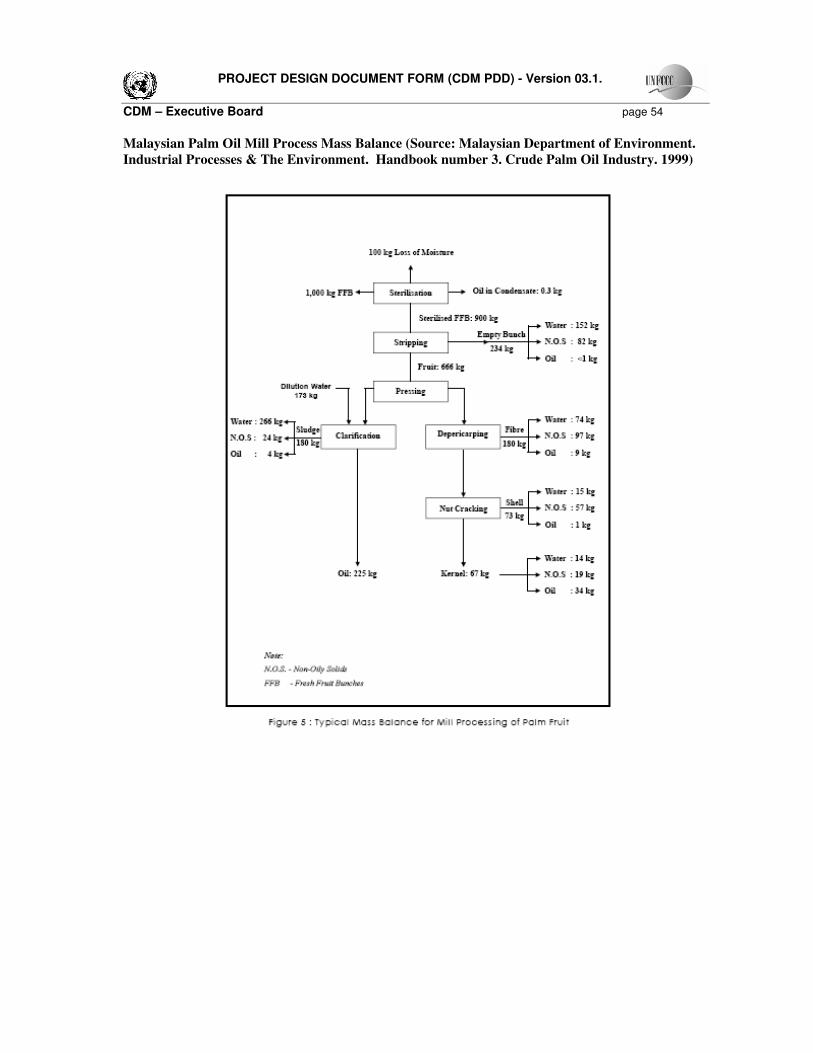
PROJECT DESIGN DOCUMENT FORM (CDM PDD) - Version 03.1.
CDM – Executive Board page 54
Malaysian Palm Oil Mill Process Mass Balance (Source: Malaysian Department of Environment.
Industrial Processes & The Environment. Handbook number 3. Crude Palm Oil Industry. 1999)
PROJECT DESIGN DOCUMENT FORM (CDM PDD) - Version 03.1.
CDM – Executive Board page 55
Annex 4
MONITORING PLAN
This Monitoring Plan details the actions necessary to record all the monitoring parameters required by
AM0039 – version 2, which are detailed in section B.7.1 above. All data will be archived electronically,
and backed up regularly. The data will be kept for the full crediting period, plus two years after the end
of the crediting period, or the last issuance of CERs for this project activity, whichever occurs later. The
Monitoring Plan for this project has been developed to ensure that from the start, the project is well
organized in terms of the collection and archiving of complete and reliable data. The details of the
monitoring management and organization are provided in Section B.7.2.
1. Continuous monitoring equipment and calibration requirements
The amount of solid waste (EFB) and wastewater (POME) treated, the amount of compost produced and
sampling of oxygen levels in the composting waste will be the main monitoring parameters requiring
continuous monitoring equipment for CDM verification purposes in the Abedon palm-oil mill. It is well
established in the Malaysian palm oil industry that the percentage of EFB produced from FFB is 23%.
Since all of the EFB will be utilized in the co-composting process, it is more convenient to measure the
amount of FFB than EFB and apply this factor to determine the amount of EFB.
(a) Metering of FFB and compost using the existing Abedon weighbridge
The main weighbridge for measuring the amount of FFB delivered to the composting facility is already in
operation at the Abedon palm-oil mill. This weighbridge measures the quantity of raw material FFB input
to the palm-oil mill and is installed at the main gate. The weighbridge is already subject to
comprehensive accuracy and calibration checks according to standard industry practice as it is the key
measurement parameter used to pay plantation owners for the supply of FFB. It is also one of the key
measurement parameters for the CDM verification process. If this weighbridge breaks down for any
reason the mill would have to find an alternative method to accurately account for FFB input or shut
down until it is repaired and recalibrated. Hence there is no time during the processing of FFB and the
production of EFB when this machinery is not in operation. The weighbridge will also be used to
measure the amount of compost produced. Since the compost will be sold to the nearby plantations, this
record is important for customer billing purposes as well as for CDM verification and equally important
that the weighbridge is accurately and regularly calibrated for both purposes. Records of the weighbridge
type, make, model and calibration documentation will be retained in the quality control system.
(b) Metering of POME using wastewater flow meter
From the existing wastewater exit point in the Abedon palm-oil mill, instead of discharging into the first
anaerobic lagoon, a pipe will be connected with a wastewater pump and flow meter to deliver POME to
the co-composting facility. The flow meter will continuously measure the total flow of POME and will
electronically record these data. The data will be compiled to record daily flows of POME. The flow
meter will be installed to meet all the manufacturer’s specifications and calibrated at regular intervals as
specified by the manufacturer. Records of the meter type, make, model and calibration documentation
will be retained in the quality control system. In case of flow meter failure and as an independent
calibration check an orifice plate will be installed in a straight section of the POME pipeline with
appropriate pressure tappings as a back-up means of measuring flow rate of POME. Regular manual
monitoring of POME flow rate using the orifice plate and water gauge manometer will be undertaken in
the event of POME flow meter failure.

PROJECT DESIGN DOCUMENT FORM (CDM PDD) - Version 03.1.
CDM – Executive Board page 56
(c) Metering of Oxygen levels in the composting process
Unlike windrow composting in-vessel composting relies on continuous measurements of oxygen levels
from several monitoring points throughout the composting vessel. Moreover, to ensure the most rapid
rate of composting the oxygen levels are maintained at even higher levels than windrow composting.
Hence there will be an extensive electronic record of oxygen levels for each composting vessel and each
batch of compost that is produced. These will be analyzed automatically for each batch to determine with
a high level of accuracy the percentage of oxygen concentration readings that fall below 10%. The
oxygen probes will be calibrated according to the instructions of the manufacturer at a frequency that
will ensure a continuously high level of accuracy. Extra probes will be kept as spares and pre-calibrated
to provide back-ups in case of probe failures. Records of the meter type, make, model and calibration
documentation will be retained in the quality control system.
2. Sampling and analysis of POME influent and effluent
The only sampling and analysis of waste streams that is required under this methodology is the COD of
POME and of the waste water discharge after the aerobic treatment of the residual pre-treated POME.
Representative samples of the POME (taken from the well mixed waste stream before the decanter) and
effluent from the waste water treatment plant will be produced from a composite of hourly samples taken
over a 24 hr period. This sampling will be repeated at monthly intervals and sent to a nationally
accredited laboratory for analysis of COD using a standard method approved by Malaysia’s Ministry of
Environment. The QA/QC procedures followed by the laboratory will be detailed and provided with the
certificates of analysis to ensure an analytical accuracy of +/- 3%.
3. Monitoring of fuel usage in the composting process
A dedicated diesel fuel storage depot at the composting plant will supply fuel for the front end loaders
and trucks other equipment used in the composting process. Invoices will be kept for purchases of diesel
fuel supplied to this depot as a record of fuel use. Monthly readings of fuel storage in the depot (from
level gauges or depth measurements in the fuel tank) and quantities of fuel purchased will be analyzed to
accurately record monthly fuel use to an accuracy of +/- 1%. Calibration records of liquid levels in the
fuel tank will be kept for confirmation of the CDM verifiers.
4. Data and records management
All data collected during the verification period will be stored in an electronic format that will be easily
accessible to the CDM verifier for independent checking. In the event that a series of measurements is
truncated a remediation of conservative interpolations with recorded data will be applied to restore the
integrity of the data. In order to make it easy for the verifier to retrieve the documentation and
information in relation to the project emission reduction verification, a document register will be
maintained and continually up-dated. The document register will ensure adequate document control for
CDM purposes.
The dedicated CDM Manager will be responsible for checking the data (according to a formal procedure)
and will be responsible for managing the collection, storage and archiving of all data and records. A
procedure will be developed to manage the CDM record keeping arrangements. All the data will be kept
for two years after the end of each credit period.
PROJECT DESIGN DOCUMENT FORM (CDM PDD) - Version 03.1.
CDM – Executive Board page 57
5. Summary of Quality Control (QC) and Quality Assurance (QA) measures
As noted above and in Section B.7.1 all measurements will use calibrated measurement equipment that is
maintained regularly and checked for its functioning. A summary of QA/QC procedures for the
parameters to be monitored are given in the following table.
Data
Uncertainty Level of
Data
(Low, Medium, High)
Explain QA/QC procedures planned for these data,
or why such procedures are not necessary
VPOME,y Low
The POME flow meter will undergo
maintenance/calibration subject to appropriate industry
standards. A back-up orifice plate will be installed in the
POME pipeline for independent checks on the flow
meter calibration and in case of flow meter break down.
CODinfluent Low
Sampling according to nationally recognized procedures
and analyses to be carried out by an accredited laboratory
using standard QA/QC procedures. These procedures
will be specified in the certificates of analysis provided
by the laboratory.
CODeffluent Low
Sampling according to nationally recognized procedures
and analyses to be carried out by an accredited laboratory
using standard QA/QC procedures. These procedures
will be specified in the certificates of analysis provided
by the laboratory.
Aj,x Low Calibration and maintenance of weighing bridge subject
to appropriate industry standards
Fcons Low The amount of fuel will be derived from the paid fuel
invoices with appropriate management auditing.
Qcompost,y Low Calibration and maintenance of weighing bridge subject
to appropriate industry standards
SOD,y and Stotal,y Low
Oxygen sensor and transmitter to be calibrated on a
regular basis according to the manufacturer’s
instructions. Measurement itself to be continuous and
automated by using PLC/SCADA process control
system. A statistically significant sampling procedure
will be set up that consists of multiple measurements
throughout the different stages of the composting process
according to a predetermined pattern (depths and scatter)
on a daily basis. The data also will be used for control of
the composting process
kj Medium
Incorporated into the test procedure and the standard
methods of analysis that have been specified. QA/QC
procedures of the accredited laboratory carrying out the
tests will be provided with the test data
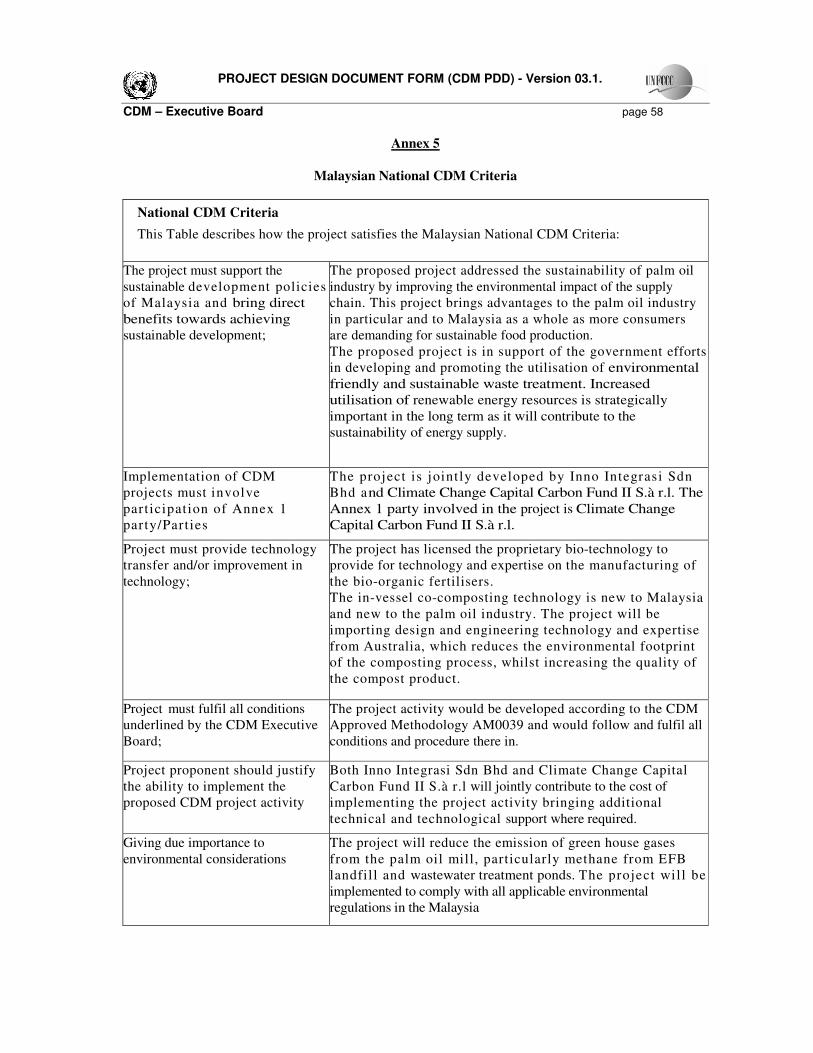
PROJECT DESIGN DOCUMENT FORM (CDM PDD) - Version 03.1.
CDM – Executive Board page 58
Annex 5
Malaysian National CDM Criteria
National CDM Criteria
This Table describes how the project satisfies the Malaysian National CDM Criteria:
The project must support the
sustainable development policies
of Malaysia and bring direct
benefits towards achieving
sustainable development;
The proposed project addressed the sustainability of palm oil
industry by improving the environmental impact of the supply
chain. This project brings advantages to the palm oil industry
in particular and to Malaysia as a whole as more consumers
are demanding for sustainable food production.
The proposed project is in support of the government efforts
in developing and promoting the utilisation of environmental
friendly and sustainable waste treatment. Increased
utilisation of renewable energy resources is strategically
important in the long term as it will contribute to the
sustainability of energy supply.
Implementation of CDM
projects must involve
participation of Annex 1
party/Parties
The project is jointly developed by Inno Integrasi Sdn
Bhd and Climate Change Capital Carbon Fund II S.à r.l. The
Annex 1 party involved in the project is Climate Change
Capital Carbon Fund II S.à r.l.
Project must provide technology
transfer and/or improvement in
technology;
The project has licensed the proprietary bio-technology to
provide for technology and expertise on the manufacturing of
the bio-organic fertilisers.
The in-vessel co-composting technology is new to Malaysia
and new to the palm oil industry. The project will be
importing design and engineering technology and expertise
from Australia, which reduces the environmental footprint
of the composting process, whilst increasing the quality of
the compost product.
Project must fulfil all conditions
underlined by the CDM Executive
Board;
The project activity would be developed according to the CDM
Approved Methodology AM0039 and would follow and fulfil all
conditions and procedure there in.
Project proponent should justify
the ability to implement the
proposed CDM project activity
Both Inno Integrasi Sdn Bhd and Climate Change Capital
Carbon Fund II S.à r.l will jointly contribute to the cost of
implementing the project activity bringing additional
technical and technological support where required.
Giving due importance to
environmental considerations
The project will reduce the emission of green house gases
from the palm oil mill, particularly methane from EFB
landfil l and wastewater treatment ponds. The project will be
implemented to comply with all applicable environmental
regulations in the Malaysia
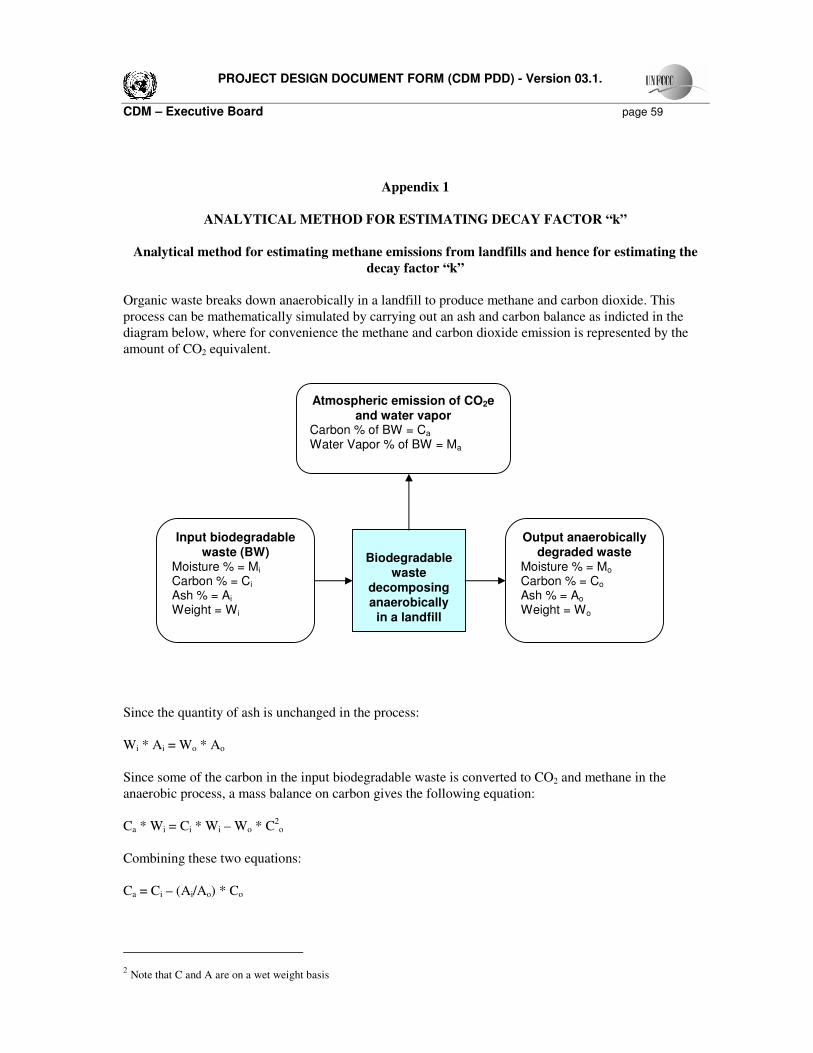
PROJECT DESIGN DOCUMENT FORM (CDM PDD) - Version 03.1.
CDM – Executive Board page 59
Appendix 1
ANALYTICAL METHOD FOR ESTIMATING DECAY FACTOR “k”
Analytical method for estimating methane emissions from landfills and hence for estimating the
decay factor “k”
Organic waste breaks down anaerobically in a landfill to produce methane and carbon dioxide. This
process can be mathematically simulated by carrying out an ash and carbon balance as indicted in the
diagram below, where for convenience the methane and carbon dioxide emission is represented by the
amount of CO2 equivalent.
Since the quantity of ash is unchanged in the process:
Wi * Ai = Wo * Ao
Since some of the carbon in the input biodegradable waste is converted to CO2 and methane in the
anaerobic process, a mass balance on carbon gives the following equation:
Ca * Wi = Ci * Wi – Wo * C2o
Combining these two equations:
Ca = Ci – (Ai/Ao) * Co
2 Note that C and A are on a wet weight basis
Biodegradable
waste decomposing anaerobically
in a landfill
Input biodegradable waste (BW)
Moisture % = Mi Carbon % = Ci Ash % = Ai Weight = W i
Output anaerobically degraded waste
Moisture % = Mo
Carbon % = Co Ash % = Ao Weight = Wo
Atmospheric emission of CO2e and water vapor
Carbon % of BW = Ca Water Vapor % of BW = Ma
PROJECT DESIGN DOCUMENT FORM (CDM PDD) - Version 03.1.
CDM – Executive Board page 60
This can be converted into CO2 equivalent emission as a percent of input biodegradable waste by the
following equation:
CEa = (44/12) * (Ci – (Ai/Ao) * Co)
Where, CEa is the amount of CO2 equivalent emission from the anaerobic process as a percent of input
wet biodegradable waste. Alternatively this equation can be expressed as follows:
CE = (44/12) * (Ci – (Ai/Ao) * Co) * (1000/100) --------------------------- (Equation 1)
Where, CE is the kg of CO2 equivalent emission per tonne input waste.
If the waste had degraded under anaerobic conditions in a landfill the biodegradable carbon would have
been converted into 50% by volume of methane and 50% by volume of CO2, instead of 100% CO2 as in
aerobic composting process.
In the anaerobic process in the landfill:
2 moles of biodegradable C → p moles of CH4 + (2-p) moles of CO2
Therefore:
24 kg of biodegradable C → p * 16 kg of CH4 + (2-p) * 44 kg of CO2
24 kg of biodegradable C → (p * 16/dCH4) m3 of CH4 + ((2-p) * 44/dCO2) m
3 of CO2
Where dCO2 is the density of CO2 at 15o C and 1.013 bar = 1.87 kg/m3
Where dCH4 is the density of CH4 at 15o C and 1.013 bar = 0.688 kg/m
3
Therefore, if there is a 50:50 mixture of CH4 and CO2 in the LFG, then:
(p * 16 / dCH4) m3 of CH4 = ((2-p) * 44 kg / dCO2) m
3 of CO2
Hence: p = 1.0
Therefore in an anaerobic landfill process:
24 kg of biodegradable C → 16 kg of CH4 + 44 kg of CO2
Expressing the equation in terms of CO2 equivalent gives:
2 moles of biodegradable C → 2 moles of CO2
Therefore:
24 kg of biodegradable C → 88 kg of CO2 equivalent
It follows, therefore, that 88 kg of CO2 equivalent represents 16 kg of CH4 produced anaerobically in a
managed landfill from the same amount of biodegradable C , since in the anaerobic process 44 kg of CO2
is also produced.
Applying this factor to Equation 1 gives:

PROJECT DESIGN DOCUMENT FORM (CDM PDD) - Version 03.1.
CDM – Executive Board page 61
Loy = (440/12000) * (Ci – (Ai/Ao) * Co) * (16/88)
= 0.00667 * (Ci – (Ai/Ao) * Co)
Where:
Loy tonne of methane generated under anaerobic conditions in a landfill / tonne waste treated
Applying the IPCC correction factor of MCF for unmanaged landfills gives:
Loy = 0.00667 * MCF * (Ci – (Ai/Ao) * Co) --------------------- (Equation 2)
Outline of a laboratory method to determine the methane decay rate factor “k” for any waste
material under anaerobic conditions in a landfill
A test method along the lines of the Uganda MSW Decay Rate Study (a copy of which will be provided
to the DOE for validation) will be carried out on Oil Palm EFB. The EFB will be shredded and
compacted into the containers to a density of approximately 400kg/m3. The shredded EFB will be
analysed for moisture, ash and total carbon according to ASTM methods listed below. The containers
will be loaded with a bottom layer of coarse sand to 2 cm thickness and then the waste material and
sealed as described in the attached reference with temperature and pressure sensors and placed in a
container at a controlled temperature of 350C (if possible, otherwise at room temperature with insulation
wrapped around the containers to minimize heat loss). Eight bins will be loaded with shredded EFB. The
bins will be opened and analysed for moisture, ash and total carbon according to the following schedule:
week 2, 4, 6, 8, 10, 12, 24 and 48 weeks. The amount of methane generated during each time period is
determined by Equation 2. Temperature and pressure in each container is recorded daily. The relevant
ASTM Standards of analysis are as follows (equivalent standards can be used):
ASTM E 1757-01: Standard Practice for Preparation of Biomass for Compositional Analysis
ASTM D 2974-99: Standard Test methods for Moisture, Ash and Organic Matter of Peat and other
Organic Soils
ASTM D 5373-02: Standard Test Methods for Instrumental Determination of Carbon, Hydrogen and
Nitrogen in Laboratory Samples of Coal and Coke