Embed Size (px)
Citation preview
Evolving Risk Perceptions for India’s Grid-Connected Renewable Power Projects
Report July 2019
Edition authors: Arjun Dutt, Lucila Arboleya, and Barath Mahadevan
Series editors: Kanika Chawla and Michael Waldron
Clean Energy Investment Trends 2019Evolving Risk Perceptions for India’s Grid-Connected Renewable Power Projects
Centre forEnergy Finance
Clean Energy Investment Trends 2019
Image: Envato
Evolving Risk Perceptions for India’s Grid-Connected Renewable Power Projects
Edition authors: Arjun Dutt, Lucila Arboleya, and Barath MahadevanSeries editors: Kanika Chawla and Michael Waldron
ReportJuly 2019ceew.in
Clean Energy Investment Trends 2019
Centre forEnergy Finance
Evolving Risk Perceptions for India’s Grid-Connected Renewable
Power Projects
Clean Energy Investment Trends 2019
Copyright © 2019 Council on Energy, Environment and Water (CEEW) and International Energy Agency (IEA).
Open access. Some rights reserved. This work is available under the Creative Commons Attribution- NonCommercial-NoDerivatives 3.0 IGO license (CC BY-NC-ND 3.0 IGO) https://creativecommons.org/licenses/by-nc-nd/3.0/igo/. You are free to copy and redistribute the material, provided the use is for non-commercial purposes, under the following conditions of attribution.
Third-party content: The IEA and CEEW do not necessarily own each component of the content contained within the work. Therefore, neither the IEA, nor CEEW warrant that the use of any third-party owned individual component or part contained in the work will not infringe on the rights of those third parties. The risk of claims resulting from such infringement rests solely with you. If you wish to re-use a component of the work, it is your responsibility to determine whether permission is needed for that re-use and to obtain permission from the copyright owner. Examples of components can include, but are not limited to, tables, figures, or images.
Disclaimer: This report is the result of a collaborative effort between the International Energy Agency (IEA) and the Council on Energy, Environment and Water (CEEW) and was produced by CEEW.
This report reflects the views of the IEA Secretariat and the authors affiliated to the CEEW but does not necessarily reflect those of the IEA’s respective individual Member countries or of the Council on Energy, Environment and Water, or their funders. The report does not constitute professional advice on any specific issue or situation. CEEW and the IEA make no representation or warranty, express or implied, in respect of the report’s contents (including its completeness or accuracy) and shall not be responsible for any use of, or reliance on, the report. For further information, please contact: [email protected] and [email protected].
Suggested citation: Dutt, Arjun, Lucila Arboleya, and Barath Mahadevan. 2019. Clean Energy Investment Trends: Evolving Risk Perceptions for India’s Grid-Connected Renewable Energy Projects. New Delhi; Paris: Council on Energy, Environment and Water; International Energy Agency.
Cover image: iStock
Peer reviewers: Findings of this report have been peer reviewed as part of an IEA publication process as well as through consultations with market participants.
Publication team: Alina Sen (CEEW), Mihir Shah (CEEW), Surit Das, Twig Designs, and Friends Digital.
The Council on Energy, Environment and Water (http://ceew.in/) is one of South Asia’s leading not-for-profit policy research institutions. The Council uses data, integrated analysis, and strategic outreach to explain-and change-the use, reuse, and misuse of resources. It prides itself on the independence of its high-quality research, develops partnerships with public and private institutions, and engages with the wider public. In 2018, CEEW has once again been featured across nine categories in the ‘2017 Global Go To Think Tank Index Report’. It has also been consistently ranked among the world’s top climate change think tanks. Follow us on Twitter@CEEWIndia for the latest updates.
The CEEW Centre for Energy Finance (CEF) is an initiative of the Council on Energy, Environment and Water (CEEW), one of South Asia’s leading think tanks. CEF acts as a non-partisan market observer and driver that monitors, develops, tests, and deploys financial solutions to advance the energy transition. It aims to help deepen markets, increase transparency, and attract capital in clean energy sectors in emerging economies. It achieves this by comprehensively tracking, interpreting, and responding to developments in the energy markets while also bridging gaps between governments, industry, and financiers.
International Energy Agency: The International Energy Agency provides authoritative data, analysis, and recommendations across all fuels and all technologies, and helps governments develop policies for a secure and sustainable future for all. The IEA was created in 1974 and examines the full spectrum of issues including energy security, clean energy transitions, and energy efficiency. It is a global leader in understanding pathways to meeting climate goals, reducing air pollution and achieving universal energy access, in line with the UN Sustainable Development Goals. The IEA family of countries accounts for 75% of global energy consumption, and includes 30 Member countries and 8 Association countries -- Brazil, China, India, Indonesia, Morocco, Singapore, South Africa, and Thailand.
Council on Energy, Environment and Water, Sanskrit Bhawan, A-10, Qutab Institutional Area Aruna Asaf Ali Marg, New Delhi - 110067, India
International Energy Agency, 9 rue de la Fédération, 75739 Paris Cedex 15 France

Evolving Risk Perceptions for India’s Grid-Connected Renewable Power Projects
About the authors
Series editors: Kanika Chawla and Michael WaldronEdition authors: Arjun Dutt, Lucila Arboleya, and Barath Mahadevan
KANIKA CHAWLA I [email protected]
MICHAEL WALDRON I [email protected]
ARJUN DUTT I [email protected]
LUCILA ARBOLEYA I [email protected]
BARATH MAHADEVAN I [email protected]
Kanika Chawla is a policy specialist working at the intersection of renewable energy and financial markets. She is the Director of the CEEW Centre for Energy Finance and also manages CEEW’s research and outreach in renewable energy policy, regulation, markets, and socio-economic value.
Michael Waldron is a Senior Energy Investment Analyst and the project leader of the World Energy Investment report at the International Energy Agency. His work focuses on investment in the electricity sector, trends in energy financing and implications of energy investment for meeting energy security and sustainability goals.
Arjun Dutt is a Programme Associate at CEEW. His work spans renewable energy finance, policy and markets, and is geared towards analysing risks constraining renewable energy investments and enhancing the flow of finance to the renewable energy sector.
Lucila Arboleya is an Energy Economics and Financial Analyst at the International Energy Agency, focusing on clean power investments and policies. Previously, she has also worked on electricity transmission projects.
Barath Mahadevan is a consultant to the CEEW-IEA Clean Energy Investment Trends project. His interest lies at the intersection of technology and policy in the energy and environment sector. He has previously worked on low carbon technology pathways, energy systems modelling, GHG inventory and climate change negotiations.
Clean Energy Investment Trends 2019
Image: iStock
Evolving Risk Perceptions for India’s Grid-Connected Renewable Power Projects
CEEW and IEA Clean Energy Investment Trends
To achieve its clean energy ambitions, India’s policymakers, industry actors, and financiers must act in concert. For investments in clean energy to scale, policy measures must address the investment risks perceived by financiers and developers.
The Clean Energy Investment Trends is a joint project of the Council on Energy, Environment and Water (CEEW) Centre for Energy Finance and the International Energy Agency (IEA). By monitoring market activity and identifying market trends, the project seeks to provide a practical guide to stakeholders for understanding how the interaction between risks and regulations is shaping investment flows. The insights generated from the analyses of financing and market trends could be used to inform future policy action geared towards enhancing investment flows.
Themes examined in the Clean Energy Investment Trends 2019 report
The 2019 Clean Energy Investment Trends report maps out the evolution in the renewable power industry and investment landscape through tracking the risk perceptions of debt financiers towards solar photovoltaic (PV) and wind projects over the period from 2014 to 2018 and recent developments impacting the pace of capacity addition. Risk perceptions are analysed through an evaluation of key metrics pertaining to debt financing and capital structure. To assess the relative standing of renewables and thermal assets, this report includes an analysis of thermal projects along the same metrics. The report also takes stock of the impact of a recent policy measure – the imposition of safeguard duties on solar PV cell and module imports – on the pace of project awards. Further, this report contextualises emerging challenges facing the solar park model, which has been a key driver of solar capacity deployment in India’s energy transition.
Key findings Investment in India’s renewable power sector has doubled over the past five years. At nearly USD 20 billion in 2018, it has surpassed capital expenditure in the thermal power sector.1 Ambitious targets, supportive policies, and falling technology costs have improved the attractiveness of financing utility-scale solar PV and wind projects,
spurring a dramatic expansion in deployment, though with some differences in the risk profiles and industry landscape between the sectors.
The cost of equity and debt financing comprises around 60% of the levelised cost of electricity (LCOE) of solar PV and wind projects.2 Thus, the cost and availability of financing, which depend on the investment risks as perceived by developers and financiers, significantly shape India’s progress along the energy transition. Sectoral credit exposure limits in the banking sector in India force renewable energy and thermal projects to compete for the same pool of debt capital (as both are categorised as power sector). Thus, improvements in risk perceptions of renewables projects are necessary to scale up their share in debt finance flows from banks. This is even more important considering the near-term liquidity constraints on India’s non-banking financial companies (NBFCs), in the wake of a bond default by a systemically important NBFC, hampering the flow of debt capital from these sources.
An analysis of utility-scale solar PV and wind projects sanctioned between 2014 and 2018 points to higher market concentration, better financing terms and lower investment risks over time. However, financing constraints and uncertainties over key policy and infrastructure enablers remain present.
The analysis reveals five key trends:
• The market concentration of developers sanctioning new solar PV and wind capacity remained high in 2018—above 80% for the top ten firms in both markets. Top companies that can access financing at favourable terms have an advantage in structuring competitive auction bids.
1 Includes investments in large hydro, Source: IEA (2019), World Energy Investment 2019, IEA, Paris, https://www.iea.org/wei2019/
2 Upcoming research paper, Kanika Chawla, Manu Aggarwal, Arjun Dutt, ‘Analysing the falling solar PV and wind tariffs: Evidence from India’
1
Clean Energy Investment Trends 2019
Both solar PV and wind markets are characterised by high concentration in terms of the sanctioning of new projects. With declines in tariffs and pressure on margins, companies with access to favourable sources of finance succeed in winning project capacity at competitive auctions. At the same time, there has been a notable turnover of top players from year to year, as even the best developers face limitations in continually financing projects. Nevertheless, there were signs of increased consolidation in the wind sector in 2018, with the churn rate dropping considerably from the previous year.
• A maturing market along with reduced risk perceptions and enhanced bankability for renewables has contributed to improved availability and pricing of project debt finance over time, facilitating lower cost investment.
The capital structure of wind projects remained stable–debt-to-equity ratios averaged 75:25 – but the share of debt rose for solar PV, with more 75:25 structures and instances of higher ratios (80:20). Interest rate spreads over bank benchmark lending rates also fell between 75 to 125 basis points for both wind and solar PV between 2014 and 2018. Loan tenures increased during the period between 2014 and 2018 as lenders became more comfortable in extending longer-term loans.
• Data comparisons with thermal power projects were more challenging, but assets developed by integrated state government—owned utilities appear to benefit from some financing advantages.3
For thermal projects developed by integrated state government–owned utilities, degrees of project debt leverage are higher than those for solar PV and wind investments, and loan tenures are longer than those available to other categories of thermal developers. National Thermal Power Corporation (NTPC), a central government–owned public sector undertaking (PSU) and India’s largest thermal developer, relies on the bond market to fund the bulk of its capital expenditure. Therefore, this analysis excludes most of its projects.
• The weak availability of long-term, fixed-rate debt remains a constraint for all power generation investments, raising uncertainty over future financing costs for new plants and the refinancing of existing ones.
Long-tenure bank/NBFC- financed debt for renewable energy projects commonly includes provisions for the reset of spreads and refinancing after a certain period. Loans extended to thermal projects developed by private developers and PSUs also include such provisions. Though debt extended to thermal projects developed by integrated state government-owned utilities is structured at a single, fixed rate, it also includes provisions for reset of interest rates.
• The imposition of safeguard duties and persistent land acquisition and grid infrastructure related challenges under India’s Solar Park scheme, represent near–term risks to the pace of capacity addition.
The Government of India imposed safeguard duties on solar PV cell and module imports in July 2018. This, along with the associated market uncertainty, has translated into an increase in tariffs discovered at some solar PV auctions from the record lows realised in 2017. This increase in tariffs was a major cause of the cancellation of almost 5 gigawatt (GW) of solar PV projects awarded in 2018, equivalent to about half the total solar PV capacity added in 2018. In addition, challenges in land acquisition and setting up transmission infrastructure have hampered solar park development, with the share of projects awarded at parks in overall capacity awards declining from 54% in 2017 to 24% in 2018, even while the absolute level of solar park capacity awarded remained steady.
IntroductionIndia’s renewable power market continued to expand in 2018. Investment in the sector, at nearly USD 20 billion, surpassed capital expenditure in the thermal power sector, underpinned by the addition of over 8 gigawatt (GW) of utility-scale solar PV capacity and over 2 GW of wind. By May 2019, utility-scale installed capacity of solar PV was over 27 GW and wind was more than 36 GW.4 Policy and market developments over the
3 Data points for thermal projects were limited – thus a detailed year-wise analysis for thermal has not been presented in this report
4 As of May 2019, Source: MNRE
2
Evolving Risk Perceptions for India’s Grid-Connected Renewable Power Projects
years have enhanced the viability of solar and wind generation, as reflected in the discovery of rapidly declining tariffs through the transparent reverse auction process.
The year 2018 saw an uptick in the total solar PV and wind energy capacity awarded through the reverse auction mechanism. Solar capacity awarded increased from near 6 GW in 2017 to 13 GW in 2018.5 Wind capacity awarded at auctions increased from 2.6 GW in 2017, the first year of wind power procurement through the reverse auction route, to nearly 7 GW in 2018. The Clean Energy Investment Trends series is based on a database of solar PV and wind projects sanctioned between 2014 and 2018. The update to the database for this year’s analysis captures over 12 GW of solar projects awarded in 2018 (around 95% coverage) and all the wind projects awarded in 2018.
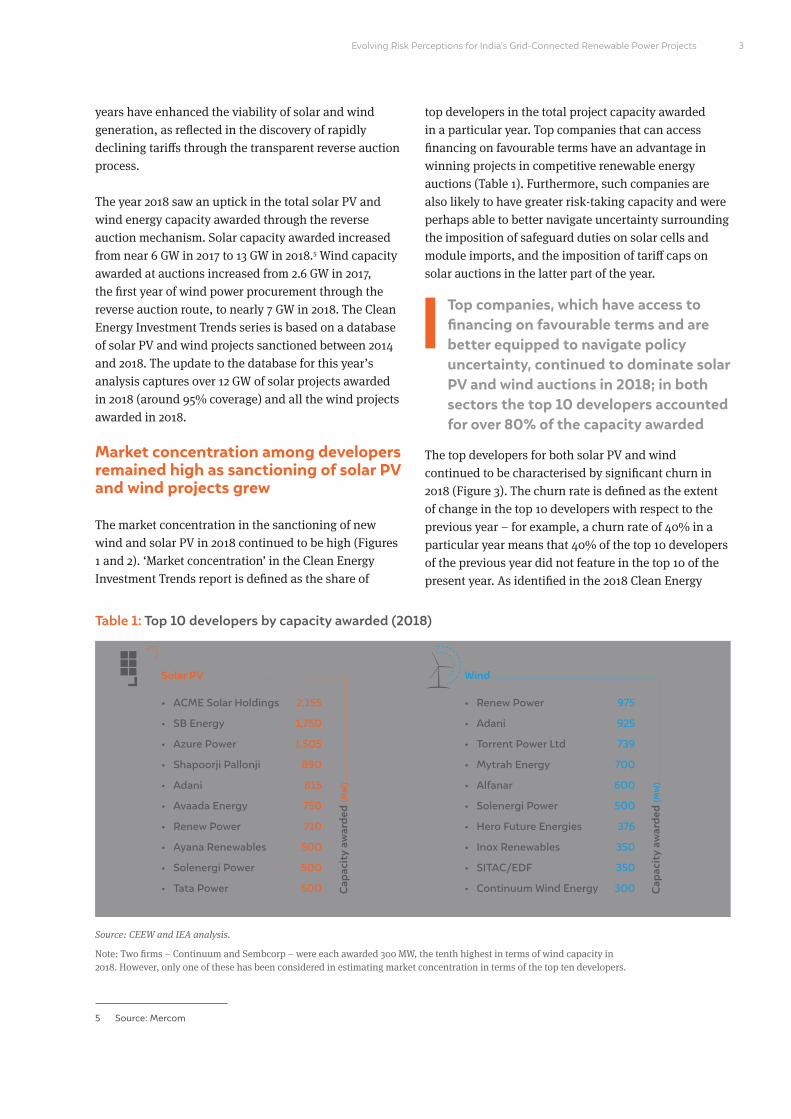
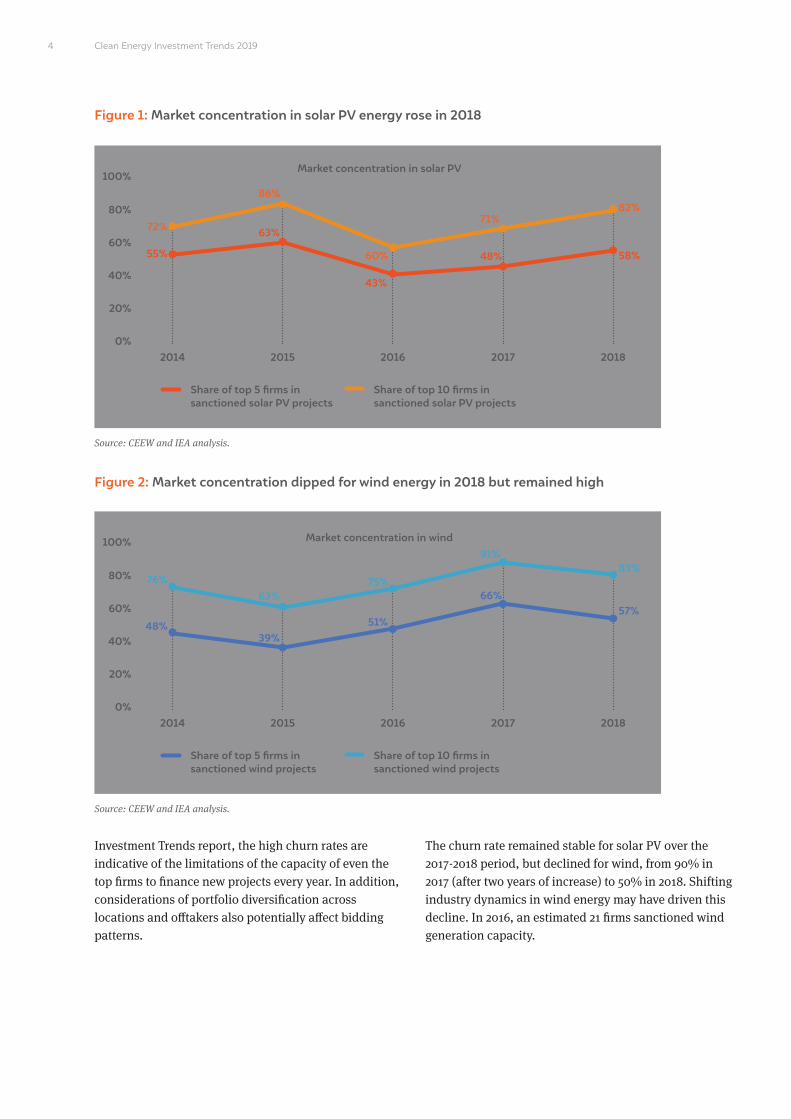
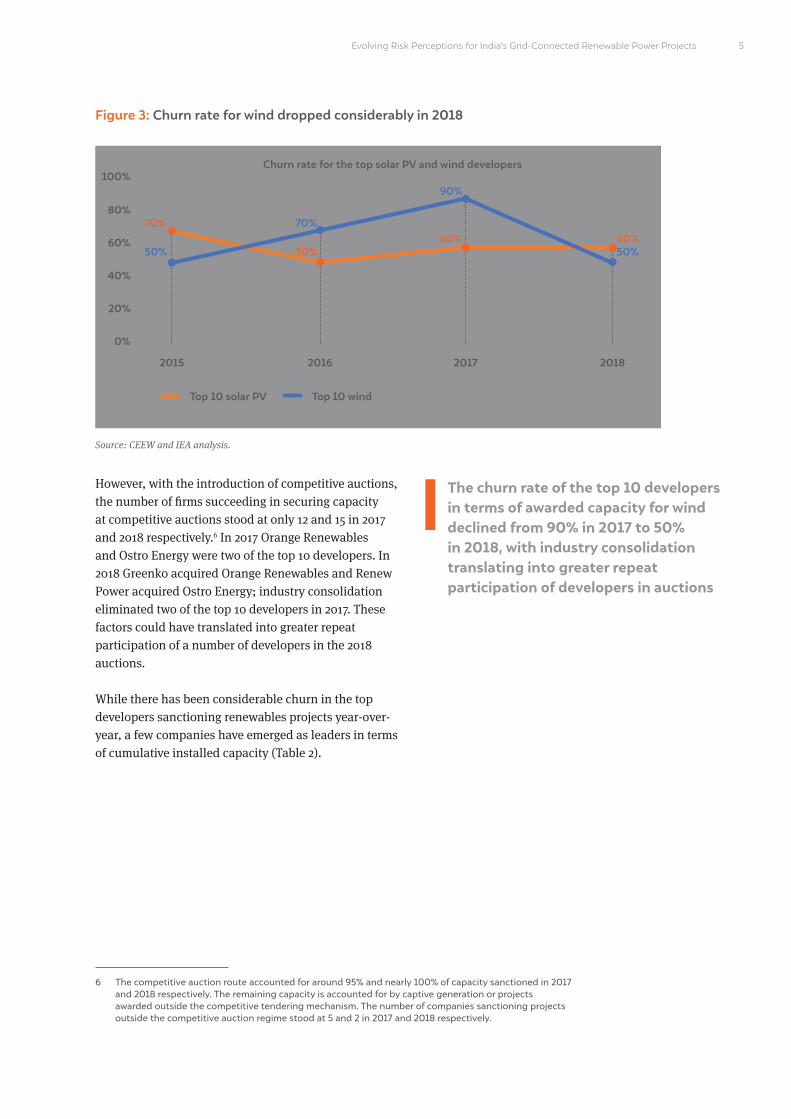
Market concentration among developers remained high as sanctioning of solar PV and wind projects grew
The market concentration in the sanctioning of new wind and solar PV in 2018 continued to be high (Figures 1 and 2). ‘Market concentration’ in the Clean Energy Investment Trends report is defined as the share of
top developers in the total project capacity awarded in a particular year. Top companies that can access financing on favourable terms have an advantage in winning projects in competitive renewable energy auctions (Table 1). Furthermore, such companies are also likely to have greater risk-taking capacity and were perhaps able to better navigate uncertainty surrounding the imposition of safeguard duties on solar cells and module imports, and the imposition of tariff caps on solar auctions in the latter part of the year.
Top companies, which have access to financing on favourable terms and are better equipped to navigate policy uncertainty, continued to dominate solar PV and wind auctions in 2018; in both sectors the top 10 developers accounted for over 80% of the capacity awarded
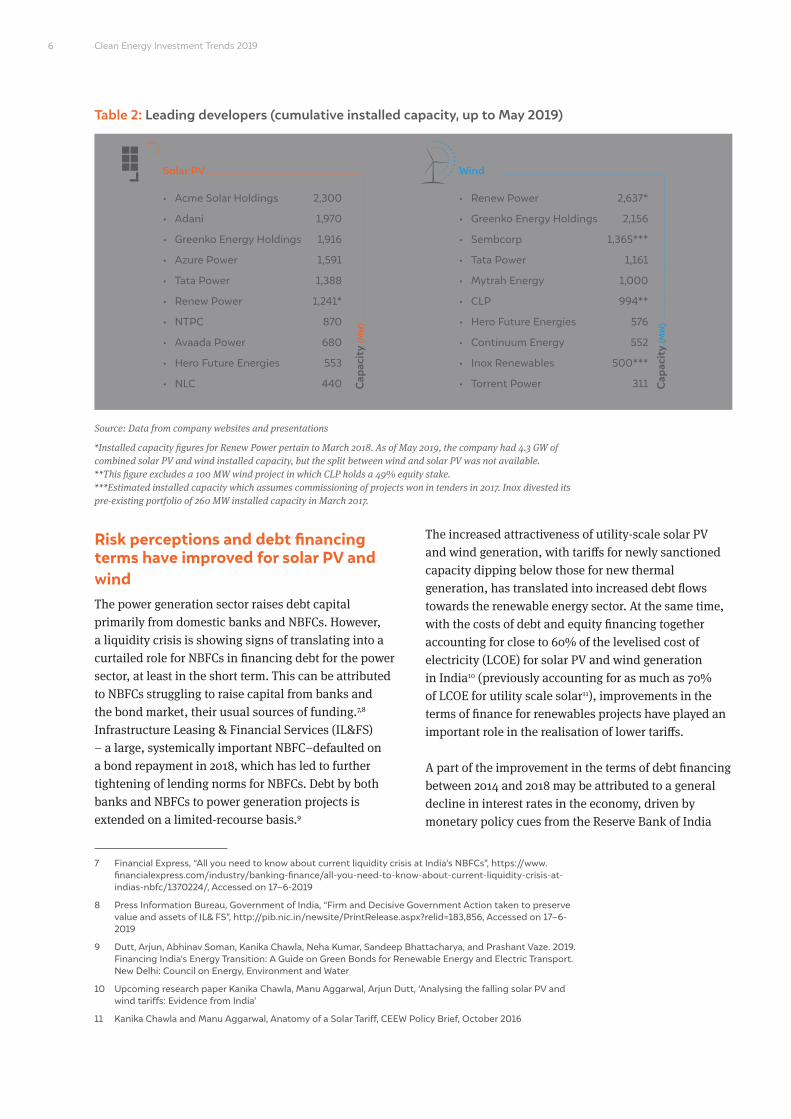
The top developers for both solar PV and wind continued to be characterised by significant churn in 2018 (Figure 3). The churn rate is defined as the extent of change in the top 10 developers with respect to the previous year – for example, a churn rate of 40% in a particular year means that 40% of the top 10 developers of the previous year did not feature in the top 10 of the present year. As identified in the 2018 Clean Energy
5 Source: Mercom
• ACME Solar Holdings
• SB Energy
• Azure Power
• Shapoorji Pallonji
• Adani
• Avaada Energy
• Renew Power
• Ayana Renewables
• Solenergi Power
• Tata Power
• Renew Power
• Adani
• Torrent Power Ltd
• Mytrah Energy
• Alfanar
• Solenergi Power
• Hero Future Energies
• Inox Renewables
• SITAC/EDF
• Continuum Wind Energy
2,155
1,750
1,505
890
815
750
710
500
500
500
975
925
739
700
600
500
376
350
350
300
Solar PV Wind
Cap
acit
y aw
arde
d (M
W)
Cap
acit
y aw
arde
d (M
W)
Table 1: Top 10 developers by capacity awarded (2018)
Source: CEEW and IEA analysis.
Note: Two firms – Continuum and Sembcorp – were each awarded 300 MW, the tenth highest in terms of wind capacity in 2018. However, only one of these has been considered in estimating market concentration in terms of the top ten developers.
3
Clean Energy Investment Trends 2019
Share of top 5 firms in sanctioned solar PV projects
Market concentration in solar PV
Market concentration in wind
Share of top 5 firms in sanctioned wind projects
Figure 1: Market concentration in solar PV energy rose in 2018
Figure 2: Market concentration dipped for wind energy in 2018 but remained high
Source: CEEW and IEA analysis.
Source: CEEW and IEA analysis.
Share of top 10 firms in sanctioned solar PV projects
Share of top 10 firms in sanctioned wind projects
2014
2014
0%
0%
20%
20%
40%
40%
60%
60%
80%
80%
100%
100%
2015
2015
2016
2016
2017
2017
2018
2018
72%
76%
86%
63%
60%
75%
71%
91%
82%
83%
55%
48%
63%
39%
43%
51%
48%
66%
58%
57%
Investment Trends report, the high churn rates are indicative of the limitations of the capacity of even the top firms to finance new projects every year. In addition, considerations of portfolio diversification across locations and offtakers also potentially affect bidding patterns.
The churn rate remained stable for solar PV over the 2017-2018 period, but declined for wind, from 90% in 2017 (after two years of increase) to 50% in 2018. Shifting industry dynamics in wind energy may have driven this decline. In 2016, an estimated 21 firms sanctioned wind generation capacity.
4
Evolving Risk Perceptions for India’s Grid-Connected Renewable Power Projects
Churn rate for the top solar PV and wind developers
6 The competitive auction route accounted for around 95% and nearly 100% of capacity sanctioned in 2017 and 2018 respectively. The remaining capacity is accounted for by captive generation or projects awarded outside the competitive tendering mechanism. The number of companies sanctioning projects outside the competitive auction regime stood at 5 and 2 in 2017 and 2018 respectively.
However, with the introduction of competitive auctions, the number of firms succeeding in securing capacity at competitive auctions stood at only 12 and 15 in 2017 and 2018 respectively.6 In 2017 Orange Renewables and Ostro Energy were two of the top 10 developers. In 2018 Greenko acquired Orange Renewables and Renew Power acquired Ostro Energy; industry consolidation eliminated two of the top 10 developers in 2017. These factors could have translated into greater repeat participation of a number of developers in the 2018 auctions.
While there has been considerable churn in the top developers sanctioning renewables projects year-over-year, a few companies have emerged as leaders in terms of cumulative installed capacity (Table 2).
The churn rate of the top 10 developers in terms of awarded capacity for wind declined from 90% in 2017 to 50% in 2018, with industry consolidation translating into greater repeat participation of developers in auctions
Figure 3: Churn rate for wind dropped considerably in 2018
Top 10 solar PV Top 10 wind
0%
20%
40%
60%
80%
100%
2015 2016 2017 2018
50%
70%
90%
70%
50% 50%60% 60%
Source: CEEW and IEA analysis.
5
Clean Energy Investment Trends 2019
• Acme Solar Holdings
• Adani
• Greenko Energy Holdings
• Azure Power
• Tata Power
• Renew Power
• NTPC
• Avaada Power
• Hero Future Energies
• NLC
• Renew Power
• Greenko Energy Holdings
• Sembcorp
• Tata Power
• Mytrah Energy
• CLP
• Hero Future Energies
• Continuum Energy
• Inox Renewables
• Torrent Power
2,300
1,970
1,916
1,591
1,388
1,241*
870
680
553
440
2,637*
2,156
1,365***
1,161
1,000
994**
576
552
500***
311
Solar PV Wind
Cap
acit
y (M
W)
Cap
acit
y (M
W)
Table 2: Leading developers (cumulative installed capacity, up to May 2019)
Source: Data from company websites and presentations
*Installed capacity figures for Renew Power pertain to March 2018. As of May 2019, the company had 4.3 GW of combined solar PV and wind installed capacity, but the split between wind and solar PV was not available.**This figure excludes a 100 MW wind project in which CLP holds a 49% equity stake. ***Estimated installed capacity which assumes commissioning of projects won in tenders in 2017. Inox divested its pre-existing portfolio of 260 MW installed capacity in March 2017.
Risk perceptions and debt financing terms have improved for solar PV and wind The power generation sector raises debt capital primarily from domestic banks and NBFCs. However, a liquidity crisis is showing signs of translating into a curtailed role for NBFCs in financing debt for the power sector, at least in the short term. This can be attributed to NBFCs struggling to raise capital from banks and the bond market, their usual sources of funding.7,8 Infrastructure Leasing & Financial Services (IL&FS) – a large, systemically important NBFC–defaulted on a bond repayment in 2018, which has led to further tightening of lending norms for NBFCs. Debt by both banks and NBFCs to power generation projects is extended on a limited-recourse basis.9
The increased attractiveness of utility-scale solar PV and wind generation, with tariffs for newly sanctioned capacity dipping below those for new thermal generation, has translated into increased debt flows towards the renewable energy sector. At the same time, with the costs of debt and equity financing together accounting for close to 60% of the levelised cost of electricity (LCOE) for solar PV and wind generation in India10 (previously accounting for as much as 70% of LCOE for utility scale solar11), improvements in the terms of finance for renewables projects have played an important role in the realisation of lower tariffs.
A part of the improvement in the terms of debt financing between 2014 and 2018 may be attributed to a general decline in interest rates in the economy, driven by monetary policy cues from the Reserve Bank of India
7 Financial Express, “All you need to know about current liquidity crisis at India’s NBFCs”, https://www. financialexpress.com/industry/banking-finance/all-you-need-to-know-about-current-liquidity-crisis-at- indias-nbfc/1370224/, Accessed on 17–6-2019
8 Press Information Bureau, Government of India, “Firm and Decisive Government Action taken to preserve value and assets of IL& FS”, http://pib.nic.in/newsite/PrintRelease.aspx?relid=183,856, Accessed on 17–6- 2019
9 Dutt, Arjun, Abhinav Soman, Kanika Chawla, Neha Kumar, Sandeep Bhattacharya, and Prashant Vaze. 2019. Financing India’s Energy Transition: A Guide on Green Bonds for Renewable Energy and Electric Transport. New Delhi: Council on Energy, Environment and Water
10 Upcoming research paper Kanika Chawla, Manu Aggarwal, Arjun Dutt, ‘Analysing the falling solar PV and wind tariffs: Evidence from India’
11 Kanika Chawla and Manu Aggarwal, Anatomy of a Solar Tariff, CEEW Policy Brief, October 2016
6
Evolving Risk Perceptions for India’s Grid-Connected Renewable Power Projects
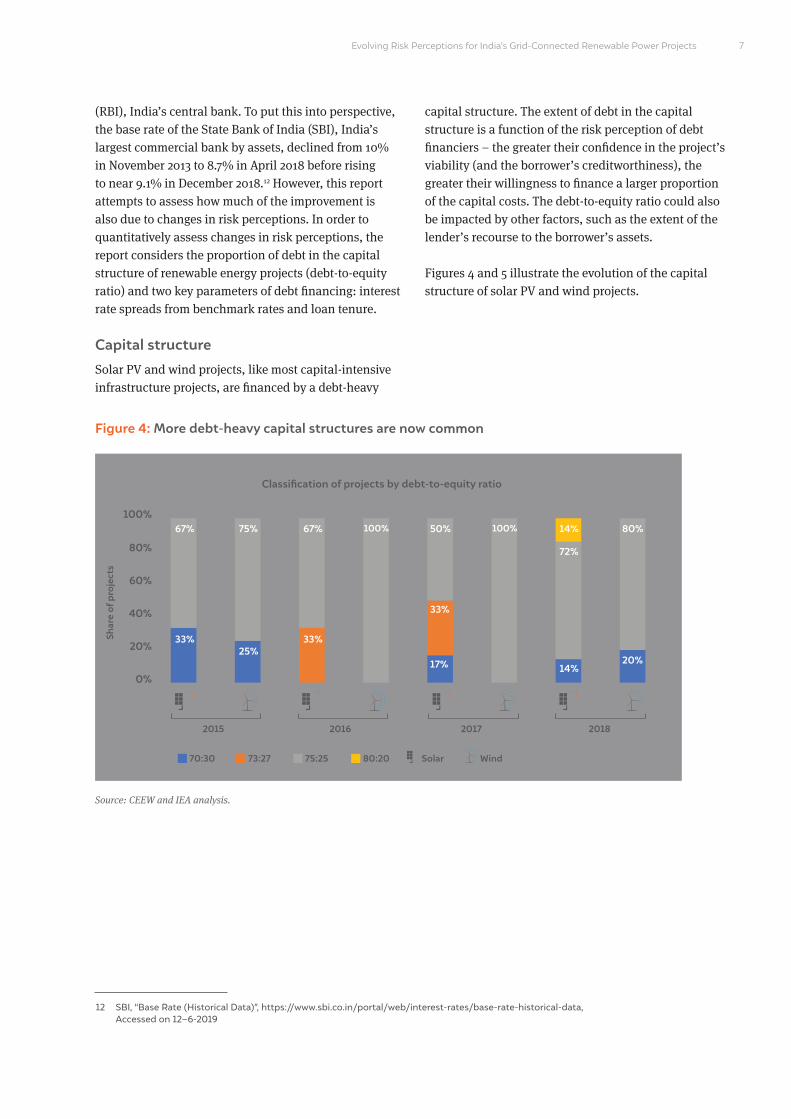
(RBI), India’s central bank. To put this into perspective, the base rate of the State Bank of India (SBI), India’s largest commercial bank by assets, declined from 10% in November 2013 to 8.7% in April 2018 before rising to near 9.1% in December 2018.12 However, this report attempts to assess how much of the improvement is also due to changes in risk perceptions. In order to quantitatively assess changes in risk perceptions, the report considers the proportion of debt in the capital structure of renewable energy projects (debt-to-equity ratio) and two key parameters of debt financing: interest rate spreads from benchmark rates and loan tenure.
Capital structure
Solar PV and wind projects, like most capital-intensive infrastructure projects, are financed by a debt-heavy
capital structure. The extent of debt in the capital structure is a function of the risk perception of debt financiers – the greater their confidence in the project’s viability (and the borrower’s creditworthiness), the greater their willingness to finance a larger proportion of the capital costs. The debt-to-equity ratio could also be impacted by other factors, such as the extent of the lender’s recourse to the borrower’s assets.
Figures 4 and 5 illustrate the evolution of the capital structure of solar PV and wind projects.
12 SBI, “Base Rate (Historical Data)”, https://www.sbi.co.in/portal/web/interest-rates/base-rate-historical-data, Accessed on 12–6-2019
Solar Wind70:30 75:2573:27 80:20
Shar
e of
pro
ject
s
2015 2016 2017 2018
Classification of projects by debt-to-equity ratio
Figure 4: More debt-heavy capital structures are now common
Source: CEEW and IEA analysis.
0%
20%
40%
60%
80%
100%
33% 33%
67% 67% 50% 14% 80%
20%14%
72%
33%
17%
100% 100%75%
25%
7
Clean Energy Investment Trends 2019
13 IEA data
2014 2015 2016 2017
Weighted average debt-to-equity ratio
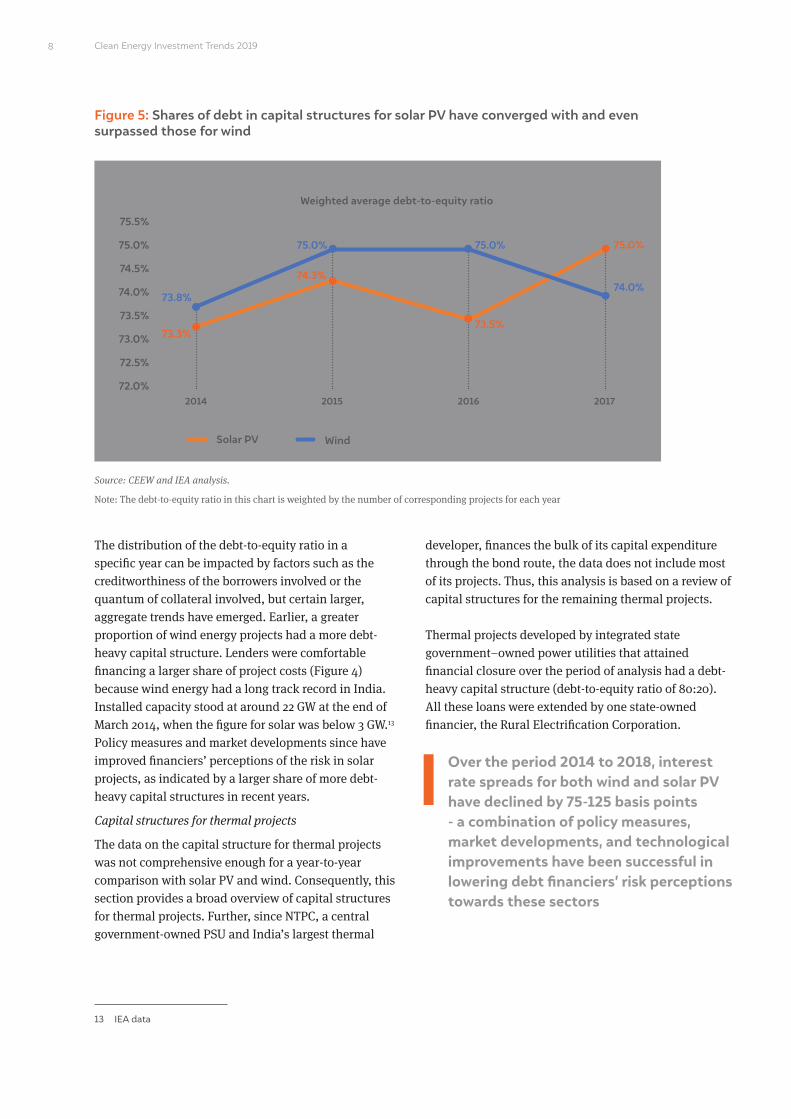
Figure 5: Shares of debt in capital structures for solar PV have converged with and even surpassed those for wind
Source: CEEW and IEA analysis.
Note: The debt-to-equity ratio in this chart is weighted by the number of corresponding projects for each year
Solar PV Wind
72.0%
72.5%
73.0%
74.0%
75.0%
73.5%
74.5%
75.5%
73.8%
75.0% 75.0%
73.3%
74.3%74.0%
73.5%
75.0%
The distribution of the debt-to-equity ratio in a specific year can be impacted by factors such as the creditworthiness of the borrowers involved or the quantum of collateral involved, but certain larger, aggregate trends have emerged. Earlier, a greater proportion of wind energy projects had a more debt-heavy capital structure. Lenders were comfortable financing a larger share of project costs (Figure 4) because wind energy had a long track record in India. Installed capacity stood at around 22 GW at the end of March 2014, when the figure for solar was below 3 GW.13 Policy measures and market developments since have improved financiers’ perceptions of the risk in solar projects, as indicated by a larger share of more debt-heavy capital structures in recent years.
Capital structures for thermal projects
The data on the capital structure for thermal projects was not comprehensive enough for a year-to-year comparison with solar PV and wind. Consequently, this section provides a broad overview of capital structures for thermal projects. Further, since NTPC, a central government-owned PSU and India’s largest thermal
developer, finances the bulk of its capital expenditure through the bond route, the data does not include most of its projects. Thus, this analysis is based on a review of capital structures for the remaining thermal projects.
Thermal projects developed by integrated state government–owned power utilities that attained financial closure over the period of analysis had a debt-heavy capital structure (debt-to-equity ratio of 80:20). All these loans were extended by one state-owned financier, the Rural Electrification Corporation.
Over the period 2014 to 2018, interest rate spreads for both wind and solar PV have declined by 75-125 basis points - a combination of policy measures, market developments, and technological improvements have been successful in lowering debt financiers’ risk perceptions towards these sectors
8
Evolving Risk Perceptions for India’s Grid-Connected Renewable Power Projects
Other thermal projects analysed were those developed by the joint ventures of two PSUs, NTPC and Steel Authority of India Limited. The capital structure of these projects was less debt-heavy (debt-to-equity ratio of 70:30). Financiers may perceive that the risk in extending loans to entities backed by state governments is low not because they think thermal generation projects entail lower risk but because of specific provisions guaranteeing repayment by the state.14 State government-backed utilities may also have greater bargaining power in obtaining financing from public sector lenders.
Interest rate spreads
Loans from domestic lenders to infrastructure projects are structured as floating rate loans. Bank lending is structured as spreads over a benchmark interest rate to compensate for risks specific to lending to particular sectors or companies. The marginal cost of funds based lending rate (MCLR) replaced the base rate as the benchmark used by banks in 2016.15 Even pre-existing loans were to be migrated to the MCLR regime, though many pre-existing loans are still benchmarked to the base rate.16
In contrast to the uniformity of interest rate structures for banks (benchmark rate + spread), NBFCs (except micro finance institutions) have greater freedom for structuring loan products.17 While NBFCs charge different interest rates to different categories of borrowers (these categories are determined internally by each NBFC), unlike banks these institutions do not publish benchmark reference rates. Thus, the analysis of spreads in this report is based only on loans extended by banks to renewable energy projects.
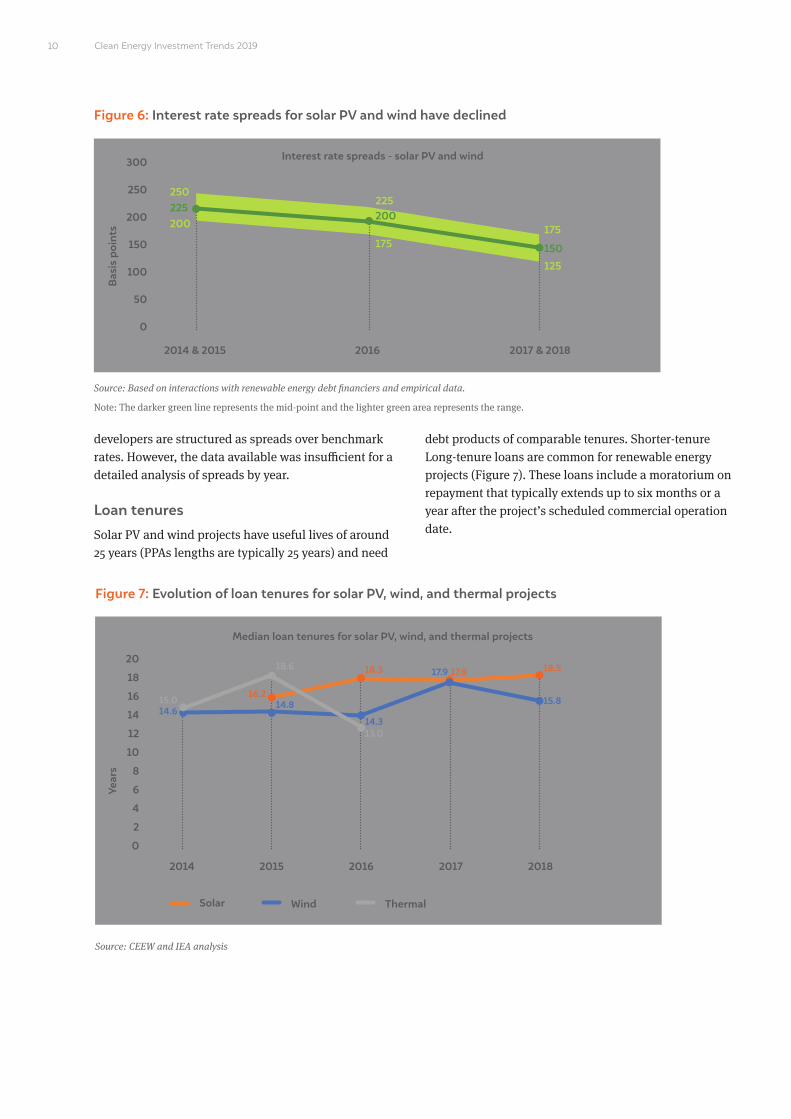
While wind energy had a head start over solar PV in terms of its track record in India, by the year 2014, bankers were familiar with utility-scale solar PV, and wind projects enjoyed no significant advantage in terms of lower spreads compared to solar. Over the period 2014 to 2018, interest rate spreads for both wind and solar PV have declined by 75-125 basis points (Figure 6). This points towards declining risk perceptions towards utility-scale solar PV and wind projects over this period of time. A combination of policy measures and market developments, such as declines in the prices of and technological improvements in solar PV modules and wind turbines, have been successful in lowering debt financiers’ risk perceptions towards these sectors.
Besides declining risk perceptions for solar PV and wind projects, competition among banks to extend loans to renewables amid the rising incidence of stressed assets in the thermal sector could be an additional driver of the decline in spreads. Challenges in fuel sourcing, cost overruns and the reluctance of state distribution utilities in signing power purchase agreements (PPAs) with thermal power plants amid rapidly declining solar PV and wind tariffs have translated into challenges in debt repayment for nearly 40 GW of new thermal capacity.20
Interest rate structures of loans for thermal projects
The thermal project loans examined demonstrated two kinds of structures for interest rate payments. Interest rates on loans taken by integrated state government-owned electricity utilities are not structured as spreads over benchmark rates, but as fixed rate loans with provisions for reset of interest rates. Interest rates on loans extended by commercial banks to other thermal
14 The deeds of hypothecation for these projects contain state guarantees as one possible mode of securing the loan; however, the actual form of the security employed is not specified. Therefore, though state guarantees may have been used for securing the loan, it is hard to say conclusively based on the available information.
15 RBI, “RBI clarifies its Directions on MCLR System”, https://www.rbi.org.in/Scripts/BS_ViewMasDirections. aspx?id=10,295, Accessed on 12–6-2019
16 Economic Times, “RBI to link bank’s base rate to MCLR from Apr 1 for loans, borrowers on base rate may benefit”, https://economictimes.indiatimes.com/wealth/personal-finance-news/rbi-to-link-banks-base-rate- to-mclr-from-apr-1-for-loans-borrowers-on-base-rate-may-benefit/articleshow/62819317.cms, Accessed on 13–6-2019
17 RBI, “All you wanted to know about NBFCs”, https://rbi.org.in/Scripts/FAQView.aspx?Id=92, Accessed on 30- 6-2019
18 Based on interactions with RE debt financiers
19 The Economic Times, “How India’s power story derailed, blowing a Rs 1.74 lakh crore NPA hole”, https:// economictimes.indiatimes.com/industry/energy/power/how-indias-power-story-derailed-blowing-a-rs- 1–74-lakh-crore-npa-hole/articleshow/65822950.cms, Accessed on 14–6-2019
20 Ibid
9
Clean Energy Investment Trends 2019
2014 & 2015 2016 2017 & 2018
Bas
is p
oint
sFigure 6: Interest rate spreads for solar PV and wind have declined
Source: Based on interactions with renewable energy debt financiers and empirical data.
Note: The darker green line represents the mid-point and the lighter green area represents the range.
0
50
100
150 150
175
125
250
300
225200
250
74.3%200 200225
175
developers are structured as spreads over benchmark rates. However, the data available was insufficient for a detailed analysis of spreads by year.
Loan tenures
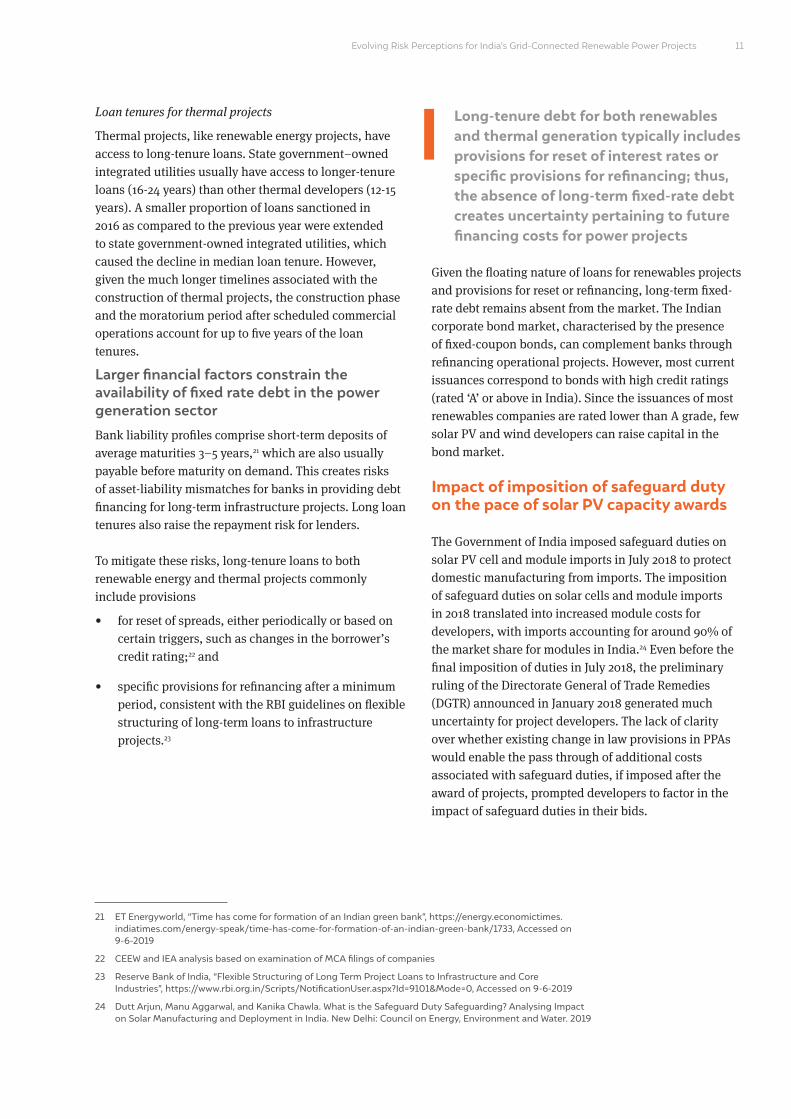
Solar PV and wind projects have useful lives of around 25 years (PPAs lengths are typically 25 years) and need
debt products of comparable tenures. Shorter-tenure Long-tenure loans are common for renewable energy projects (Figure 7). These loans include a moratorium on repayment that typically extends up to six months or a year after the project’s scheduled commercial operation date.
2014 2015
Year
s
Figure 7: Evolution of loan tenures for solar PV, wind, and thermal projects
Source: CEEW and IEA analysis
Solar Wind Thermal
0
4
8
12
16
18
20
2
6
10
14 14.614.8
16.215.0
18.6
2018
15.8
18.5
2017
17.917.9
2016
14.3
18.3
13.0
Interest rate spreads - solar PV and wind
Median loan tenures for solar PV, wind, and thermal projects
10
Evolving Risk Perceptions for India’s Grid-Connected Renewable Power Projects
Loan tenures for thermal projects
Thermal projects, like renewable energy projects, have access to long-tenure loans. State government–owned integrated utilities usually have access to longer-tenure loans (16-24 years) than other thermal developers (12-15 years). A smaller proportion of loans sanctioned in 2016 as compared to the previous year were extended to state government-owned integrated utilities, which caused the decline in median loan tenure. However, given the much longer timelines associated with the construction of thermal projects, the construction phase and the moratorium period after scheduled commercial operations account for up to five years of the loan tenures.
Larger financial factors constrain the availability of fixed rate debt in the power generation sector
Bank liability profiles comprise short-term deposits of average maturities 3–5 years,21 which are also usually payable before maturity on demand. This creates risks of asset-liability mismatches for banks in providing debt financing for long-term infrastructure projects. Long loan tenures also raise the repayment risk for lenders.
To mitigate these risks, long-tenure loans to both renewable energy and thermal projects commonly include provisions
• for reset of spreads, either periodically or based on certain triggers, such as changes in the borrower’s credit rating;22 and
• specific provisions for refinancing after a minimum period, consistent with the RBI guidelines on flexible structuring of long-term loans to infrastructure projects.23
Long-tenure debt for both renewables and thermal generation typically includes provisions for reset of interest rates or specific provisions for refinancing; thus, the absence of long-term fixed-rate debt creates uncertainty pertaining to future financing costs for power projects
Given the floating nature of loans for renewables projects and provisions for reset or refinancing, long-term fixed-rate debt remains absent from the market. The Indian corporate bond market, characterised by the presence of fixed-coupon bonds, can complement banks through refinancing operational projects. However, most current issuances correspond to bonds with high credit ratings (rated ‘A’ or above in India). Since the issuances of most renewables companies are rated lower than A grade, few solar PV and wind developers can raise capital in the bond market.
Impact of imposition of safeguard duty on the pace of solar PV capacity awards
The Government of India imposed safeguard duties on solar PV cell and module imports in July 2018 to protect domestic manufacturing from imports. The imposition of safeguard duties on solar cells and module imports in 2018 translated into increased module costs for developers, with imports accounting for around 90% of the market share for modules in India.24 Even before the final imposition of duties in July 2018, the preliminary ruling of the Directorate General of Trade Remedies (DGTR) announced in January 2018 generated much uncertainty for project developers. The lack of clarity over whether existing change in law provisions in PPAs would enable the pass through of additional costs associated with safeguard duties, if imposed after the award of projects, prompted developers to factor in the impact of safeguard duties in their bids.
21 ET Energyworld, “Time has come for formation of an Indian green bank”, https://energy.economictimes. indiatimes.com/energy-speak/time-has-come-for-formation-of-an-indian-green-bank/1733, Accessed on 9-6-2019
22 CEEW and IEA analysis based on examination of MCA filings of companies
23 Reserve Bank of India, “Flexible Structuring of Long Term Project Loans to Infrastructure and Core Industries”, https://www.rbi.org.in/Scripts/NotificationUser.aspx?Id=9101&Mode=0, Accessed on 9-6-2019
24 Dutt Arjun, Manu Aggarwal, and Kanika Chawla. What is the Safeguard Duty Safeguarding? Analysing Impact on Solar Manufacturing and Deployment in India. New Delhi: Council on Energy, Environment and Water. 2019
11
Clean Energy Investment Trends 2019
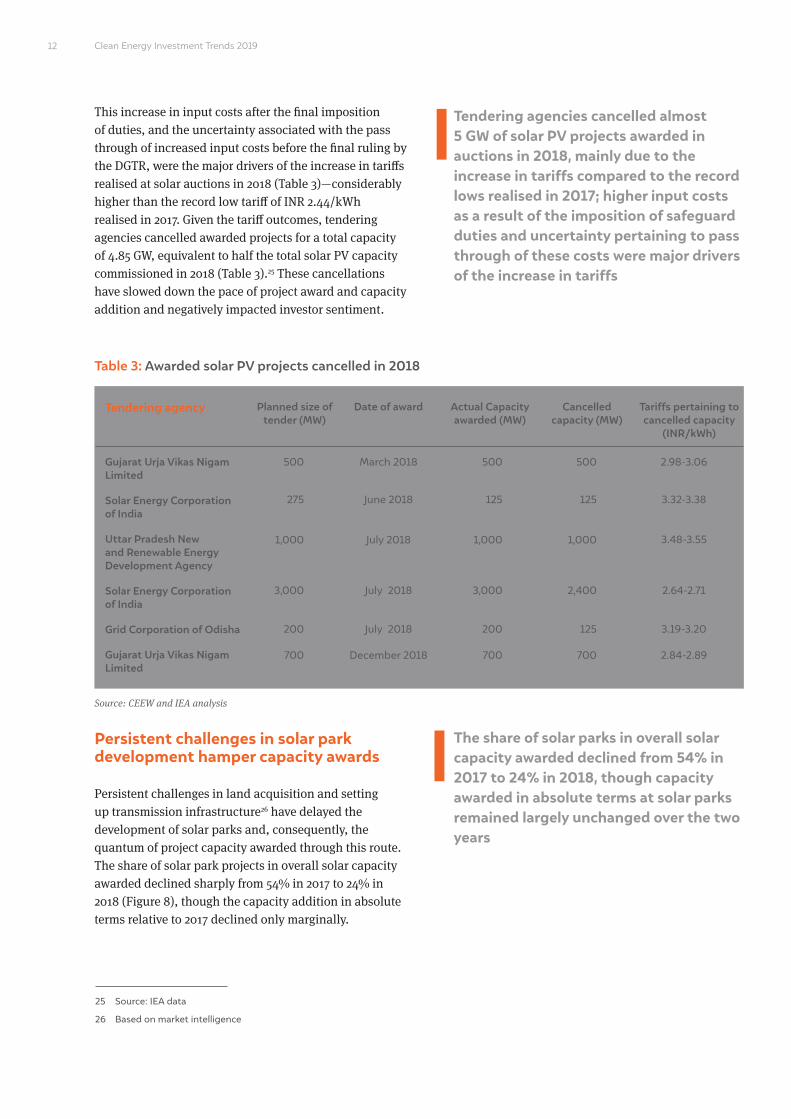
This increase in input costs after the final imposition of duties, and the uncertainty associated with the pass through of increased input costs before the final ruling by the DGTR, were the major drivers of the increase in tariffs realised at solar auctions in 2018 (Table 3)—considerably higher than the record low tariff of INR 2.44/kWh realised in 2017. Given the tariff outcomes, tendering agencies cancelled awarded projects for a total capacity of 4.85 GW, equivalent to half the total solar PV capacity commissioned in 2018 (Table 3).25 These cancellations have slowed down the pace of project award and capacity addition and negatively impacted investor sentiment.
Tendering agencies cancelled almost 5 GW of solar PV projects awarded in auctions in 2018, mainly due to the increase in tariffs compared to the record lows realised in 2017; higher input costs as a result of the imposition of safeguard duties and uncertainty pertaining to pass through of these costs were major drivers of the increase in tariffs
Persistent challenges in solar park development hamper capacity awards
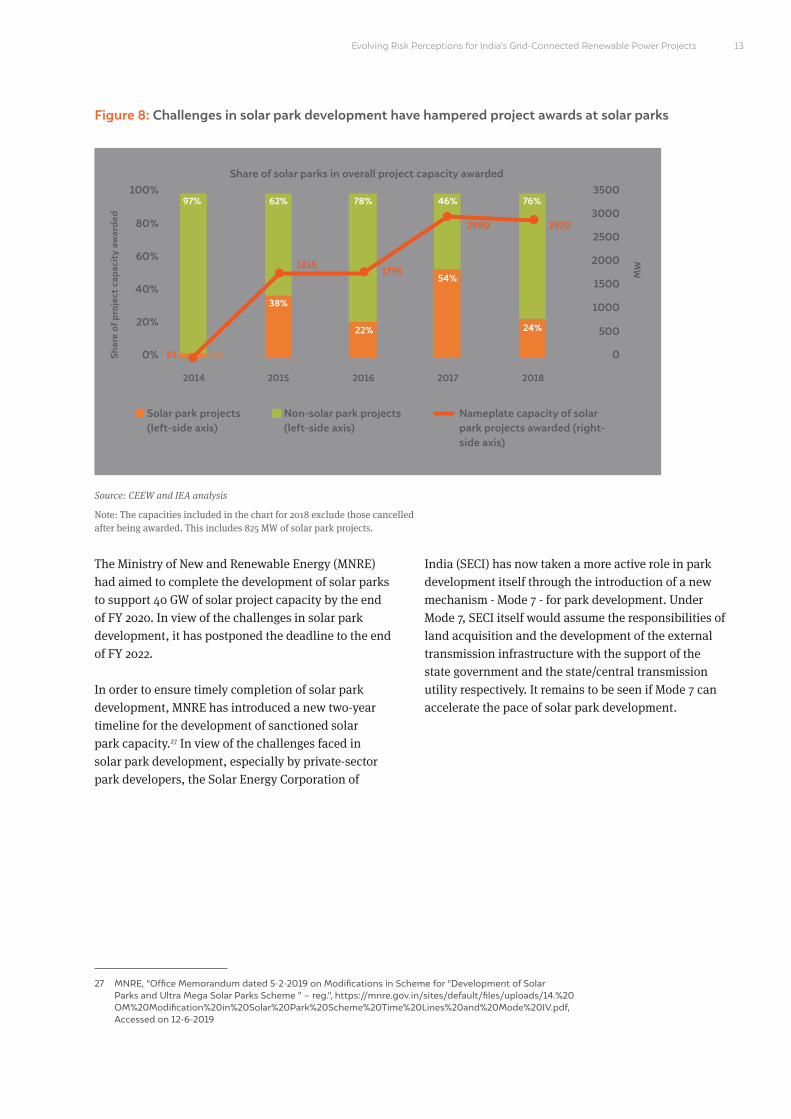
Persistent challenges in land acquisition and setting up transmission infrastructure26 have delayed the development of solar parks and, consequently, the quantum of project capacity awarded through this route.The share of solar park projects in overall solar capacity awarded declined sharply from 54% in 2017 to 24% in 2018 (Figure 8), though the capacity addition in absolute terms relative to 2017 declined only marginally.
The share of solar parks in overall solar capacity awarded declined from 54% in 2017 to 24% in 2018, though capacity awarded in absolute terms at solar parks remained largely unchanged over the two years
25 Source: IEA data
26 Based on market intelligence
Table 3: Awarded solar PV projects cancelled in 2018
Source: CEEW and IEA analysis
Gujarat Urja Vikas Nigam Limited
Solar Energy Corporation of India
Uttar Pradesh New and Renewable Energy Development Agency
Solar Energy Corporation of India
Grid Corporation of Odisha
Gujarat Urja Vikas Nigam Limited
Tendering agency Planned size of tender (MW)
Date of award Actual Capacity awarded (MW)
Cancelled capacity (MW)
Tariffs pertaining to cancelled capacity
(INR/kWh)
500
275
200
700
1,000
3,000
March 2018
June 2018
July 2018
July 2018
July 2018
December 2018
500
125
200
700
1,000
3,000
500
125
125
700
1,000
2,400
2.98-3.06
3.32-3.38
3.48-3.55
2.64-2.71
3.19-3.20
2.84-2.89
12
Evolving Risk Perceptions for India’s Grid-Connected Renewable Power Projects
The Ministry of New and Renewable Energy (MNRE) had aimed to complete the development of solar parks to support 40 GW of solar project capacity by the end of FY 2020. In view of the challenges in solar park development, it has postponed the deadline to the end of FY 2022.
In order to ensure timely completion of solar park development, MNRE has introduced a new two-year timeline for the development of sanctioned solar park capacity.27 In view of the challenges faced in solar park development, especially by private-sector park developers, the Solar Energy Corporation of
India (SECI) has now taken a more active role in park development itself through the introduction of a new mechanism - Mode 7 - for park development. Under Mode 7, SECI itself would assume the responsibilities of land acquisition and the development of the external transmission infrastructure with the support of the state government and the state/central transmission utility respectively. It remains to be seen if Mode 7 can accelerate the pace of solar park development.
27 MNRE, “Office Memorandum dated 5-2-2019 on Modifications in Scheme for “Development of Solar Parks and Ultra Mega Solar Parks Scheme ” – reg.”, https://mnre.gov.in/sites/default/files/uploads/14.%20 OM%20Modification%20in%20Solar%20Park%20Scheme%20Time%20Lines%20and%20Mode%20IV.pdf, Accessed on 12-6-2019
Figure 8: Challenges in solar park development have hampered project awards at solar parks
Nameplate capacity of solar park projects awarded (right-side axis)
Source: CEEW and IEA analysis
Note: The capacities included in the chart for 2018 exclude those cancelled after being awarded. This includes 825 MW of solar park projects.
Solar park projects(left-side axis)
Non-solar park projects (left-side axis)
Share of solar parks in overall project capacity awarded
MW
2014
3%61
18151795
2990 2920
2015 2016 2017 2018
1
2
0%
20%
40%
60%
80%
100%
0
500
1000
1500
2000
2500
3000
3500
1
2
45
97% 62% 78% 46%
54%
22%
38%
76%
24%
13
Shar
e of
pro
ject
cap
acit
y aw
arde
d
Clean Energy Investment Trends 2019
Annexure
Methodology
Evolution of risk perceptions of financiers
Financiers that issue primary debt for solar PV and wind projects analyse the risk of lending to these sectors and the borrower’s creditworthiness. To study debt financiers’ perceptions of risk towards these sectors, it is necessary to control for borrower creditworthiness. Therefore, this analysis was based on the capital structure and financing parameters of projects developed by companies of comparable creditworthiness –the top 10 solar PV and wind developers by cumulative installed capacity (Table 2).
These comprised large, creditworthy Indian renewable energy developers and international independent power producers (IPPs) operating in India’s renewable energy sector. The analysis was based on data corresponding to projects that attained financial closure in the 2014–2018 period. The comparative analysis of renewable with thermal was based on thermal projects which attained financial closure through bank/NBFC loans over the 2014–2018 period. Since NTPC, a central government–owned PSU and India’s largest thermal developer, relies on the bond market to fund the bulk of its capital expenditure, the analysis of thermal projects excludes the bulk of its capacity.
This analysis focusses on domestic sources of debt – Indian banks and NBFCs –which account for the overwhelming majority of debt flows to the Indian renewable energy sector. The benchmark lending rates for domestic sources of debt are subject to variations driven by cues from the Indian banking regulator; therefore, the study of spreads over these benchmarks is a useful indicator of risk perceptions. Measuring risk perceptions through metrics such as spreads requires common reference points. International lenders offer loans based on different benchmarks (such as LIBOR), and a comparison of spreads offered by Indian and international lenders would not yield valid results. Thus, this analysis excludes international debt flows.
Most floating rate loans extended by Indian lenders were structured as spreads over benchmarks, but a few were structured as spreads below the prime lending rate (PLR), a benchmark widely used before the introduction of base rates. Spreads under the PLR regime are not comparable to those under the base rate or MCLR regime, and so these have been excluded from the analysis.
To ensure a valid comparison between the terms of debt financing, this analysis considers primary debt issued for capital expenditure; it ignores refinancing of primary debt for operational projects because their risk profiles differ from those for greenfield projects.
Analysis pertaining to cancellations of awarded capacity and solar parks
The analysis in the Clean Energy Investment Trends report is based on a database of solar PV and wind projects developed jointly by CEEW and the IEA. The database captures multi-dimensional data on these projects, including basic project details such as technology type, nameplate capacity, project location, project status, details of the contracting and procurement process, and data on capital structure and debt financing. The database comprises information for projects sanctioned over the 2014–2018 period.
Data sources and data challenges
The data in the project-level renewable energy database was collated from publicly available sources of data and supplemented by the discretionary use of subscription-based databases. Publicly available sources of data for the project included the websites of SECI and state-level renewable energy nodal agencies, the Ministry of Finance’s database on infrastructure projects, the websites of developers, media reports, and regulatory filings of developers with stock exchanges. The data pertaining to the capital structure and debt financing
14
Evolving Risk Perceptions for India’s Grid-Connected Renewable Power Projects
parameters of both renewable energy and thermal projects was sourced from Corpository’s database of company filings with the Ministry of Corporate Affairs (MCA).
MCA filings are a useful source of financial information on entities subject to the purview of the Companies Act. These exclude international IPPs that do not operate through an Indian corporate entity. Thus, the analysis on the evolution of risk perceptions of financiers excludes these developers.
Charge documents filed with the MCA should list information on the debt financing parameters examined in this report, but often these disclosures are made in sanctioning letters for loans, which are only sometimes available as attachments with MCA filings. Thus, the analysis on the evolution of risk perceptions is based on data available through MCA filings, not on a comprehensive data set.
Because of these challenges, data on spreads for solar PV and wind was insufficient for a detailed year-wise comparison. As a result, the data on spreads was supplemented by interviews with renewable energy debt financiers. Data on loan tenures for solar PV in 2014 and for the debt-to-equity ratio for both solar PV and wind in 2018 were insufficient for drawing meaningful conclusions. Data on thermal was insufficient for a detailed analysis by year; where applicable, this report makes a general comparison between renewable energy and thermal.
Assumptions
The challenges in obtaining data necessitated the use of certain assumptions for the purpose of the analysis. These include:
• The date of financial closure in this report is taken as the sanctioning date of the loan corresponding to the project. In cases where this date was not available, the date of the deed of hypothecation corresponding to the loan was assumed to be the date of financial closure.
• In order to ensure that outliers do not distort the analysis for loan tenures, median values for tenures have been considered in the analysis.
15

Clean Energy Investment Trends 2019
Acknowledgments
The report benefited from valuable inputs,comments and feedback from various experts: Gagan Sidhu (CEEW), Manu Aggarwal (CEEW), Tim Gould (IEA), Randi Kristiansen (IEA), Tristan Stanley (IEA), and Astha Gupta (IEA Consultant).
The IEA Clean Energy Transitions Programme (CETP) helped fund this report. The authors would like to thank the funders of the CETP: Canada, Denmark, the European Commission, Finland, Germany, Italy, Japan, New Zealand, Sweden, Switzerland and the United Kingdom.
Evolving Risk Perceptions for India’s Grid-Connected Renewable Power Projects
Abbreviations
CEEW Council on Energy, Environment and Water
GW gigawatt
IEA International Energy Agency
IPP independent power producer
LCOE levelised cost of electricity
LIBOR London Interbank Offered Rate
MCA Ministry of Corporate Affairs
MCLR marginal cost of funds based lending rate
MNRE Ministry of New and Renewable Energy
MW megawatt
NBFC non-banking financial company
NPA non-performing asset
NTPC National Thermal Power Corporation
PLR prime lending rate
PPA power purchase agreement
PSU public sector undertaking
PV photovoltaic
RBI Reserve Bank of India
RE renewable energy
SBI State Bank of India
SECI Solar Energy Corporation of India
Clean Energy Investment Trends 2019
Image: Envato
Evolving Risk Perceptions for India’s Grid-Connected Renewable Power Projects
Clean Energy Investment Trends 2019
Council on Energy, Environment and Water (CEEW)
Sanskrit Bhawan, A-10, Qutab Institutional AreaAruna Asaf Ali Marg, New Delhi - 110067, IndiaT: +91 (0) 11 4073 [email protected] | ceew.in | @CEEWIndia