Embed Size (px)
Citation preview

SURFACE AND INTEXFACE ANALYSIS, VOL. 24, 681-686 (1996)
Clean Surface and Oxidation Behavior of Vanadium Carbide, VCo.75(100)
M. D. Antonik and R. J. Lad* Laboratory for Surface Science and Technology, University of Maine, Orono, ME 04469-5764, USA
T. M. Christensen Physics Department, University of Colorado at Colorado Springs, Colorado Springs, CO 80933, USA
The clean singlecrystal VCo~,,(lOO) surface, its oxidation, and the stability of the resulting oxide were examined with electron spectroscopy (AES, XPS and U P S ) , electron diffraction (low-energy and reflection high-energy elec- tron diffraction) and atomic force microscopy (AFM). The clean VC0.75 surface exhibits carbon vacancy-related features in valence band spectroscopy data. This surface was exposed to 0, at 500 "C for up to 10 000 Langmuirs. The oxidation leads to the formation of vanadium oxide, VO,.(l00), crystallites on the VC,.,,(lOO) substrate. The AFM images indicate that oxide crystallites grow with an elongated shape along {Ool) type directions. When heated above lo00 "C, the oxide is unstable and a clean VC,.,,(lOo) surface is produced.
INTRODUCTION
Transition-metal carbides are useful wear-resistant materials in tooling and other industrial applications.1*2 They possess extreme hardness, chemical inertness and excellent resistance to wear. Advances in deposition technology have made vanadium carbide coatings ~ i a b l e . ~ In addition to their extreme hardness, they have a very high melting point and excellent electrical con- ductivity? Because applications of VC and other transition-metal carbides encompass a wide range of temperatures and chemical environments, the morpho- logical and chemical changes of their surfaces are of great intere~t .~ This paper focuses on the oxidation behaviour of a vco.75(100) single-crystal surface and emphasizes the structure and local chemistry during early stages of oxide nucleation and growth.
Vanadium carbide can exist over a very wide com- position range as VCJO.5 < x < 0.97) without a struc- tural change from the fcc rocksalt structure. The exact stoichiometry of VC, has a profound effect on its physi- cal proper tie^.^-^ For example, material properties based on bonding (e.g. melting point, elastic constants, electrical properties) show a very strong dependence on comp~sition.~ Studies of the surface and catalytic properties of stoichiometric VC films deposited on V(l10)798 have confirmed that the bonding process involves charge transfer from vanadium to carbon. A complete discussion of the electronic structure of VC, and other transition-metal carbides is given in two recent reference^.^,^
In bulk v&5, vacancies have been observed to order into a periodic superlattice,' but evidence of surface vacancy ordering has not been found.5 None the less, vacancies are indeed present on the surface." On TIC,( loo), surface carbon vacancy sites have been iden- tified as sites for enhanced chemical activity towards
* Author to whom correspondence should be addressed.
CCC 0142-2421/96/100681-06 0 1996 by John Wiley Kc Sons, Ltd.
0, .'"' For VC, surfaces, however, the reactivity of the carbon vacancy sites to 0, is less established. Using ion scattering spectroscopy, Miura et al." observed that the room temperature interaction between surface carbon vacancies and oxygen atoms on V6C5(100) is low com- pared to other surface sites. On the contrary, changes in workfunction as a function of 0, and CO exposures have been shown to be large on VC,.,,(100),2 and attributed to adsorption at empty carbon sites. Hakansson et al." used high-resolution photoelectron spectroscopy to show the presence of a surface C 1s state on VC,,,, and found that it was quenched upon 100 L of oxygen. In our study, we have carried out oxi- dation at 500 "C and observe a strong surface reactivity towards 0, ; we also find a crystallographic registry of the oxide nuclei during the initial stages of oxide growth.
EXPERIMENTAL
The vc0.75 single crystal, grown by a floating zone method,13 was cut to within 1/2" of the (100) plane, mechanically polished with a diamond paste to a final polish of 0.5 pm and ultrasonically cleaned in acetone, isopropanol and water. The 6 mm x 6 mm x 2 mm sample was inserted into ultrahigh vacuum (UHV) and annealed at 1000 "C for 30 min. This procedure produc- ed a clean ordered surface, without the need for ion bombardment, as determined by XPS, AES and LEED.
The sample was heated over the range 25-1000 "C by an electron beam heater directed at the back side of the sample, and the temperature of the front surface was measured using an infrared pyrometer. Oxidation was carried out at 500°C using an 0, partial pressure of
Torr for the following 9000 L. The sample was allowed to quickly cool in the 0, environment to 200 "C before the 0, was pumped out. The reported exposures are calculated based on the time in 0, at 500 "C only.
Torr for the first 1000 L and
Received 25 January 1996 Accepted 4 June I996

682 M. D. ANTONIK, R. J. LAD AND T. M. CHRISTENSEN
The clean and oxidized surfaces were characterized using electron spectroscopy (AES, XPS and UPS), elec- tron diffraction (low-energy (LEED) and reflection high- energy (RHEED)) and atomic force microscopy (AFM). The oxidation and electron-based characterizations were performed in a UHV system with a base pressure of 1 x Torr equipped with a Physical Electronics double-pass cylindrical mirror analyzer (CMA). A VG- Microtech x-ray source producing A1 Ka x-rays (1486.6 eV) was used for XPS. The spectrometer was calibrated using spectra acquired from a clean Cu foil; the Cu 2p3,’ peak was measured at 932.6 eV and the Cu 3p peak at 74.1 eV. For UPS, a differentially pumped Leybold-Heraeus helium discharge lamp was used to produce He(1) (21.2 eV) and He(I1) (40.8 eV) radiation. The position of the Fermi level was determined from a clean Au foil held in contact with the sample holder. The CMA was operated at a pass energy of 15 eV for UPS and 50 eV for XPS. Auger electrons were excited using a normal incidence electron gun at 5 keV and acquired in derivative mode using a modulation ampli- tude of 4 eV peak to peak. The LEED system was a standard Varian retarding field type. A VG-Microtech LEG 110 electron gun operated at 15 kV was used for RHEED. The AFM measurements were performed in air using a Park Scientific Instruments SFM-BD2 scan- ning force microscope. The tips had a nominal radius of 40 nm and the cantilevers had a spring constant of 0.37 N m- l. Difficulties associated with AFM measurements on very hard materials (including VC,) have been dis- cussed e1~ewhere.l~
RESULTS AND DISCUSSION
Annealing to lo00 “C produced a clean surface as deter- mined by XPS and AES. The exact clean surface stoi- chiometry resulting from this treatment and its relationship to the bulk VCo.75 stoichiometry is not known; however, the surface composition remained constant as a function of annealing time at lo00 “C. Our observed XPS and UPS spectra are consistent with spectra reported in the for vanadium carbide. The XPS measurements of the clean surface indicated that the V 2p3,, transition occurred at a binding energy of 513.5 k 0.2 eV and the C 1s transition was at 282.5 f 0.2 eV. Hakansson et al.” have exam- ined vc0.80 single-crystal surfaces and report a bulk C 1s binding energy of 282.5 k 0.1 eV and a V 2p3,, value of 512.9 k 0.2 eV. These results can also be compared with the extensive study of metal carbides by Ramqvist et a l l 5 They report a C 1s binding energy of 282.4 k 0.1 eV for their hot-pressed VC sample. In addition, a series of Tic, samples with various carbon concentrations was examined15 and no change in the C 1s line position with carbon concentration was observed. If VC, behaves similarly to Tic,, it is not surprising that our C 1s binding energy agrees with the reported values, even though the carbon concentrations differ. Gruzalski and Zehner16 examined the behavior of the C 1s binding energies with carbon composition in TaC, and HfC,. They found no significant shifts in C 1s binding energy
in TaC, for x > 0.70 and an increase in C 1s binding energy with x in HfC, . We did not measure a reference spectrum from pure metallic V, but our results for VC,,,, indicate an increase of 1.4 5 0.2 eV in the V 2p3,, binding energy compared to the handbook metal value.17 This is less than the 1.8 _+ 0.3 eV shift from metallic vanadium reported for VC.15 It is in agreement with the trend found for TIC, of a decrease in the Ti
?ding energy with decreasing carbon concentra- tion.
Using high-resolution XPS, Hakansson et al.” were able to measure a C 1s surface core-level shift of 0.33 eV on VCO.,,(lOO); no measurable shift was detected for the V 2p core level. The resolution of our spectrometer was not sufficient to resolve the C 1s core-level shift or to discern any carbon vacancy-related core-level fea- tures.
The AES spectrum of the clean surface is shown in Fig. 1. The ratio of the C KLIL, to C KL2, 3L2, AES peaks for a series of metal carbides is reported to depend on the extent of charge transfer between the metal and carbon atoms.18 Gruzalski and Zehneri6 also examined this for TaC, and HfC, with various carbon concentrations. They found that the ratio of the carbon AES peaks decreases as the carbon concentration decreases. They suggest that this can be attributed to a reduction of electron charge in the vicinity of the carbon atoms. The reported ratios for VC are 4.818 and 6.3., We, however, measure a ratio of 11.4 k 0.2 for VC0,,, . Differences in instrument resolution, modula- tion amplitude, sample preparation and surface stoichi- ometry might all be responsible for the variance in the ratio between studies.
The UPS valence band spectra are presented in Fig. 2 and are compared to theoretical linear muffin tin orbital calculation^^^ for VC and vco.75 surfaces. The theoreti- cal density of states for VCo.74 calculated by the Korringa-Kohn-Rostoker methodz0 yields qualit- atively similar results. The carbon deficiency is mani- fested as the presence of new states near the Fermi level and a shift of the C 2s features to higher binding energy. These results are also in agreement with angle-resolved photoemission studies of VC0~80(100) using synchrotron radiation’’ where a carbon vacancy-induced state was observed 1.9 eV below the Fermi level.
I
I I I I I I I I I
200 300 400 500
Kinetic Energy (eV)
Figure 1. Auger electron spectrum from clean VCo.76(1 00).

CLEAN SURFACE AND OXIDATION BEHAVIOR OF VANADIUM CARBIDE 683
.- L. u) C Q)
C c -
hv = He 40.8 II eV- c2p-v3d
density Of
states (let 19)
20 15 10 5 EF
Binding Energy (eV)
Figure 2. The measured UPS valence band spectra for clean VCo,76(100) are compared to the theoretical total density of states for VCo,7s from Ref. 19.
Exceptionally sharp (1 x 1) LEED and RHEED pat- terns were observed from the lo00 "C-annealed VCo.75( 100) surface, indicating the presence of a well- ordered surface as shown in Fig. 3. When performing LEED experiments, a displacement of the pattern and/or double spots was observed when the sample was translated so that the electron beam impinged near the edges of the sample, indicating that there was subgrain structure in the single crystal. This subgrain structure was also evident in Laue back-reflection x-ray diffrac- tion patterns obtained from the sample prior to mecha- nical polishing, indicating that it was not induced by the polishing treatment. When the beam was positioned near the center of the sample, a single diffraction pattern was visible. With the low angle of incidence used in RHEED, however, the beam is spread over the length of the sample and the mosaic spread was impos- sible to avoid. Based on the angular separation between diffraction spots in Fig. 3(b) associated with the sub- grain structure, the mosaic spread is estimated to be of the order of 0.5".
The crystal was removed from the UHV system to acquire AFM images. Figure 4 shows a typical 1.0 pm x 1.0 pm contact mode image obtained from a clean surface that exhibited sharp LEED and RHEED patterns. This surface contains some situations, presum- ably related to the polishing process, but is quite smooth. The root mean square (rms) roughness calcu- lated over this 1 pm2 area was 0.8 nm.
Oxidation of VC,.,,
Oxidation of the VCo.,5 surface was studied by in situ RHEED and XPS following several O2 exposures. The growth of the 0 1s and the shifts in the V 2p spectra are shown in Fig. 5. The V 2p peaks shift to higher binding energy as the vanadium coordination changes from carbide to oxide. Figure 6 shows the XPS spectrum after loo00 L which has been deconvoluted into the constituent oxide and carbide peaks. The deconvolution was fitted using Voigt functions after a linear back- ground subtraction with the ratio of the 2p,,, to 2p1,,
Figure 3. A 100 eV LEED pattern (a) and a 15 kV RHEED pattern (b) along the (001) azimuth obtained from clean VCo.,,(10O).
peak areas being constrained to 2: 1. The V 2p,,, peak associated with the oxide is 2.3 eV higher in binding energy than the carbide peak in agreement with the trends observed in Ti compound^.'^ The measured value of 515.9 k 0.2 eV agrees with published values for
Figure 4. A 1 p x 1 p AFM image of a mechanically polished and vacuum-annealed clean VCo,,6(l 00) surface (gray scale -5 nm).
M. D. ANTONIK, R. J. LAD AND T. M. CHRISTENSEN
hv = 1486.6 eV 0 I s
0 2 exposure
5,000 L
1,000 L
WA\L 500L
IooL
1 1 1 I l I 1 1 1 1 1 1 1 1 1
535 530 525 520 515 510 505 500
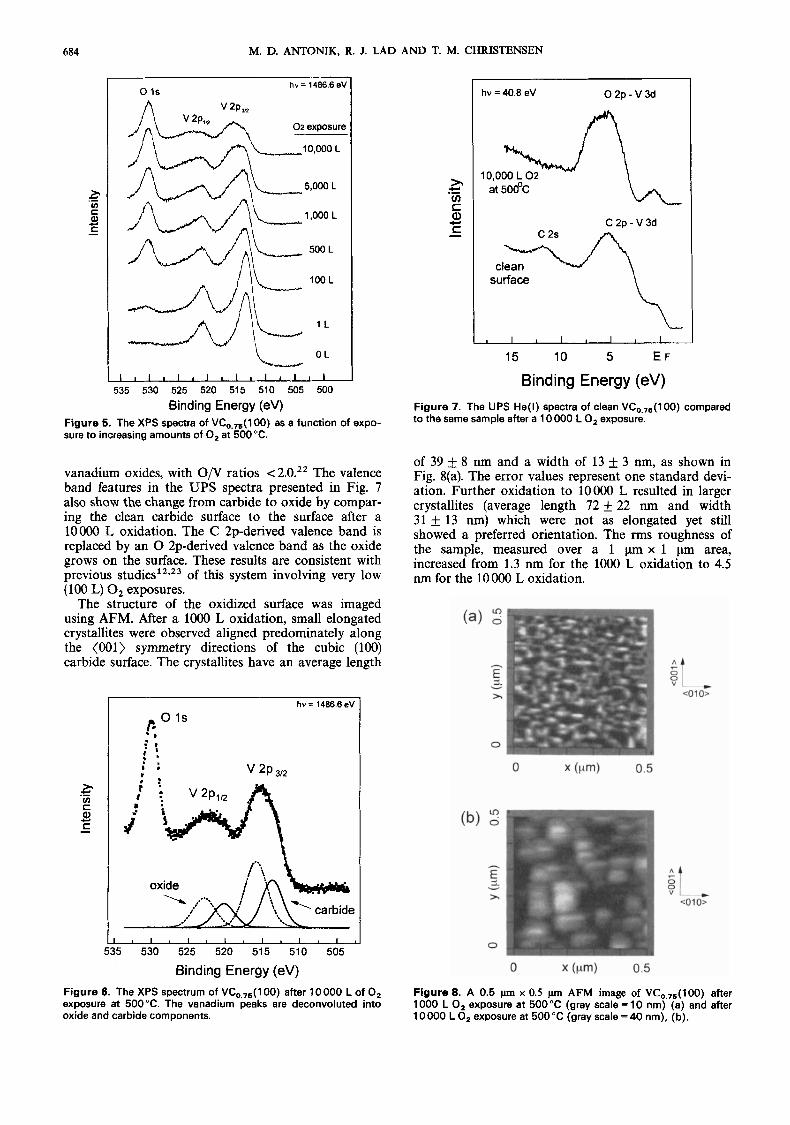
Binding Energy (eV) Figure 5. The XPS spectra of VCo.76(1 00) as a function of expo- sure to increasing amounts of 0, at 500°C.
vanadium oxides, with O/V ratios ~ 2 . 0 . ' ~ The valence band features in the UPS spectra presented in Fig. 7 also show the change from carbide to oxide by compar- ing the clean carbide surface to the surface after a loo00 L oxidation. The C 2p-derived valence band is replaced by an 0 2p-derived valence band as the oxide grows on the surface. These results are consistent with previous s t ~ d i e s ~ ~ , ~ ~ of this system involving very low (100 L) 0, exposures.
The structure of the oxidized surface was imaged using AFM. After a lo00 L oxidation, small elongated crystallites were observed aligned predominately along the (001) symmetry directions of the cubic (100) carbide surface. The crystallites have an average length
hv = 1486.6 eV
*p 312 I .
535 530 525 520 515 510 505
Binding Energy (eV) Figure 0. The XPS spectrum of VCo,,,(lOO) after 10000 L of 0, exposure at 500°C. The vanadium peaks are deconvoluted into oxide and carbide components.
hv = 40.8 eV O2p-V3d
C 2p - V 3d
clean surface
15 10 5 E F
Binding Energy (eV) Figure 7. The UPS He(l) spectra of clean VCo.,,(lOO) compared to the same sample after a 10 000 L 0, exposure.
of 39 & 8 nm and a width of 13 _+ 3 nm, as shown in Fig. 8(a). The error values represent one standard devi- ation. Further oxidation to 10000 L resulted in larger crystallites (average length 72 k 22 nm and width 31 f 13 nm) which were not as elongated yet still showed a preferred orientation. The rms roughness of the sample, measured over a 1 pm x 1 pm area, increased from 1.3 nm for the 1000 L oxidation to 4.5 nm for the loo00 L oxidation.
Figure 8. A 0.5 pm x 0.5 pm AFM image of VCo,,,(10O) after 1000 L 0, exposure at 500°C (gray scale -10 nrn) (a) and after 10000 L 0, exposure at 500°C (gray scale =40 nm), (b).

CLEAN SURFACE AND OXIDATION BEHAVIOR OF VANADIUM CARBIDE 685
Figure9. RHEED patterns along the (001) azimuth (a) and (011) azimuth (b) from VC,,,,(lOO) after 10000 L 0, exposure at 500 "C. Simulations of transmission diffraction patterns along (001 ) (c) and (01 1) (d) directions from epitaxial VOJIOO) crys- tallites.
The AFM line scan profiles of these surfaces indi- cated that the individual crystallite images have rela- tively smooth slopes compared to features on other samples. There is no preferred value of slope angle, which varied from 15" to 54" (the steepest slope that these pyramidal tips could image). In general, taller fea- tures possess steeper slopes and have a characteristic profile which could be the result of a tip shape artifact.
The oxide layer thickness after loo00 L of O2 expo- sure was estimated from attenuation of the carbon signal from the VC,.,5 surface in both the AES and XPS data. The mean free path of electrons from carbon can be approximated from the universal curve of elec- tron mean free paths us. electron energy. We estimate a mean free path of 0.7 nm in AES (271 eV) and 1.7 nm in XPS (1204 eV). A simple attenuation model which assumes a uniform continuous oxide layer does not seem appropriate in light of the AFM results. Such a model would suggest that the AES carbide signal, with its shorter mean free path, should be essentially gone for oxide crystallites thicker than - 3 nm. The rms rough- ness of the crystallites is 4.5 nm, which indicates that a significant number of crystallites are likely to be thicker
Figure 10. A 1 pn x 1 pm AFM image of VC,,,,(lOO) after removal of oxide by heating in a vacuum (gray scale = 5 nm).
than 3 nm. Although strongly attenuated, we do observe an AES carbide signal. This suggests that the carbide is mixing with the oxide, a significant number of oxide crystallites are thinner than 3 nm, or the carbide surface is not completely covered. Oxycarbide forma- tion cannot be ruled out but is highly unlikely based on the He' ion scattering results reported by Souda et a1.24 for oxygen chemisorption on TiC(100) and VC(lO0) surfaces. They found that oxygen can diffuse into bulk Tic via carbon vacancies but that this mecha- nism is prohibited on VC surfaces.
Incomplete surface coverage can be modeled if we assume that the measured intensity comes from two sources : bare substrate and oxide-covered regions. The relative intensities of these sources would depend on their relative areas. Only the oxide-covered region would be attenuated. This can be expressed as
I / I o = (1 -f,J + Cf,x)e-d'A where 1 is the mean free path of the electrons, d is the average oxide thickness and fox is the fraction of the surface area covered by oxide. Since the mean free path is only 0.7 nm for the AES carbon signal, the crystallites may be assumed to completely block the AES signal and the only contribution for AES is the first term. This allows us to calculate the fraction of the surface covered by oxide crystallites to be 0.92. Measurements from the AFM images indicate that 0.90 k 0.02 of each image contains crystallites, with the remaining 0.10 being too low (dark) to image. Since the XPS electrons have a larger mean free path, we can now use this area ratio and the measured XPS intensities to calculate an average oxide crystallite thickness of 3.0 nm.
The nature of the growing film during oxidation was also determined from RHEED observations. As the oxide layer formed on the surface, the reflection diffrac- tion patterns were replaced by transmission diffraction patterns due to the fact that the reflected RHEED beams were shadowed by the highest oxide crystallites on the surface yet could still be diffracted in transmis- sion through them. Figure 9 shows examples of these transmission diffraction patterns recorded along the (001) and (011) azimuthal directions of the vanadium carbide surface. VO, is the only vanadium oxide with a cubic structure and it has a lattice constant of 0.409 nm, which is very close to the 0.417 nm for VC,. Simula- tions of the transmission patterns expected from epi- taxial VO,(l00) crystallites on the VC,(l00) surface are also shown in Fig. 9. The agreement in the symmetry and lattice parameters between the simulations and the measured patterns suggests that the initial oxide on the surface is the VO, phase, consistent with the XPS results. Additional faint spots are visible in the mea- sured patterns shown in Fig. 9, which we believe is again related to the mosaic spread present near the edges of the sample.
Oxide stability
Following a loo00 L oxidation, the sample was annealed in a vacuum at lo00"C for 5 min. Spectro- scopic measurements indicated that the surface was now free of oxygen. The RHEED and AFM images showed no evidence for oxide crystallites remaining on the

686 M. D. ANTONIK, R. J. LAD AND T. M. CHRISTENSEN
surface. The AFM images were not quite the same as the original clean surface, as can be seen from compari- son of Fig. 10 of the post-oxidation cleaned surface with Fig. 4 of the original clean surface. Larger features were now observed with a typical lateral dimension of 0.14 pm and a height of -3 nm. The features also showed evidence of steps with an average step height of -0.3 nm. The original surface had an rms roughness of 0.5 nm over a 2 x 2 pm2 area. The cleaned surface had a 0.9 nm rms roughness over a similar area. Further annealing in a vacuum did not substantially change these images.
SUMMARY
The clean well-ordered VC,.,,(lOO) surface exhibits carbon deficiency-related features in AES and UPS
spectra. Exposure of the VC,.,,(lOO) surface to up to 10000 L of O2 at 500°C results in the formation of VOJl00) crystallites as indicated by XPS, AES and UPS results. Reflection high-energy electron diffraction indicates that a cubic structure consistent with fcc VO, formed with the same orientation as the carbide crystal. The AFM results demonstrate that the oxide consisted of elongated crystallites with preferred directions along the (001) directions of the carbide surface. The oxide could be removed from the surface by heating the sample to 1OOO"C.
Acknowledgements
The authors are grateful to C. B. Finch and L. Boatner of Oak Ridge National Laboratory for providing the single-crystal samples. This work was partially supported by the Petroleum Research Fund (PRF) Grant no. 22196-G5 administered by the American Chemical Society. T.M.C. acknowledges receipt of a PRF Summer Research Fellowship.
REFERENCES
1. C. Oshima, M. Oano, S. Zaima, Y. Shibata and S. Kawaii, J.
2. P. A. P. Lindberg and L. I . Johansson, Surf. Sci. 194, 199
3. J. A. Vaccari,Am. Mach. 153,45 (1991). 4. W. Williams, Mater. Sci. €ng.A 105/108, 1 (1988). 5. L. I. Johansson, Surf. Sci. Rep. 21,177 (1995). 6. V. A. Gubanov, A. L. lvanovsky and V. P. Zhukov, Electronic
Structure of Refractory Carbides and Nitrides. Cambridge Uni- versity Press, Cambridge (1 994).
7. J. G. Chen, C. M. Kim, B. Fruhberger, B. D. DeVries and M. S. Touvelle, Surf. Sci. 321,145 (1 994).
8. J. G. Chen, B. D. DeVrie, B. Fruhberger, C. M. Kim and Z.-M. Liu, J. Vac. Sci. Technol. A 13,1600 (1 995).
9. T. Epicier, M. G. Blanchin and P. Ferret, Philos. Mag. A 59, 885 (1 989).
10. K. Miura, R. Souda, T. Aizawa, C. Oshima, S. Otani and Y. Ishizawa, J. Vac. Sci. Techno1.A 7,301 3 (1989).
11. M. Aonon, Y. Hou, R. Souda, C. Oshima, S. Otani and Y. Isha- zawa, Phys. Rev. Lett. 50,1293 (1 983).
12. K. L. Hakansson, L. I. Johansson, M. Hammar and M. Gothel- id, Phys. Rev. 6 47,10769 (1 993).
13. C. B. Finch, Y. K. Chang and M. M. Abraham, Oak Ridge National Laboratory Report ORNL/TM-II 103 (1989).
Less Common Met. 82.69 (1 981 ) .
(1 988).
14. M. D. Antonik and R. J. Lad, J. Vac. Sci. Technol. A 10, 669 (1 992).
15. L. Ramqvist, K. Hamrin, G. Johansson, A. Fahlman and C. Nordling, J. Phys. Chem. Solids 30,1835 (1 969).
16. G. R. Gruzalski and D. M. Zehner, Phys. Rev. B 42, 2768 (1 990).
17. C. D. Wagner, W. M. Riggs, L. E. Davis, J. F. Moulder and G. E. Muilenberg, Handbook of X-Ray Photoelectron Spectros- copy. Perkin-Elmer, Eden Prairie, MN (1 980).
18. Ju. M. Shul'ga and G. L. Gutsev, J. Electron Spectrosc. Relat. Phenom. 34,39 (1 984).
19. V. P. Zhukov and V. A. Gubanov, J. Phys. Chem. Solids 48, 187 (1987).
20. P. Marksteiner, P. Weinberger, A. Neckel, R. Zeller and P. H. Dederichs, Phys. Rev. 6 33,812 (1986).
21. K. L. Hakansson, L. I. Johansson, P. L. Wincott and D. S. L. Law, Surf. Sci. 258,389 (1 991 ) .
22. R. J. Colton, A. M. Guzman and J. W. Rabalais, J. Appl. Phys. 49,409 (1 978).
23. P. A. P. Lindberg and L. I. Johansson, Electronic Structure Studies of Transition - Metal Carbides and Nitrides. Linkoping University, Linkoping (1 987).
24. R. Souda, T. Aizawa, S. Otani, Y. lshizawa and C. Oshima, Surf. Sci. 250,19 (1 991 ) .


![A Simple and Novel Route for Synthesis of Vanadium Carbide … · D/max-RB12] and Thermo Gravimetric Analysis (TGA)/differential scanningcalorimetry (DSC) (MettlerToledo, Switzerland)](https://img.pdfslide.net/doc/110x75/6043ef4a8d8b3242af1397d3/a-simple-and-novel-route-for-synthesis-of-vanadium-carbide-dmax-rb12-and-thermo.jpg)


![Vanadium-Catalyzed Selenide Oxidation with in situ [2,3] Sigmatropic Rearrangement: Scope and Asymmetric Applications Campbell Bourland February 6, 2002](https://img.pdfslide.net/doc/110x75/5697c0281a28abf838cd7168/vanadium-catalyzed-selenide-oxidation-with-in-situ-23-sigmatropic-rearrangement.jpg)


![Carbon nanotube-induced preparation of vanadium oxide ... · 7 is considered the active phase in selective oxidation ofn-butane to maleic anhydride in VPO [28]. The as-obtained vanadium](https://img.pdfslide.net/doc/110x75/5e0c13efd239a26801096b11/carbon-nanotube-induced-preparation-of-vanadium-oxide-7-is-considered-the-active.jpg)