Embed Size (px)
Citation preview
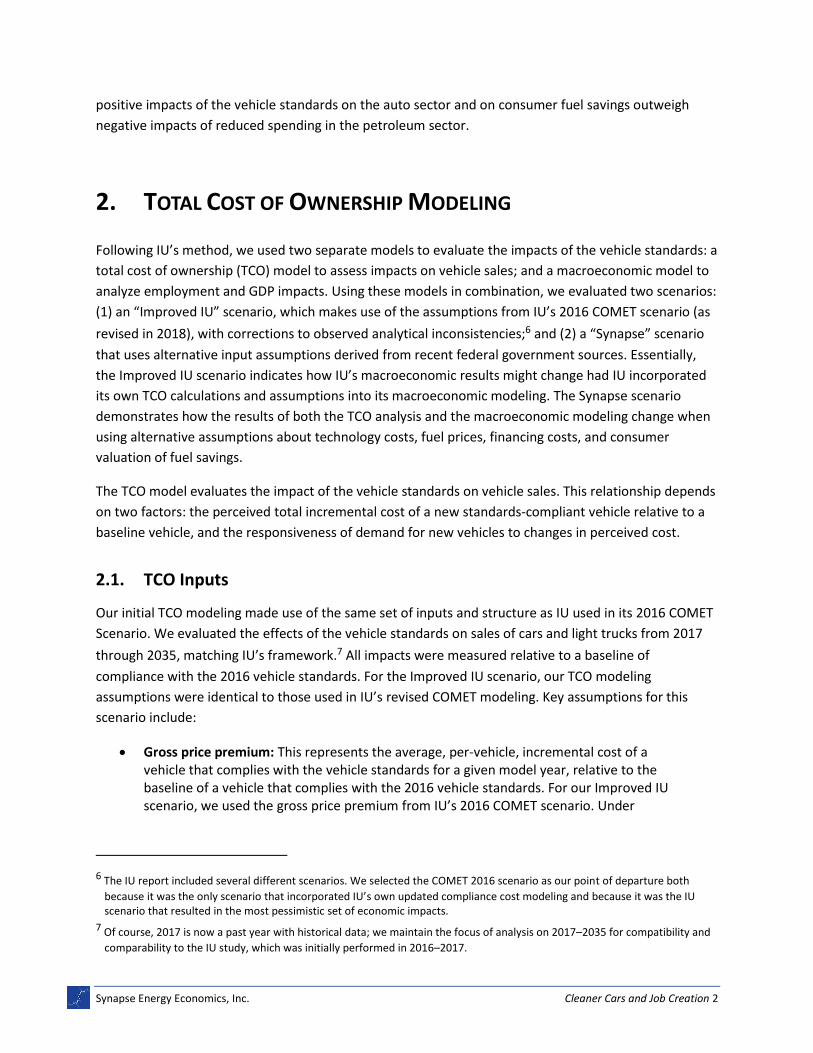
485 Massachusetts Avenue, Suite 2
Cambridge, Massachusetts 02139
617.661.3248 | www.synapse-energy.com
Cleaner Cars and Job Creation
Macroeconomic Impacts of Federal and State
Vehicle Standards
Prepared for Union of Concerned Scientists, Natural Resources Defense Council, and American Council for an Energy-Efficient Economy
March 27, 2018
AUTHORS
Avi Allison
Jamie Hall
Frank Ackerman, PhD
CONTENTS
EXECUTIVE SUMMARY .......................................................................................... ES-1
1. CONTEXT ........................................................................................................ 1
2. TOTAL COST OF OWNERSHIP MODELING ................................................................ 2
2.1. TCO Inputs .......................................................................................................................2
2.2. TCO Results .....................................................................................................................6
3. MACROECONOMIC MODELING .......................................................................... 10
3.1. IMPLAN Modeling Inputs ............................................................................................... 11
3.2. IMPLAN Modeling Results .............................................................................................. 12
4. DISCUSSION: WHY SUCH STRONG RESULTS? ......................................................... 15
4.1. General Explanations for Results .................................................................................... 15
4.2. Comparison to IU Results ............................................................................................... 16
5. CONCLUSION ................................................................................................. 17
Synapse Energy Economics, Inc. Cleaner Cars and Job Creation ES-1
EXECUTIVE SUMMARY
The U.S. Environmental Protection Agency (EPA) and National Highway Traffic Safety Administration
(NHTSA) are currently reconsidering federal greenhouse gas and corporate average fuel economy (CAFE)
standards set for light-duty vehicles through model year 2025. As part of this process, EPA and NHTSA
are examining a range of factors, including the potential economic impacts of fuel economy standards.
In March 2017, a group of researchers from Indiana University (IU) released a report concluding that the
combination of currently planned federal CAFE and greenhouse gas standards and state zero emission
vehicle standards (we refer to these collectively as the “vehicle standards”) will result in long-term
macroeconomic benefits. However, their analysis also concluded that the vehicle standards will result in
short-term macroeconomic losses. In 2018, IU released revisions to its modeling that corrected for two
analytical errors that had biased its 2017 results against the vehicle standards. Nonetheless, IU’s general
conclusions remained the same.
A previous Synapse Energy Economics (Synapse) report identified questionable inputs and
methodological inconsistencies in the IU report that further biased its results against the vehicle
standards. To understand the impacts of these inputs and inconsistencies, Synapse used the IU analysis
as a starting point to conduct an independent assessment of the macroeconomic impacts of the vehicle
standards. Our analysis relied on two related modeling exercises: a total cost of ownership (TCO)
analysis used to estimate the impact of the vehicle standards on vehicle sales, and an IMPLAN-based
input-output analysis used to assess impacts on U.S. employment and gross domestic product (GDP).
We evaluated two scenarios: (1) an “Improved IU” scenario, which uses inputs and assumptions from
IU’s most up-to-date scenario from February 2018, with corrections to observed analytical
inconsistencies; and (2) a “Synapse” scenario that uses alternative input assumptions derived primarily
from recent federal government sources.
The Improved IU scenario corrects for a lack of synchronization between IU’s own TCO and
macroeconomic modeling. The IU authors discarded many of the assumptions from their more carefully
researched TCO model, replacing them with less appropriate assumptions in their macroeconomic
modeling. For example, IU’s macroeconomic modeling assumed that consumers ignore future fuel
savings when buying a vehicle, are extremely sensitive to changes in vehicle prices, and never finance
their vehicle purchases. The Improved IU scenario corrects for this lack of consistency by incorporating
IU’s TCO modeling assumptions and results into the macroeconomic modeling, while keeping all other
IU input assumptions.
The Synapse scenario uses the latest EPA technology cost estimates available, includes updated gas
price projections and vehicle financing rates, and assumes that consumers value five years of fuel
savings when making vehicle purchase decisions.
Synapse Energy Economics, Inc. Cleaner Cars and Job Creation ES-2
Throughout our analysis, we compared the impact of implementing the vehicle standards for model
years 2017–2025 to a baseline in which the vehicle standards remain fixed at 2016 levels. We evaluated
impacts over the period from 2017 through 2035.
Our primary findings include the following:
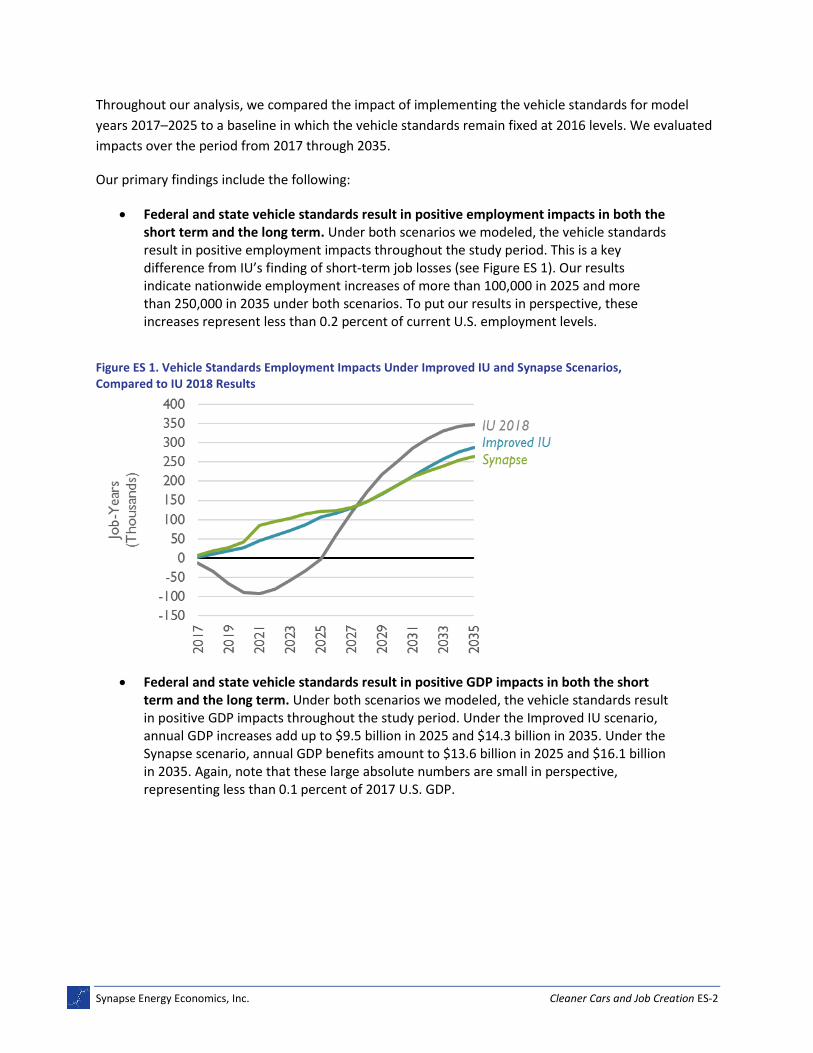
• Federal and state vehicle standards result in positive employment impacts in both the short term and the long term. Under both scenarios we modeled, the vehicle standards result in positive employment impacts throughout the study period. This is a key difference from IU’s finding of short-term job losses (see Figure ES 1). Our results indicate nationwide employment increases of more than 100,000 in 2025 and more than 250,000 in 2035 under both scenarios. To put our results in perspective, these increases represent less than 0.2 percent of current U.S. employment levels.
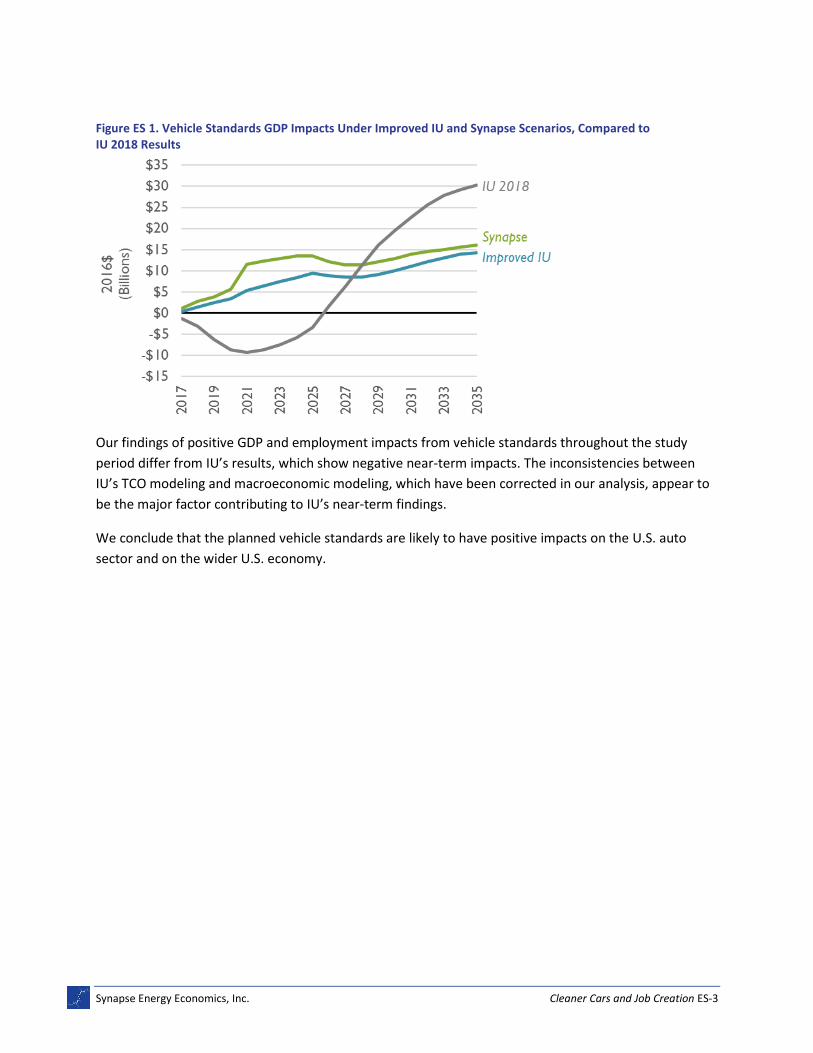
• Federal and state vehicle standards result in positive GDP impacts in both the short term and the long term. Under both scenarios we modeled, the vehicle standards result in positive GDP impacts throughout the study period. Under the Improved IU scenario, annual GDP increases add up to $9.5 billion in 2025 and $14.3 billion in 2035. Under the Synapse scenario, annual GDP benefits amount to $13.6 billion in 2025 and $16.1 billion in 2035. Again, note that these large absolute numbers are small in perspective, representing less than 0.1 percent of 2017 U.S. GDP.
Figure ES 1. Vehicle Standards Employment Impacts Under Improved IU and Synapse Scenarios, Compared to IU 2018 Results
Synapse Energy Economics, Inc. Cleaner Cars and Job Creation ES-3
Our findings of positive GDP and employment impacts from vehicle standards throughout the study
period differ from IU’s results, which show negative near-term impacts. The inconsistencies between
IU’s TCO modeling and macroeconomic modeling, which have been corrected in our analysis, appear to
be the major factor contributing to IU’s near-term findings.
We conclude that the planned vehicle standards are likely to have positive impacts on the U.S. auto
sector and on the wider U.S. economy.
Figure ES 1. Vehicle Standards GDP Impacts Under Improved IU and Synapse Scenarios, Compared to IU 2018 Results
Synapse Energy Economics, Inc. Cleaner Cars and Job Creation 1
1. CONTEXT
The U.S. Environmental Protection Agency (EPA) and National Highway Traffic Safety Administration
(NHTSA) are currently reconsidering federal greenhouse gas and corporate average fuel economy (CAFE)
standards set for light-duty vehicles through model year 2025. As part of this process, EPA and NHTSA
are examining a range of factors, including the potential economic impacts of these standards.1
In March 2017 a group of researchers from Indiana University (IU) released a study, sponsored by the
Alliance of Automobile Manufacturers, examining the aggregate impacts on employment and gross
domestic product (GDP) of federal greenhouse gas and CAFE standards and state zero-emission vehicle
(ZEV) standards.2 The IU report found that these vehicle standards result in long-term economic gains,
but short-term losses. These alleged short-term losses have been used as an argument for delaying or
weakening federal vehicle standards.3
A previous Synapse Energy Economics (Synapse) report identified implausible inputs in the IU report
that biased its results against vehicle standards.4 In this report, we discuss the findings of Synapse’s own
modeling of the state and federal vehicle standards. Our analysis began with the same general modeling
framework and input assumptions used in the IU study. In the process of examining IU’s analysis, we
discovered two errors; these were subsequently corrected by the IU study authors.5 Our work is based
on IU’s revised analysis, which corrected for those two errors. However, IU’s corrected version of its
modeling did not address all inconsistencies. We corrected for these remaining inconsistencies in our
“Improved IU” scenario, while holding all other IU assumptions the same. Finally, we adjusted certain
key assumptions to be consistent with the latest federal government projections of vehicle standard
compliance costs, gasoline prices, and related parameters, resulting in our “Synapse” scenario.
Under both modeled scenarios we found that the vehicle standards have employment and GDP impacts
that are positive throughout the forecast period and grow more favorable over time. We find that the
1 U.S. Environmental Protection Agency. Midterm Evaluation of Light-Duty Vehicle Greenhouse Gas Emissions Standards for
Model Years 2022-2025. https://www.epa.gov/regulations-emissions-vehicles-and-engines/midterm-evaluation-light-duty-vehicle-greenhouse-gas.
2 Carley, Sanya, Denvil Duncan, John D. Graham, Saba Siddiki, and Nikolaos Zirogiannis. March 2017. A Macroeconomic Study of
Federal and State Automotive Regulations. [Hereinafter “IU Report”]
3 IU Report, p. 147; King, Danny. 2017. “Automakers say CAFE compliance will cost jobs and make cars more expensive.”
https://www.autoblog.com/2017/03/10/automakers-cafe-compliance-report/.
4 Ackerman, Frank. October 2017. Evaluating the Economics of Vehicle Standards: A Critical Review of a Leading Study.
5 Both errors biased the original IU report’s results against the vehicle standards. In one error, the IU authors mistakenly used a
set of regulatory compliance costs that were higher than intended. In the other, the IU analysis substantially under-counted fuel savings from more fuel-efficient light trucks. See IU SPEA. January 2018. COMET Corrected. https://spea.indiana.edu/doc/research/working-groups/comet-022018.pdf; IU SPEA. February 2018. COMET Corrected. https://spea.indiana.edu/doc/research/working-groups/comet-022018.pdf
Synapse Energy Economics, Inc. Cleaner Cars and Job Creation 2
positive impacts of the vehicle standards on the auto sector and on consumer fuel savings outweigh
negative impacts of reduced spending in the petroleum sector.
2. TOTAL COST OF OWNERSHIP MODELING
Following IU’s method, we used two separate models to evaluate the impacts of the vehicle standards: a
total cost of ownership (TCO) model to assess impacts on vehicle sales; and a macroeconomic model to
analyze employment and GDP impacts. Using these models in combination, we evaluated two scenarios:
(1) an “Improved IU” scenario, which makes use of the assumptions from IU’s 2016 COMET scenario (as
revised in 2018), with corrections to observed analytical inconsistencies;6 and (2) a “Synapse” scenario
that uses alternative input assumptions derived from recent federal government sources. Essentially,
the Improved IU scenario indicates how IU’s macroeconomic results might change had IU incorporated
its own TCO calculations and assumptions into its macroeconomic modeling. The Synapse scenario
demonstrates how the results of both the TCO analysis and the macroeconomic modeling change when
using alternative assumptions about technology costs, fuel prices, financing costs, and consumer
valuation of fuel savings.
The TCO model evaluates the impact of the vehicle standards on vehicle sales. This relationship depends
on two factors: the perceived total incremental cost of a new standards-compliant vehicle relative to a
baseline vehicle, and the responsiveness of demand for new vehicles to changes in perceived cost.
2.1. TCO Inputs
Our initial TCO modeling made use of the same set of inputs and structure as IU used in its 2016 COMET
Scenario. We evaluated the effects of the vehicle standards on sales of cars and light trucks from 2017
through 2035, matching IU’s framework.7 All impacts were measured relative to a baseline of
compliance with the 2016 vehicle standards. For the Improved IU scenario, our TCO modeling
assumptions were identical to those used in IU’s revised COMET modeling. Key assumptions for this
scenario include:
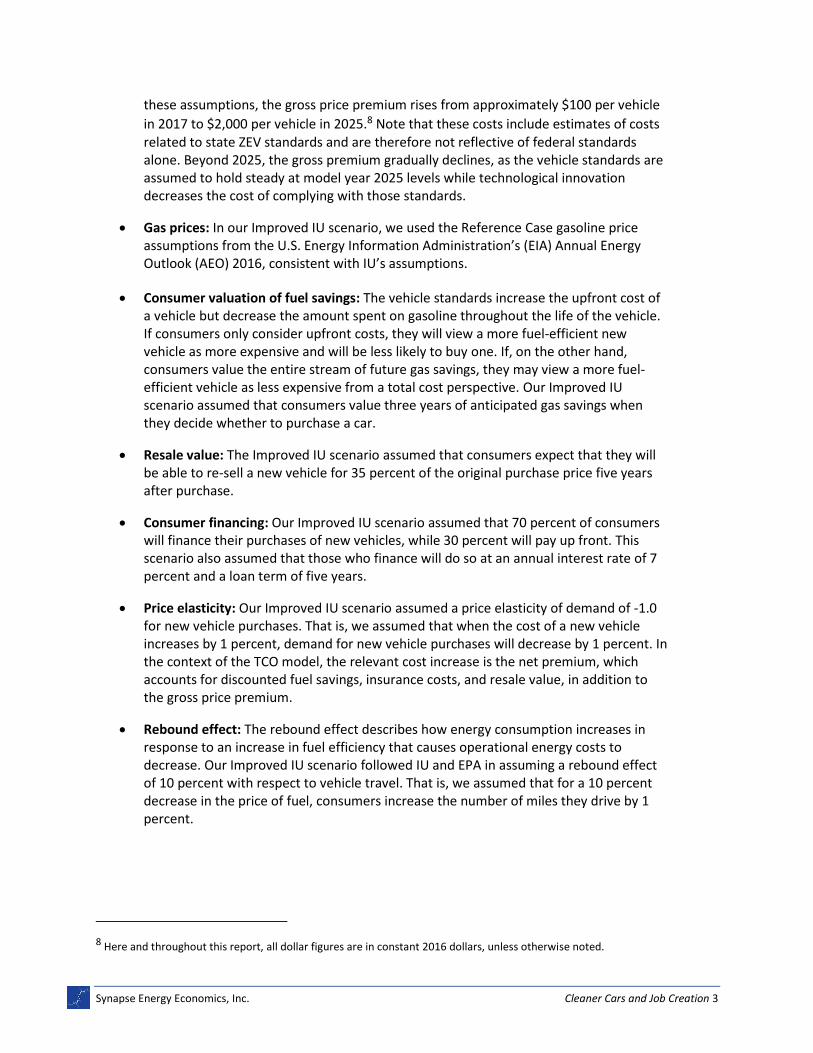
• Gross price premium: This represents the average, per-vehicle, incremental cost of a vehicle that complies with the vehicle standards for a given model year, relative to the baseline of a vehicle that complies with the 2016 vehicle standards. For our Improved IU scenario, we used the gross price premium from IU’s 2016 COMET scenario. Under
6 The IU report included several different scenarios. We selected the COMET 2016 scenario as our point of departure both
because it was the only scenario that incorporated IU’s own updated compliance cost modeling and because it was the IU scenario that resulted in the most pessimistic set of economic impacts.
7 Of course, 2017 is now a past year with historical data; we maintain the focus of analysis on 2017–2035 for compatibility and
comparability to the IU study, which was initially performed in 2016–2017.
Synapse Energy Economics, Inc. Cleaner Cars and Job Creation 3
these assumptions, the gross price premium rises from approximately $100 per vehicle
in 2017 to $2,000 per vehicle in 2025.8 Note that these costs include estimates of costs related to state ZEV standards and are therefore not reflective of federal standards alone. Beyond 2025, the gross premium gradually declines, as the vehicle standards are assumed to hold steady at model year 2025 levels while technological innovation decreases the cost of complying with those standards.
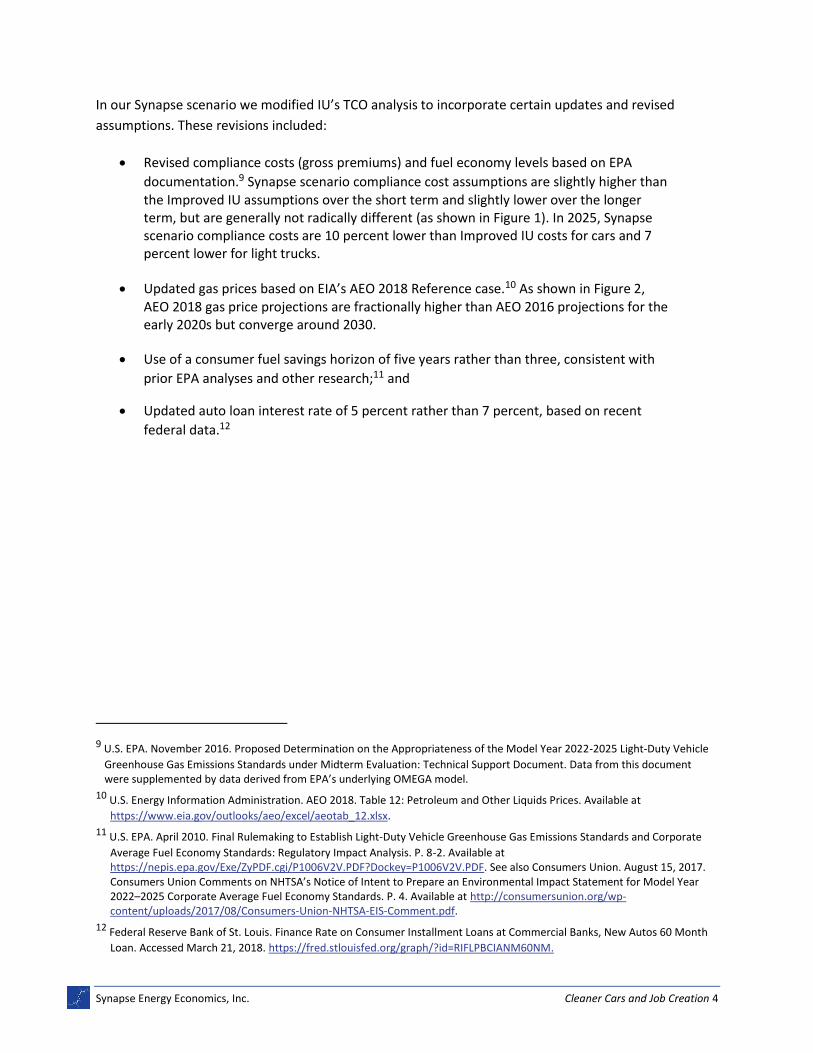
• Gas prices: In our Improved IU scenario, we used the Reference Case gasoline price assumptions from the U.S. Energy Information Administration’s (EIA) Annual Energy Outlook (AEO) 2016, consistent with IU’s assumptions.
• Consumer valuation of fuel savings: The vehicle standards increase the upfront cost of a vehicle but decrease the amount spent on gasoline throughout the life of the vehicle. If consumers only consider upfront costs, they will view a more fuel-efficient new vehicle as more expensive and will be less likely to buy one. If, on the other hand, consumers value the entire stream of future gas savings, they may view a more fuel-efficient vehicle as less expensive from a total cost perspective. Our Improved IU scenario assumed that consumers value three years of anticipated gas savings when they decide whether to purchase a car.
• Resale value: The Improved IU scenario assumed that consumers expect that they will be able to re-sell a new vehicle for 35 percent of the original purchase price five years after purchase.
• Consumer financing: Our Improved IU scenario assumed that 70 percent of consumers will finance their purchases of new vehicles, while 30 percent will pay up front. This scenario also assumed that those who finance will do so at an annual interest rate of 7 percent and a loan term of five years.
• Price elasticity: Our Improved IU scenario assumed a price elasticity of demand of -1.0 for new vehicle purchases. That is, we assumed that when the cost of a new vehicle increases by 1 percent, demand for new vehicle purchases will decrease by 1 percent. In the context of the TCO model, the relevant cost increase is the net premium, which accounts for discounted fuel savings, insurance costs, and resale value, in addition to the gross price premium.
• Rebound effect: The rebound effect describes how energy consumption increases in response to an increase in fuel efficiency that causes operational energy costs to decrease. Our Improved IU scenario followed IU and EPA in assuming a rebound effect of 10 percent with respect to vehicle travel. That is, we assumed that for a 10 percent decrease in the price of fuel, consumers increase the number of miles they drive by 1 percent.
8 Here and throughout this report, all dollar figures are in constant 2016 dollars, unless otherwise noted.
Synapse Energy Economics, Inc. Cleaner Cars and Job Creation 4
In our Synapse scenario we modified IU’s TCO analysis to incorporate certain updates and revised
assumptions. These revisions included:
• Revised compliance costs (gross premiums) and fuel economy levels based on EPA
documentation.9 Synapse scenario compliance cost assumptions are slightly higher than the Improved IU assumptions over the short term and slightly lower over the longer term, but are generally not radically different (as shown in Figure 1). In 2025, Synapse scenario compliance costs are 10 percent lower than Improved IU costs for cars and 7 percent lower for light trucks.
• Updated gas prices based on EIA’s AEO 2018 Reference case.10 As shown in Figure 2, AEO 2018 gas price projections are fractionally higher than AEO 2016 projections for the early 2020s but converge around 2030.
• Use of a consumer fuel savings horizon of five years rather than three, consistent with
prior EPA analyses and other research;11 and
• Updated auto loan interest rate of 5 percent rather than 7 percent, based on recent
federal data.12
9 U.S. EPA. November 2016. Proposed Determination on the Appropriateness of the Model Year 2022-2025 Light-Duty Vehicle
Greenhouse Gas Emissions Standards under Midterm Evaluation: Technical Support Document. Data from this document were supplemented by data derived from EPA’s underlying OMEGA model.
10 U.S. Energy Information Administration. AEO 2018. Table 12: Petroleum and Other Liquids Prices. Available at
https://www.eia.gov/outlooks/aeo/excel/aeotab_12.xlsx.
11 U.S. EPA. April 2010. Final Rulemaking to Establish Light-Duty Vehicle Greenhouse Gas Emissions Standards and Corporate
Average Fuel Economy Standards: Regulatory Impact Analysis. P. 8-2. Available at https://nepis.epa.gov/Exe/ZyPDF.cgi/P1006V2V.PDF?Dockey=P1006V2V.PDF. See also Consumers Union. August 15, 2017. Consumers Union Comments on NHTSA’s Notice of Intent to Prepare an Environmental Impact Statement for Model Year 2022–2025 Corporate Average Fuel Economy Standards. P. 4. Available at http://consumersunion.org/wp-content/uploads/2017/08/Consumers-Union-NHTSA-EIS-Comment.pdf.
12 Federal Reserve Bank of St. Louis. Finance Rate on Consumer Installment Loans at Commercial Banks, New Autos 60 Month
Loan. Accessed March 21, 2018. https://fred.stlouisfed.org/graph/?id=RIFLPBCIANM60NM.
Synapse Energy Economics, Inc. Cleaner Cars and Job Creation 5
Figure 1. Car Gross Price Premiums Under Improved IU and Synapse Scenarios
Figure 2. Gas Prices Under Improved IU and Synapse Scenarios
Other than these modifications, our Synapse scenario maintained the same set of assumptions as those
used in IU’s 2016 COMET scenario and our Improved IU scenario. Table 1 summarizes the key TCO
assumptions across the Improved IU and Synapse scenarios.
Synapse Energy Economics, Inc. Cleaner Cars and Job Creation 6
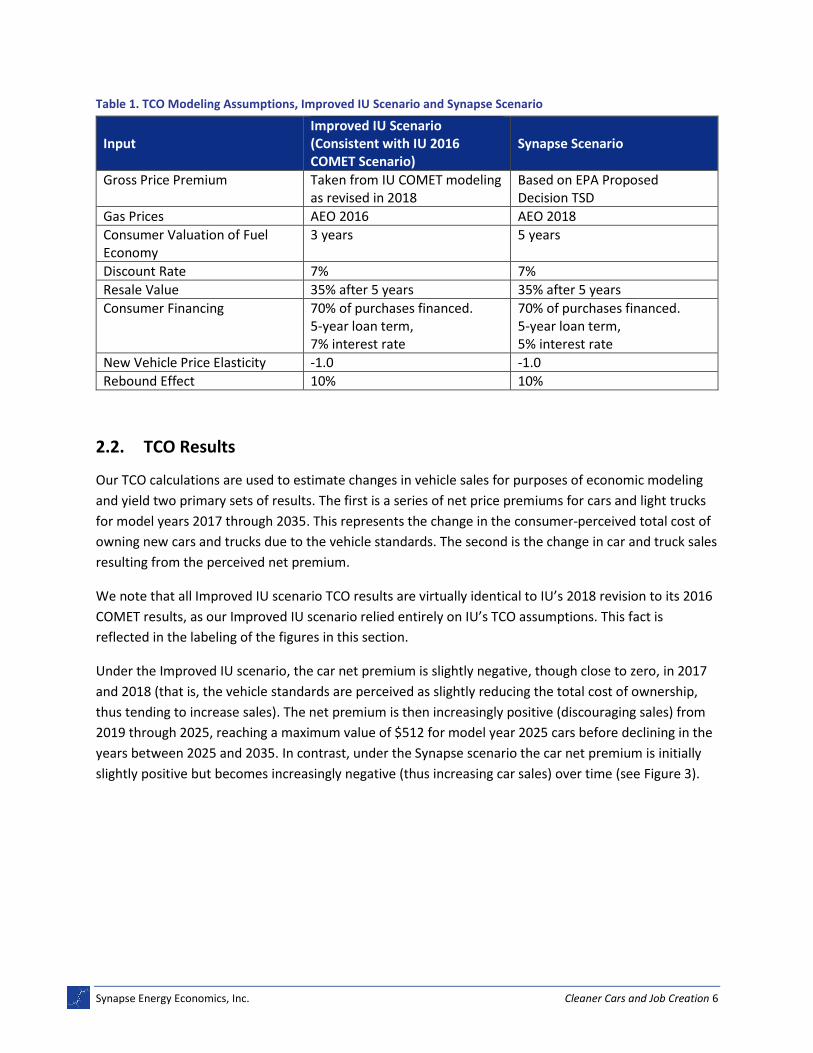
Table 1. TCO Modeling Assumptions, Improved IU Scenario and Synapse Scenario
Input Improved IU Scenario (Consistent with IU 2016 COMET Scenario)
Synapse Scenario
Gross Price Premium Taken from IU COMET modeling as revised in 2018
Based on EPA Proposed Decision TSD
Gas Prices AEO 2016 AEO 2018
Consumer Valuation of Fuel Economy
3 years 5 years
Discount Rate 7% 7%
Resale Value 35% after 5 years 35% after 5 years
Consumer Financing
70% of purchases financed. 5-year loan term, 7% interest rate
70% of purchases financed. 5-year loan term, 5% interest rate
New Vehicle Price Elasticity -1.0 -1.0
Rebound Effect 10% 10%
2.2. TCO Results
Our TCO calculations are used to estimate changes in vehicle sales for purposes of economic modeling
and yield two primary sets of results. The first is a series of net price premiums for cars and light trucks
for model years 2017 through 2035. This represents the change in the consumer-perceived total cost of
owning new cars and trucks due to the vehicle standards. The second is the change in car and truck sales
resulting from the perceived net premium.
We note that all Improved IU scenario TCO results are virtually identical to IU’s 2018 revision to its 2016
COMET results, as our Improved IU scenario relied entirely on IU’s TCO assumptions. This fact is
reflected in the labeling of the figures in this section.
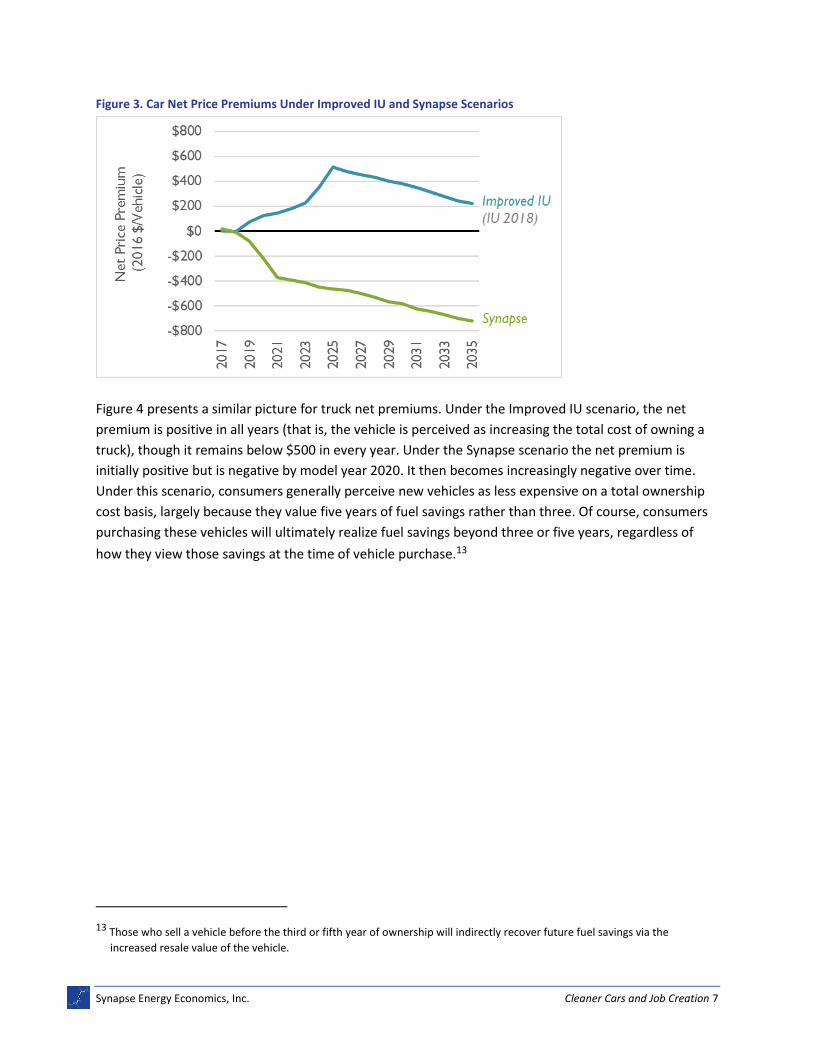
Under the Improved IU scenario, the car net premium is slightly negative, though close to zero, in 2017
and 2018 (that is, the vehicle standards are perceived as slightly reducing the total cost of ownership,
thus tending to increase sales). The net premium is then increasingly positive (discouraging sales) from
2019 through 2025, reaching a maximum value of $512 for model year 2025 cars before declining in the
years between 2025 and 2035. In contrast, under the Synapse scenario the car net premium is initially
slightly positive but becomes increasingly negative (thus increasing car sales) over time (see Figure 3).
Synapse Energy Economics, Inc. Cleaner Cars and Job Creation 7
Figure 3. Car Net Price Premiums Under Improved IU and Synapse Scenarios
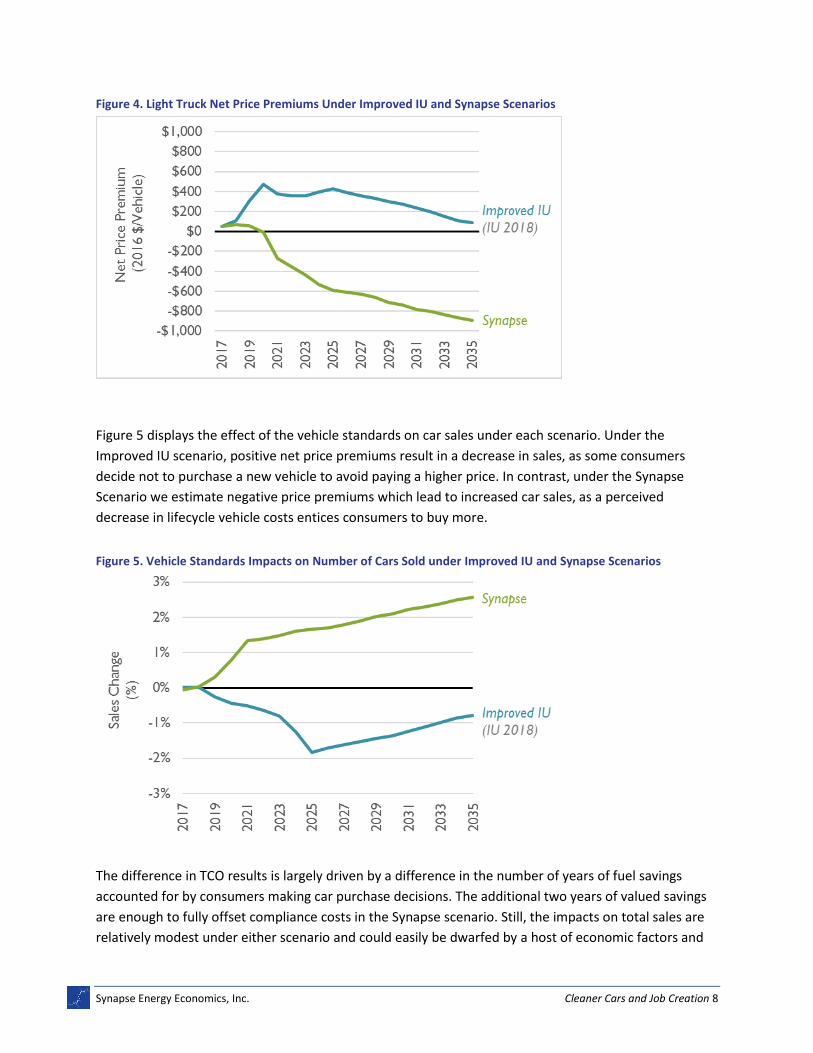
Figure 4 presents a similar picture for truck net premiums. Under the Improved IU scenario, the net
premium is positive in all years (that is, the vehicle is perceived as increasing the total cost of owning a
truck), though it remains below $500 in every year. Under the Synapse scenario the net premium is
initially positive but is negative by model year 2020. It then becomes increasingly negative over time.
Under this scenario, consumers generally perceive new vehicles as less expensive on a total ownership
cost basis, largely because they value five years of fuel savings rather than three. Of course, consumers
purchasing these vehicles will ultimately realize fuel savings beyond three or five years, regardless of
how they view those savings at the time of vehicle purchase.13
13 Those who sell a vehicle before the third or fifth year of ownership will indirectly recover future fuel savings via the
increased resale value of the vehicle.
Synapse Energy Economics, Inc. Cleaner Cars and Job Creation 8
Figure 4. Light Truck Net Price Premiums Under Improved IU and Synapse Scenarios
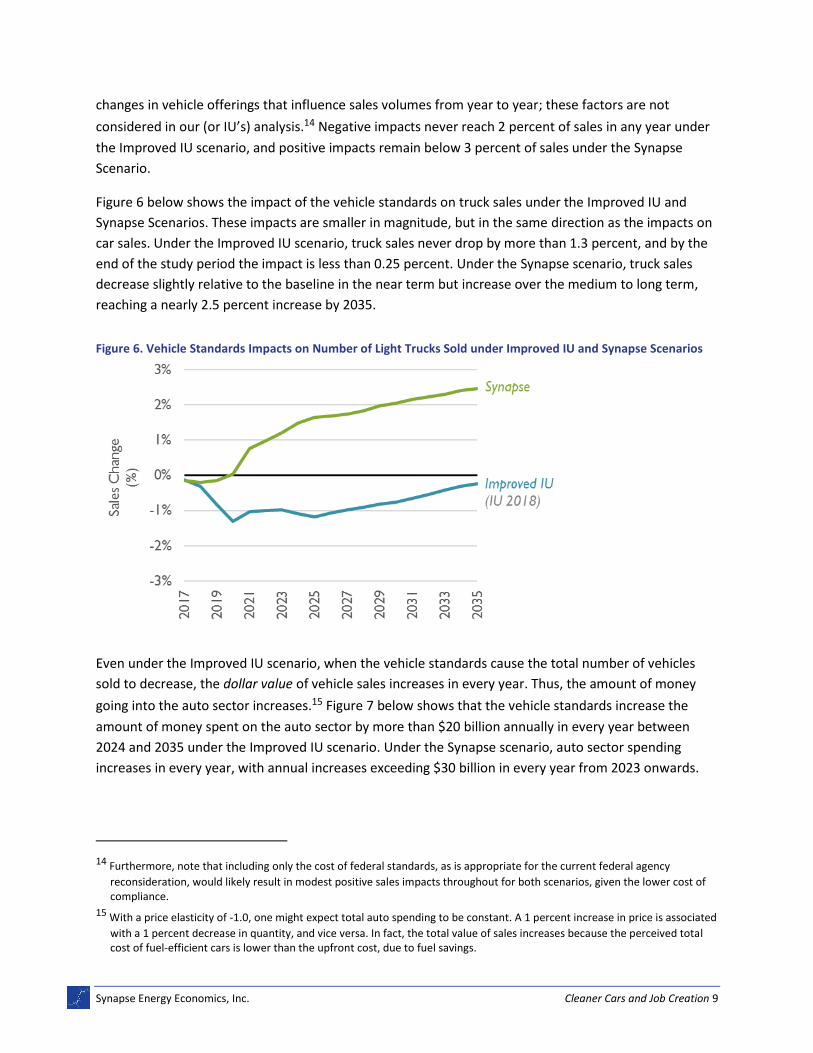
Figure 5 displays the effect of the vehicle standards on car sales under each scenario. Under the
Improved IU scenario, positive net price premiums result in a decrease in sales, as some consumers
decide not to purchase a new vehicle to avoid paying a higher price. In contrast, under the Synapse
Scenario we estimate negative price premiums which lead to increased car sales, as a perceived
decrease in lifecycle vehicle costs entices consumers to buy more.
Figure 5. Vehicle Standards Impacts on Number of Cars Sold under Improved IU and Synapse Scenarios
The difference in TCO results is largely driven by a difference in the number of years of fuel savings
accounted for by consumers making car purchase decisions. The additional two years of valued savings
are enough to fully offset compliance costs in the Synapse scenario. Still, the impacts on total sales are
relatively modest under either scenario and could easily be dwarfed by a host of economic factors and
Synapse Energy Economics, Inc. Cleaner Cars and Job Creation 9
changes in vehicle offerings that influence sales volumes from year to year; these factors are not
considered in our (or IU’s) analysis.14 Negative impacts never reach 2 percent of sales in any year under
the Improved IU scenario, and positive impacts remain below 3 percent of sales under the Synapse
Scenario.
Figure 6 below shows the impact of the vehicle standards on truck sales under the Improved IU and
Synapse Scenarios. These impacts are smaller in magnitude, but in the same direction as the impacts on
car sales. Under the Improved IU scenario, truck sales never drop by more than 1.3 percent, and by the
end of the study period the impact is less than 0.25 percent. Under the Synapse scenario, truck sales
decrease slightly relative to the baseline in the near term but increase over the medium to long term,
reaching a nearly 2.5 percent increase by 2035.
Figure 6. Vehicle Standards Impacts on Number of Light Trucks Sold under Improved IU and Synapse Scenarios
Even under the Improved IU scenario, when the vehicle standards cause the total number of vehicles
sold to decrease, the dollar value of vehicle sales increases in every year. Thus, the amount of money
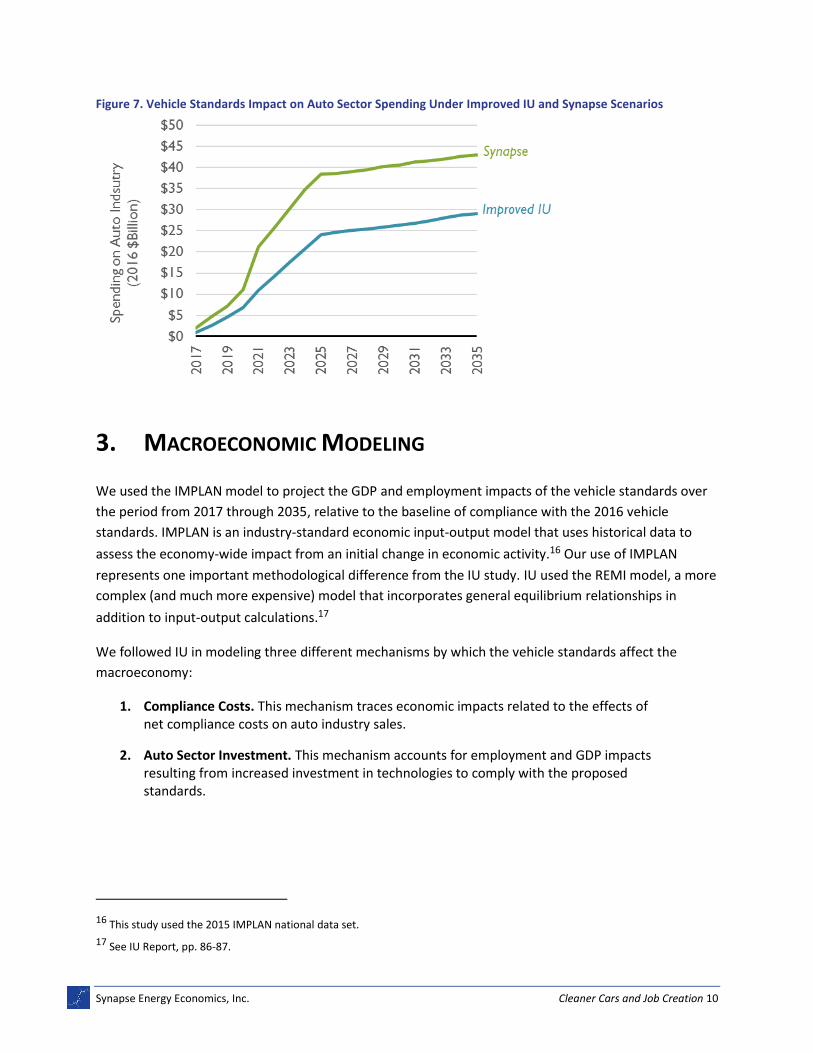
going into the auto sector increases.15 Figure 7 below shows that the vehicle standards increase the
amount of money spent on the auto sector by more than $20 billion annually in every year between
2024 and 2035 under the Improved IU scenario. Under the Synapse scenario, auto sector spending
increases in every year, with annual increases exceeding $30 billion in every year from 2023 onwards.
14 Furthermore, note that including only the cost of federal standards, as is appropriate for the current federal agency
reconsideration, would likely result in modest positive sales impacts throughout for both scenarios, given the lower cost of compliance.
15 With a price elasticity of -1.0, one might expect total auto spending to be constant. A 1 percent increase in price is associated
with a 1 percent decrease in quantity, and vice versa. In fact, the total value of sales increases because the perceived total cost of fuel-efficient cars is lower than the upfront cost, due to fuel savings.
Synapse Energy Economics, Inc. Cleaner Cars and Job Creation 10
Figure 7. Vehicle Standards Impact on Auto Sector Spending Under Improved IU and Synapse Scenarios
3. MACROECONOMIC MODELING
We used the IMPLAN model to project the GDP and employment impacts of the vehicle standards over
the period from 2017 through 2035, relative to the baseline of compliance with the 2016 vehicle
standards. IMPLAN is an industry-standard economic input-output model that uses historical data to
assess the economy-wide impact from an initial change in economic activity.16 Our use of IMPLAN
represents one important methodological difference from the IU study. IU used the REMI model, a more
complex (and much more expensive) model that incorporates general equilibrium relationships in
addition to input-output calculations.17
We followed IU in modeling three different mechanisms by which the vehicle standards affect the
macroeconomy:
1. Compliance Costs. This mechanism traces economic impacts related to the effects of net compliance costs on auto industry sales.
2. Auto Sector Investment. This mechanism accounts for employment and GDP impacts resulting from increased investment in technologies to comply with the proposed standards.
16 This study used the 2015 IMPLAN national data set.
17 See IU Report, pp. 86-87.
Synapse Energy Economics, Inc. Cleaner Cars and Job Creation 11
3. Fuel Spending Impacts. This mechanism traces the impacts of reductions in fuel expenditures due to increased fuel economy levels, and the re-spending of most of the resulting consumer savings.
Within each mechanism, we accounted for three different types of economic impacts:
• Direct impacts. These are changes in employment and GDP in sectors immediately impacted by the vehicle regulations. For example, these include changes in employment in the auto manufacturing sector resulting from the need to incorporate additional fuel-saving technologies in future cars.
• Indirect impacts. These are changes in employment and GDP within industries that serve as suppliers to the directly affected industries. For example, these include effects on the steel industry and other suppliers to the auto industry.
• Induced impacts. These are changes in employment and GDP associated with shifts in consumer spending in the wider economy. Induced effects arise when consumers re-spend most of their fuel savings resulting from the use of more fuel-efficient vehicles. Induced effects also result from changes in consumer spending by employees in directly and indirectly impacted industries who have more (or less) disposable income.
Under our modeling framework, every direct impact is offset to at least some degree by an induced
impact that goes in the opposite direction. If the vehicle standards result in decreased spending on the
petroleum industry, they also result in increased spending on other industries, as consumers re-spend
their gas savings elsewhere. Similarly, if the vehicle standards result in increased spending on the auto
industry, consumers have less money left to spend on other industries.18
3.1. IMPLAN Modeling Inputs
Many inputs to our IMPLAN modeling were the same as those used in our TCO analysis. In each of our
scenarios, we used the same assumptions for gross price premiums, consumer financing, gas prices,
price elasticity, and other relevant parameters across both models. In addition, we used the percentage
changes in car and truck sales as calculated in the TCO model to determine the change in spending on
the auto sector within our IMPLAN modeling. We similarly used TCO calculations to determine changes
in spending on gasoline for the IMPLAN analysis.
Synchronization of inputs and outputs across our TCO and macroeconomic modeling is a critical
difference between our analysis and the IU study. The IU authors discarded many of the assumptions
from their TCO model, substituting less appropriate assumptions in their macroeconomic modeling.
Most importantly, IU’s macroeconomic modeling assumed that consumers do not value any future fuel
18 We note that the IU study explicitly accounted for impacts from consumer re-spending of fuel savings, but it is not clear to us
whether the IU study accounted for re-spending impacts associated with changes in spending on the auto industry.
Synapse Energy Economics, Inc. Cleaner Cars and Job Creation 12
savings at the time of vehicle purchase, respond to changes in vehicle price with an elasticity of -1.65
rather than -1.0, and never finance their vehicle purchases.19
Other key inputs to our macroeconomic modeling include:
• Allocation of auto sector spending across IMPLAN industries: We allocated changes in spending on the auto sector in a manner consistent with the IU study’s assumptions. Like IU, we assumed that about 8 percent of spending on vehicle standards compliance for new gasoline-powered vehicles goes directly to auto industry labor, 32 percent goes to materials and parts, 39 percent goes to overhead, 10 percent goes to dealers, 7
percent goes to shareholders, and 4 percent goes to research and development.20
• Allocation of re-spending: We followed IU in assuming that 80 percent of new vehicles are purchased by households, 19 percent are purchased for corporate fleets, and 1
percent are purchased for government fleets.21
• Consumer savings rates: We relied on data from the U.S. Bureau of Labor Statistics Consumer Expenditure survey to calculate an average savings rate for purchasers of new
vehicles.22 Based on this data, we assumed a savings rate of 14.6 percent for households purchasing new cars. That is, we assumed that when a household with a new standards-compliant vehicle saves $100 on gas expenditures, it will re-spend $85.40 on other consumer expenditures. The rest will go into a savings account, where it is not immediately recycled into the wider economy.
• Industry import fractions: Generally, we relied on IMPLAN’s calculations of local purchase percentages to determine the percentage of purchases from a given industry that go to imports. For example, IMPLAN assumes that about 75 percent of American spending on automobile manufacturing goes to American facilities, while 25 percent goes to imports. We assumed that this same local spending percentages applies to ancillary industry categories, such as management of automobile companies.
3.2. IMPLAN Modeling Results
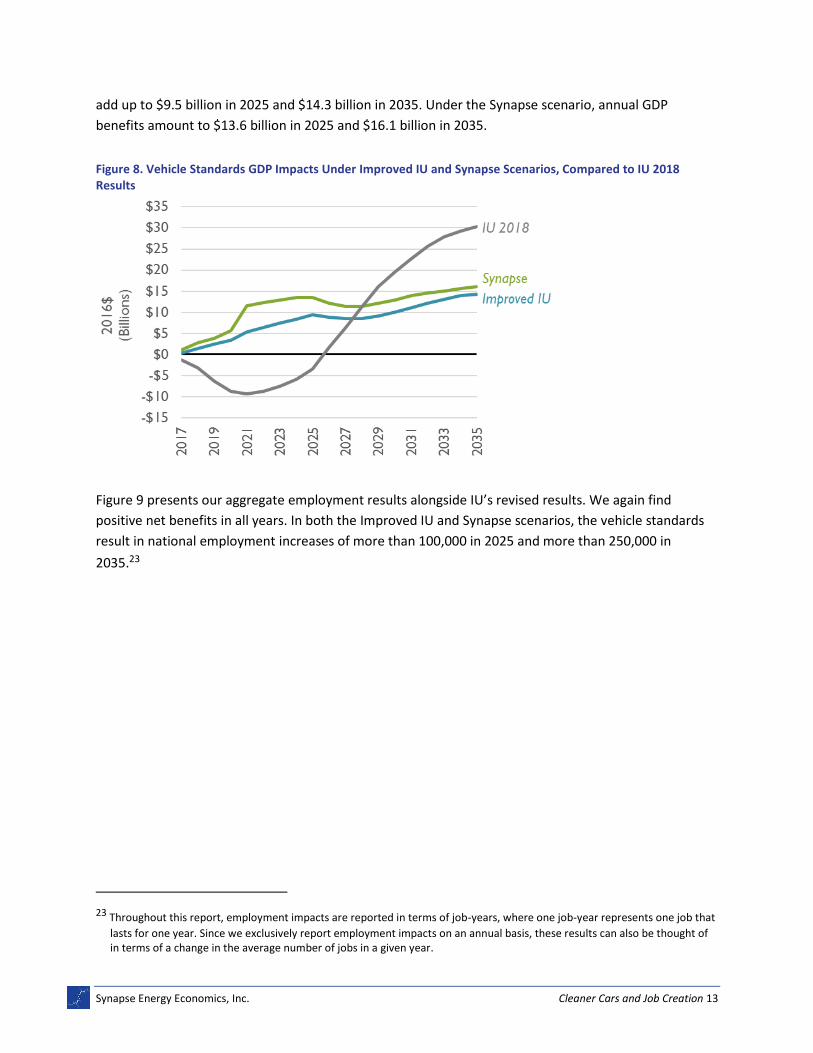
Figure 8 summarizes the GDP results of our macroeconomic modeling, in comparison to IU’s results. We
found that, under both the Improved IU and Synapse Scenarios, the existing 2017-2025 state and federal
vehicle standards result in increased U.S. GDP in all years of our study period. This is a notable difference
from IU’s finding of near-term negative impacts. Under the Improved IU scenario, annual GDP increases
19 IU Report, p. 124.
20 See IU Report, p. 168. IMPLAN industries used to represent these categories include “Scientific research and development
services,” “Management of companies and enterprises,” “Automobile manufacturing,” “Light truck and utility vehicle manufacturing,” “Labor Income,” “Proprietor Income,” and “Retail - Motor vehicle and parts dealers.”
21 IU Report, pp. 87-88.
22 U.S. Bureau of Labor Statistics. Consumer Expenditure Survey. https://www.bls.gov/cex/tables.htm#avgexp.
Synapse Energy Economics, Inc. Cleaner Cars and Job Creation 13
add up to $9.5 billion in 2025 and $14.3 billion in 2035. Under the Synapse scenario, annual GDP
benefits amount to $13.6 billion in 2025 and $16.1 billion in 2035.
Figure 8. Vehicle Standards GDP Impacts Under Improved IU and Synapse Scenarios, Compared to IU 2018 Results
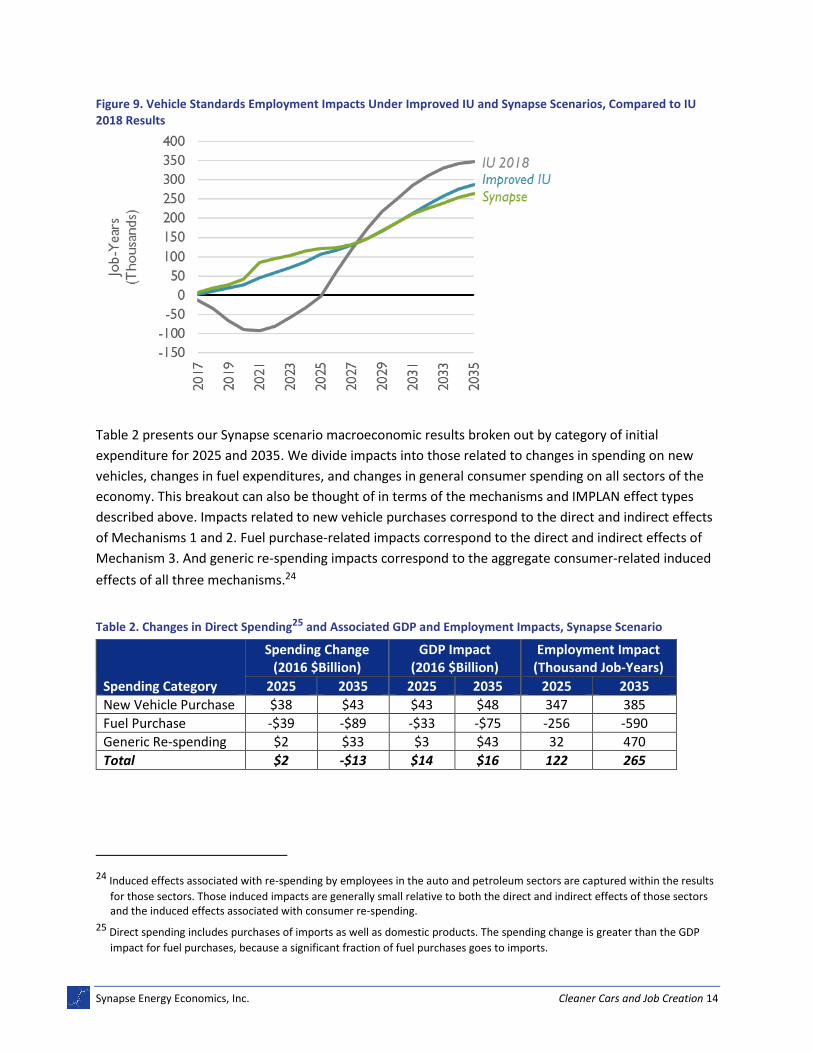
Figure 9 presents our aggregate employment results alongside IU’s revised results. We again find
positive net benefits in all years. In both the Improved IU and Synapse scenarios, the vehicle standards
result in national employment increases of more than 100,000 in 2025 and more than 250,000 in
2035.23
23 Throughout this report, employment impacts are reported in terms of job-years, where one job-year represents one job that
lasts for one year. Since we exclusively report employment impacts on an annual basis, these results can also be thought of in terms of a change in the average number of jobs in a given year.
Synapse Energy Economics, Inc. Cleaner Cars and Job Creation 14
Figure 9. Vehicle Standards Employment Impacts Under Improved IU and Synapse Scenarios, Compared to IU 2018 Results
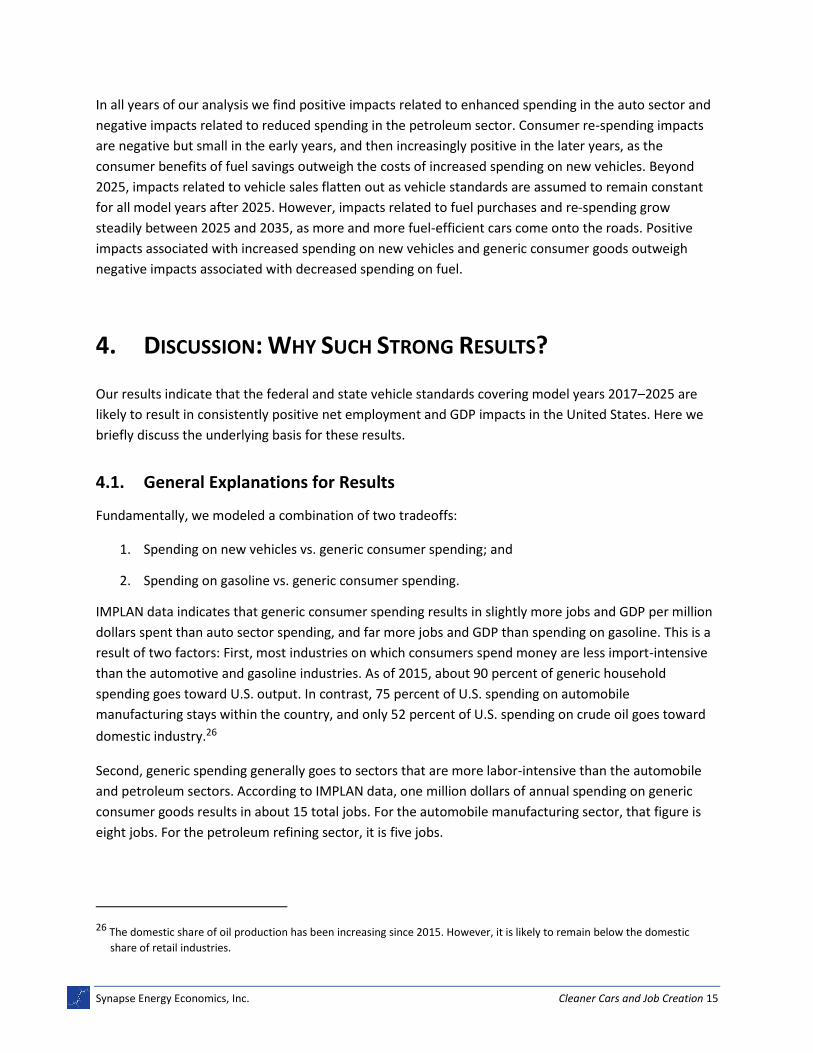
Table 2 presents our Synapse scenario macroeconomic results broken out by category of initial
expenditure for 2025 and 2035. We divide impacts into those related to changes in spending on new
vehicles, changes in fuel expenditures, and changes in general consumer spending on all sectors of the
economy. This breakout can also be thought of in terms of the mechanisms and IMPLAN effect types
described above. Impacts related to new vehicle purchases correspond to the direct and indirect effects
of Mechanisms 1 and 2. Fuel purchase-related impacts correspond to the direct and indirect effects of
Mechanism 3. And generic re-spending impacts correspond to the aggregate consumer-related induced
effects of all three mechanisms.24
Table 2. Changes in Direct Spending25 and Associated GDP and Employment Impacts, Synapse Scenario
Spending Category
Spending Change (2016 $Billion)
GDP Impact (2016 $Billion)
Employment Impact (Thousand Job-Years)
2025 2035 2025 2035 2025 2035
New Vehicle Purchase $38 $43 $43 $48 347 385
Fuel Purchase -$39 -$89 -$33 -$75 -256 -590
Generic Re-spending $2 $33 $3 $43 32 470
Total $2 -$13 $14 $16 122 265
24 Induced effects associated with re-spending by employees in the auto and petroleum sectors are captured within the results
for those sectors. Those induced impacts are generally small relative to both the direct and indirect effects of those sectors and the induced effects associated with consumer re-spending.
25 Direct spending includes purchases of imports as well as domestic products. The spending change is greater than the GDP
impact for fuel purchases, because a significant fraction of fuel purchases goes to imports.
Synapse Energy Economics, Inc. Cleaner Cars and Job Creation 15
In all years of our analysis we find positive impacts related to enhanced spending in the auto sector and
negative impacts related to reduced spending in the petroleum sector. Consumer re-spending impacts
are negative but small in the early years, and then increasingly positive in the later years, as the
consumer benefits of fuel savings outweigh the costs of increased spending on new vehicles. Beyond
2025, impacts related to vehicle sales flatten out as vehicle standards are assumed to remain constant
for all model years after 2025. However, impacts related to fuel purchases and re-spending grow
steadily between 2025 and 2035, as more and more fuel-efficient cars come onto the roads. Positive
impacts associated with increased spending on new vehicles and generic consumer goods outweigh
negative impacts associated with decreased spending on fuel.
4. DISCUSSION: WHY SUCH STRONG RESULTS?
Our results indicate that the federal and state vehicle standards covering model years 2017–2025 are
likely to result in consistently positive net employment and GDP impacts in the United States. Here we
briefly discuss the underlying basis for these results.
4.1. General Explanations for Results
Fundamentally, we modeled a combination of two tradeoffs:
1. Spending on new vehicles vs. generic consumer spending; and
2. Spending on gasoline vs. generic consumer spending.
IMPLAN data indicates that generic consumer spending results in slightly more jobs and GDP per million
dollars spent than auto sector spending, and far more jobs and GDP than spending on gasoline. This is a
result of two factors: First, most industries on which consumers spend money are less import-intensive
than the automotive and gasoline industries. As of 2015, about 90 percent of generic household
spending goes toward U.S. output. In contrast, 75 percent of U.S. spending on automobile
manufacturing stays within the country, and only 52 percent of U.S. spending on crude oil goes toward
domestic industry.26
Second, generic spending generally goes to sectors that are more labor-intensive than the automobile
and petroleum sectors. According to IMPLAN data, one million dollars of annual spending on generic
consumer goods results in about 15 total jobs. For the automobile manufacturing sector, that figure is
eight jobs. For the petroleum refining sector, it is five jobs.
26 The domestic share of oil production has been increasing since 2015. However, it is likely to remain below the domestic
share of retail industries.
Synapse Energy Economics, Inc. Cleaner Cars and Job Creation 16
Of course, part of the spending on automobiles and gasoline goes to entirely local and relatively labor-
intensive retail dealerships and gas stations. Nonetheless, the aggregate impacts of spending on gasoline
remain far lower than those from generic spending.
Thus, we find that total employment and GDP impacts are relatively insensitive to modest increases or
decreases in spending on new vehicles. However, gasoline savings—moving dollars from the gasoline
pump to generic consumer spending—are sure to cause net job creation. Increases in the number of
new, fuel-efficient vehicles that are purchased, and in the fuel savings per new vehicle, lead to better
macroeconomic outcomes.
4.2. Comparison to IU Results
The main high-level difference between our results and those reported in the IU study is that IU found
that the vehicle standards are likely to result in negative near-term impacts (even in its 2018 updates),
while we find positive impacts in both the near term and the long term. This is in part because the IU
report found that the vehicle standards would have negative impacts on the auto sector, whereas both
of our scenarios indicate positive impacts on the auto sector.
As shown by our Improved IU scenario, parts of IU’s macroeconomic results are contradicted by its TCO
results. That is, if IU believes its own TCO results, it should also believe that the vehicle standards result
in increased spending on the auto sector, and therefore increased economic activity within the auto
sector. The IU study only found negative impacts on the auto sector because it did not make use of its
TCO results in its macroeconomic analysis. Instead, it relied upon alternative, poorly justified
assumptions regarding such critical parameters as the net price premium perceived by consumers and
the price elasticity of demand for new vehicles.
Our Improved IU scenario incorporated two types of corrections to IU’s original 2016 COMET scenario:
First, we corrected for the two calculation errors that IU acknowledged and corrected in its 2018
revisions. Second, we corrected for the methodological error of not incorporating TCO assumptions and
results into macroeconomic modeling. After making these two corrections, we found positive impacts
on the auto sector, and positive net nationwide macroeconomic impacts, in all years.
One point that is relevant to our finding of macroeconomic benefits across all years is that of timing. As
mentioned above, we assume that increased spending on the auto sector is offset by a reduction in
generic consumer spending. However, in keeping with IU’s TCO assumptions, we also assume that most
new vehicle owners finance their vehicle purchases. Thus, while any increased economic activity in the
auto sector happens in the year that a new vehicle is manufactured and sold, negative impacts on
generic consumer spending power are spread across the subsequent five years, as the consumer pays
off the auto loan. So, in the first year of our analysis, increases in auto sector spending outweigh
decreases in generic consumer spending by a factor of about 5 to 1.
The result is that in the early years of our analysis, in which gas savings remain relatively small, positive
auto sector employment impacts outweigh negative impacts on generic spending. In the 2020s, negative
Synapse Energy Economics, Inc. Cleaner Cars and Job Creation 17
generic spending impacts associated with increased automobile expenditures grow to fully offset the
positive impacts of increased auto sector spending.27 But by that time, consumer re-spending of gas
savings from several years’ worth of new fuel-efficient vehicles is sufficient to ensure that aggregate
employment and GDP impacts remain positive. In the later years of our analysis, the positive impacts of
shifting from spending on gasoline to generic consumer spending increasingly dominate our aggregate
results.
5. CONCLUSION
The existing federal and state vehicle standards for model years 2017-2025 are likely to result in positive
net macroeconomic benefits at the national level across all time horizons. Note, however, that the GDP
and employment effects discussed here are not large in the context of the national economy. The
largest of our annual GDP impact results amounts to less than 0.1 percent of 2017 U.S. GDP.28 Our
largest modeled annual employment impacts are less than 0.2 percent of current U.S. employment
levels.29 In addition, our results, like all forecasts, are necessarily uncertain, especially farther out in the
modeling period.
Nonetheless, it is significant that we consistently find positive impacts in all years of both scenarios we
modeled. This is particularly noteworthy given that one of our scenarios involved only a few corrections
to a prior analysis that reported negative near-term impacts. Our findings leave us confident that the
vehicle standards are likely to have modest positive impacts on both the auto sector and the broader
U.S. economy. Fuel economy standards will lead to less spending on fuel; that is the intended result of
such standards. This contributes to energy independence, reduction of greenhouse gas emissions, and
other social goals. But cutbacks in the petroleum sector will be more than offset by gains in the rest of
the economy, ensuring overall growth in employment.
Importantly, this study, like the IU study, focuses exclusively on macroeconomic indicators, and only
examines three core mechanisms by which vehicle standards impact those indicators. This study does
not account for social or economic impacts associated with the public health and environmental
27 Since we assume loan payments are spread over five years, it is in 2021, the fifth year of our analysis, that total annual
consumer vehicle payments begin to add up to payments received by the auto sector.
28 Under the Synapse Scenario, net GDP impacts reach $16 billion in 2035. In 2017, the U.S. GDP was greater than $19 trillion.
See U.S. Bureau of Economic Analysis. National Income and Product Accounts, Gross Domestic Product: Fourth Quarter and Annual 2017. https://www.bea.gov/newsreleases/national/gdp/gdpnewsrelease.htm.
29 Under the Improved IU scenario, employment impacts reach 289,000 in 2035. Total U.S. employment is currently around 155
million. U.S. Bureau of Labor Statistics. Labor Force Statistics from the Current Population Survey. Data as of March 21, 2018. https://data.bls.gov/timeseries/LNS12000000
Synapse Energy Economics, Inc. Cleaner Cars and Job Creation 18
benefits of the vehicle standards. Our findings lead us to conclude that the emission reduction benefits
associated with the vehicle standards can be achieved while strengthening the U.S. economy.