Embed Size (px)
Citation preview

Cleaning validation using thermogravimetry
Jacques Wiss • Jean-Luc Schmuck
Received: 24 August 2010 / Accepted: 27 October 2010 / Published online: 8 December 2010
� Akademiai Kiado, Budapest, Hungary 2010
Abstract The health authorities require that equipment
used in the pharmaceutical industry is clean prior to use. The
main raison is to prevent any contamination of the drug
products. This article demonstrates that thermogravimetry
(TG) can be used for the determination of the residual
impurities during the cleaning validation of the equipment
of pharmaceutical production plants. The accuracy and the
recovery rate of this method are comparable with those of the
classical analysis method (determination of the distillation
residue using a rotary evaporator). The fully automation of
the testing equipment even allows its utilization around the
clock by plants operators, leading to a significant reduction
of the time necessary for the cleaning validation and to an
increase of the plant capacity.
Keywords Thermogravimetry � Cleaning validation �Residual impurities � Pharmaceutical production
Introduction
The health authorities require that equipment used in the
pharmaceutical industry is clean prior to use. The main
raison is to prevent any contamination or adulteration of
the drug products. In the past, a number of products have
been recalled due to cross-contamination. Therefore, the
FDA and other authorities expect firms to have written
general procedures on how cleaning process will be vali-
dated. The aim of this study is to present the techniques
usually used and demonstrate that thermogravimetry (TG)
can be a good replacement for these methods.
Sampling and current analysis techniques
As CFR sect. 211.67 states, ‘‘Equipment and utensils shall
be cleaned, maintained, and sanitized at appropriate inter-
vals to prevent malfunctions or contamination that would
alter the safety, identity, strength, quality, or purity of the
drug product beyond the official or other established
requirements’’ [1]. Cleaning validation should be per-
formed to confirm the effectiveness of a cleaning procedure
[2, 3].
The FDAs guidelines require, ‘‘that the basis of any
limits is scientifically justifiable’’ [4]. Nevertheless,
FDA does not intend to set acceptance specifications or
methods for determining whether a cleaning process is
validated.
An often used acceptance criteria is typically set at
1/1000 reduction of the lowest therapeutic dose of the
previous drug product (active ingredient in most cases) or
the LD50 toxic dose of the cleaning solutions. If the cal-
culated limit is larger than 10 ppm carryover of the residual
contaminants, then the acceptance criteria is set at a more
rigorous 10 ppm (depending on medical opinion and/or
safety considerations).
Sampling methods
There are two general types of sampling. The first is
the direct method of sampling the surface of the
equipment. Another method is to use rinse solutions.
The advantages and drawbacks of these methods are the
following:
J. Wiss (&) � J.-L. Schmuck
Novartis Pharma AG, Chemical and Analytical Development,
Novartis Campus, Building WSJ-145.8.54, 4002 Basel,
Switzerland
e-mail: [email protected]
123
J Therm Anal Calorim (2011) 104:315–321
DOI 10.1007/s10973-010-1144-7
Direct surface sampling
The swab technique typically involves moistening a poly-
ester swab with highly purified water (acidified with
phosphoric acid, if necessary) to wipe a measured area in a
systematic multi-pass way always going from clean to dirty
areas to avoid recontamination (e.g., 10 side-by-side
strokes vertically, 10 horizontally, and 10 each with the flip
side of the swab in each diagonal direction).
Advantages
• Areas hardest to clean and which are reasonably
accessible can be evaluated;
• Residues that are dried out or are insoluble can be
sampled by physical removal.
Disadvantages
• The type of sampling material used (e.g., the adhesive
used in swabs) can interfere with the analysis of the
samples;
• In some cases, the plant needs to be dismounted to
perform the sampling.
Rinse samples
The equipment is washed with water (to remove the inor-
ganic salts) and with organic solvents (usually heated up to
the boiling point to clean the head space of the equipment)
and the final washing solution is analyzed.
Advantages
• A larger surface area may be sampled;
• Inaccessible systems or ones that cannot be routinely
disassembled can be sampled and evaluated.
Disadvantage
• Residues or contaminant may not be soluble or may be
physically occluded in the equipment.
The rinse sampling is a method commonly used in multi-
purpose pilot plants in the pharmaceutical industry: indeed
this method is well adapted for very various and often
unknown contaminants: traces of starting materials, side-
products, salts, traces of product, potentially oil of stirrer
motor, etc.).
Classical techniques for the cleaning validation
Due to the very large variety of possible contaminants,
it is usually very difficult to perform a quantitative
determination of each species; therefore, the global con-
centration of the residual contaminants must be deter-
mined. This concentration must be below the limit defined
in the internal Standard Operation Procedure describing the
cleaning method. Some classical methods for the cleaning
verification are described hereunder:
Distillation residue
A sample of the rinse solution (250–500 mL) is placed in a
glass flask and the solvent is evaporated using a rotary
evaporator. The mass difference between the empty flask
before the test and the same flask after the solvent evapo-
ration (containing the residual contaminants) is used to
calculate the total residues concentration. This technique is
very convenient because all soluble substances are con-
sidered. Nevertheless, its fast implementation right round
the clock is difficult in a pilot plant because the necessary
laboratory personal often does not work over the night.
Moreover, this test cannot easily be carried out by plant
operators who often do not have the qualification to
perform this delicate analytical work (use of a sensitive
laboratory balance, manipulation of the dried flasks
without external contamination, cooling of the flask in a
desiccator).
Total organic carbon (TOC)
This technique for the analysis of aqueous washing solu-
tions is independent of the product and very sensitive [5].
The determination of TOC, which is automatically per-
formed by the modern analyzers, is divided in three steps:
1. Acidification (removal and venting of inorganic car-
bon—IC—and purgeable organic carbon gases—
POC).
2. Oxidation of the carbon in the remaining sample in the
form of carbon dioxide (CO2) and other gases. This can be
done by high temperature combustion, high temperature
catalytic oxidation, photo-oxidation, thermo-chemical
oxidation, photo-chemical oxidation, or electrolytic
oxidation.
3. Detection and quantification using conductivity and
non-dispersive infrared (NDIR) to measure the CO2
generated by the oxidation process.
Nevertheless, the final washing is often performed with
an organic solvent in the pharmaceutical industry as many
chemical reactions must be carried out in absence of water.
Therefore, the method of the distillation residue is the more
commonly used in pharmaceutical pilot plants.
Other special techniques are sometimes implemented,
but they generally require the knowledge of the contami-
nants and a calibration is often required (e.g., MAESA
316 J. Wiss, J.-L. Schmuck
123
Multifunctional Active Excitation Spectral Analyzer [6]).
Therefore, these methods are not described in detail in this
article.
Thermogravimetry
This technique is based on the continuous recording of
mass changes of a sample as a function of the temperature;
the sample is put on a microbalance, which is placed in a
furnace. The furnace temperature is controlled in a pro-
grammed temperature/time profile and the mass variations
during this process are registered. Thermogravimetry is
commonly used to investigate processes as thermal stabil-
ity and decomposition, dehydration, oxidation, determina-
tion of volatile content, and corrosion studies at high
temperatures.
Therefore, the variation of the sample mass during the
evaporation of the solvent can be recorded; this application
corresponds more or less to the classical distillation residue
method (except that the evaporation is not performed under
vacuum). Several equipment providers propose TG devices
which are fully automated. Thus, the utilization is rela-
tively easy and trained plant operators can perform the
analyses. The TG analyzer used for this purpose must have
a very sensitive balance which allows an accurate mea-
surement of the residual mass at the end of the experiment
which is performed with a quite small sample (a few
grams).
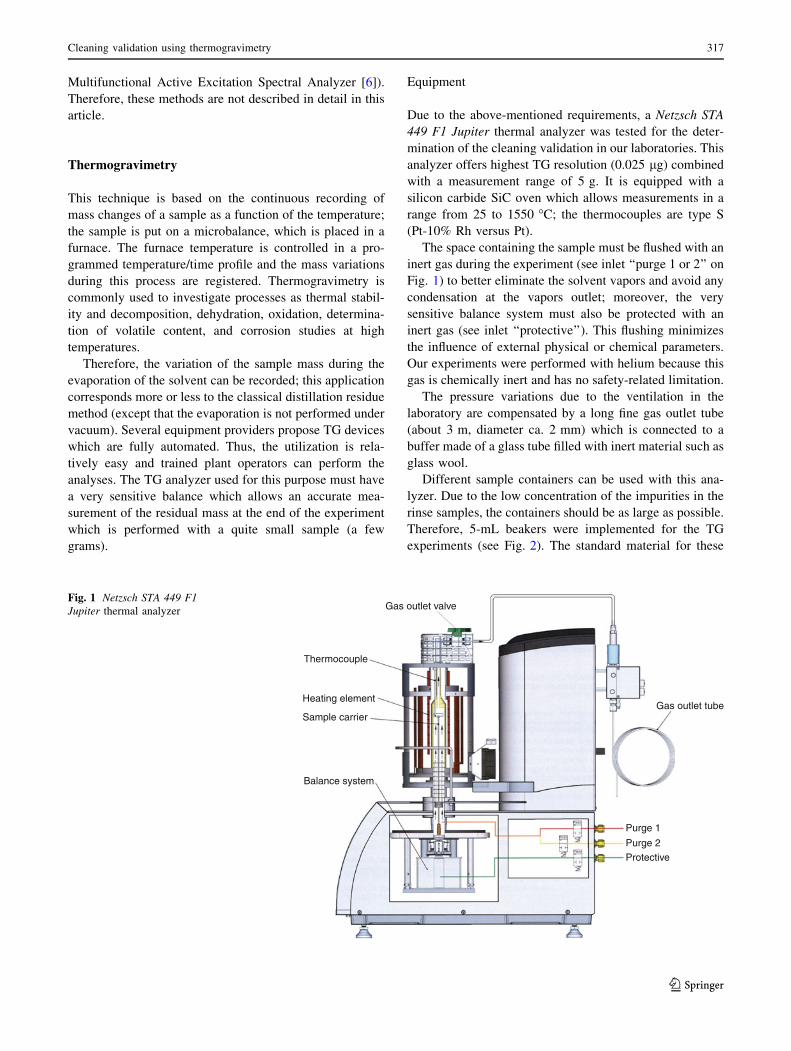
Equipment
Due to the above-mentioned requirements, a Netzsch STA
449 F1 Jupiter thermal analyzer was tested for the deter-
mination of the cleaning validation in our laboratories. This
analyzer offers highest TG resolution (0.025 lg) combined
with a measurement range of 5 g. It is equipped with a
silicon carbide SiC oven which allows measurements in a
range from 25 to 1550 �C; the thermocouples are type S
(Pt-10% Rh versus Pt).
The space containing the sample must be flushed with an
inert gas during the experiment (see inlet ‘‘purge 1 or 2’’ on
Fig. 1) to better eliminate the solvent vapors and avoid any
condensation at the vapors outlet; moreover, the very
sensitive balance system must also be protected with an
inert gas (see inlet ‘‘protective’’). This flushing minimizes
the influence of external physical or chemical parameters.
Our experiments were performed with helium because this
gas is chemically inert and has no safety-related limitation.
The pressure variations due to the ventilation in the
laboratory are compensated by a long fine gas outlet tube
(about 3 m, diameter ca. 2 mm) which is connected to a
buffer made of a glass tube filled with inert material such as
glass wool.
Different sample containers can be used with this ana-
lyzer. Due to the low concentration of the impurities in the
rinse samples, the containers should be as large as possible.
Therefore, 5-mL beakers were implemented for the TG
experiments (see Fig. 2). The standard material for these
Gas outlet valve
Gas outlet tube
Purge 1Piezo
Piezo
Piezo
Purge 2Protective
Balance system
Sample carrier
Heating element
Thermocouple
Fig. 1 Netzsch STA 449 F1Jupiter thermal analyzer
Cleaning validation using thermogravimetry 317
123
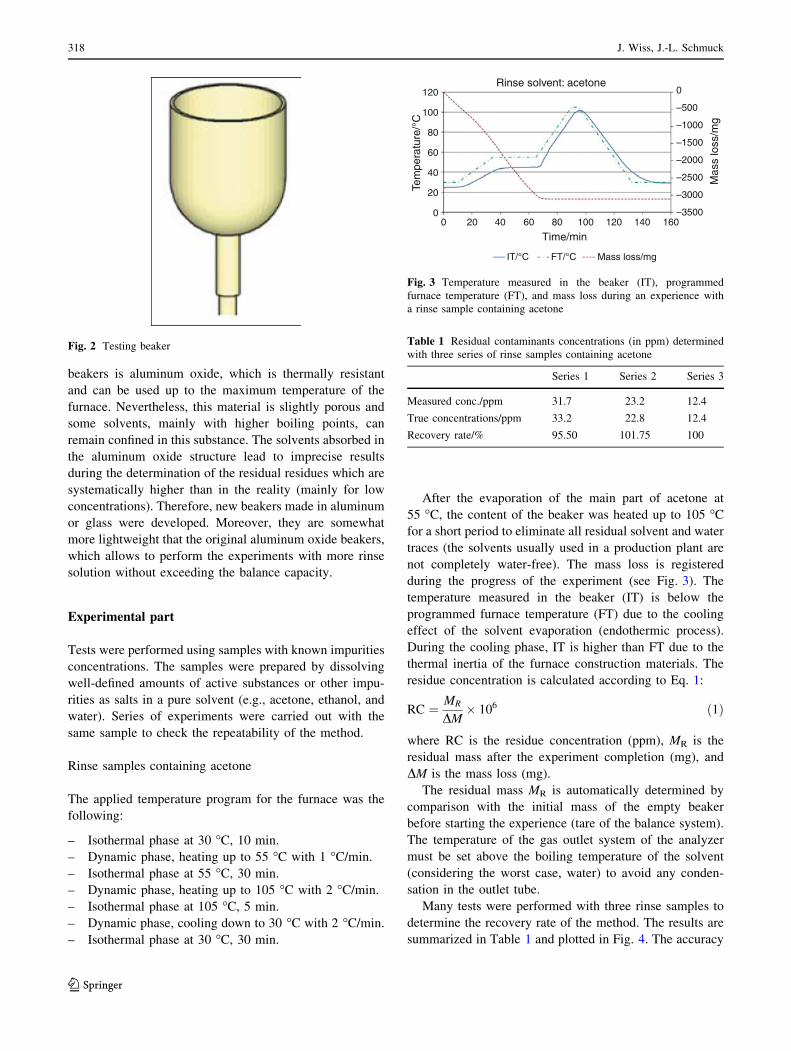
beakers is aluminum oxide, which is thermally resistant
and can be used up to the maximum temperature of the
furnace. Nevertheless, this material is slightly porous and
some solvents, mainly with higher boiling points, can
remain confined in this substance. The solvents absorbed in
the aluminum oxide structure lead to imprecise results
during the determination of the residual residues which are
systematically higher than in the reality (mainly for low
concentrations). Therefore, new beakers made in aluminum
or glass were developed. Moreover, they are somewhat
more lightweight that the original aluminum oxide beakers,
which allows to perform the experiments with more rinse
solution without exceeding the balance capacity.
Experimental part
Tests were performed using samples with known impurities
concentrations. The samples were prepared by dissolving
well-defined amounts of active substances or other impu-
rities as salts in a pure solvent (e.g., acetone, ethanol, and
water). Series of experiments were carried out with the
same sample to check the repeatability of the method.
Rinse samples containing acetone
The applied temperature program for the furnace was the
following:
– Isothermal phase at 30 �C, 10 min.
– Dynamic phase, heating up to 55 �C with 1 �C/min.
– Isothermal phase at 55 �C, 30 min.
– Dynamic phase, heating up to 105 �C with 2 �C/min.
– Isothermal phase at 105 �C, 5 min.
– Dynamic phase, cooling down to 30 �C with 2 �C/min.
– Isothermal phase at 30 �C, 30 min.
After the evaporation of the main part of acetone at
55 �C, the content of the beaker was heated up to 105 �C
for a short period to eliminate all residual solvent and water
traces (the solvents usually used in a production plant are
not completely water-free). The mass loss is registered
during the progress of the experiment (see Fig. 3). The
temperature measured in the beaker (IT) is below the
programmed furnace temperature (FT) due to the cooling
effect of the solvent evaporation (endothermic process).
During the cooling phase, IT is higher than FT due to the
thermal inertia of the furnace construction materials. The
residue concentration is calculated according to Eq. 1:
RC ¼ MR
DM� 106 ð1Þ
where RC is the residue concentration (ppm), MR is the
residual mass after the experiment completion (mg), and
DM is the mass loss (mg).
The residual mass MR is automatically determined by
comparison with the initial mass of the empty beaker
before starting the experience (tare of the balance system).
The temperature of the gas outlet system of the analyzer
must be set above the boiling temperature of the solvent
(considering the worst case, water) to avoid any conden-
sation in the outlet tube.
Many tests were performed with three rinse samples to
determine the recovery rate of the method. The results are
summarized in Table 1 and plotted in Fig. 4. The accuracy
Fig. 2 Testing beaker
00 20 40
IT/°C FT/°C Mass loss/mg
60 80 100 120 140 160–3500
–3000
–2500
–2000
–1500
–1000
–500
0
Tem
pera
ture
/°C
Mas
s lo
ss/m
g
Time/min
Rinse solvent: acetone
20
40
60
80
100
120
Fig. 3 Temperature measured in the beaker (IT), programmed
furnace temperature (FT), and mass loss during an experience with
a rinse sample containing acetone
Table 1 Residual contaminants concentrations (in ppm) determined
with three series of rinse samples containing acetone
Series 1 Series 2 Series 3
Measured conc./ppm 31.7 23.2 12.4
True concentrations/ppm 33.2 22.8 12.4
Recovery rate/% 95.50 101.75 100
318 J. Wiss, J.-L. Schmuck
123
of the method is sufficient for the assessment of the
cleaning effectiveness and the recovery rate is comparable
to the traditional distillation residue method.
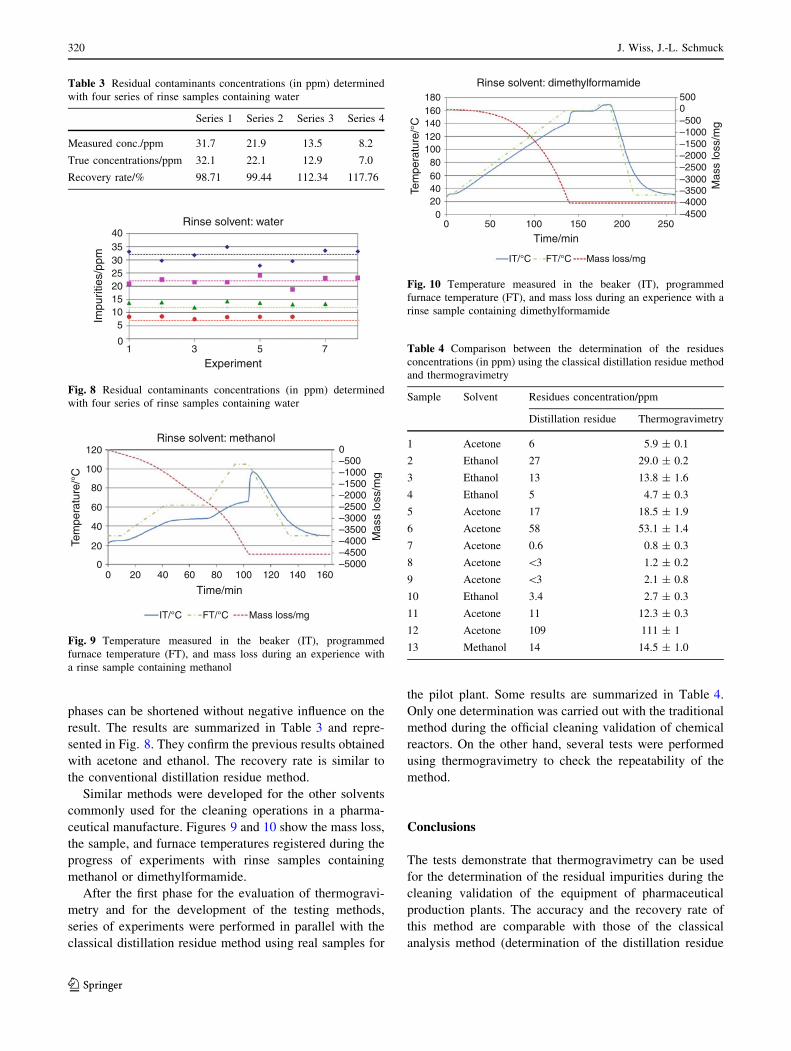
Rinse samples containing ethanol
The temperature sequence of the furnace was slightly
modified due to the higher boiling point of ethanol:
– Isothermal phase at 30 �C, 10 min.
– Dynamic phase, heating up to 75 �C with 1 �C/min.
– Isothermal phase at 75 �C, 30 min.
– Dynamic phase, heating up to 105 �C with 2 �C/min.
– Isothermal phase at 105 �C, 10 min.
– Dynamic phase, cooling down to 30 �C with 2 �C/min.
– Isothermal phase at 30 �C, 30 min.
The mass loss, the sample, and furnace temperatures
are registered during the progress of the experiment (see
Fig. 5). The results are summarized in Table 2 and
plotted in Fig. 6. They confirm the results obtained with
acetone.
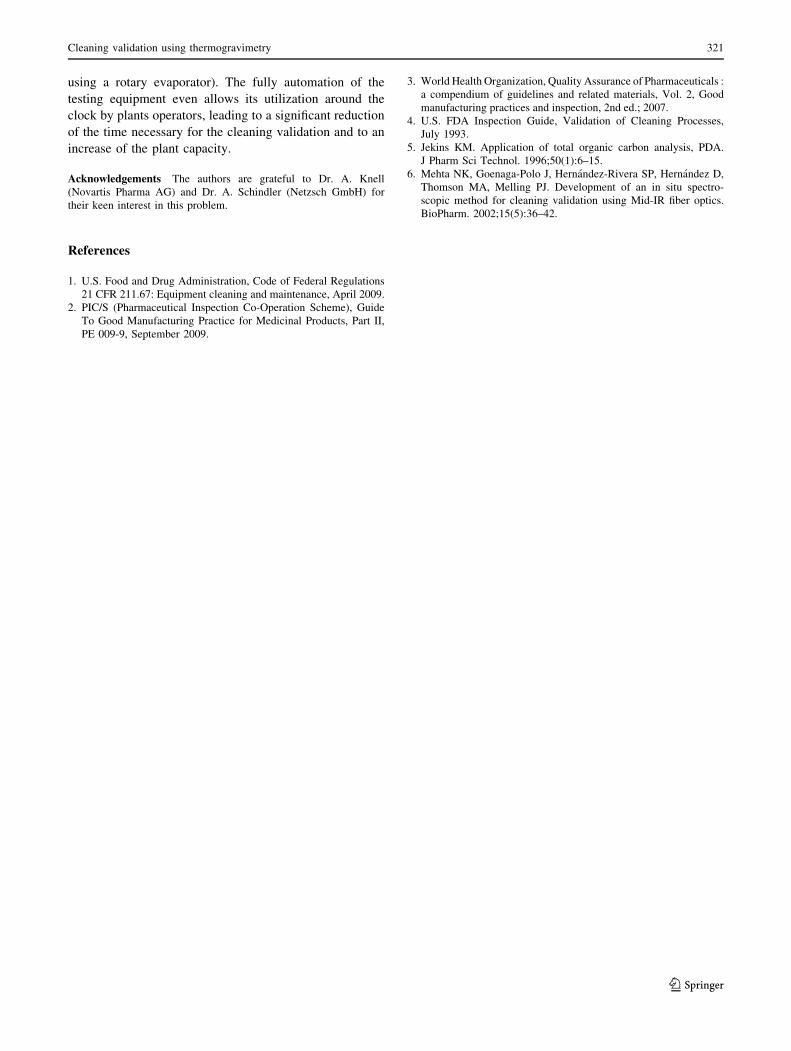
Rinse samples containing water
Here too, the temperature program for the furnace was
somewhat modified due to the higher boiling point of
water:
– Isothermal phase at 30 �C, 5 min.
– Dynamic phase, heating up to 102 �C with 0.75 �C/min.
– Isothermal phase at 102 �C, 90 min.
– Dynamic phase, heating up to 110 �C with 2 �C/min.
– Isothermal phase at 110 �C, 20 min.
– Dynamic phase, cooling down to 30 �C with 1.5 �C/min.
– Isothermal phase at 30 �C, 30 min.
The mass loss, the sample, and furnace temperatures are
registered during the progress of the experiment (see
Fig. 7). The duration of the different heating and cooling
01 3 5
Experiment
Rinse solvent: acetone
7 9
510
Impu
ritie
s/pp
m
152025303540
Fig. 4 Residual contaminants concentrations (in ppm) determined
with three series of rinse samples containing acetone
00 20 40 60
IT/°C FT/°C Mass loss/mg
80 100 120 140 160 180–4500–4000–3500–3000–2500–2000–1500–1000–5000
Tem
pera
ture
/°C
Mas
s lo
ss/m
g
Time/min
Rinse solvent: ethanol
20
40
60
80
100
120
Fig. 5 Temperature measured in the beaker (IT), programmed fur-
nace temperature (FT), and mass loss during an experience with a
rinse sample containing ethanol
Table 2 Residual contaminants concentrations (in ppm) determined
with three series of rinse samples containing ethanol
Series 1 Series 2 Series 3
Measured conc./ppm 37.0 25.6 14.2
True concentrations/ppm 35.8 24.5 13.3
Recovery rate/% 103.35 104.49 106.77
01 3 5 7
510
Impu
ritie
s/pp
m
Experiment
Rinse solvent:ethanol
152025303540
Fig. 6 Residual contaminants concentrations (in ppm) determined
with three series of rinse samples containing ethanol
00 50 100
IT/°C FT/°C Mass loss/mg
Mas
s lo
ss/m
g
150
Time/min
Rinse solvent: water
200 250 300–5000–4500–4000–3500–3000–2500–2000–1500–1000–5000
20
40
60
Tem
pera
ture
/°C
80
100
120
Fig. 7 Temperature measured in the beaker (IT), programmed
furnace temperature (FT), and mass loss during an experience with
a rinse sample containing water
Cleaning validation using thermogravimetry 319
123
phases can be shortened without negative influence on the
result. The results are summarized in Table 3 and repre-
sented in Fig. 8. They confirm the previous results obtained
with acetone and ethanol. The recovery rate is similar to
the conventional distillation residue method.
Similar methods were developed for the other solvents
commonly used for the cleaning operations in a pharma-
ceutical manufacture. Figures 9 and 10 show the mass loss,
the sample, and furnace temperatures registered during the
progress of experiments with rinse samples containing
methanol or dimethylformamide.
After the first phase for the evaluation of thermogravi-
metry and for the development of the testing methods,
series of experiments were performed in parallel with the
classical distillation residue method using real samples for
the pilot plant. Some results are summarized in Table 4.
Only one determination was carried out with the traditional
method during the official cleaning validation of chemical
reactors. On the other hand, several tests were performed
using thermogravimetry to check the repeatability of the
method.
Conclusions
The tests demonstrate that thermogravimetry can be used
for the determination of the residual impurities during the
cleaning validation of the equipment of pharmaceutical
production plants. The accuracy and the recovery rate of
this method are comparable with those of the classical
analysis method (determination of the distillation residue
Table 3 Residual contaminants concentrations (in ppm) determined
with four series of rinse samples containing water
Series 1 Series 2 Series 3 Series 4
Measured conc./ppm 31.7 21.9 13.5 8.2
True concentrations/ppm 32.1 22.1 12.9 7.0
Recovery rate/% 98.71 99.44 112.34 117.76
01 3 5
Experiment
Rinse solvent: water
7
51015
Impu
ritie
s/pp
m
2025303540
Fig. 8 Residual contaminants concentrations (in ppm) determined
with four series of rinse samples containing water
00 20 40
IT/°C FT/°C Mass loss/mg
Mas
s lo
ss/m
g
60 80 100
Time/min
Rinse solvent: methanol
120 140 160–5000–4500–4000–3500–3000–2500–2000–1500–1000–5000
20
40
60
Tem
pera
ture
/°C
80
100
120
Fig. 9 Temperature measured in the beaker (IT), programmed
furnace temperature (FT), and mass loss during an experience with
a rinse sample containing methanol
00 50 100
IT/°C FT/°C Mass loss/mg
Rinse solvent: dimethylformamide
Mas
s lo
ss/m
g
150 200 250–4500–4000–3500–3000–2500–2000–1500–1000–500
5000
Time/min
20
Tem
pera
ture
/°C
406080
100120140160180
Fig. 10 Temperature measured in the beaker (IT), programmed
furnace temperature (FT), and mass loss during an experience with a
rinse sample containing dimethylformamide
Table 4 Comparison between the determination of the residues
concentrations (in ppm) using the classical distillation residue method
and thermogravimetry
Sample Solvent Residues concentration/ppm
Distillation residue Thermogravimetry
1 Acetone 6 5.9 ± 0.1
2 Ethanol 27 29.0 ± 0.2
3 Ethanol 13 13.8 ± 1.6
4 Ethanol 5 4.7 ± 0.3
5 Acetone 17 18.5 ± 1.9
6 Acetone 58 53.1 ± 1.4
7 Acetone 0.6 0.8 ± 0.3
8 Acetone \3 1.2 ± 0.2
9 Acetone \3 2.1 ± 0.8
10 Ethanol 3.4 2.7 ± 0.3
11 Acetone 11 12.3 ± 0.3
12 Acetone 109 111 ± 1
13 Methanol 14 14.5 ± 1.0
320 J. Wiss, J.-L. Schmuck
123
using a rotary evaporator). The fully automation of the
testing equipment even allows its utilization around the
clock by plants operators, leading to a significant reduction
of the time necessary for the cleaning validation and to an
increase of the plant capacity.
Acknowledgements The authors are grateful to Dr. A. Knell
(Novartis Pharma AG) and Dr. A. Schindler (Netzsch GmbH) for
their keen interest in this problem.
References
1. U.S. Food and Drug Administration, Code of Federal Regulations
21 CFR 211.67: Equipment cleaning and maintenance, April 2009.
2. PIC/S (Pharmaceutical Inspection Co-Operation Scheme), Guide
To Good Manufacturing Practice for Medicinal Products, Part II,
PE 009-9, September 2009.
3. World Health Organization, Quality Assurance of Pharmaceuticals :
a compendium of guidelines and related materials, Vol. 2, Good
manufacturing practices and inspection, 2nd ed.; 2007.
4. U.S. FDA Inspection Guide, Validation of Cleaning Processes,
July 1993.
5. Jekins KM. Application of total organic carbon analysis, PDA.
J Pharm Sci Technol. 1996;50(1):6–15.
6. Mehta NK, Goenaga-Polo J, Hernandez-Rivera SP, Hernandez D,
Thomson MA, Melling PJ. Development of an in situ spectro-
scopic method for cleaning validation using Mid-IR fiber optics.
BioPharm. 2002;15(5):36–42.
Cleaning validation using thermogravimetry 321
123


![High potent OSD multi-production plant -3C [????]Cleaning-Validation phase- Cleaning Validation-Cleaning Validation team with early involvement is most important for cleaning & cross-contamination!](https://img.pdfslide.net/doc/110x75/5ed1bf74da60d73eea29283f/high-potent-osd-multi-production-plant-3c-cleaning-validation-phase-cleaning.jpg)