Embed Size (px)
DESCRIPTION
Cleveland Bikeshare - Feasibility Study (FINAL)
Citation preview
credit: Capital Bikeshare, Washington, DC
September 2013
Cleveland Bike Share Feasibility Study │i
Contents Executive Summary ............................................................................................................................................ 1
Introduction .......................................................................................................................................................... 3
Purpose of the Study ........................................................................................................................................ 3
Background ......................................................................................................................................................... 4
What is Bike Share? ......................................................................................................................................... 4
Characteristics of Bike Share: .................................................................................................................... 4
History of Bike Share ................................................................................................................................... 4
Benefits of Bike Share ................................................................................................................................. 5
Comparable Cities ........................................................................................................................................... 8
Cincinnati: .................................................................................................................................................. 10
Columbus: .................................................................................................................................................. 10
Pittsburgh .................................................................................................................................................. 11
Existing Conditions ........................................................................................................................................... 12
Geography, Climate and Land Use ................................................................................................................ 12
Demographics and Employment ................................................................................................................... 13
Population Density ..................................................................................................................................... 13
Demographics ............................................................................................................................................ 14
Employment ............................................................................................................................................... 15
Mixed Use Population and Employment Density ..................................................................................... 16
Bicycle Infrastructure .................................................................................................................................... 17
Tourism .......................................................................................................................................................... 18
Neighborhood Connections ........................................................................................................................... 19
Public Transit ................................................................................................................................................. 19
Plans, Regulations and Existing Organizational Capacity ........................................................................... 21
Plans ............................................................................................................................................................... 21
Connecting Cleveland 2020 Citywide Plan ................................................................................................ 21
Transit 2025: The Long Range Plan of the Greater Cleveland Regional Transit Authority .................... 21
Cleveland Bikeway Master Plan ................................................................................................................ 21
Cleveland Downtown Lakefront Plan ....................................................................................................... 22
Policy and City Ordinances ............................................................................................................................ 22
Cleveland Bike Share Feasibility Study │ii
Cleveland Complete and Green Streets Ordinance (Ordinance No. 798-11) .......................................... 22
City of Cleveland Zoning Code – Bicycle Parking (2008) (Section 457.10) ............................................... 22
Regulations and Permitting .......................................................................................................................... 23
Encroachment Permit ............................................................................................................................... 23
Cleveland City Code Chapter 473 – Bicycles and Motorcycles ................................................................ 23
Existing Organizational Capacity ................................................................................................................... 24
Public Input and Stakeholder Engagement .................................................................................................... 25
Public Input .................................................................................................................................................... 25
Community Workshop ............................................................................................................................... 25
On-line Bike Share Survey ........................................................................................................................ 26
Interactive Web-Based Mapping Tool ....................................................................................................... 28
Stakeholder Engagement .......................................................................................................................... 30
Evaluating Demand, System Size and Funding Sources ............................................................................. 32
Demand Analysis ........................................................................................................................................... 32
Indicators ................................................................................................................................................... 32
Demand Estimates .................................................................................................................................... 33
Recommended System Service Area and Size ............................................................................................. 33
Bike Share Market Recommendations ..................................................................................................... 33
Service Boundary and Station Density ...................................................................................................... 36
Key Demographics of the Bike Share Service Area ..................................................................................... 37
Market Analysis Community Suggested Station Locations ......................................................................... 39
Potential Funding Sources ............................................................................................................................ 41
Public Sources: .......................................................................................................................................... 41
Private Sources: ......................................................................................................................................... 41
Feasibility Recommendation ........................................................................................................................... 43
Appendices ........................................................................................................................................................ 44
Appendix 1 – Methodology of Study ............................................................................................................... 44
Appendix 2 – List of Stakeholders Interviewed ............................................................................................. 45
Appendix 3 –Summary of Public Engagement Meeting Station Suggestions ............................................. 46
Appendix 4 – Online Survey and Summary of Results ................................................................................. 47
Cleveland Bike Share Feasibility Study │1
Executive Summary Across the U.S., cities are embracing an innovative approach to
urban mobility which combines the flexibility of a bicycle with the
accessibility of public transportation. Bike share is ideal for short
distance point-to-point trips providing subscribers access to
bicycles at any self-serve bike station to use and return to any bike
station within the system’s service area. Bike-sharing
implementation in urban areas has been seen to positively affect
how residents, employees, and visitors experience a city. Bike-
transit systems allow for more people to access cycling for short
trips, replace vehicle use, cycle for fitness and recreation, and for
tourists and residents alike to explore a city.
Bicycling in Cleveland has been on the rise – the most recent
Census numbers indicated an increase of 280% from 2000 to 2010
in the number of people commuting to work by bicycle. Because of
the region’s growing bicycle culture, continued investment in
downtown Cleveland, and the City’s commitment to becoming a
bicycle friendly community, the Mayor’s Office of Sustainability is
exploring the feasibility of implementing a bike share system in
Cleveland.
Cleveland exhibits many of the characteristics that are conducive to establishing a bike share program.
Those include:
• A supportive policy environment that has activated significant growth in bicycling and the amount
of bike facilities.
• A high population and employment dual core area offering a mixed market of residents,
employees, students, and visitors as well as nodes of activity at key destinations linking these two
markets.
• A substantial, well-supported tourism industry with internationally-renowned visitor attractions,
museums, events, parks and trails.
A very engaged group of potential supporters including major corporations, local businesses, an
extensive health and medical community, a number of large employers, colleges and other
institutions with the potential for sponsorship or large membership boosts.
Very flat and uniform geographic conditions that are conducive for bicycling.
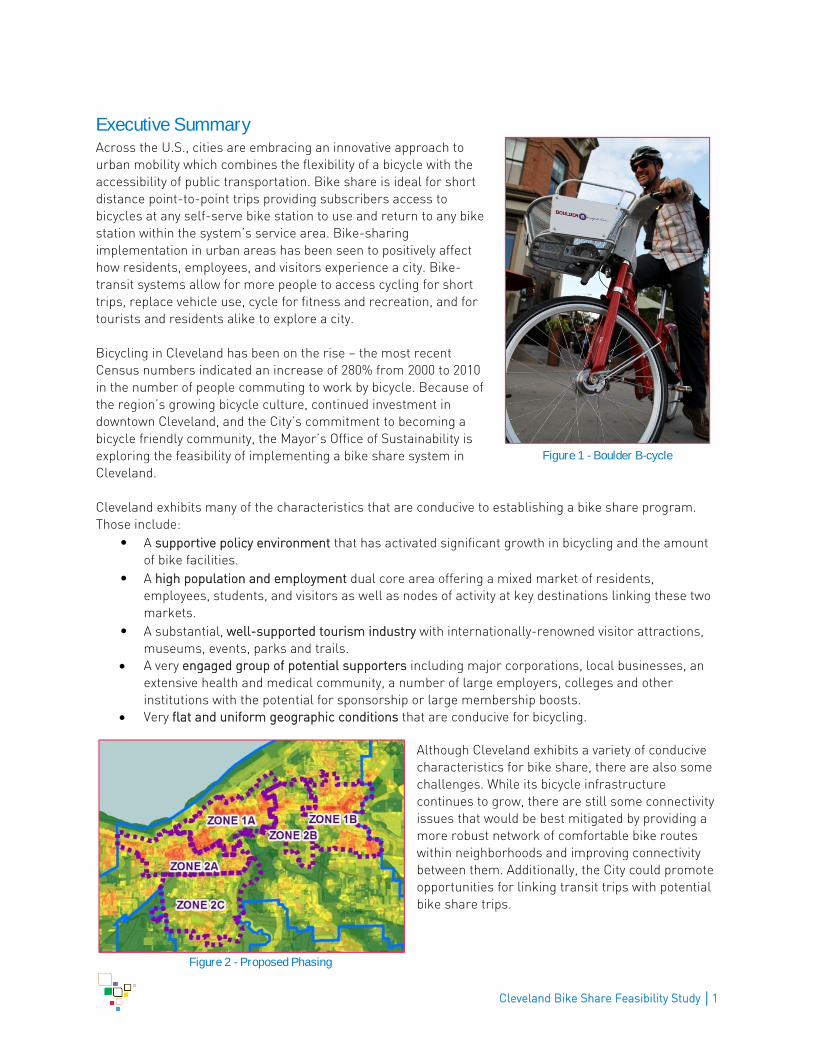
Although Cleveland exhibits a variety of conducive
characteristics for bike share, there are also some
challenges. While its bicycle infrastructure
continues to grow, there are still some connectivity
issues that would be best mitigated by providing a
more robust network of comfortable bike routes
within neighborhoods and improving connectivity
between them. Additionally, the City could promote
opportunities for linking transit trips with potential
bike share trips.
Figure 2 - Proposed Phasing
Figure 1 - Boulder B-cycle
Cleveland Bike Share Feasibility Study │2
Based on a complete analysis of land use, population data, stakeholder engagement and public input, the
City could support a system of between 770 and 1,400 bikes and between 77 and 140 stations in 5 defined
market areas. The proposed system would have a dual core situated in Downtown and University Circle
and expand into Midtown, Ohio City and Tremont. These locations offer the highest potential demand for
bike sharing.
A general business model for the bike share system should be adopted to include some combination of
public and non-profit ownership, administration and operation of the system. The largest obstacle is
finding and/or creating organizational capacity and leadership to take on the responsibility of procuring
and managing the system. It is therefore recommended that the City continue engagement with local
stakeholders including the RTA to possibly partnering on implementing the bike share program.
Depending on this interest, the City could then issue an RFP for operating the system or an RFI to register
their interest to own, administer, and operate the system.
Cleveland Bike Share Feasibility Study │3
Introduction
Purpose of the Study This Feasibility Study assesses the readiness of the City of Cleveland for a bike sharing program –
WHETHER a bike sharing program can be successful in Cleveland and WHAT, if any, actions should be
taken to enhance the City’s readiness and likelihood for a successful program. To evaluate the feasibility
of a bike share program in Cleveland, we evaluate the following factors both specific to Cleveland and,
when applicable, in relation to comparable cities that have implemented or are implementing bike share
programs:
Existing Conditions Evaluation
Geography and Climate
Demographics
Bicycle Infrastructure
Public Transit
Policies and Plans
Public and Stakeholder Engagement
Public Input
Stakeholder Engagement
Potential System Demand, Size and Funding
Demand Analysis
Potential Service Area
Potential Funding Sources
For each of these factors, we identify opportunities and challenges, and if applicable, recommend steps
that should be taken to address the challenges. Following the recommendations for each section, we
make an overall evaluation of the feasibility of bike share in Cleveland.
To guide this analysis the consultant team was advised by the Bike Share Task Force comprised of key
community stakeholders from both public agencies, non-profits and the private sector. The task force
provided key direction and input to the study process and helped with the broader engagement process in
both identifying key stakeholder audiences and promoting the public engagement opportunities to their
constituencies.
The Bike Share Task Force had representatives from the following organizations:
Mayor’s Office of Sustainability
Cleveland City Planning
GreenCityBlueLake Institute
Bike Cleveland
Greater Cleveland Regional
Transit Authority
Cleveland City Planning
Commission
Positively Cleveland
Midtown Cleveland
Ohio City Inc.
Downtown Cleveland
Alliance/Cleveland Bike Rack
Northeast Ohio Areawide
Coordinating Agency
Cuyahoga County
University Circle Inc.
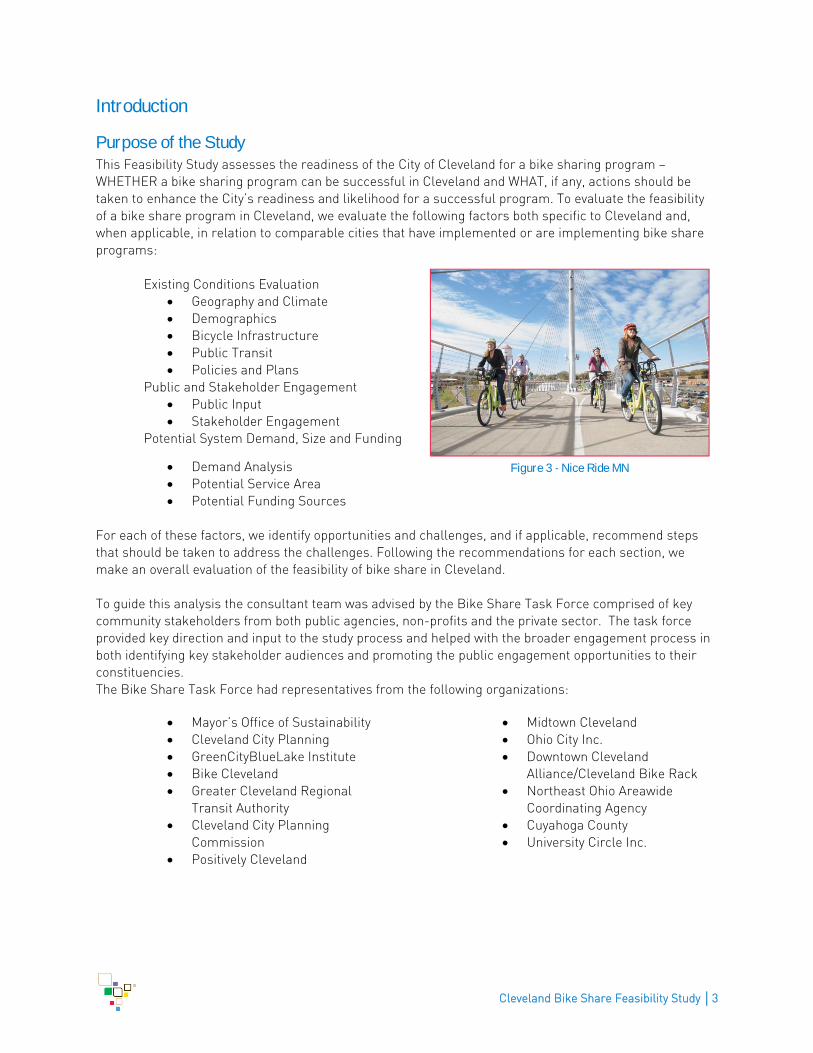
Figure 3 - Nice Ride MN
Cleveland Bike Share Feasibility Study │4
Background
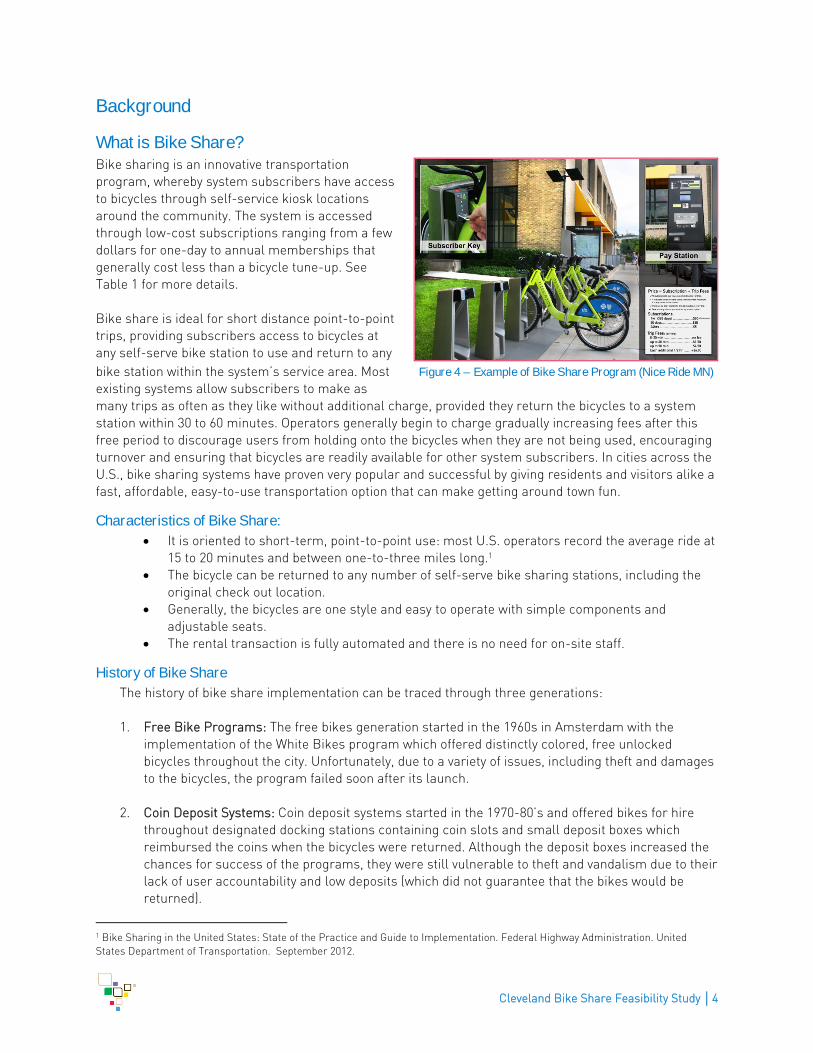
What is Bike Share? Bike sharing is an innovative transportation
program, whereby system subscribers have access
to bicycles through self-service kiosk locations
around the community. The system is accessed
through low-cost subscriptions ranging from a few
dollars for one-day to annual memberships that
generally cost less than a bicycle tune-up. See
Table 1 for more details.
Bike share is ideal for short distance point-to-point
trips, providing subscribers access to bicycles at
any self-serve bike station to use and return to any
bike station within the system’s service area. Most
existing systems allow subscribers to make as
many trips as often as they like without additional charge, provided they return the bicycles to a system
station within 30 to 60 minutes. Operators generally begin to charge gradually increasing fees after this
free period to discourage users from holding onto the bicycles when they are not being used, encouraging
turnover and ensuring that bicycles are readily available for other system subscribers. In cities across the
U.S., bike sharing systems have proven very popular and successful by giving residents and visitors alike a
fast, affordable, easy-to-use transportation option that can make getting around town fun.
Characteristics of Bike Share: It is oriented to short-term, point-to-point use: most U.S. operators record the average ride at
15 to 20 minutes and between one-to-three miles long.1
The bicycle can be returned to any number of self-serve bike sharing stations, including the
original check out location.
Generally, the bicycles are one style and easy to operate with simple components and
adjustable seats.
The rental transaction is fully automated and there is no need for on-site staff.
History of Bike Share The history of bike share implementation can be traced through three generations:
1. Free Bike Programs: The free bikes generation started in the 1960s in Amsterdam with the
implementation of the White Bikes program which offered distinctly colored, free unlocked
bicycles throughout the city. Unfortunately, due to a variety of issues, including theft and damages
to the bicycles, the program failed soon after its launch.
2. Coin Deposit Systems: Coin deposit systems started in the 1970-80’s and offered bikes for hire
throughout designated docking stations containing coin slots and small deposit boxes which
reimbursed the coins when the bicycles were returned. Although the deposit boxes increased the
chances for success of the programs, they were still vulnerable to theft and vandalism due to their
lack of user accountability and low deposits (which did not guarantee that the bikes would be
returned).
1 Bike Sharing in the United States: State of the Practice and Guide to Implementation. Federal Highway Administration. United
States Department of Transportation. September 2012.
Figure 4 – Example of Bike Share Program (Nice Ride MN)
Cleveland Bike Share Feasibility Study │5
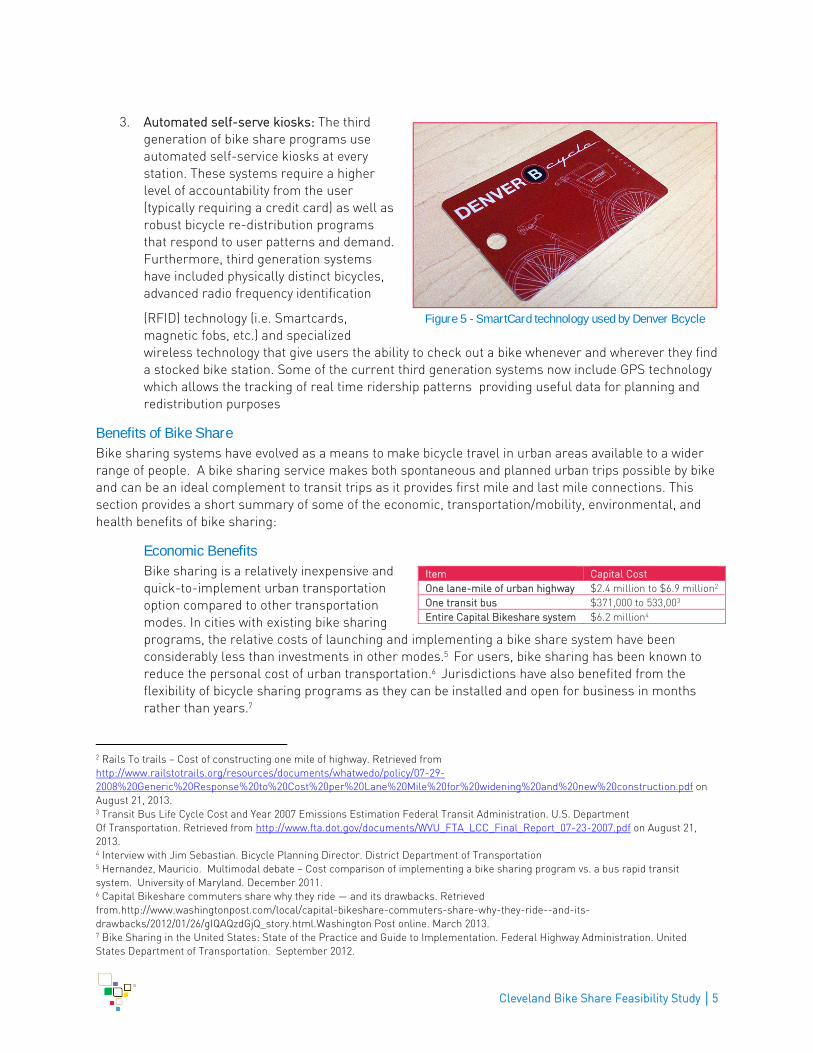
3. Automated self-serve kiosks: The third
generation of bike share programs use
automated self-service kiosks at every
station. These systems require a higher
level of accountability from the user
(typically requiring a credit card) as well as
robust bicycle re-distribution programs
that respond to user patterns and demand.
Furthermore, third generation systems
have included physically distinct bicycles,
advanced radio frequency identification
(RFID) technology (i.e. Smartcards,
magnetic fobs, etc.) and specialized
wireless technology that give users the ability to check out a bike whenever and wherever they find
a stocked bike station. Some of the current third generation systems now include GPS technology
which allows the tracking of real time ridership patterns providing useful data for planning and
redistribution purposes
Benefits of Bike Share Bike sharing systems have evolved as a means to make bicycle travel in urban areas available to a wider
range of people. A bike sharing service makes both spontaneous and planned urban trips possible by bike
and can be an ideal complement to transit trips as it provides first mile and last mile connections. This
section provides a short summary of some of the economic, transportation/mobility, environmental, and
health benefits of bike sharing:
Economic Benefits Bike sharing is a relatively inexpensive and
quick-to-implement urban transportation
option compared to other transportation
modes. In cities with existing bike sharing
programs, the relative costs of launching and implementing a bike share system have been
considerably less than investments in other modes.5 For users, bike sharing has been known to
reduce the personal cost of urban transportation.6 Jurisdictions have also benefited from the
flexibility of bicycle sharing programs as they can be installed and open for business in months
rather than years.7
2 Rails To trails – Cost of constructing one mile of highway. Retrieved from
http://www.railstotrails.org/resources/documents/whatwedo/policy/07-29-
2008%20Generic%20Response%20to%20Cost%20per%20Lane%20Mile%20for%20widening%20and%20new%20construction.pdf on
August 21, 2013. 3 Transit Bus Life Cycle Cost and Year 2007 Emissions Estimation Federal Transit Administration. U.S. Department
Of Transportation. Retrieved from http://www.fta.dot.gov/documents/WVU_FTA_LCC_Final_Report_07-23-2007.pdf on August 21,
2013. 4 Interview with Jim Sebastian. Bicycle Planning Director. District Department of Transportation 5 Hernandez, Mauricio. Multimodal debate – Cost comparison of implementing a bike sharing program vs. a bus rapid transit
system. University of Maryland. December 2011. 6 Capital Bikeshare commuters share why they ride — and its drawbacks. Retrieved
from.http://www.washingtonpost.com/local/capital-bikeshare-commuters-share-why-they-ride--and-its-
drawbacks/2012/01/26/gIQAQzdGjQ_story.html.Washington Post online. March 2013.
7 Bike Sharing in the United States: State of the Practice and Guide to Implementation. Federal Highway Administration. United
States Department of Transportation. September 2012.
Item Capital Cost
One lane-mile of urban highway $2.4 million to $6.9 million2
One transit bus $371,000 to 533,003
Entire Capital Bikeshare system $6.2 million4
Figure 5 - SmartCard technology used by Denver Bcycle
Cleveland Bike Share Feasibility Study │6
Previous research on funding for bike sharing programs has indicated that U.S. jurisdictions have
allocated only a small part of their local funds to use in bike sharing implementation. To date, a
high proportion of the total funding allocated for existing programs has come through State and
Federal grants, reducing the local contributions to a minimum. Additional forms of funding have
included private donations, corporate sponsorships, and user revenues.
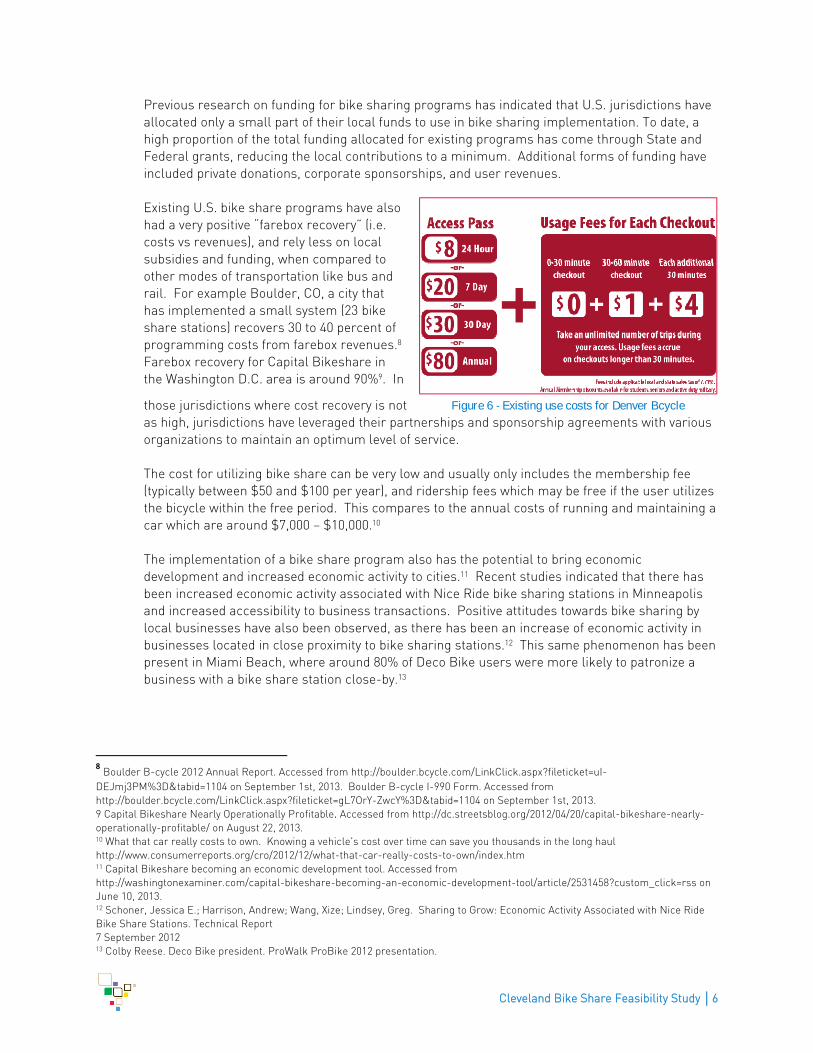
Existing U.S. bike share programs have also
had a very positive “farebox recovery” (i.e.
costs vs revenues), and rely less on local
subsidies and funding, when compared to
other modes of transportation like bus and
rail. For example Boulder, CO, a city that
has implemented a small system (23 bike
share stations) recovers 30 to 40 percent of
programming costs from farebox revenues.8
Farebox recovery for Capital Bikeshare in
the Washington D.C. area is around 90%9. In
those jurisdictions where cost recovery is not
as high, jurisdictions have leveraged their partnerships and sponsorship agreements with various
organizations to maintain an optimum level of service.
The cost for utilizing bike share can be very low and usually only includes the membership fee
(typically between $50 and $100 per year), and ridership fees which may be free if the user utilizes
the bicycle within the free period. This compares to the annual costs of running and maintaining a
car which are around $7,000 – $10,000.10
The implementation of a bike share program also has the potential to bring economic
development and increased economic activity to cities.11 Recent studies indicated that there has
been increased economic activity associated with Nice Ride bike sharing stations in Minneapolis
and increased accessibility to business transactions. Positive attitudes towards bike sharing by
local businesses have also been observed, as there has been an increase of economic activity in
businesses located in close proximity to bike sharing stations.12 This same phenomenon has been
present in Miami Beach, where around 80% of Deco Bike users were more likely to patronize a
business with a bike share station close-by.13
8 Boulder B-cycle 2012 Annual Report. Accessed from http://boulder.bcycle.com/LinkClick.aspx?fileticket=uI-
DEJmj3PM%3D&tabid=1104 on September 1st, 2013. Boulder B-cycle I-990 Form. Accessed from
http://boulder.bcycle.com/LinkClick.aspx?fileticket=gL7OrY-ZwcY%3D&tabid=1104 on September 1st, 2013. 9 Capital Bikeshare Nearly Operationally Profitable. Accessed from http://dc.streetsblog.org/2012/04/20/capital-bikeshare-nearly-
operationally-profitable/ on August 22, 2013. 10 What that car really costs to own. Knowing a vehicle's cost over time can save you thousands in the long haul
http://www.consumerreports.org/cro/2012/12/what-that-car-really-costs-to-own/index.htm 11 Capital Bikeshare becoming an economic development tool. Accessed from
http://washingtonexaminer.com/capital-bikeshare-becoming-an-economic-development-tool/article/2531458?custom_click=rss on
June 10, 2013. 12 Schoner, Jessica E.; Harrison, Andrew; Wang, Xize; Lindsey, Greg. Sharing to Grow: Economic Activity Associated with Nice Ride
Bike Share Stations. Technical Report
7 September 2012 13 Colby Reese. Deco Bike president. ProWalk ProBike 2012 presentation.
Figure 6 - Existing use costs for Denver Bcycle
Cleveland Bike Share Feasibility Study │7
Transportation / Mobility Benefits Bike share is one of the most affordable public transport options. Cities with existing programs
have reported increases in transit users, which may be a result of the additional mobility option for
last mile connections provided by bike share. Bike share has also improved connectivity to
different parts of cities where transit did not reach (64% of Capital Bikeshare survey respondents
reported that they would not have otherwise made the trip if bike share was not available).14
In cities with existing programs, bike sharing systems have also created increased demand for
bicycling15 while helping decrease the number of personal vehicle trips.16 Bike share can also help
introduce people to cycling as a mode of transportation and to people who don’t usually ride. In
Minneapolis approximately one-third of system users cycled less than once per month before
signing up with Nice Ride.17
Health Benefits Bike share provides additional active transportation options in a city. In recent years, an increased
number of American children and adults are sedentary and obese. It is well documented that
engaging in light to moderate physical activity reduces the risk heart disease, stroke, and other
chronic and life-threatening illnesses. Physical activity can also improve mental health and even
lower health care costs.18 Throughout many existing programs in the U.S. including Nice Ride MN,
B-cycle Kansas City, San Antonio B-cycle and Denver B-Cycle, health care related businesses
have become major sponsors in response to
perceived health benefits.
Initiatives like Healthy Cleveland, that have
promoted mobility and exercise initiatives
and programs that target changes in
behavioral health, could be a great conduit
for implementing a bike sharing program in
the City of Cleveland.
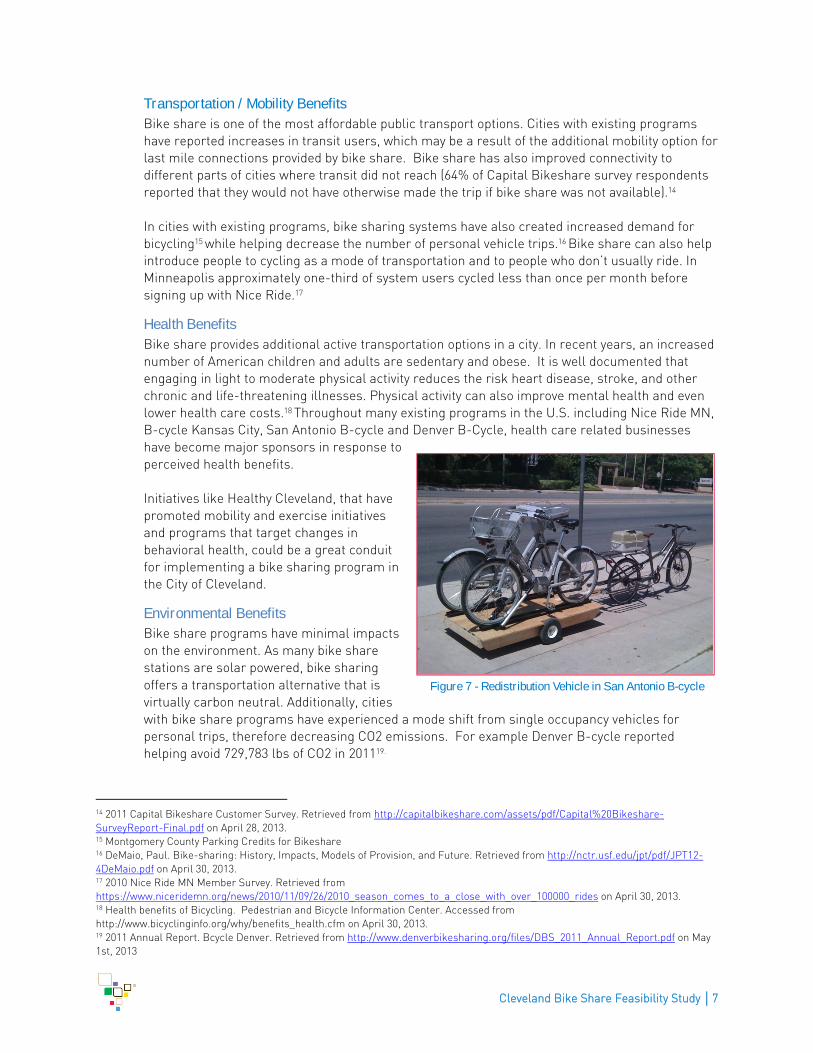
Environmental Benefits Bike share programs have minimal impacts
on the environment. As many bike share
stations are solar powered, bike sharing
offers a transportation alternative that is
virtually carbon neutral. Additionally, cities
with bike share programs have experienced a mode shift from single occupancy vehicles for
personal trips, therefore decreasing CO2 emissions. For example Denver B-cycle reported
helping avoid 729,783 lbs of CO2 in 201119.
14 2011 Capital Bikeshare Customer Survey. Retrieved from http://capitalbikeshare.com/assets/pdf/Capital%20Bikeshare-
SurveyReport-Final.pdf on April 28, 2013. 15 Montgomery County Parking Credits for Bikeshare 16 DeMaio, Paul. Bike-sharing: History, Impacts, Models of Provision, and Future. Retrieved from http://nctr.usf.edu/jpt/pdf/JPT12-
4DeMaio.pdf on April 30, 2013. 17 2010 Nice Ride MN Member Survey. Retrieved from
https://www.niceridemn.org/news/2010/11/09/26/2010_season_comes_to_a_close_with_over_100000_rides on April 30, 2013. 18 Health benefits of Bicycling. Pedestrian and Bicycle Information Center. Accessed from
http://www.bicyclinginfo.org/why/benefits_health.cfm on April 30, 2013. 19 2011 Annual Report. Bcycle Denver. Retrieved from http://www.denverbikesharing.org/files/DBS_2011_Annual_Report.pdf on May
1st, 2013
Figure 7 - Redistribution Vehicle in San Antonio B-cycle
Cleveland Bike Share Feasibility Study │8
When redistribution of bicycles is required, various cities have used cargo bikes or electric
vehicles to move bicycles from station to station. See Figure 7 for reference.
Safety Benefits Although there is only a relatively short period of crash data available, most existing U.S. bike
share programs have reported very low crash rates when compared to crashes among bicyclists
riding their personal bikes.20 For example, as of March 2012, the largest systems in the U.S. (i.e.
Capital Bikeshare, Nice Ride and Deco Bike) reported only 16 crashes in total with no fatalities or
major incidents. When compared to the number of rides by the three systems in the same period
(around 2.5 million) the crash rate is lower than 0.05 %, which does not account for the actual
injury rate, which is even lower. While there is not documented research to explain the low crash
rates, there are a number of aspects related to bike sharing that may be contributing to safety,
including:
Heavier bicycles with more robust tires and limited gearing encourage slower bicycling
speed.
Durable and well maintained braking systems, which make stopping easy and efficient.
Integrated automatic light systems.
A possible “safety in numbers” effect as the high conspicuity and prevalence of bike share
bicycles and kiosks increases the awareness of bicyclists among drivers.
Design of the bicycle which comes with low step over height, making it easier for the user
to regain their balance quickly.
Regular bicycle inspections and routine maintenance of the system fleet.
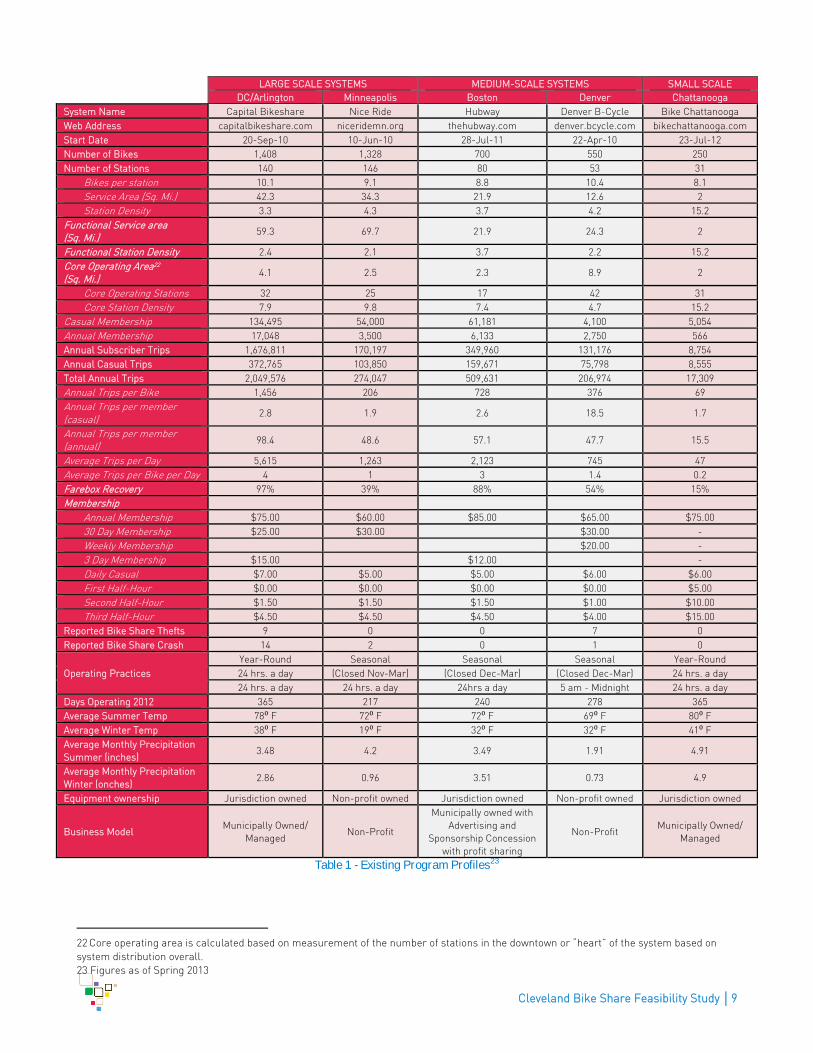
Comparable Cities Most of the major North American bike share systems started around 2010. Five peer systems were
identified from among active systems based on similarities in both geographic size and program scale.
The peer systems selected to profile for the updated system recommendations were:21
Capital Bikeshare - Washington, DC and Arlington, VA (1,600 bikes/191 stations).
NiceRide Minnesota – Minneapolis, MN (1,300 bikes/145 stations).
Hubway – Boston, MA (1,000 bikes/105 stations).
Denver Bikesharing – Denver, CO (530 bikes/53 stations).
Chattanooga Bicycle Transit System – Chattanooga, TN (300 bikes/30 stations).
These programs were selected to highlight different operational and ownership models, as well as to offer
highlights from different experiences in different market sizes. The following is a matrix profiling a few
comparable jurisdictions with existing programs:
20 Bike Sharing in the United States: State of the Practice and Guide to Implementation. Federal Highway Administration. United
States Department of Transportation. September 2012. 21 Figures presented correspond to the most updated program numbers as of Spring 2013.
Cleveland Bike Share Feasibility Study │9
LARGE SCALE SYSTEMS MEDIUM-SCALE SYSTEMS SMALL SCALE
DC/Arlington Minneapolis Boston Denver Chattanooga
System Name Capital Bikeshare Nice Ride Hubway Denver B-Cycle Bike Chattanooga
Web Address capitalbikeshare.com niceridemn.org thehubway.com denver.bcycle.com bikechattanooga.com
Start Date 20-Sep-10 10-Jun-10 28-Jul-11 22-Apr-10 23-Jul-12
Number of Bikes 1,408 1,328 700 550 250
Number of Stations 140 146 80 53 31
Bikes per station 10.1 9.1 8.8 10.4 8.1
Service Area (Sq. Mi.) 42.3 34.3 21.9 12.6 2
Station Density 3.3 4.3 3.7 4.2 15.2
Functional Service area (Sq. Mi.)
59.3 69.7 21.9 24.3 2
Functional Station Density 2.4 2.1 3.7 2.2 15.2
Core Operating Area22 (Sq. Mi.)
4.1 2.5 2.3 8.9 2
Core Operating Stations 32 25 17 42 31
Core Station Density 7.9 9.8 7.4 4.7 15.2
Casual Membership 134,495 54,000 61,181 4,100 5,054
Annual Membership 17,048 3,500 6,133 2,750 566
Annual Subscriber Trips 1,676,811 170,197 349,960 131,176 8,754
Annual Casual Trips 372,765 103,850 159,671 75,798 8,555
Total Annual Trips 2,049,576 274,047 509,631 206,974 17,309
Annual Trips per Bike 1,456 206 728 376 69
Annual Trips per member (casual)
2.8 1.9 2.6 18.5 1.7
Annual Trips per member (annual)
98.4 48.6 57.1 47.7 15.5
Average Trips per Day 5,615 1,263 2,123 745 47
Average Trips per Bike per Day 4 1 3 1.4 0.2
Farebox Recovery 97% 39% 88% 54% 15%
Membership
Annual Membership $75.00 $60.00 $85.00 $65.00 $75.00
30 Day Membership $25.00 $30.00 $30.00 -
Weekly Membership $20.00 -
3 Day Membership $15.00 $12.00 -
Daily Casual $7.00 $5.00 $5.00 $6.00 $6.00
First Half-Hour $0.00 $0.00 $0.00 $0.00 $5.00
Second Half-Hour $1.50 $1.50 $1.50 $1.00 $10.00
Third Half-Hour $4.50 $4.50 $4.50 $4.00 $15.00
Reported Bike Share Thefts 9 0 0 7 0
Reported Bike Share Crash 14 2 0 1 0
Operating Practices
Year-Round Seasonal Seasonal Seasonal Year-Round
24 hrs. a day (Closed Nov-Mar) (Closed Dec-Mar) (Closed Dec-Mar) 24 hrs. a day
24 hrs. a day 24 hrs. a day 24hrs a day 5 am - Midnight 24 hrs. a day
Days Operating 2012 365 217 240 278 365
Average Summer Temp 78⁰ F 72⁰ F 72⁰ F 69⁰ F 80⁰ F
Average Winter Temp 38⁰ F 19⁰ F 32⁰ F 32⁰ F 41⁰ F
Average Monthly Precipitation
Summer (inches) 3.48 4.2 3.49 1.91 4.91
Average Monthly Precipitation
Winter (onches) 2.86 0.96 3.51 0.73 4.9
Equipment ownership Jurisdiction owned Non-profit owned Jurisdiction owned Non-profit owned Jurisdiction owned
Business Model Municipally Owned/
Managed Non-Profit
Municipally owned with
Advertising and
Sponsorship Concession
with profit sharing
Non-Profit Municipally Owned/
Managed
Table 1 - Existing Program Profiles23
22 Core operating area is calculated based on measurement of the number of stations in the downtown or “heart” of the system based on
system distribution overall.
23 Figures as of Spring 2013
Cleveland Bike Share Feasibility Study │10
In addition, Cleveland should be aware of other bike share initiatives in other cities in Ohio, as detailed
below:
Cincinnati: To improve transportation connections and address needs for increased bicycle infrastructure in the
Cincinnati Bicycle Transportation Plan of 2010, the City conducted a study looking into the feasibility of a
bike share program in 2011. The study found a program to be feasible, and the City proposed a phased
approach with an initial 21 station/210 bike/360 dock deployment for downtown Cincinnati. Additionally a
Phase 2 was proposed for Uptown Cincinnati that would include an additional 14 stations/140 bikes/240
docks.
For the purposes of funding the program, Cincinnati has looked into allowing advertising on bike sharing
stations. However local regulations limit the amount and type of advertising kiosks, as well as the location
where they can be deployed. Advertising on the bicycles is allowed as they are mobile, however, further
discussions are being held in order to identify other issues. To date, the State of Ohio has not provided any
funding to bike share development or implementation.
The nonprofit organization Cincy Bike Share Inc. was created to oversee the program and a subcontractor
has been chosen to perform the tasks related to station site selection, obtaining permits, procuring the
equipment, installing the stations, marketing the program and managing operations. The intention is to
open the program by Spring 2014.
Columbus: Initial discussion regarding implementing a bike share
program began officially in 2011 because of a strong
interest from the Mayor’s Office to make Columbus one
of the top cities for expansive, safe bike infrastructure.
In 2012, a brief feasibility study was conducted and
recommended a 30 station/300 bike system initially,
with potential for expansion to 60 stations/600 bikes.
Later that year, the Department of Parks and
Recreation put together the first draft map of potential
bike share locations.
The bike share system is funded 100% by the City of
Columbus. The Central Ohio Transit Agency (COTA) has
been supportive of the planning and implementation of
the program. The City continues to look for a key
sponsor in the high, medium, and low ranges. Overall,
public institutions have been very supportive of the
development of bike share.
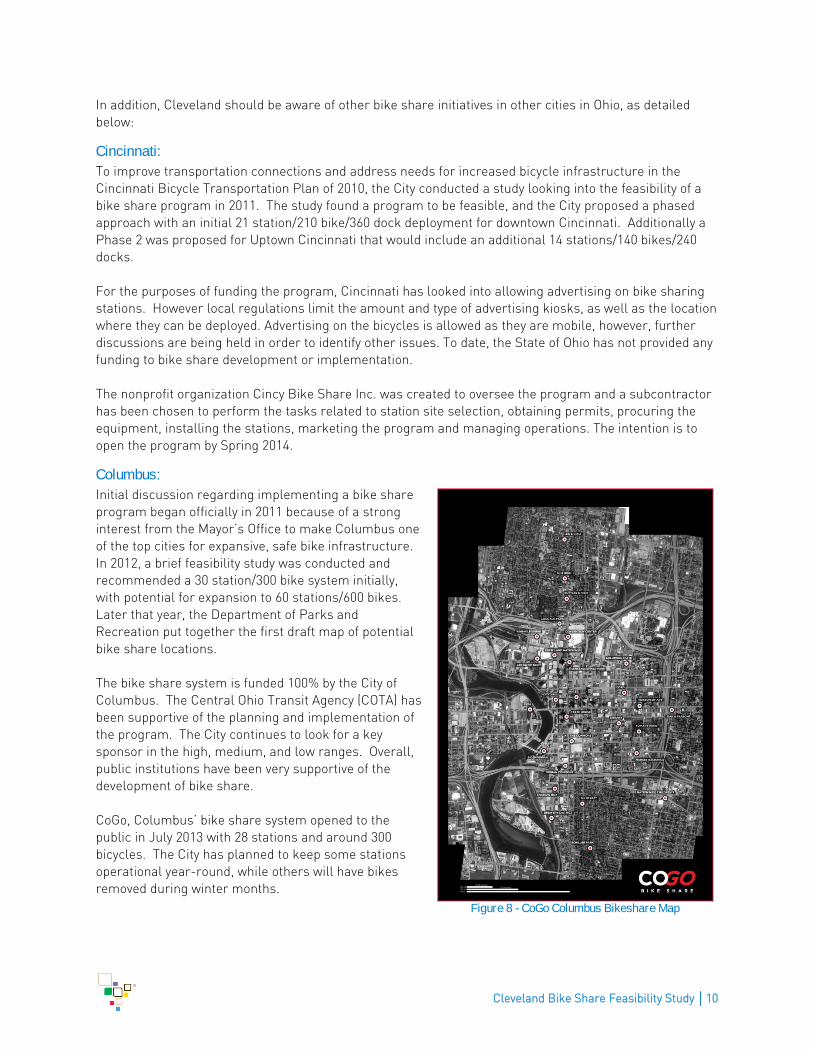
CoGo, Columbus’ bike share system opened to the
public in July 2013 with 28 stations and around 300
bicycles. The City has planned to keep some stations
operational year-round, while others will have bikes
removed during winter months.
Figure 8 - CoGo Columbus Bikeshare Map
Cleveland Bike Share Feasibility Study │11
Pittsburgh To complement the existing transit infrastructure and complete short and frequent trips between transit
stations located throughout the East, North and South sides of the city, the City of Pittsburgh embarked on
a bike share feasibility study in Fall of 2011. The study conducted by Heinz College found that a program
of 15-40 bike share stations was feasible for the city. This study was further refined in 2012 when the city
contracted a new study which found the city could sustain a program of 40 bike share stations.
The city created the Pittsburgh Bike Share Partnership (PBSP), a nonprofit organization from an alliance
of the City of Pittsburgh, Walnut Capital Management, and BikePGH to administer the program. Together
with a private vendor, the City is planning to launch a 50 station/500 bike network in Pittsburgh in Summer
2014. The system will be funded through public and private sources, as well as the revenue generated
from membership and usage fees.
Cleveland Bike Share Feasibility Study │12
Existing Conditions The first stage of assessing the feasibility of a bike share system is evaluating current conditions in
Cleveland.
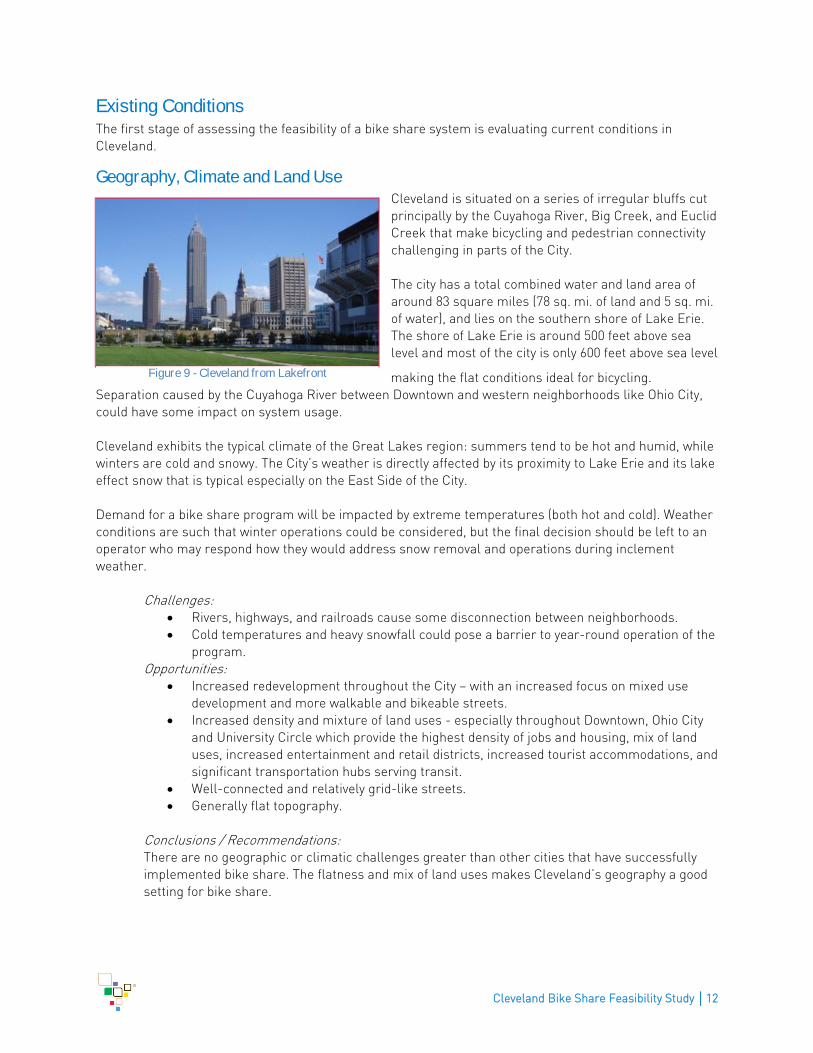
Geography, Climate and Land Use Cleveland is situated on a series of irregular bluffs cut
principally by the Cuyahoga River, Big Creek, and Euclid
Creek that make bicycling and pedestrian connectivity
challenging in parts of the City.
The city has a total combined water and land area of
around 83 square miles (78 sq. mi. of land and 5 sq. mi.
of water), and lies on the southern shore of Lake Erie.
The shore of Lake Erie is around 500 feet above sea
level and most of the city is only 600 feet above sea level
making the flat conditions ideal for bicycling.
Separation caused by the Cuyahoga River between Downtown and western neighborhoods like Ohio City,
could have some impact on system usage.
Cleveland exhibits the typical climate of the Great Lakes region: summers tend to be hot and humid, while
winters are cold and snowy. The City’s weather is directly affected by its proximity to Lake Erie and its lake
effect snow that is typical especially on the East Side of the City.
Demand for a bike share program will be impacted by extreme temperatures (both hot and cold). Weather
conditions are such that winter operations could be considered, but the final decision should be left to an
operator who may respond how they would address snow removal and operations during inclement
weather.
Challenges: Rivers, highways, and railroads cause some disconnection between neighborhoods. Cold temperatures and heavy snowfall could pose a barrier to year-round operation of the
program. Opportunities:
Increased redevelopment throughout the City – with an increased focus on mixed use
development and more walkable and bikeable streets.
Increased density and mixture of land uses - especially throughout Downtown, Ohio City
and University Circle which provide the highest density of jobs and housing, mix of land
uses, increased entertainment and retail districts, increased tourist accommodations, and
significant transportation hubs serving transit.
Well-connected and relatively grid-like streets.
Generally flat topography.
Conclusions / Recommendations: There are no geographic or climatic challenges greater than other cities that have successfully
implemented bike share. The flatness and mix of land uses makes Cleveland’s geography a good
setting for bike share.
Figure 9 - Cleveland from Lakefront
Cleveland Bike Share Feasibility Study │13
Demographics and Employment Bike share demand is primarily influenced by the density and mix of land uses. The city of Cleveland has
numerous neighborhoods where the mix and proximity of population and employment are ideally suited for
short bike sharing trips. Downtown, University Circle, Ohio City and Midtown are neighborhoods with
above average density and a solid mix of housing and jobs.
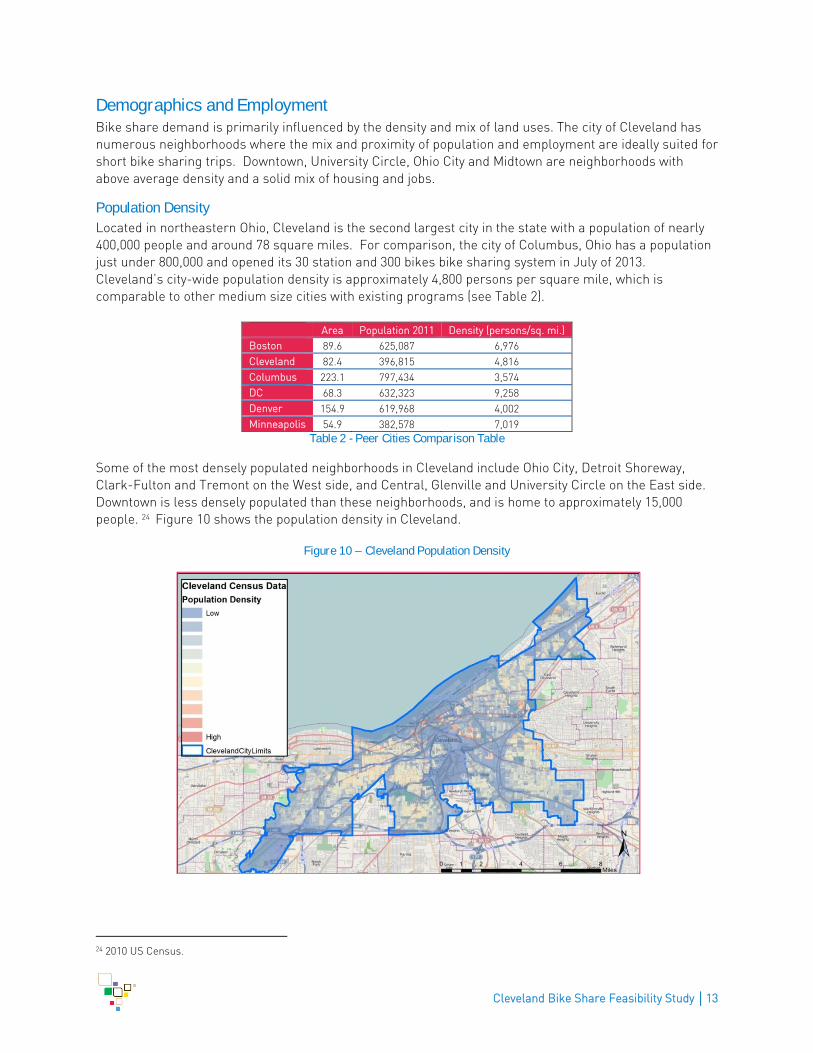
Population Density Located in northeastern Ohio, Cleveland is the second largest city in the state with a population of nearly
400,000 people and around 78 square miles. For comparison, the city of Columbus, Ohio has a population
just under 800,000 and opened its 30 station and 300 bikes bike sharing system in July of 2013.
Cleveland’s city-wide population density is approximately 4,800 persons per square mile, which is
comparable to other medium size cities with existing programs (see Table 2).
Area Population 2011 Density (persons/sq. mi.)
Boston 89.6 625,087 6,976
Cleveland 82.4 396,815 4,816
Columbus 223.1 797,434 3,574
DC 68.3 632,323 9,258
Denver 154.9 619,968 4,002
Minneapolis 54.9 382,578 7,019
Table 2 - Peer Cities Comparison Table
Some of the most densely populated neighborhoods in Cleveland include Ohio City, Detroit Shoreway,
Clark-Fulton and Tremont on the West side, and Central, Glenville and University Circle on the East side.
Downtown is less densely populated than these neighborhoods, and is home to approximately 15,000
people. 24 Figure 10 shows the population density in Cleveland.
Figure 10 – Cleveland Population Density
24 2010 US Census.
Cleveland Bike Share Feasibility Study │14
33.44%
52.47%9.96%
0.25%
1.82%
0.02%
0.15%
1.89%
White alone
Black or African American alone
Hispanic or Latino
American Indian and Alaska Native alone
Asian alone
Native Hawaiian and Other Pacific Islander alone
Some Other Race alone
Two or More Races
‐20,000 ‐15,000 ‐10,000 ‐5,000 0 5,000 10,000 15,000 20,000
Under 5 years
5 to 9 years
10 to 14 years
15 to 19 years
20 to 24 years
25 to 29 years
30 to 34 years
35 to 39 years
40 to 44 years
45 to 49 years
50 to 54 years
55 to 59 years
60 to 64 years
65 to 69 years
70 to 74 years
75 to 79 years
80 to 84 years
85 years and over
Male Female
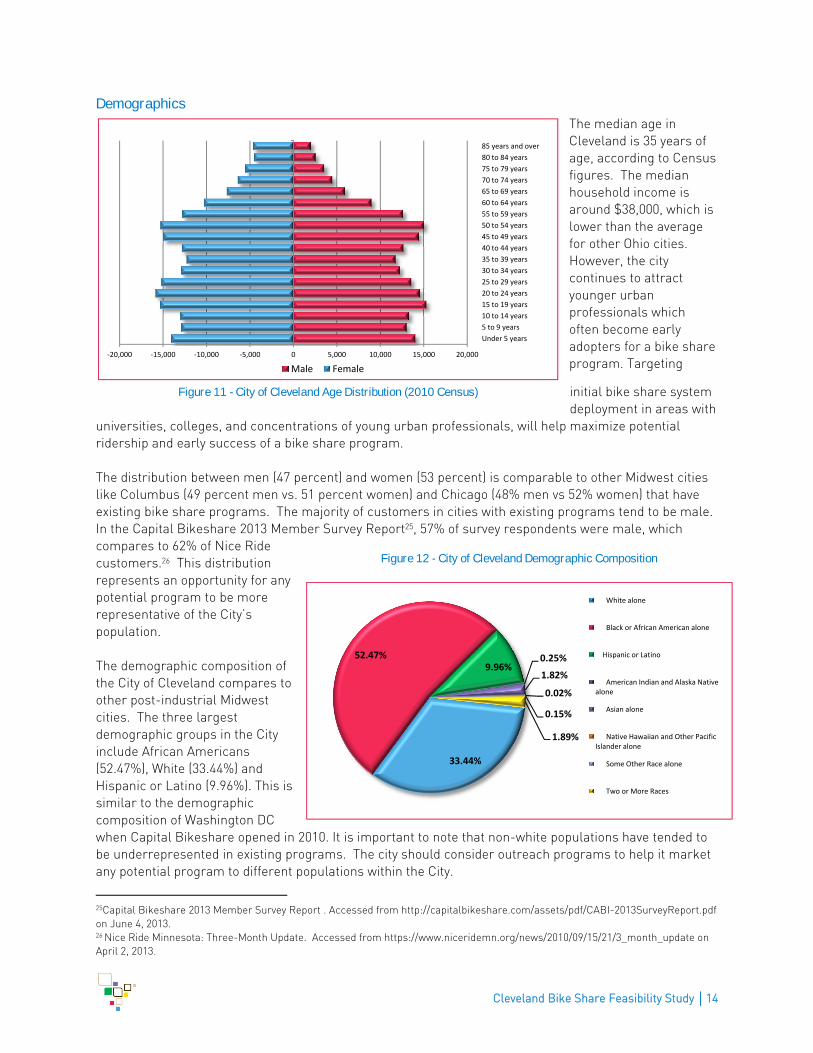
Demographics The median age in
Cleveland is 35 years of
age, according to Census
figures. The median
household income is
around $38,000, which is
lower than the average
for other Ohio cities.
However, the city
continues to attract
younger urban
professionals which
often become early
adopters for a bike share
program. Targeting
initial bike share system
deployment in areas with
universities, colleges, and concentrations of young urban professionals, will help maximize potential
ridership and early success of a bike share program.
The distribution between men (47 percent) and women (53 percent) is comparable to other Midwest cities
like Columbus (49 percent men vs. 51 percent women) and Chicago (48% men vs 52% women) that have
existing bike share programs. The majority of customers in cities with existing programs tend to be male.
In the Capital Bikeshare 2013 Member Survey Report25, 57% of survey respondents were male, which
compares to 62% of Nice Ride
customers.26 This distribution
represents an opportunity for any
potential program to be more
representative of the City’s
population.
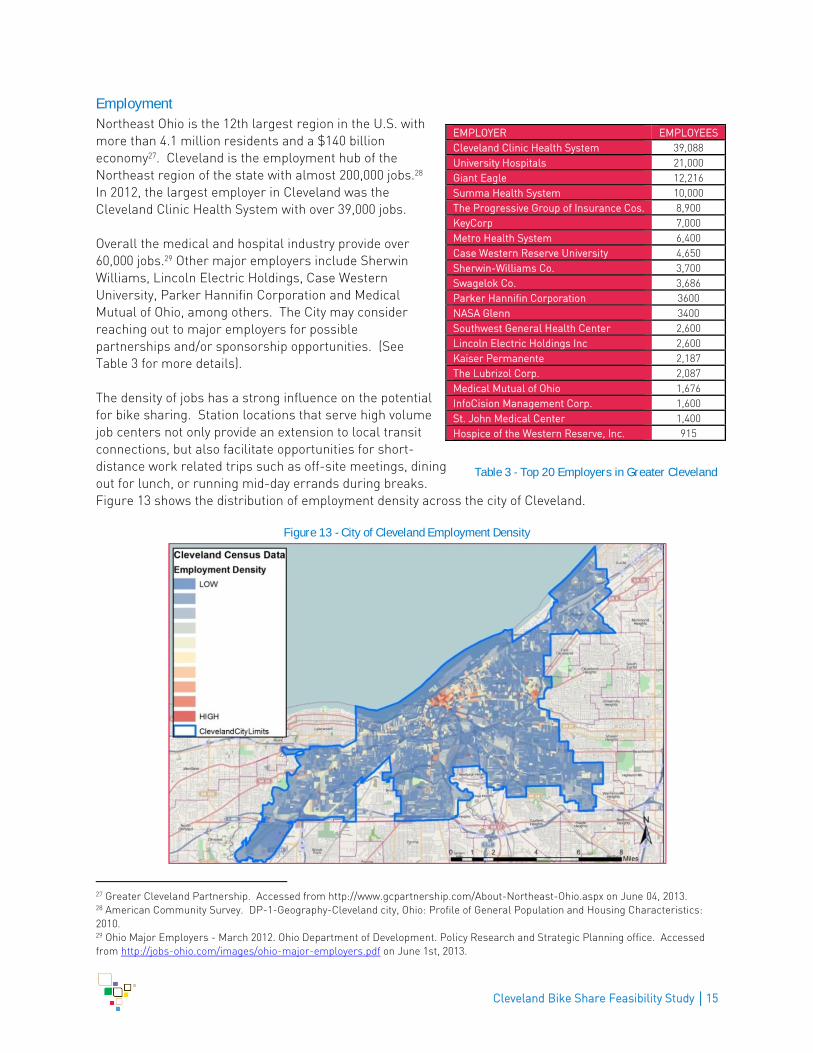
The demographic composition of
the City of Cleveland compares to
other post-industrial Midwest
cities. The three largest
demographic groups in the City
include African Americans
(52.47%), White (33.44%) and
Hispanic or Latino (9.96%). This is
similar to the demographic
composition of Washington DC
when Capital Bikeshare opened in 2010. It is important to note that non-white populations have tended to
be underrepresented in existing programs. The city should consider outreach programs to help it market
any potential program to different populations within the City.
25Capital Bikeshare 2013 Member Survey Report . Accessed from http://capitalbikeshare.com/assets/pdf/CABI-2013SurveyReport.pdf
on June 4, 2013. 26 Nice Ride Minnesota: Three-Month Update. Accessed from https://www.niceridemn.org/news/2010/09/15/21/3_month_update on
April 2, 2013.
Figure 12 - City of Cleveland Demographic Composition
Figure 11 - City of Cleveland Age Distribution (2010 Census)
Cleveland Bike Share Feasibility Study │15
Employment Northeast Ohio is the 12th largest region in the U.S. with
more than 4.1 million residents and a $140 billion
economy27. Cleveland is the employment hub of the
Northeast region of the state with almost 200,000 jobs.28
In 2012, the largest employer in Cleveland was the
Cleveland Clinic Health System with over 39,000 jobs.
Overall the medical and hospital industry provide over
60,000 jobs.29 Other major employers include Sherwin
Williams, Lincoln Electric Holdings, Case Western
University, Parker Hannifin Corporation and Medical
Mutual of Ohio, among others. The City may consider
reaching out to major employers for possible
partnerships and/or sponsorship opportunities. (See
Table 3 for more details).
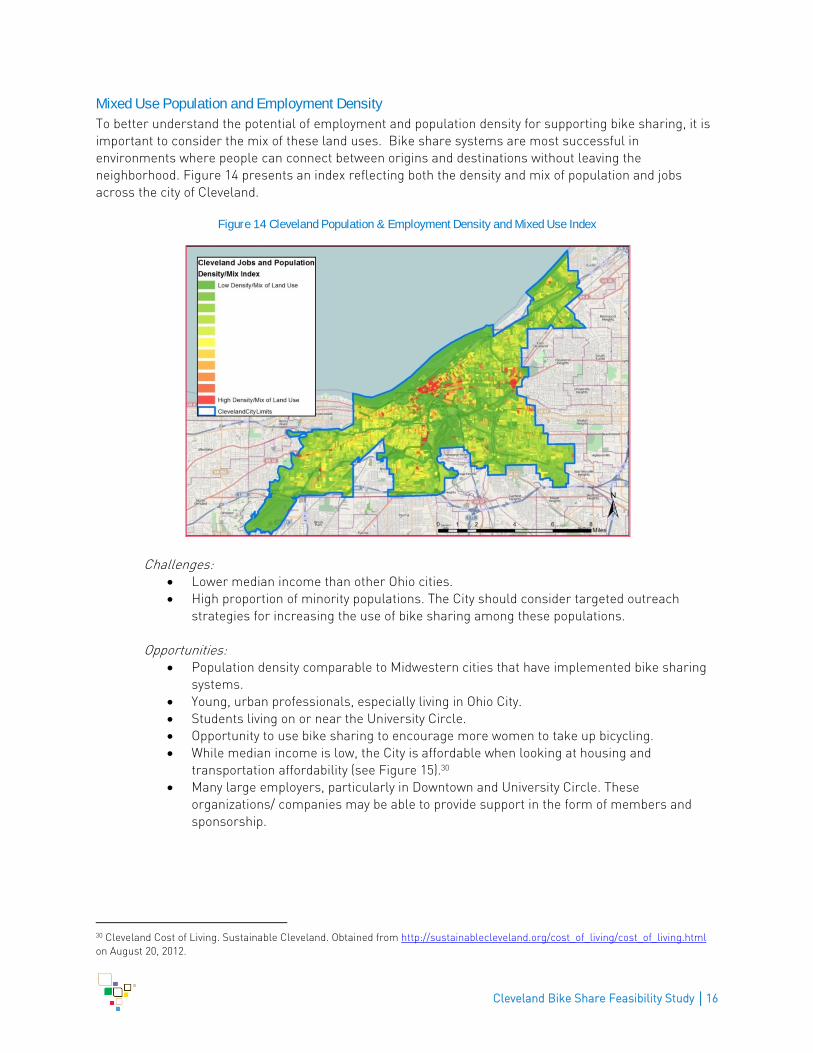
The density of jobs has a strong influence on the potential
for bike sharing. Station locations that serve high volume
job centers not only provide an extension to local transit
connections, but also facilitate opportunities for short-
distance work related trips such as off-site meetings, dining
out for lunch, or running mid-day errands during breaks.
Figure 13 shows the distribution of employment density across the city of Cleveland.
Figure 13 - City of Cleveland Employment Density
27 Greater Cleveland Partnership. Accessed from http://www.gcpartnership.com/About-Northeast-Ohio.aspx on June 04, 2013. 28 American Community Survey. DP-1-Geography-Cleveland city, Ohio: Profile of General Population and Housing Characteristics:
2010. 29 Ohio Major Employers - March 2012. Ohio Department of Development. Policy Research and Strategic Planning office. Accessed
from http://jobs-ohio.com/images/ohio-major-employers.pdf on June 1st, 2013.
EMPLOYER EMPLOYEES
Cleveland Clinic Health System 39,088
University Hospitals 21,000
Giant Eagle 12,216
Summa Health System 10,000
The Progressive Group of Insurance Cos. 8,900
KeyCorp 7,000
Metro Health System 6,400
Case Western Reserve University 4,650
Sherwin-Williams Co. 3,700
Swagelok Co. 3,686
Parker Hannifin Corporation 3600
NASA Glenn 3400
Southwest General Health Center 2,600
Lincoln Electric Holdings Inc 2,600
Kaiser Permanente 2,187
The Lubrizol Corp. 2,087
Medical Mutual of Ohio 1,676
InfoCision Management Corp. 1,600
St. John Medical Center 1,400
Hospice of the Western Reserve, Inc. 915
Table 3 - Top 20 Employers in Greater Cleveland
Cleveland Bike Share Feasibility Study │16
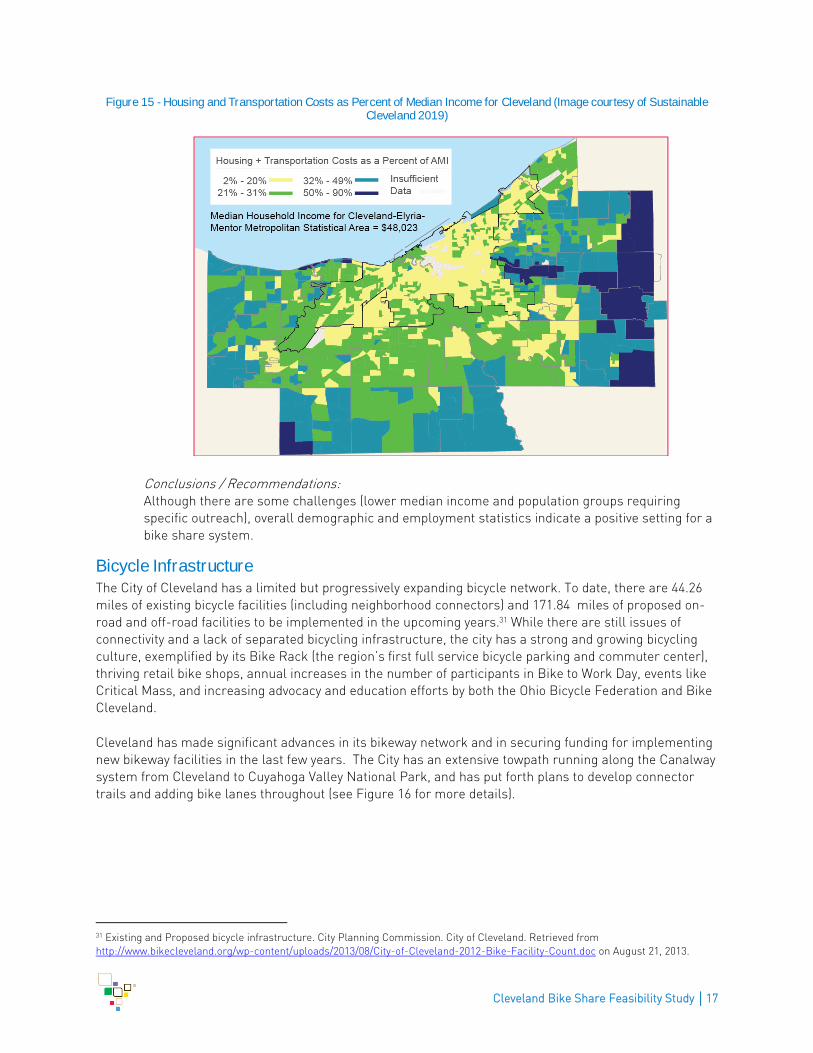
Mixed Use Population and Employment Density To better understand the potential of employment and population density for supporting bike sharing, it is
important to consider the mix of these land uses. Bike share systems are most successful in
environments where people can connect between origins and destinations without leaving the
neighborhood. Figure 14 presents an index reflecting both the density and mix of population and jobs
across the city of Cleveland.
Figure 14 Cleveland Population & Employment Density and Mixed Use Index
Challenges:
Lower median income than other Ohio cities.
High proportion of minority populations. The City should consider targeted outreach
strategies for increasing the use of bike sharing among these populations.
Opportunities: Population density comparable to Midwestern cities that have implemented bike sharing
systems. Young, urban professionals, especially living in Ohio City.
Students living on or near the University Circle.
Opportunity to use bike sharing to encourage more women to take up bicycling.
While median income is low, the City is affordable when looking at housing and
transportation affordability (see Figure 15).30
Many large employers, particularly in Downtown and University Circle. These
organizations/ companies may be able to provide support in the form of members and
sponsorship.
30 Cleveland Cost of Living. Sustainable Cleveland. Obtained from http://sustainablecleveland.org/cost_of_living/cost_of_living.html
on August 20, 2012.
Cleveland Bike Share Feasibility Study │17
Figure 15 - Housing and Transportation Costs as Percent of Median Income for Cleveland (Image courtesy of Sustainable Cleveland 2019)
Conclusions / Recommendations: Although there are some challenges (lower median income and population groups requiring
specific outreach), overall demographic and employment statistics indicate a positive setting for a
bike share system.
Bicycle Infrastructure The City of Cleveland has a limited but progressively expanding bicycle network. To date, there are 44.26
miles of existing bicycle facilities (including neighborhood connectors) and 171.84 miles of proposed on-
road and off-road facilities to be implemented in the upcoming years.31 While there are still issues of
connectivity and a lack of separated bicycling infrastructure, the city has a strong and growing bicycling
culture, exemplified by its Bike Rack (the region’s first full service bicycle parking and commuter center),
thriving retail bike shops, annual increases in the number of participants in Bike to Work Day, events like
Critical Mass, and increasing advocacy and education efforts by both the Ohio Bicycle Federation and Bike
Cleveland.
Cleveland has made significant advances in its bikeway network and in securing funding for implementing
new bikeway facilities in the last few years. The City has an extensive towpath running along the Canalway
system from Cleveland to Cuyahoga Valley National Park, and has put forth plans to develop connector
trails and adding bike lanes throughout (see Figure 16 for more details).
31 Existing and Proposed bicycle infrastructure. City Planning Commission. City of Cleveland. Retrieved from
http://www.bikecleveland.org/wp-content/uploads/2013/08/City-of-Cleveland-2012-Bike-Facility-Count.doc on August 21, 2013.
Cleveland Bike Share Feasibility Study │18
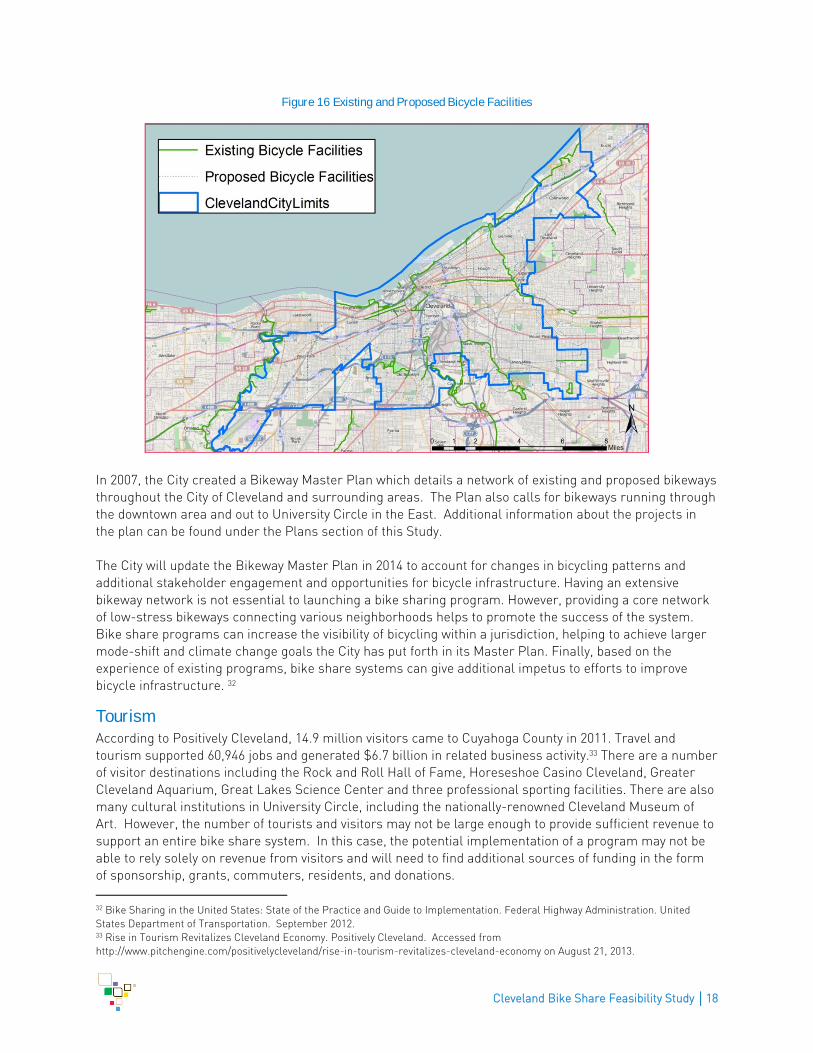
Figure 16 Existing and Proposed Bicycle Facilities
In 2007, the City created a Bikeway Master Plan which details a network of existing and proposed bikeways
throughout the City of Cleveland and surrounding areas. The Plan also calls for bikeways running through
the downtown area and out to University Circle in the East. Additional information about the projects in
the plan can be found under the Plans section of this Study.
The City will update the Bikeway Master Plan in 2014 to account for changes in bicycling patterns and
additional stakeholder engagement and opportunities for bicycle infrastructure. Having an extensive
bikeway network is not essential to launching a bike sharing program. However, providing a core network
of low-stress bikeways connecting various neighborhoods helps to promote the success of the system.
Bike share programs can increase the visibility of bicycling within a jurisdiction, helping to achieve larger
mode-shift and climate change goals the City has put forth in its Master Plan. Finally, based on the
experience of existing programs, bike share systems can give additional impetus to efforts to improve
bicycle infrastructure. 32
Tourism According to Positively Cleveland, 14.9 million visitors came to Cuyahoga County in 2011. Travel and
tourism supported 60,946 jobs and generated $6.7 billion in related business activity.33 There are a number
of visitor destinations including the Rock and Roll Hall of Fame, Horeseshoe Casino Cleveland, Greater
Cleveland Aquarium, Great Lakes Science Center and three professional sporting facilities. There are also
many cultural institutions in University Circle, including the nationally-renowned Cleveland Museum of
Art. However, the number of tourists and visitors may not be large enough to provide sufficient revenue to
support an entire bike share system. In this case, the potential implementation of a program may not be
able to rely solely on revenue from visitors and will need to find additional sources of funding in the form
of sponsorship, grants, commuters, residents, and donations.
32 Bike Sharing in the United States: State of the Practice and Guide to Implementation. Federal Highway Administration. United
States Department of Transportation. September 2012. 33 Rise in Tourism Revitalizes Cleveland Economy. Positively Cleveland. Accessed from
http://www.pitchengine.com/positivelycleveland/rise-in-tourism-revitalizes-cleveland-economy on August 21, 2013.
Cleveland Bike Share Feasibility Study │19
Neighborhood Connections There are numerous thriving neighborhoods throughout Cleveland where bicycling is already a popular
transportation choice. A bike share system will need to be supported by safe convenient connections
within and between these neighborhoods, including overcoming barriers such as freeways, railroads, and
river corridors that often separate and disconnect these communities.
Challenges: Identification of bicycle network gaps and linking bike share to a network of bicycle
facilities.
Funding for completion and maintenance of growing bicycle network facilities.
Need to develop and increase the number of visitors to Cleveland to increase tourist
related revenues for the bike share program.
Outdated plans and guidelines for bicycle infrastructure.
Making strong connections between neighborhoods.
Opportunities:
Change in bicycling culture – with increasing bicycling trends.
Additional investment in alternative forms of transportation.
Marketing Bike Share as an attractive option for tourists.
Focus on connections to the transit network.
Strategic station placement to support key tourist destinations.
Neighborhood engagement for station planning.
Conclusions / Recommendations: It is recommended that the City take the following steps to prepare for a potential bike share
program. These steps can be taken while moving forward on other aspects of bike share:
Partner with convention and tourism agencies such as Positively Cleveland to capitalize
on the common goal of positioning Cleveland as an exciting destination for active tourism,
and help increase tourist related revenue for a potential program.
Engage neighborhood groups to provide input to site station locations at key destinations
with an emphasis on proximity to quality bicycling routes.
Undertake an update of the city bicycle plan with station planning to address key issues
and gaps identified during the system planning process and identify infrastructure and
funding strategies that are consistent with the growing popularity of bicycle transportation
in Cleveland.
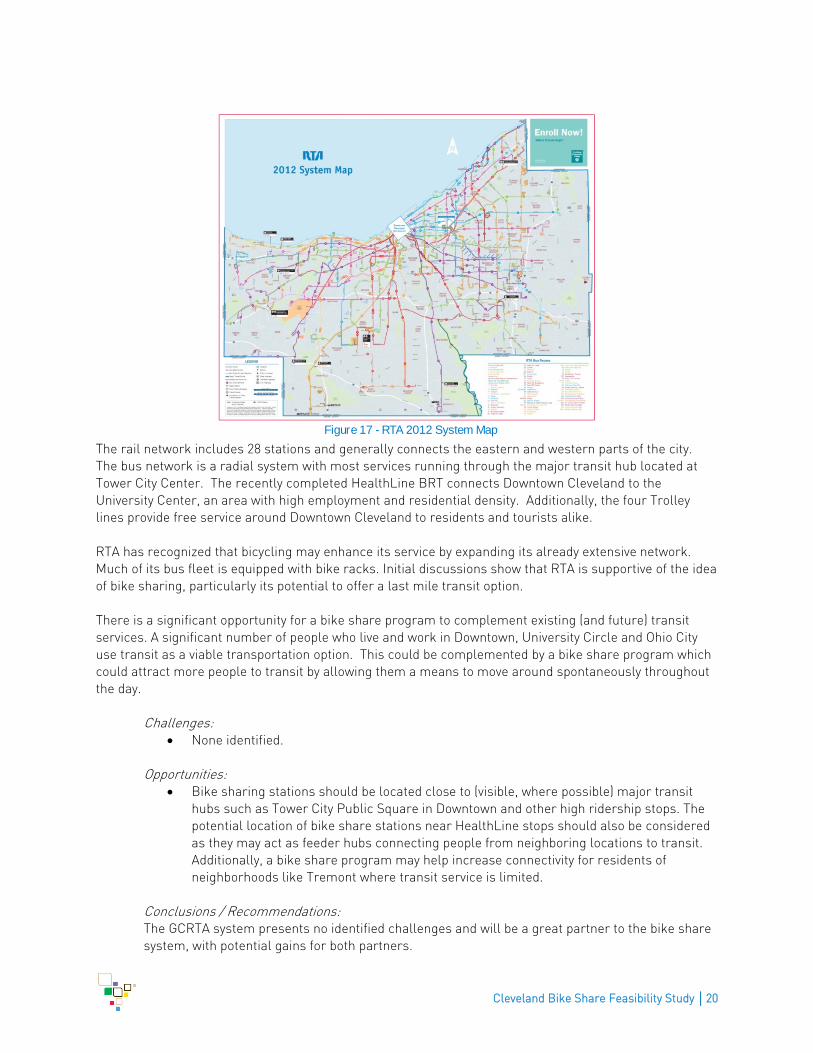
Public Transit Public transit in Cleveland is composed of four services: Rail, Bus, HealthLine Bus Rapid Transit (BRT) and
the Trolley, all of which are under supervision of the Greater Cleveland Regional Transit Authority (RTA).
RTA operates services along the routes shown on Figure 17 and recorded approximately 48.2 million rides
in 2012, an increase of more than 2 million rides over the previous year. 34
34 Greater Cleveland Regional Transit Authority. 2012 Annual Report. Accessed from http://www.riderta.com/annual/2012 on June 5,
2013.
Cleveland Bike Share Feasibility Study │20
The rail network includes 28 stations and generally connects the eastern and western parts of the city.
The bus network is a radial system with most services running through the major transit hub located at
Tower City Center. The recently completed HealthLine BRT connects Downtown Cleveland to the
University Center, an area with high employment and residential density. Additionally, the four Trolley
lines provide free service around Downtown Cleveland to residents and tourists alike.
RTA has recognized that bicycling may enhance its service by expanding its already extensive network.
Much of its bus fleet is equipped with bike racks. Initial discussions show that RTA is supportive of the idea
of bike sharing, particularly its potential to offer a last mile transit option.
There is a significant opportunity for a bike share program to complement existing (and future) transit
services. A significant number of people who live and work in Downtown, University Circle and Ohio City
use transit as a viable transportation option. This could be complemented by a bike share program which
could attract more people to transit by allowing them a means to move around spontaneously throughout
the day.
Challenges: None identified.
Opportunities: Bike sharing stations should be located close to (visible, where possible) major transit
hubs such as Tower City Public Square in Downtown and other high ridership stops. The
potential location of bike share stations near HealthLine stops should also be considered
as they may act as feeder hubs connecting people from neighboring locations to transit.
Additionally, a bike share program may help increase connectivity for residents of
neighborhoods like Tremont where transit service is limited.
Conclusions / Recommendations: The GCRTA system presents no identified challenges and will be a great partner to the bike share
system, with potential gains for both partners.
Figure 17 - RTA 2012 System Map
Cleveland Bike Share Feasibility Study │21
Plans, Regulations and Existing Organizational Capacity There are a number of plans, policies and statutory regulations that will impact the operation of a bike
share program in any community. Plans and policies can be important measures of program compatibility
with local initiatives, such as goals for encouraging healthy and active transportation, reduced greenhouse
gas emissions, or providing low cost transportation options among transit-dependent populations.
A number of current plans and policy initiatives in the city of Cleveland provide support for the potential of
bike sharing in the city.
Plans The following is a review of existing and future bicycle infrastructure related plans and policies that may
influence the implementation of a bike share program in the City of Cleveland.
Connecting Cleveland 2020 Citywide Plan The Connecting Cleveland 2020 Citywide Plan is the comprehensive plan for the City of Cleveland.
It establishes the vision for the City in the future in such aspects as housing, economic
development, sustainability, and transportation. With regards to transportation, the Plan calls for
increased safety and a city and regional bicycle network. The Plan also calls for integrating
bicycling as a more routine part of Cleveland’s transportation practices.
The plan calls for increased bicycling infrastructure and facilities around the city in addition to the
proper maintenance of these facilities. Specifics about bicycle facilities are not addressed in the
plan, other than to provide secure bicycle parking at City buildings and parks.
Transit 2025: The Long Range Plan of the Greater Cleveland Regional Transit Authority The Transit 2025 plan reflects the Regional Transportation Authority’s (RTA) major transportation
investments and provides the most realistic look at RTA’s future. The Plan also incorporates
ideas from other organizations including the Northeast Ohio Area-wide Coordinating Agency
(NOACA), the Ohio Department of Transportation, Cuyahoga County, the City of Cleveland, and the
Cleveland Neighborhood Development Corporation.
The plan calls for making all new RTA buses bike accessible, incorporating pedestrian- and
bicycle-friendly street design, and promoting bicycle access and bike-friendly facilities in TOD site
designs. The plan does not mention anything specific about bicycle facilities.
Cleveland Bikeway Master Plan The Cleveland Bikeway Master Plan details a network of existing and proposed bikeways
throughout the City of Cleveland and surrounding areas. Existing and planned bikeways identified
in the plan that run through the downtown area and out to University Circle include:
Cleveland Lakefront Bikeway – A 17-mile bikeway that follows the Lake Erie shoreline
from Lakewood to Euclid.
Euclid Avenue Bike Lanes – In 2008, bike lanes were added on Euclid Avenue from East
22nd Street to Adelbert Road. These bike lanes connect Downtown Cleveland and
Cleveland State University to University Circle and Case Western Reserve University.
Ohio and Erie Canal Towpath Trail – This trail follows the Ohio and Erie Canals from
Lower Harvard Avenue up to Canal Basin Park. The full trail is scheduled to be completed
in 2014.
City Loop Trail – This partially-completed 29-mile trail that circles downtown Cleveland.
Cleveland Bike Share Feasibility Study │22
Lake to Lakes Trail – This partially-completed trail connects Lake Erie to the Shaker
Lakes on a path that goes through Rockefeller Park and University Circle.
There are also various bike lanes and sharrows both existing and proposed throughout the city.
Additionally, a downtown bike station was built in 2011 as part of the Bikeway Master Plan. This
station is owned and operated by the Downtown Cleveland Alliance and features bicycle parking,
repair, rental, shower and locker facilities. The Bikeway Master Plan does not detail any other
future bicycle facilities.
Cleveland Downtown Lakefront Plan The Cleveland Downtown Lakefront Plan is a guide for mixed-use commercial development of the
waterfront between West 3rd and East 18th Streets. The Plan aims to create a “walkable, dense,
and mixed-use urban fabric” that can be used year-round. It focuses on the redevelopment of
three sites on the lakefront: the Harbor West District, the North Coast Harbor District, and the
Burke Redevelopment District.
While the plan calls for a number of new bicycle connections throughout the three development
sites downtown, it does not appear to specifically address bicycle facilities that may be
incorporated in these areas.
Policy and City Ordinances Bike share is a relatively new idea and the nature of the equipment and operations do not easily fit into the
existing framework for permitting and installation procedures. How the system is designed, owned and
operated will have a significant impact on the process for siting and permitting station locations.
Additionally the operational model for short term subscription-based memberships and potential
sponsorship and advertising agreements used to fund the system can be greatly constrained by local
policies and regulations governing permitted uses with public funding or within the public right-of-way.
There are several ordinances and regulations that could have an impact on the potential implementation
of a bike share system, and may require special attention to address:
Cleveland Complete and Green Streets Ordinance (Ordinance No. 798-11) In 2011, Cleveland City Council passed a Complete and Green Streets Ordinance that went in to
effect January 1, 2012. Complete Street guidelines were based on other city plans including the
Connecting Cleveland 2020 Citywide Plan and the Cleveland Bikeway Master Plan, although no
specifics are addressed in the Ordinance.
This ordinance may allow the City to include language in local regulations requiring all new
construction to consider bike sharing as part of new site planning.
City of Cleveland Zoning Code – Bicycle Parking (2008) (Section 457.10) This ordinance requires all parking lots and garages to provide bicycle parking spaces at a rate of
one bicycle parking space for each 20 automobile spaces provided. However, no automobile
parking lot or garage shall be required to provide more than 24 bicycle parking spaces.
This ordinance may enable the City to offer parking credits to those developers that provide capital
for the implementation of a bike share program, in lieu of providing automobile parking spaces in
new developments (bike share parking credits).
Cleveland Bike Share Feasibility Study │23
Regulations and Permitting The following section summarizes the permits and local regulations which may affect the implementation
of a bike sharing program.
Encroachment Permit An encroachment permit is required for any installation within the existing right of way (ROW).
This permit can be issued for either one year at a cost of $10 per location, or a permanent permit
consenting to the placement of “furniture” in existing ROW. Reviews of permits are conducted by
at least four City Departments and Committees. If a proposed bike share station under a yearly
permit is to be expanded, the permit will need to be revised. Additionally, all revenue earned from
stations “may” be subject to taxing from Cuyahoga County.
The permits have the potential to impact the use of sponsorship or advertising in funding the
system. It is unclear whether advertising would be permitted on the bikes themselves (given they
are “non-permanent”, movable objects). However an exception will be required to allow
advertising or sponsorship on the stations and other fixed infrastructure, as has been granted for
streetcar.
Related to the encroachment permitting, depending on the type of business and ownership model,
the City might consider permanent station locations as the permitting process tends to be easier
and avoid the annual review of permitting. Additionally, the City should consider the costs (if any)
of obtaining permits for utilizing the public Right of Way and any parking space losses that
implementing a bike share program might entail.
Cleveland City Code Chapter 473 – Bicycles and Motorcycles There are several local ordinances found in the Cleveland City Code that may apply to bike sharing
bicycles and users. These include restrictions on riding bicycles on sidewalks, licensing for rental
bicycles, and a number of restrictions and equipment requirements that apply to any motorized
bicycles35. At this time, it is not anticipated that the city of Cleveland will seek motorized or motor-
assisted bicycles for the program, and therefore these are not included in the study. However,
should the city determine the need to pursue motorized or motor-assisted bicycles for the system,
there will be a need to examine the constraints of city codes regulating motorized bicycles.
473.09 Riding on Sidewalks With exception of police, emergency medical, and fire personnel – bicycling, skateboarding and
roller skating is prohibited on sidewalks in business districts within the city of Cleveland. This
includes downtown and many neighborhood commercial districts in the city, locations where bike
sharing stations will be ideally located. This prohibition will place greater emphasis on the need
35Cleveland City Code Chapter 473 – Bicycles and Motorcycles 473.14 Motorized Bicycle Operation, Equipment and License
(a) No person shall operate a motorized bicycle upon any street or highway or any public or private property used by the public for
purposes of vehicular travel or parking unless all of the following conditions are met:
(1) The person is fourteen (14) or fifteen (15) years of age and holds a valid probationary motorized bicycle license issued after the
person has passed the test provided for in this section, or the person is sixteen (16) years of age or older and holds either a valid
commercial driver’s license issued under RC Chapter 4506 or a driver’s license issued under RC Chapter 4507 or a valid motorized
bicycle license issued after the person has passed the test provided for in this section, except that if a person is sixteen (16) years of
age, has a valid probationary motorized bicycle license and desires a motorized bicycle license, the person is not required to comply
with the testing requirements provided for in this section;
(2) The motorized bicycle is equipped in accordance with rules adopted by the Ohio Director of Public Safety and is in proper working
order;
(3) The person, if he or she is under eighteen (18) years of age, is wearing a protective helmet on his or her head with the chin strap
properly fastened, and the motorized bicycle is equipped with a rear-view mirror;
Cleveland Bike Share Feasibility Study │24
for safe on-street bicycling conditions in business districts, where less experienced bicyclists are
likely to prefer riding on the sidewalk to negotiating busy streets.
Some exceptions may be needed to accommodate access to bike stations, many of which are
likely to be sited on public right-of-way on or adjacent to sidewalks. There may need to be
additional signage or education to alert bike share users to the proper bicycling etiquette, and
regulations that need to be observed while using bike share.36
Challenges:
There are several local ordinances, including sponsorship restrictions on the
encroachment permits that may impact the ability to implement bike share in Cleveland.
Opportunities: Recent policies and plans show support for bicycle initiatives, indicating that overall
political support for the system will help overcome city ordinances that may be issues.
Conclusions / Recommendations:
Prior to undertaking system procurement, local agency staff should review the aforementioned
ordinances and regulations to prevent any potential conflicts which may affect the implementation
of a bike share program, with special attention to those regulations related to sponsorship /
advertising in the right of way.
Existing Organizational Capacity There is significant support among several stakeholders for bike share in Cleveland. One agency or
organization must ultimately be identified or formed to implement the system.
Challenges:
There is no single current organization that is yet identified to undertake the procurement
and the sponsorship for the system.
Opportunities: There is interest by various stakeholders in helping to create a non-profit organization
with limited funding to undertake procurement and funding of a system.
Conclusion / Recommendation: The Task Force should create a non-profit organization whose responsibility is to fund and
procure planning, operations and equipment for a bike share system.
(4) The person operates the motorized bicycle when practicable within three (3) feet of the right edge of the roadway obeying all traffic
rules applicable to vehicles; and
(5) The motorized bicycle displays on the rear of such bicycle the current license plate or validation sticker furnished by the Ohio
Director of Public Safety under RC 4503.191. Division (a)(5) of this section is not effective until the end of the first month of the
registration period in 1985 to which the motorized bicycle is assigned by the Ohio Registrar of Motor Vehicles as provided in RC
4503.101.
(b) No person operating a motorized bicycle shall carry another person upon the motorized bicycle.
Cleveland Bike Share Feasibility Study │25
Public Input and Stakeholder Engagement
Public Input This study effort included a number of strategies to engage the community about the potential for bike
sharing in Cleveland. The Bike Share Task Force was instrumental in helping to shape the engagement
approach and promote opportunities for input to their respective constituents within the community. The
focus of the engagement plan included a public meeting, targeted meetings with key stakeholders, an
online survey, and an interactive web-based mapping tool to gather feedback about desired station
locations for bike share.
Community Workshop A public meeting was held at the downtown Cleveland Library on April 29, 2013. The meeting was
attended by 38 stakeholders who were provided a presentation of the study purpose and preliminary
findings of the study effort. After the presentation, guests were invited to participate in a discussion
with project staff and Bike Share Task Force members who were on hand and asked to take 5 dot
stickers and make suggestions for locations they felt bike share stations would be most appropriate.
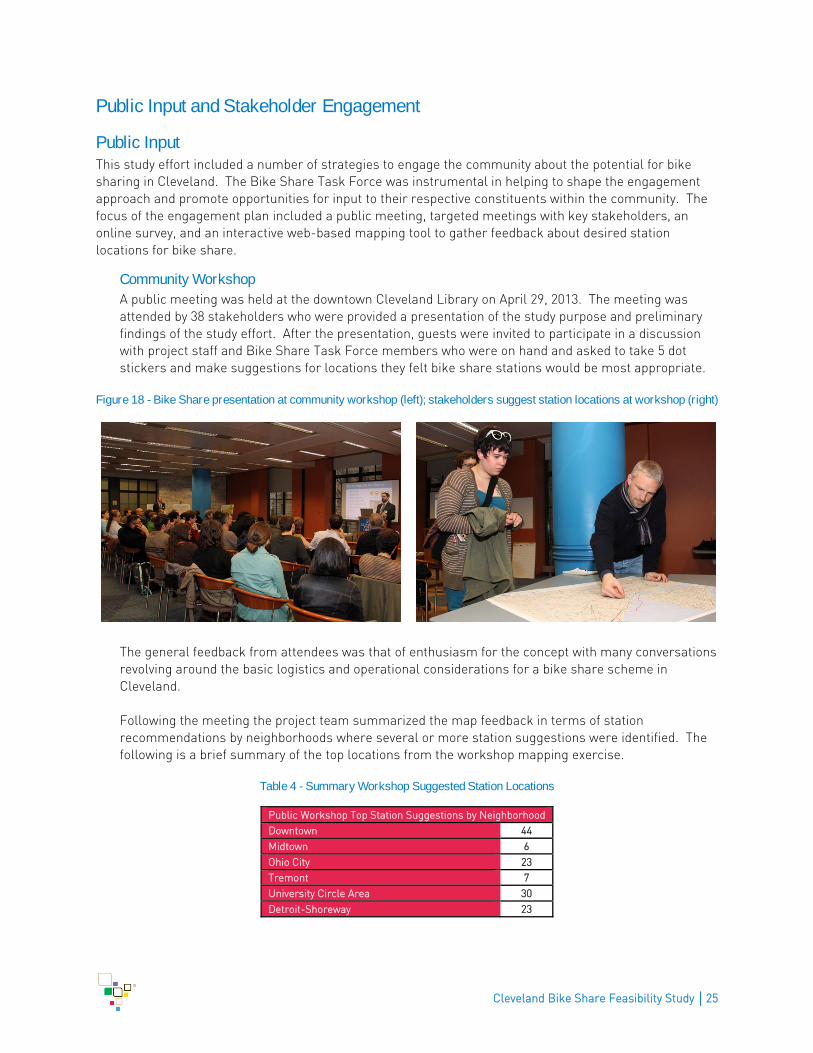
Figure 18 - Bike Share presentation at community workshop (left); stakeholders suggest station locations at workshop (right)
The general feedback from attendees was that of enthusiasm for the concept with many conversations
revolving around the basic logistics and operational considerations for a bike share scheme in
Cleveland.
Following the meeting the project team summarized the map feedback in terms of station
recommendations by neighborhoods where several or more station suggestions were identified. The
following is a brief summary of the top locations from the workshop mapping exercise.
Table 4 - Summary Workshop Suggested Station Locations
Public Workshop Top Station Suggestions by Neighborhood
Downtown 44
Midtown 6
Ohio City 23
Tremont 7
University Circle Area 30
Detroit-Shoreway 23
Cleveland Bike Share Feasibility Study │26
On-line Bike Share Survey On Tuesday, March 12, 2013, a brief survey was sent out to gauge Cleveland’s attitudes towards
bicycling and the possibility of bike sharing. The survey is broken down into three (3) major areas;
respondents current bicycle usage, respondents opinions on bike share feasibility, and demographic
and employment information. The City of Cleveland and the Bike Share Task Force sent out emails
and posted information to existing websites to direct people to the survey which was hosted by Survey
Gizmo. There were over 800 total responses from mid-March to early June, 2013.
Current Bicycle Usage The first four (4) questions asked respondents about their current bicycle usage. The questions
included:
Do you currently have access to a working bicycle? (78% yes)
Which of the following best characterizes your bicycling behavior? (79% seasonal versus
21% at all times of year/weather)
What types of trips do you currently use a bicycle for? (91% recreation, 48% social visits,
42% work, and 40% shopping).
How often do you ride a bicycle? (34% a few times/week, 30% a few times/month, and 13%
daily)
Since the survey went out primarily through organizations and individuals who support bicycling,
the number of respondents with access to a bicycle, usage, behavior, and trips is most likely
higher than the general population of the City of Cleveland and surrounding communities.
However, this information does display that there is a strong, growing bicycle culture within
Greater Cleveland.
Opinions on Bike Share Feasibility Eight (8) questions asked respondents their opinions regarding bike sharing. The questions
included:
Have you had an opportunity to use an existing bike share system before? (33% yes)
Do you think bike share is a good idea for the City of Cleveland? (95% yes)
If bike share were available throughout Cleveland, what types of trips do you think you
would use the bikes for? (61% errands, 51% shopping/dining, 50% exercise, 44% meeting
family and friends, 39% riding RTA, 34% going to meetings, and 33% going to work)
About how often do you think you would use bike share? (36% once a month, 31% once a
week, 12% other, 11% never, and 8% once a day)
What price would make you likely to subscribe to bike share in Cleveland? (Annual
Average - $76.29, Weekly Average - $16.59, and Daily Average - $8)
Additionally, two questions asked why bike share is a good or bad idea for the City of Cleveland.
The “good idea” responses ranged from promoting alternative modes of transportation, less car
dependency, better for the environment, increased livability, tourism attraction, healthy, less
expensive than other modal options, complements RTA, and the overall cool factor of having bike
sharing. The “bad idea” responses included the lack of a critical mass of bicycle riders or even
population density to support bike share, poor weather and seasonality, lack of support for bicycle
infrastructure, not feasible for low income persons, lack of tourist attractions, feeling that
Cleveland is not bicycle friendly, and the possibility of vandalism on the stations and theft of the
bicycles.
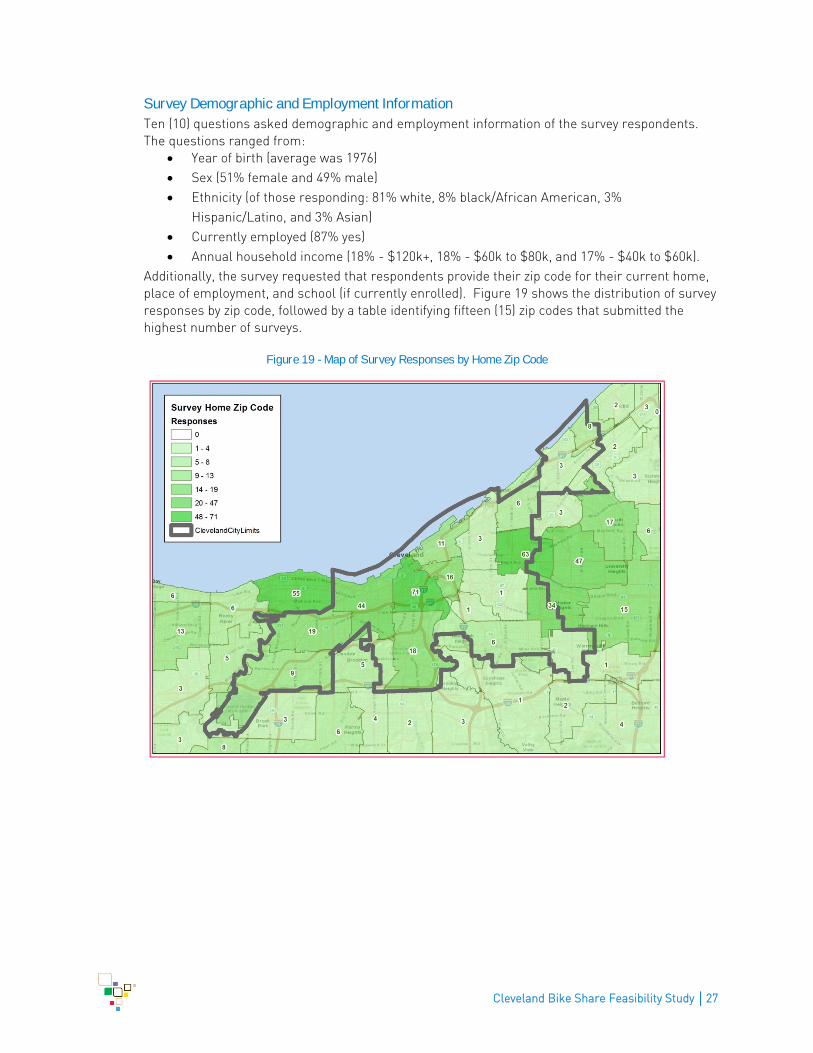
Cleveland Bike Share Feasibility Study │27
Survey Demographic and Employment Information Ten (10) questions asked demographic and employment information of the survey respondents.
The questions ranged from:
Year of birth (average was 1976)
Sex (51% female and 49% male)
Ethnicity (of those responding: 81% white, 8% black/African American, 3%
Hispanic/Latino, and 3% Asian)
Currently employed (87% yes)
Annual household income (18% - $120k+, 18% - $60k to $80k, and 17% - $40k to $60k).
Additionally, the survey requested that respondents provide their zip code for their current home,
place of employment, and school (if currently enrolled). Figure 19 shows the distribution of survey
responses by zip code, followed by a table identifying fifteen (15) zip codes that submitted the
highest number of surveys.
Figure 19 - Map of Survey Responses by Home Zip Code
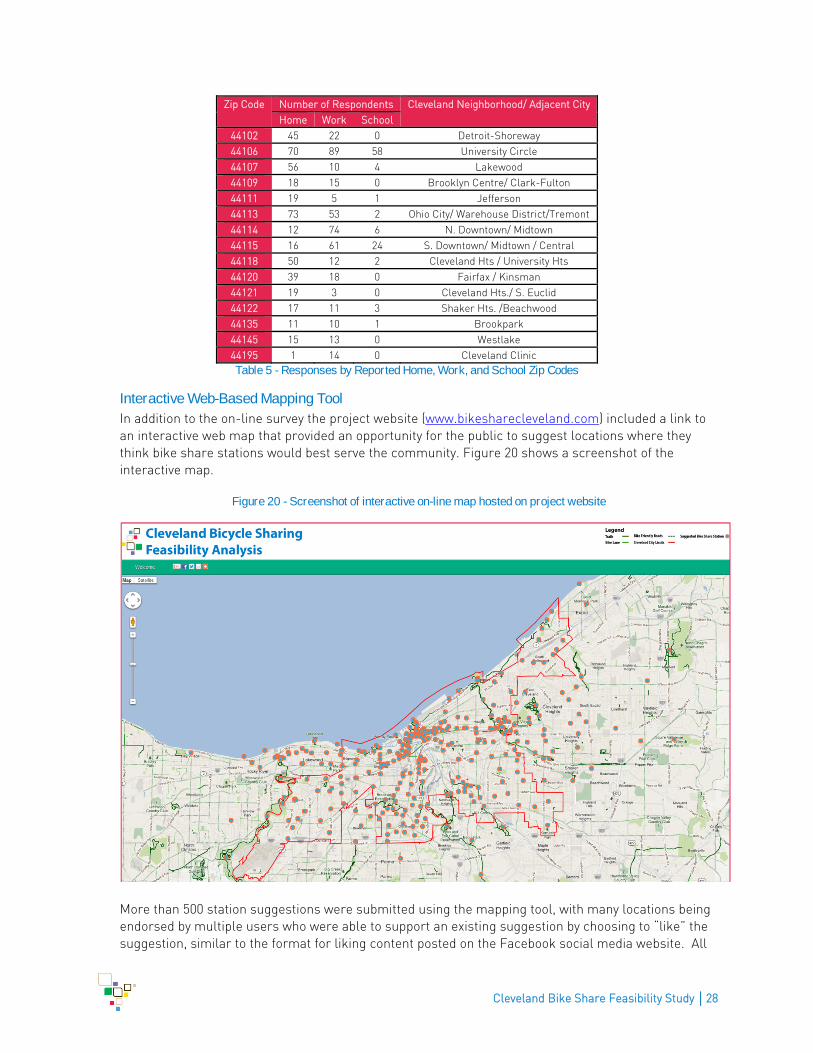
Cleveland Bike Share Feasibility Study │28
Zip Code Number of Respondents Cleveland Neighborhood/ Adjacent City
Home Work School
44102 45 22 0 Detroit-Shoreway
44106 70 89 58 University Circle
44107 56 10 4 Lakewood
44109 18 15 0 Brooklyn Centre/ Clark-Fulton
44111 19 5 1 Jefferson
44113 73 53 2 Ohio City/ Warehouse District/Tremont
44114 12 74 6 N. Downtown/ Midtown
44115 16 61 24 S. Downtown/ Midtown / Central
44118 50 12 2 Cleveland Hts / University Hts
44120 39 18 0 Fairfax / Kinsman
44121 19 3 0 Cleveland Hts./ S. Euclid
44122 17 11 3 Shaker Hts. /Beachwood
44135 11 10 1 Brookpark
44145 15 13 0 Westlake
44195 1 14 0 Cleveland Clinic
Table 5 - Responses by Reported Home, Work, and School Zip Codes
Interactive Web-Based Mapping Tool In addition to the on-line survey the project website (www.bikesharecleveland.com) included a link to
an interactive web map that provided an opportunity for the public to suggest locations where they
think bike share stations would best serve the community. Figure 20 shows a screenshot of the
interactive map.
Figure 20 - Screenshot of interactive on-line map hosted on project website
More than 500 station suggestions were submitted using the mapping tool, with many locations being
endorsed by multiple users who were able to support an existing suggestion by choosing to “like” the
suggestion, similar to the format for liking content posted on the Facebook social media website. All
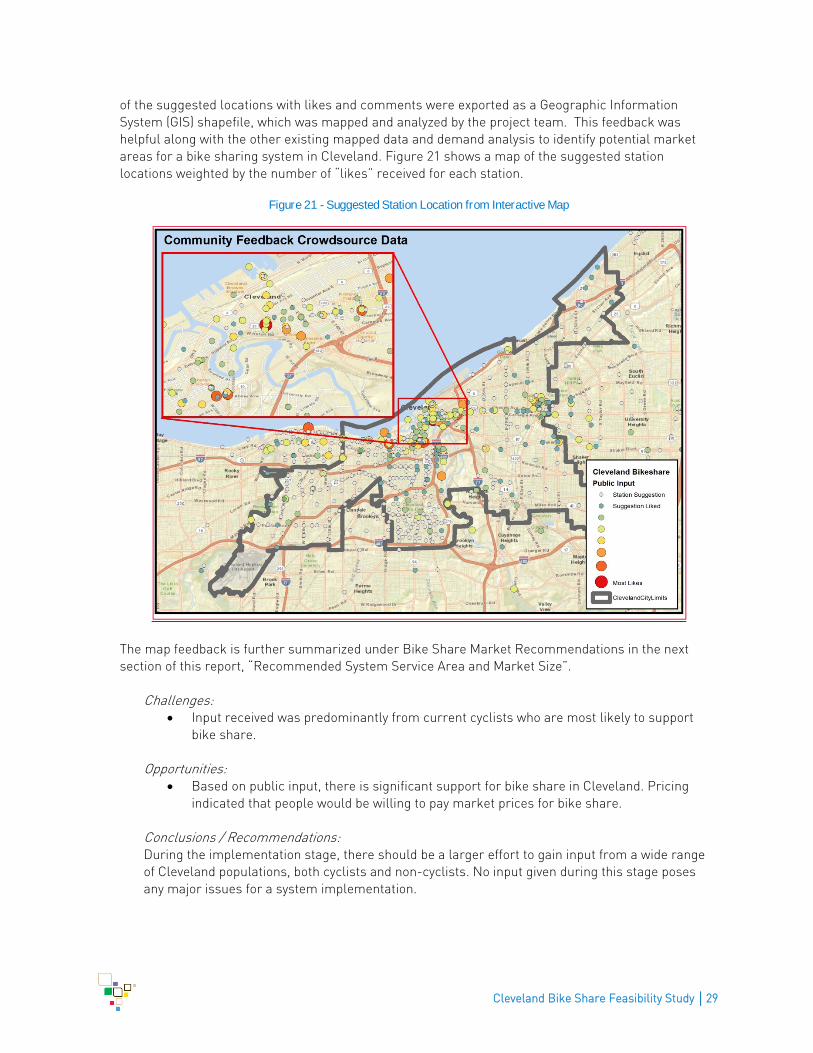
Cleveland Bike Share Feasibility Study │29
of the suggested locations with likes and comments were exported as a Geographic Information
System (GIS) shapefile, which was mapped and analyzed by the project team. This feedback was
helpful along with the other existing mapped data and demand analysis to identify potential market
areas for a bike sharing system in Cleveland. Figure 21 shows a map of the suggested station
locations weighted by the number of “likes” received for each station.
Figure 21 - Suggested Station Location from Interactive Map
The map feedback is further summarized under Bike Share Market Recommendations in the next
section of this report, “Recommended System Service Area and Market Size”.
Challenges: Input received was predominantly from current cyclists who are most likely to support
bike share.
Opportunities: Based on public input, there is significant support for bike share in Cleveland. Pricing
indicated that people would be willing to pay market prices for bike share.
Conclusions / Recommendations: During the implementation stage, there should be a larger effort to gain input from a wide range
of Cleveland populations, both cyclists and non-cyclists. No input given during this stage poses
any major issues for a system implementation.
Cleveland Bike Share Feasibility Study │30
Stakeholder Engagement Eight stakeholder meetings were conducted during the feasibility study involving 15 stakeholder agencies
from the public and private sector in Cleveland. In addition, a written survey was completed by 27 potential
stakeholders.
Stakeholders interviewed included representatives from agencies, health care and educational
institutions, foundations and charities, and large and small businesses. A full list of stakeholders
interviewed can be found in Appendix 2.
The stakeholder engagement meetings and survey reaffirmed several assumptions that existed prior to
launching the feasibility study for bike sharing and shed light on additional opportunities and challenges
for Cleveland. There is great interest for bike sharing in Cleveland among the stakeholder groups that we
interviewed. Many felt that bike share could help elevate Cleveland’s reputation for visitors, potential
residents and companies.
The majority of the organizations interviewed are interested in seeing a bike share system active in
Cleveland. Overall, there is strong support for continuing to gain an understanding of the feasibility of bike
sharing in Cleveland and interest in understanding the business plan.
Stakeholders most commonly support a bike share program to help make Cleveland more attractive to a
young, creative and diverse group of businesses and residents. Additional attributes that a bike share
program can bring to the community include linking key attractions and extending transportation options
in the urban core. Most stakeholders expressed interest and openness to some sort of financial support,
either through system sponsorship, station sponsorship or corporate membership.
Hesitation remains due to the lack of bicycling infrastructure and culture, poor roadway conditions and
weather. Stakeholders also expressed some concern about the lack of available information on estimated
costs for implementing the system. Concerns focused on operating the system in a way that would be
responsive to customer needs, nimble and cost effective. Ongoing operating support was a greater
concern than upfront capital costs. Despite these concerns, stakeholders remain interested in supporting
the investigation of a bike share program in Cleveland.
Challenges:
Stakeholders are concerned with the following challenges:
Lack of biking infrastructure
Lack of biking culture
Hostile driving culture
Weather and seasonal operation
Poor road conditions
Scattered location of attractions
Difficulty linking to transit options
Capital costs and building to scale
Maintaining a clean and operational system
Opportunities: Stakeholders see the following opportunities for a bike share system in Cleveland:
Connects assets – Flats east bank, stadiums, science center, parks, downtown
neighborhoods, universities etc.
Attractive to younger, urban and educated employees
Connects transportation – good for visitors to Cleveland
Cleveland Bike Share Feasibility Study │31
Environmentally friendly way of getting around
Increase awareness of Cleveland’s greatest attractions
Increase awareness of biking in Cleveland
Recruitment tool for attracting potential employees and residents
Conclusion / Recommendations: During implementation, the following items should be taken into account to address the priorities
of stakeholders, as sponsorship is being sought:
Operational Priorities:
Customer service focus – front and center
User friendly interface – easy to use membership / rental
Tech savvy systems operators
Attractive to younger users
Clean / well-maintained bikes and stations
Safety – bikes, helmets and stations
Organizational Priorities:
Tech savvy – nimble operating organization
Bike share expertise
Customer service oriented
Sufficient organizational capacity
Sponsorship Opportunities:
Corporate / group memberships
Sponsoring bike stations
Bikes
Cleveland Bike Share Feasibility Study │32
Evaluating Demand, System Size and Funding Sources Key questions to answer in evaluating the feasibility of bike share are “Who will use it?”, “Where will it be
implemented?” and “How will it be paid for?”
To address these questions, a heat map and demand analysis were prepared to evaluate the potential
service area and market for bike sharing, and also outline different potential funding sources.
Demand Analysis A demand analysis was performed using data provided by the City of Cleveland. The demand analysis was
used to measure the most suitable location of bike sharing stations. Areas with high potential demand for
bike share were identified through a heat mapping exercise that allocated “points” to where people live,
work, shop, play, and take transit. Launching a bike share program in the highest demand areas tends to
maximize the success of the program.
Indicators The following is a list of indicators selected to construct the demand analysis because of their individual
effect on potential demand and relative success of a bike share program.
Employment Density Employment density reflects the location of most people during the day. It is also utilized to help
measure the intensity of commuting patterns and help understand where increased service will be
needed.
Residential Population Density Higher residential density tends to support bike share demand by providing a pool of potential
users. It is important to note that retail employment density was included in this indicator
because of its function as a trip attractor throughout the day.
Mode Share In large cities, bike sharing programs are often organized to provide better service for the first
and/or last mile of a trip taken on public transit. Throughout existing programs higher bicycle
mode share in a particular location tends to promote increased bike share usage.
Proximity to Parks Parks tend to be a bike- friendly land use and most cyclists are comfortable biking in parks. Parks
serve as a destination for both residents and tourists.
Proximity to Libraries, Schools and Tourist Attractions All of these locations tend to act as trip attractions and tend to be destinations for bike share
users.
Proximity to Bicycle Infrastructure Bicycle lanes, bike boulevards, cycle tracks and shared use paths provide supporting
infrastructure for bike share users. The presence of bicycle-friendly infrastructure is correlated
with higher rates of bicycling or willingness to cycle.
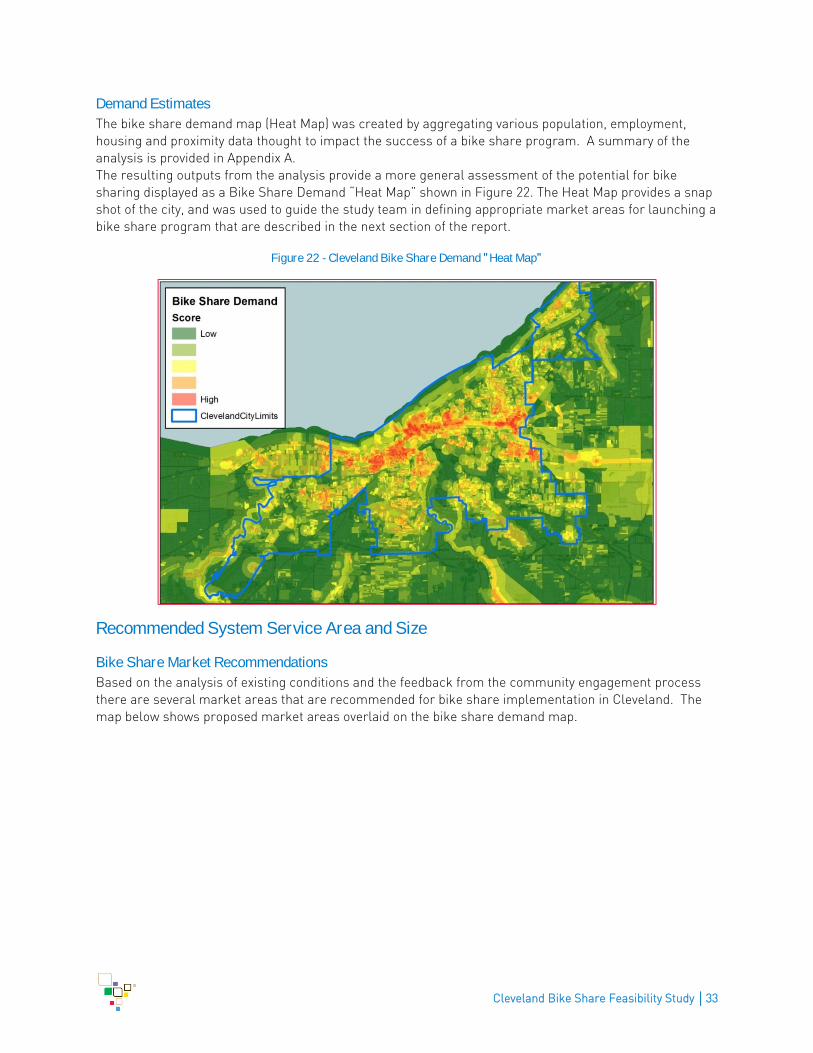
Cleveland Bike Share Feasibility Study │33
Demand Estimates The bike share demand map (Heat Map) was created by aggregating various population, employment,
housing and proximity data thought to impact the success of a bike share program. A summary of the
analysis is provided in Appendix A.
The resulting outputs from the analysis provide a more general assessment of the potential for bike
sharing displayed as a Bike Share Demand “Heat Map” shown in Figure 22. The Heat Map provides a snap
shot of the city, and was used to guide the study team in defining appropriate market areas for launching a
bike share program that are described in the next section of the report.
Figure 22 - " "Cleveland Bike Share Demand Heat Map
Recommended System Service Area and Size
Bike Share Market Recommendations Based on the analysis of existing conditions and the feedback from the community engagement process
there are several market areas that are recommended for bike share implementation in Cleveland. The
map below shows proposed market areas overlaid on the bike share demand map.
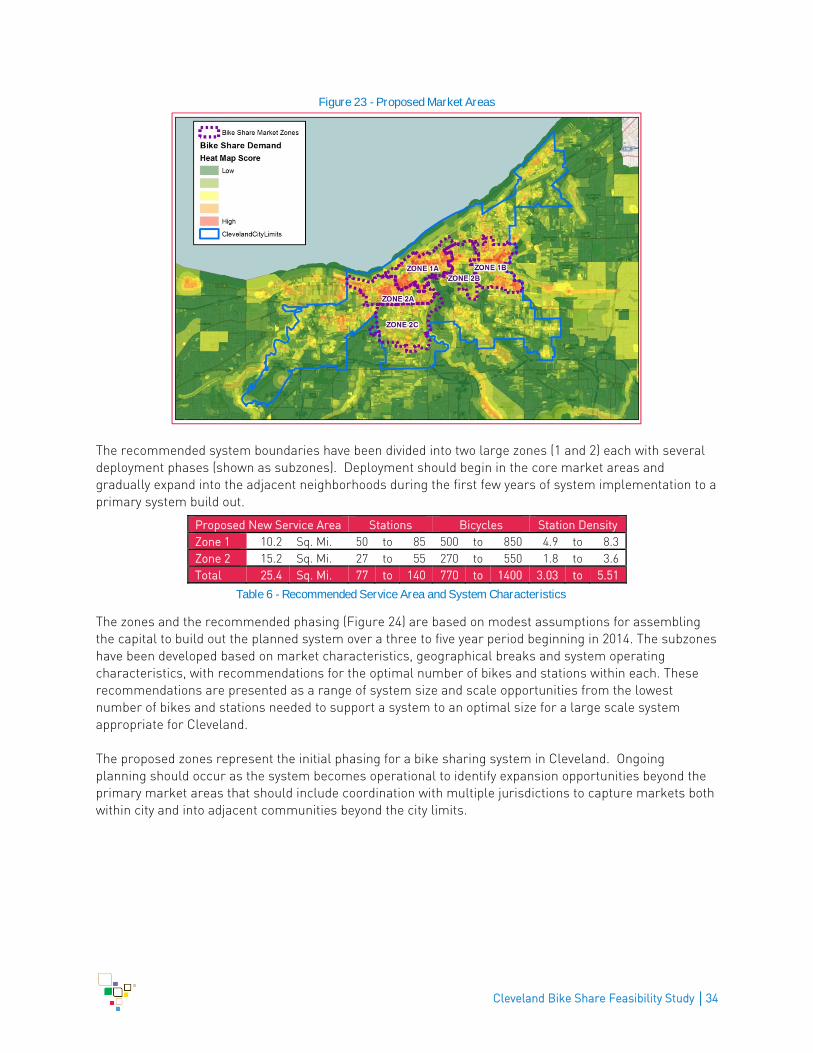
Cleveland Bike Share Feasibility Study │34
Figure 23 - Proposed Market Areas
The recommended system boundaries have been divided into two large zones (1 and 2) each with several
deployment phases (shown as subzones). Deployment should begin in the core market areas and
gradually expand into the adjacent neighborhoods during the first few years of system implementation to a
primary system build out.
The zones and the recommended phasing (Figure 24) are based on modest assumptions for assembling
the capital to build out the planned system over a three to five year period beginning in 2014. The subzones
have been developed based on market characteristics, geographical breaks and system operating
characteristics, with recommendations for the optimal number of bikes and stations within each. These
recommendations are presented as a range of system size and scale opportunities from the lowest
number of bikes and stations needed to support a system to an optimal size for a large scale system
appropriate for Cleveland.
The proposed zones represent the initial phasing for a bike sharing system in Cleveland. Ongoing
planning should occur as the system becomes operational to identify expansion opportunities beyond the
primary market areas that should include coordination with multiple jurisdictions to capture markets both
within city and into adjacent communities beyond the city limits.
Proposed New Service Area Stations Bicycles Station Density
Zone 1 10.2 Sq. Mi. 50 to 85 500 to 850 4.9 to 8.3
Zone 2 15.2 Sq. Mi. 27 to 55 270 to 550 1.8 to 3.6
Total 25.4 Sq. Mi. 77 to 140 770 to 1400 3.03 to 5.51
Table 6 - Recommended Service Area and System Characteristics
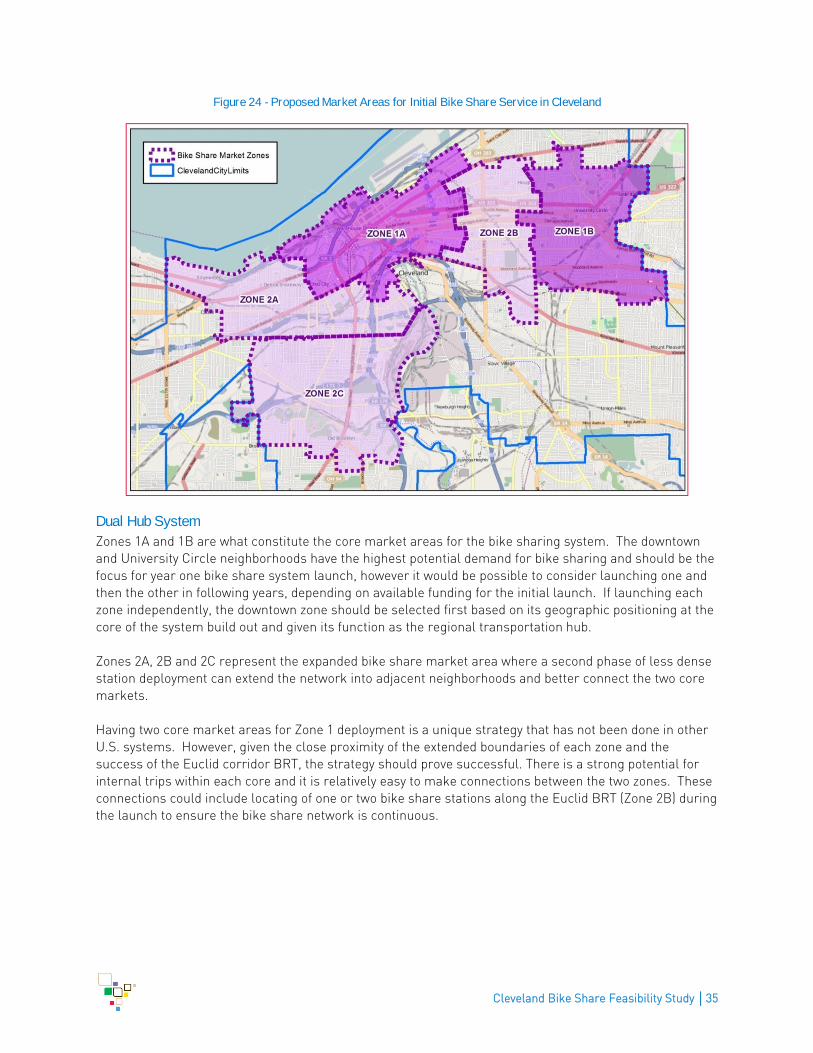
Cleveland Bike Share Feasibility Study │35
Figure 24 - Proposed Market Areas for Initial Bike Share Service in Cleveland
Dual Hub System Zones 1A and 1B are what constitute the core market areas for the bike sharing system. The downtown
and University Circle neighborhoods have the highest potential demand for bike sharing and should be the
focus for year one bike share system launch, however it would be possible to consider launching one and
then the other in following years, depending on available funding for the initial launch. If launching each
zone independently, the downtown zone should be selected first based on its geographic positioning at the
core of the system build out and given its function as the regional transportation hub.
Zones 2A, 2B and 2C represent the expanded bike share market area where a second phase of less dense
station deployment can extend the network into adjacent neighborhoods and better connect the two core
markets.
Having two core market areas for Zone 1 deployment is a unique strategy that has not been done in other
U.S. systems. However, given the close proximity of the extended boundaries of each zone and the
success of the Euclid corridor BRT, the strategy should prove successful. There is a strong potential for
internal trips within each core and it is relatively easy to make connections between the two zones. These
connections could include locating of one or two bike share stations along the Euclid BRT (Zone 2B) during
the launch to ensure the bike share network is continuous.
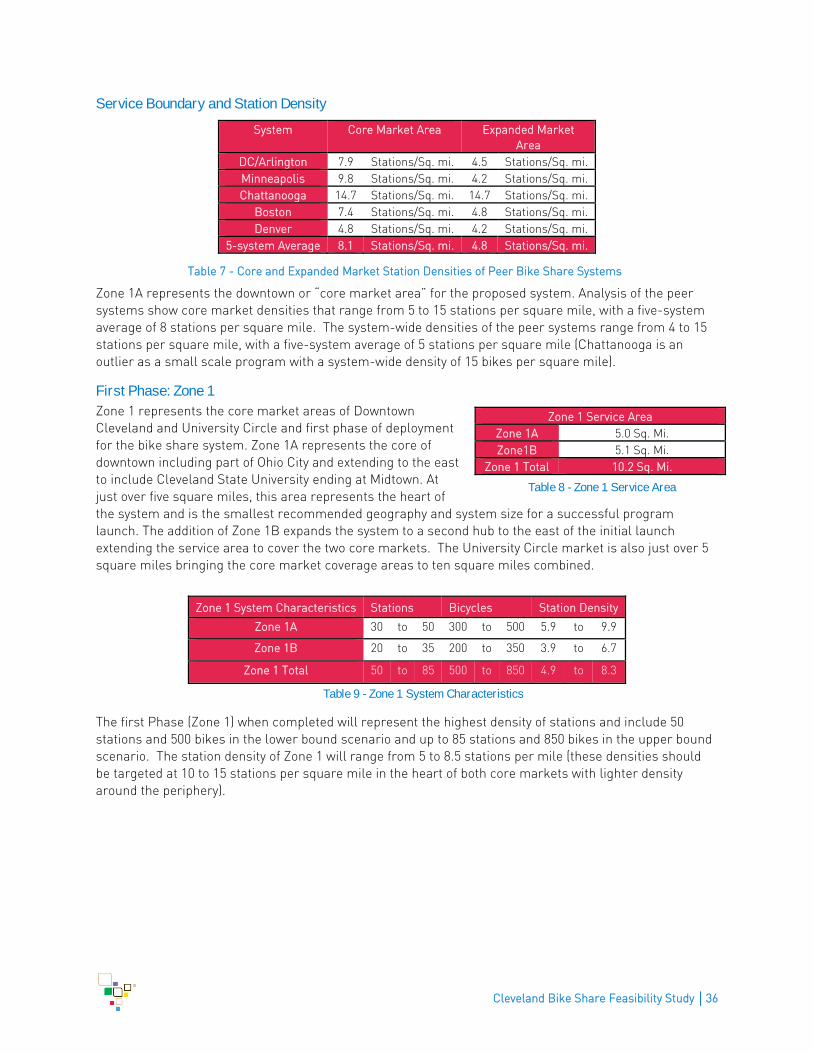
Cleveland Bike Share Feasibility Study │36
Service Boundary and Station Density
Zone 1A represents the downtown or “core market area” for the proposed system. Analysis of the peer
systems show core market densities that range from 5 to 15 stations per square mile, with a five-system
average of 8 stations per square mile. The system-wide densities of the peer systems range from 4 to 15
stations per square mile, with a five-system average of 5 stations per square mile (Chattanooga is an
outlier as a small scale program with a system-wide density of 15 bikes per square mile).
First Phase: Zone 1 Zone 1 represents the core market areas of Downtown
Cleveland and University Circle and first phase of deployment
for the bike share system. Zone 1A represents the core of
downtown including part of Ohio City and extending to the east
to include Cleveland State University ending at Midtown. At
just over five square miles, this area represents the heart of
the system and is the smallest recommended geography and system size for a successful program
launch. The addition of Zone 1B expands the system to a second hub to the east of the initial launch
extending the service area to cover the two core markets. The University Circle market is also just over 5
square miles bringing the core market coverage areas to ten square miles combined.
The first Phase (Zone 1) when completed will represent the highest density of stations and include 50
stations and 500 bikes in the lower bound scenario and up to 85 stations and 850 bikes in the upper bound
scenario. The station density of Zone 1 will range from 5 to 8.5 stations per mile (these densities should
be targeted at 10 to 15 stations per square mile in the heart of both core markets with lighter density
around the periphery).
System Core Market Area Expanded Market
Area
DC/Arlington 7.9 Stations/Sq. mi. 4.5 Stations/Sq. mi.
Minneapolis 9.8 Stations/Sq. mi. 4.2 Stations/Sq. mi.
Chattanooga 14.7 Stations/Sq. mi. 14.7 Stations/Sq. mi.
Boston 7.4 Stations/Sq. mi. 4.8 Stations/Sq. mi.
Denver 4.8 Stations/Sq. mi. 4.2 Stations/Sq. mi.
5-system Average 8.1 Stations/Sq. mi. 4.8 Stations/Sq. mi.
Table 7 - Core and Expanded Market Station Densities of Peer Bike Share Systems
Zone 1 Service Area
Zone 1A 5.0 Sq. Mi.
Zone1B 5.1 Sq. Mi.
Zone 1 Total 10.2 Sq. Mi.
Table 8 - Zone 1 Service Area
Zone 1 System Characteristics Stations Bicycles Station Density
Zone 1A 30 to 50 300 to 500 5.9 to 9.9
Zone 1B 20 to 35 200 to 350 3.9 to 6.7
Zone 1 Total 50 to 85 500 to 850 4.9 to 8.3
Table 9 - Zone 1 System Characteristics
Cleveland Bike Share Feasibility Study │37
Second Phase: Zone 2 Zone 2 includes three submarkets (2A, 2B and 2C) to be
implemented over years three, four, and five, respectively.
When completed, Phase 2 will extend the system beyond the
dual hubs of downtown and University Circle into the adjacent
residential neighborhoods of Detroit Shoreway, Tremont, Old
Brooklyn and Midtown. The zone 2 expansion will add an
additional fifteen square miles of service area, bringing the
initial system build out to just over 25 square miles. It is important to note that these additional zones
were selected based on the provision of continuous connectivity between the Phase 1 recommendations.
The implementation of the Phase 2 submarkets will complete the initial system build out and add 270
bicycles and 27 stations in the lower bound scenario to an additional 550 bicycles and 55 stations in the
upper bound scenario, increasing the system to a total of 770 to 1,800 bicycles and 77 to 140 stations when
completed. The station density for the second phase will range from 3 to 5 stations per square mile. This
is consistent with the system-wide densities in current U.S. bike share programs.
Zone 1 System Characteristics Stations Bicycles Station Density
Zone 2A 10 to 20 100 to 200 2.1 to 4.2
Zone 2B 7 to 15 70 to 150 1.9 to 4.2
Zone 2C 10 to 20 100 to 200 1.4 to 2.9
Zone 2 Total 27 to 55 270 to 550 1.8 to 3.6
Table 11 - Zone 2 System Characteristics
Key Demographics of the Bike Share Service Area Overall the Cleveland bike share system will serve an area with 143,000 residents and 193,000 jobs. The
bike share service area represents a diverse cross section of Cleveland in terms of age, race, income, and
education. The proposed two phases cover a compact and densely populated service area; at 5,600 people
per square mile, the bike share service area has a greater population density than the city on the whole
and exceeds the population density of the other largest cities in Ohio (Cincinnati has a population density
of 3,700 persons per square mile). Table 13 provides a summary of select market demographics for each
of the proposed market areas.37
37 2011 American Community Survey Data. US Census Bureau.
Table 10 - Zone 2 Service Area
Zone 1 Service Area
Zone 2A 4.8 Sq. Mi
Zone 2B 3.6 Sq. Mi
Zone 2C 6.9 Sq. Mi
Zone 2 Total 15.2 Sq. Mi
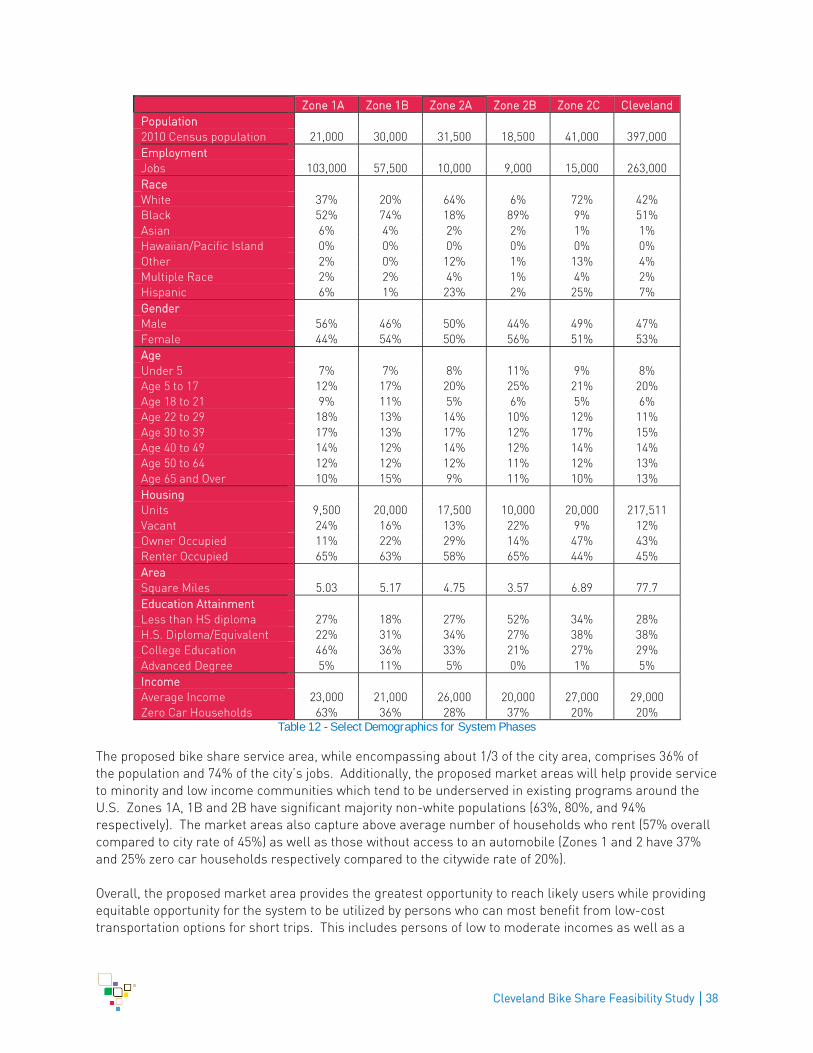
Cleveland Bike Share Feasibility Study │38
Zone 1A Zone 1B Zone 2A Zone 2B Zone 2C Cleveland
Population
2010 Census population 21,000 30,000 31,500 18,500 41,000 397,000
Employment
Jobs 103,000 57,500 10,000 9,000 15,000 263,000
Race
White 37% 20% 64% 6% 72% 42%
Black 52% 74% 18% 89% 9% 51%
Asian 6% 4% 2% 2% 1% 1%
Hawaiian/Pacific Island 0% 0% 0% 0% 0% 0%
Other 2% 0% 12% 1% 13% 4%
Multiple Race 2% 2% 4% 1% 4% 2%
Hispanic 6% 1% 23% 2% 25% 7%
Gender
Male 56% 46% 50% 44% 49% 47%
Female 44% 54% 50% 56% 51% 53%
Age
Under 5 7% 7% 8% 11% 9% 8%
Age 5 to 17 12% 17% 20% 25% 21% 20%
Age 18 to 21 9% 11% 5% 6% 5% 6%
Age 22 to 29 18% 13% 14% 10% 12% 11%
Age 30 to 39 17% 13% 17% 12% 17% 15%
Age 40 to 49 14% 12% 14% 12% 14% 14%
Age 50 to 64 12% 12% 12% 11% 12% 13%
Age 65 and Over 10% 15% 9% 11% 10% 13%
Housing
Units 9,500 20,000 17,500 10,000 20,000 217,511
Vacant 24% 16% 13% 22% 9% 12%
Owner Occupied 11% 22% 29% 14% 47% 43%
Renter Occupied 65% 63% 58% 65% 44% 45%
Area
Square Miles 5.03 5.17 4.75 3.57 6.89 77.7
Education Attainment
Less than HS diploma 27% 18% 27% 52% 34% 28%
H.S. Diploma/Equivalent 22% 31% 34% 27% 38% 38%
College Education 46% 36% 33% 21% 27% 29%
Advanced Degree 5% 11% 5% 0% 1% 5%
Income
Average Income 23,000 21,000 26,000 20,000 27,000 29,000
Zero Car Households 63% 36% 28% 37% 20% 20% Table 12 - Select Demographics for System Phases
The proposed bike share service area, while encompassing about 1/3 of the city area, comprises 36% of
the population and 74% of the city’s jobs. Additionally, the proposed market areas will help provide service
to minority and low income communities which tend to be underserved in existing programs around the
U.S. Zones 1A, 1B and 2B have significant majority non-white populations (63%, 80%, and 94%
respectively). The market areas also capture above average number of households who rent (57% overall
compared to city rate of 45%) as well as those without access to an automobile (Zones 1 and 2 have 37%
and 25% zero car households respectively compared to the citywide rate of 20%).
Overall, the proposed market area provides the greatest opportunity to reach likely users while providing
equitable opportunity for the system to be utilized by persons who can most benefit from low-cost
transportation options for short trips. This includes persons of low to moderate incomes as well as a
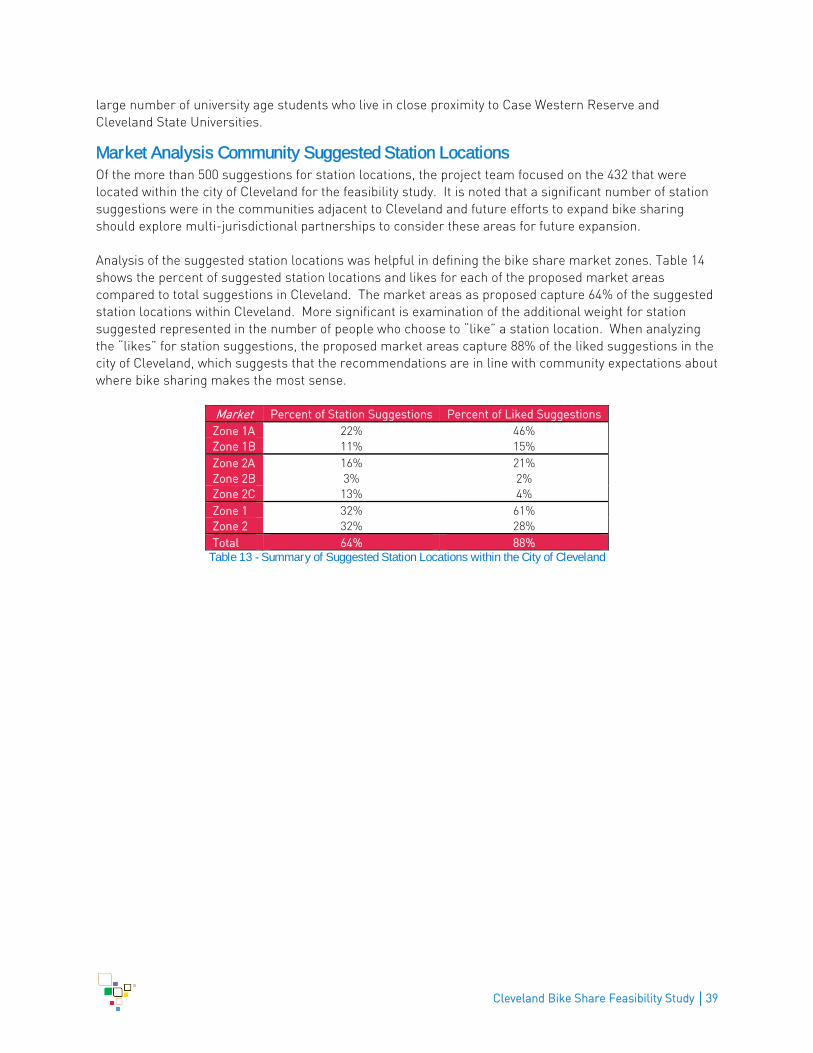
Cleveland Bike Share Feasibility Study │39
large number of university age students who live in close proximity to Case Western Reserve and
Cleveland State Universities.
Market Analysis Community Suggested Station Locations Of the more than 500 suggestions for station locations, the project team focused on the 432 that were
located within the city of Cleveland for the feasibility study. It is noted that a significant number of station
suggestions were in the communities adjacent to Cleveland and future efforts to expand bike sharing
should explore multi-jurisdictional partnerships to consider these areas for future expansion.
Analysis of the suggested station locations was helpful in defining the bike share market zones. Table 14
shows the percent of suggested station locations and likes for each of the proposed market areas
compared to total suggestions in Cleveland. The market areas as proposed capture 64% of the suggested
station locations within Cleveland. More significant is examination of the additional weight for station
suggested represented in the number of people who choose to “like” a station location. When analyzing
the “likes” for station suggestions, the proposed market areas capture 88% of the liked suggestions in the
city of Cleveland, which suggests that the recommendations are in line with community expectations about
where bike sharing makes the most sense.
Market Percent of Station Suggestions Percent of Liked Suggestions
Zone 1A 22% 46%
Zone 1B 11% 15%
Zone 2A 16% 21%
Zone 2B 3% 2%
Zone 2C 13% 4%
Zone 1 32% 61%
Zone 2 32% 28%
Total 64% 88% Table 13 - Summary of Suggested Station Locations within the City of Cleveland
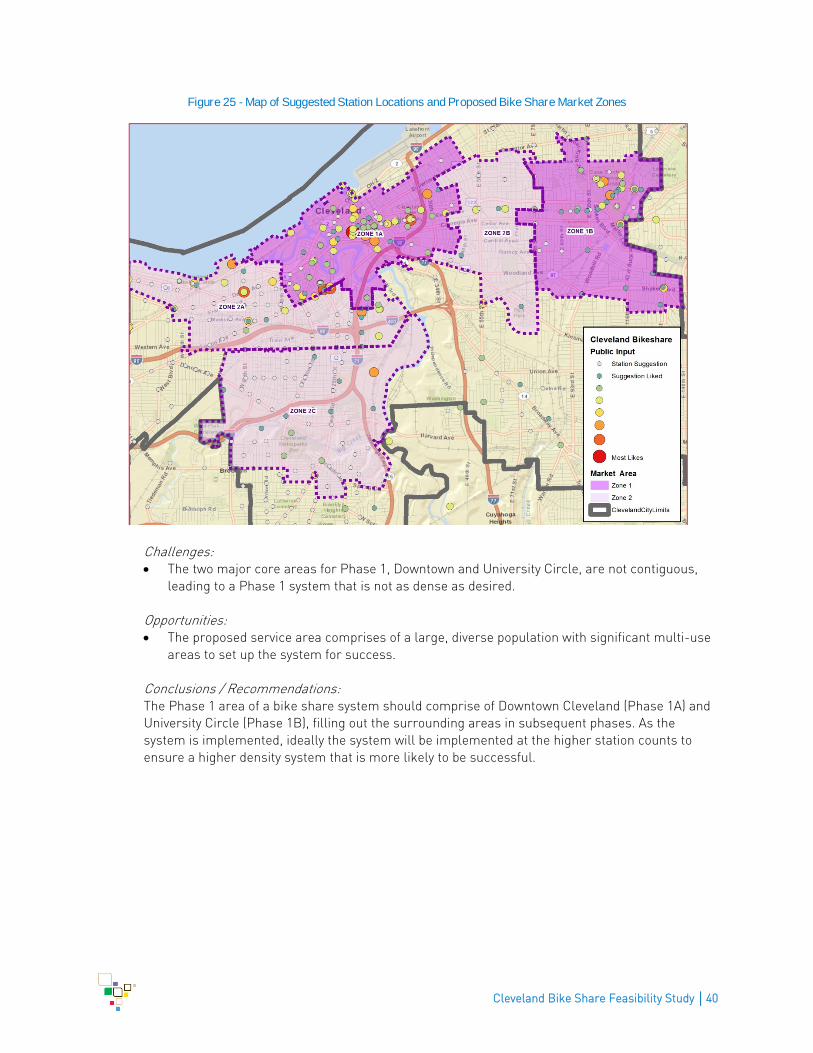
Cleveland Bike Share Feasibility Study │40
Figure 25 - Map of Suggested Station Locations and Proposed Bike Share Market Zones
Challenges: The two major core areas for Phase 1, Downtown and University Circle, are not contiguous,
leading to a Phase 1 system that is not as dense as desired.
Opportunities: The proposed service area comprises of a large, diverse population with significant multi-use
areas to set up the system for success.
Conclusions / Recommendations: The Phase 1 area of a bike share system should comprise of Downtown Cleveland (Phase 1A) and
University Circle (Phase 1B), filling out the surrounding areas in subsequent phases. As the
system is implemented, ideally the system will be implemented at the higher station counts to
ensure a higher density system that is more likely to be successful.
Cleveland Bike Share Feasibility Study │41
Potential Funding Sources There are significant public and private potential sources of funding for a bike share system for Cleveland.
Public Sources: Federal:
Unlike other modes of transit that have dedicated funding sources, bike share largely relies on
discretionary grant programs such as CMAQ and TIGER for public funding. Many cities, including
Washington DC, Chicago, Chattanooga, San Francisco, Pittsburgh and Las Vegas, have utilized or are
utilizing CMAQ funding for bike share system implementation, both from FTA and FHWA. Such funding
requires a local match, typically 20%. Matching funds can come from sponsorship or city funding.
State and City:
Although not as common as using federal funding, some cities have been able to use state and/or city
funding for bike share. Columbus is using 100% city funding for their 300-bike system. Boston used
some state funding for a portion of their capital costs.
Private Sources: There are many potential sources for sponsorship in Cleveland to help support capital and operations.
As indicated in the Stakeholder Input section, many potential stakeholders were interviewed or surveyed
as to their potential interest in financial support of the system. Most expressed interest in and openness to
the different opportunities, depending on the costs and assets involved.
For major funding, system sponsorship must be sought, and potential sponsors are typically larger
companies or institutions. The following Fortune 500 companies are based in Cleveland:
Progressive Insurance (#169, based in Mayfield)
Parker Hannifin (#216)
Sherwin Williams (#293)
Cliffs Natural Resources (#366)
Aleris (#494)
KeyCorp (#499)
Other top employers include health care institutions such as Cleveland Clinic Health System, University
Hospitals, Metro Health System. Educational institutions such as Case Western Reserve and Cleveland
State can also be station sponsors for stations near their campuses. In addition, other employers such as
International Management Group and Lincoln Electric may be able to help support the system. It will also
be important for system administrators to reach out to companies located within the proposed phases of
the program, which may serve as potential sponsors of a program. The following companies are located
within the different phases of the program:
Sherwin Williams (Phase 1A)
Kaiser Permanente (Phase 1A and 1B)
Medical Mutual of Ohio (Phase 1A)
Cleveland Clinic Health System (Phase 1B)
University Hospitals (Phase 1B)
Case Western Reserve University (Phase 1B)
Cleveland Bike Share Feasibility Study │42
For support on operations once major funding is secured, there are numerous smaller businesses (or
businesses who can’t support a major sponsorship) that can help with station sponsorships and corporate
memberships.
Some cities have also negotiated contracts where one side of the ad panel is sold to an outdoor advertising
company, who in turn sells that space to advertisers. Such contracts have offered operations support or
expansion to bike share systems.
Challenges: Finding funding for a bike share system requires time, effort and agency support to ensure
success.
Opportunities: There are numerous potential public and private partners in the service area who may help
sponsor the program Cleveland.
Conclusions / Recommendations: The Task Force should create a non-profit organization whose responsibility is to fundraise and
procure planning, operations and equipment for a bike share system.
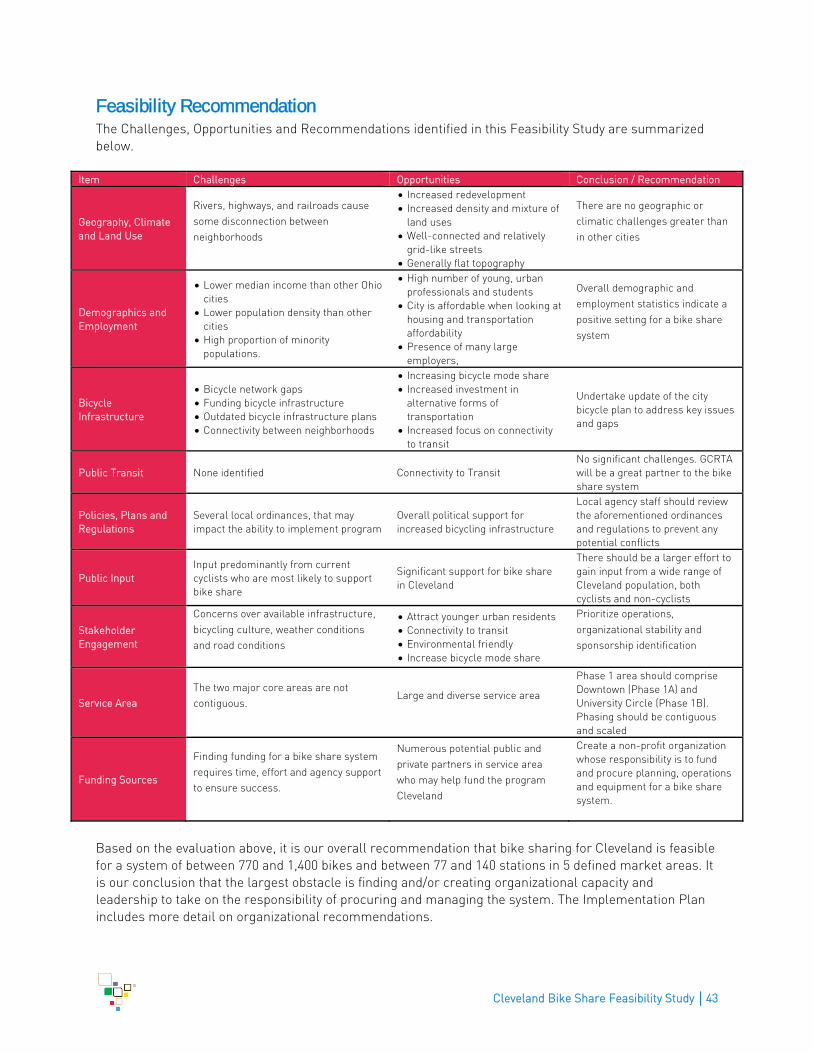
Cleveland Bike Share Feasibility Study │43
Feasibility Recommendation The Challenges, Opportunities and Recommendations identified in this Feasibility Study are summarized
below.
Item Challenges Opportunities Conclusion / Recommendation
Geography, Climate
and Land Use
Rivers, highways, and railroads cause
some disconnection between
neighborhoods
Increased redevelopment
Increased density and mixture of
land uses
Well-connected and relatively
grid-like streets
Generally flat topography
There are no geographic or
climatic challenges greater than
in other cities
Demographics and
Employment
Lower median income than other Ohio
cities
Lower population density than other
cities
High proportion of minority
populations.
High number of young, urban
professionals and students
City is affordable when looking at
housing and transportation
affordability
Presence of many large
employers,
Overall demographic and
employment statistics indicate a
positive setting for a bike share
system
Bicycle
Infrastructure
Bicycle network gaps
Funding bicycle infrastructure
Outdated bicycle infrastructure plans
Connectivity between neighborhoods
Increasing bicycle mode share
Increased investment in
alternative forms of
transportation
Increased focus on connectivity
to transit
Undertake update of the city
bicycle plan to address key issues
and gaps
Public Transit None identified Connectivity to Transit
No significant challenges. GCRTA
will be a great partner to the bike
share system
Policies, Plans and
Regulations
Several local ordinances, that may
impact the ability to implement program
Overall political support for
increased bicycling infrastructure
Local agency staff should review
the aforementioned ordinances
and regulations to prevent any
potential conflicts
Public Input
Input predominantly from current
cyclists who are most likely to support
bike share
Significant support for bike share
in Cleveland
There should be a larger effort to
gain input from a wide range of
Cleveland population, both
cyclists and non-cyclists
Stakeholder
Engagement
Concerns over available infrastructure,
bicycling culture, weather conditions
and road conditions
Attract younger urban residents
Connectivity to transit
Environmental friendly
Increase bicycle mode share
Prioritize operations,
organizational stability and
sponsorship identification
Service Area
The two major core areas are not
contiguous. Large and diverse service area
Phase 1 area should comprise
Downtown (Phase 1A) and
University Circle (Phase 1B).
Phasing should be contiguous
and scaled
Funding Sources
Finding funding for a bike share system
requires time, effort and agency support
to ensure success.
Numerous potential public and
private partners in service area
who may help fund the program
Cleveland
Create a non-profit organization
whose responsibility is to fund
and procure planning, operations
and equipment for a bike share
system.
Based on the evaluation above, it is our overall recommendation that bike sharing for Cleveland is feasible
for a system of between 770 and 1,400 bikes and between 77 and 140 stations in 5 defined market areas. It
is our conclusion that the largest obstacle is finding and/or creating organizational capacity and
leadership to take on the responsibility of procuring and managing the system. The Implementation Plan
includes more detail on organizational recommendations.
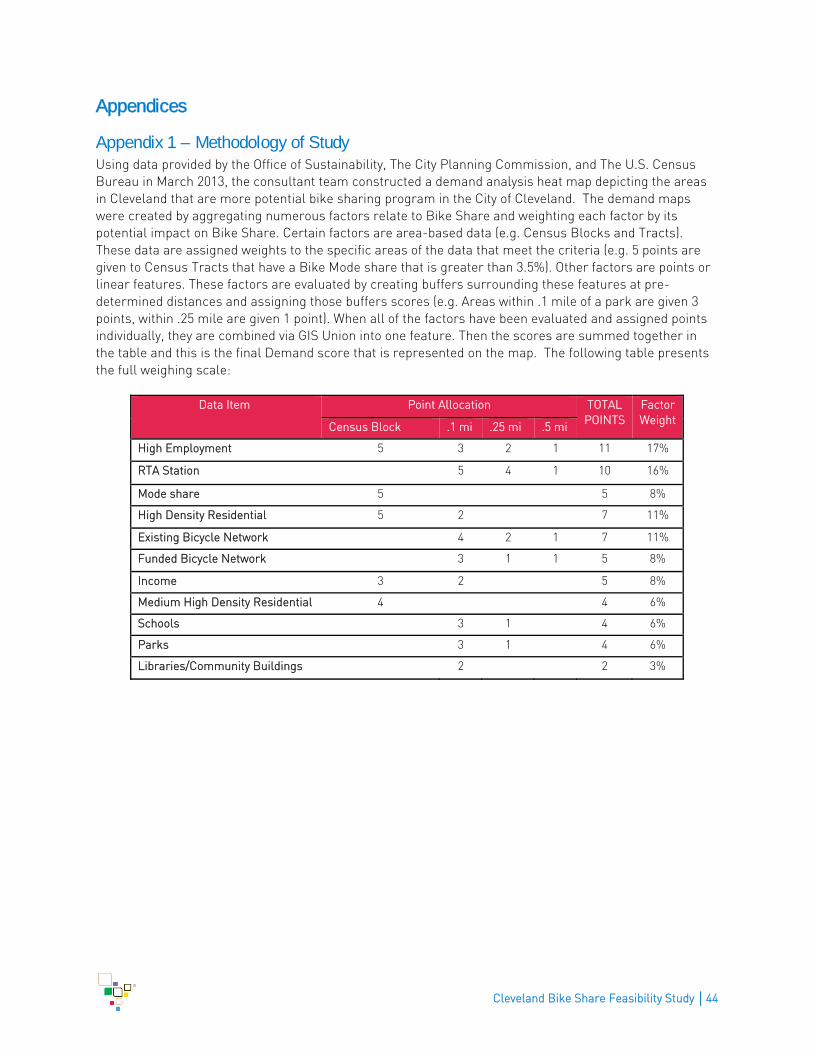
Cleveland Bike Share Feasibility Study │44
Appendices
Appendix 1 – Methodology of Study Using data provided by the Office of Sustainability, The City Planning Commission, and The U.S. Census
Bureau in March 2013, the consultant team constructed a demand analysis heat map depicting the areas
in Cleveland that are more potential bike sharing program in the City of Cleveland. The demand maps
were created by aggregating numerous factors relate to Bike Share and weighting each factor by its
potential impact on Bike Share. Certain factors are area-based data (e.g. Census Blocks and Tracts).
These data are assigned weights to the specific areas of the data that meet the criteria (e.g. 5 points are
given to Census Tracts that have a Bike Mode share that is greater than 3.5%). Other factors are points or
linear features. These factors are evaluated by creating buffers surrounding these features at pre-
determined distances and assigning those buffers scores (e.g. Areas within .1 mile of a park are given 3
points, within .25 mile are given 1 point). When all of the factors have been evaluated and assigned points
individually, they are combined via GIS Union into one feature. Then the scores are summed together in
the table and this is the final Demand score that is represented on the map. The following table presents
the full weighing scale:
Data Item Point Allocation TOTAL
POINTS
Factor
WeightCensus Block .1 mi .25 mi .5 mi
High Employment 5 3 2 1 11 17%
RTA Station 5 4 1 10 16%
Mode share 5 5 8%
High Density Residential 5 2 7 11%
Existing Bicycle Network 4 2 1 7 11%
Funded Bicycle Network 3 1 1 5 8%
Income 3 2 5 8%
Medium High Density Residential 4 4 6%
Schools 3 1 4 6%
Parks 3 1 4 6%
Libraries/Community Buildings 2 2 3%
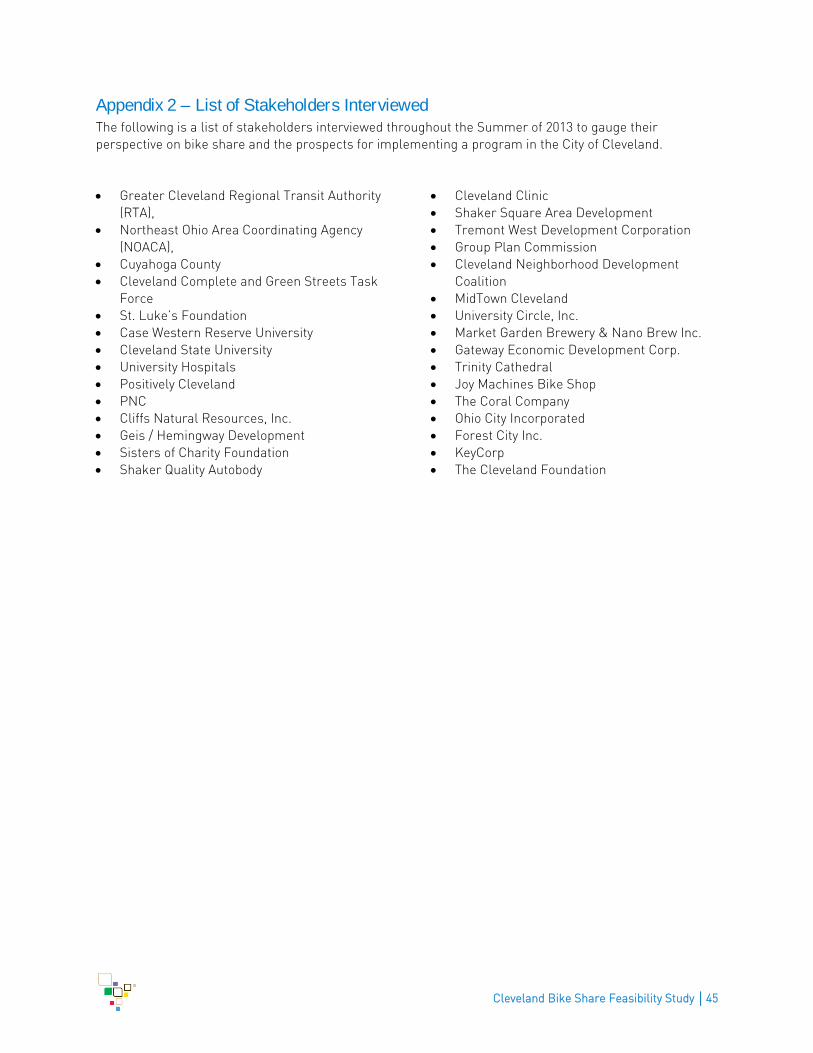
Cleveland Bike Share Feasibility Study │45
Appendix 2 – List of Stakeholders Interviewed The following is a list of stakeholders interviewed throughout the Summer of 2013 to gauge their
perspective on bike share and the prospects for implementing a program in the City of Cleveland.
Greater Cleveland Regional Transit Authority
(RTA),
Northeast Ohio Area Coordinating Agency
(NOACA),
Cuyahoga County
Cleveland Complete and Green Streets Task
Force
St. Luke’s Foundation
Case Western Reserve University
Cleveland State University
University Hospitals
Positively Cleveland
PNC
Cliffs Natural Resources, Inc.
Geis / Hemingway Development
Sisters of Charity Foundation
Shaker Quality Autobody
Cleveland Clinic
Shaker Square Area Development
Tremont West Development Corporation
Group Plan Commission
Cleveland Neighborhood Development
Coalition
MidTown Cleveland
University Circle, Inc.
Market Garden Brewery & Nano Brew Inc.
Gateway Economic Development Corp.
Trinity Cathedral
Joy Machines Bike Shop
The Coral Company
Ohio City Incorporated
Forest City Inc.
KeyCorp
The Cleveland Foundation
Cleveland Bike Share Feasibility Study │46
Appendix 3 –Summary of Public Engagement Meeting Station Suggestions
The following is a summary list of possible station locations suggested by the public during the public
meeting held on April 29, 2013.
Downtown Public Square – 6
Cleveland Browns Stadium / Science Center – 3
Progressive Field / Q – 2
Cleveland State – 9
City Hall / Convention Center – 5
Prospect / Ontario – 4
Warehouse District – 4
East Bank Flats – 3
West Bank Flats – 1
Rock Hall – 3
Euclid & E 4th – 2
Euclid & E 5th – 2
Midtown Euclid & E 49th – 1
Superior & E 32nd – 3
Chester & E 32nd – 1
Superior & E 55th – 1
Ohio City Lorain & W 25th – 11
St. Ignatius (Fulton & W 32nd) – 12
Tremont Lincoln Park – 5
Professor & Kenilworth – 2
University Circle Area Euclid & 90th – 1
Chester & 89th – 1
Little Italy – 1
Cedar Hill – 2
University Medical Center – 6
Euclid Museums – 5
CWRU – 14
Detroit Shorewood Detroit & W 65th – 15
Detroit & W 75th – 5
Edgewater Park - 3
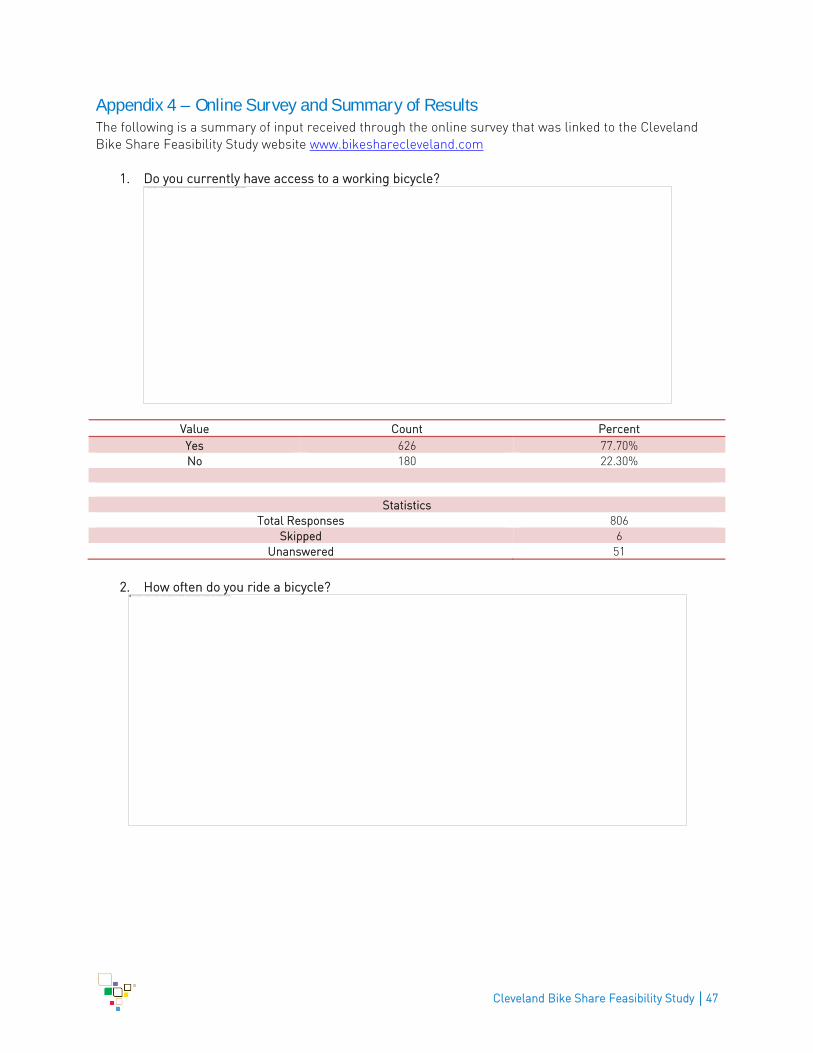
Cleveland Bike Share Feasibility Study │47
Appendix 4 – Online Survey and Summary of Results The following is a summary of input received through the online survey that was linked to the Cleveland
Bike Share Feasibility Study website www.bikesharecleveland.com
1. Do you currently have access to a working bicycle?
Value Count Percent
Yes 626 77.70%
No 180 22.30%
Statistics
Total Responses 806
Skipped 6
Unanswered 51
2. How often do you ride a bicycle?
The image cannot be displayed. Your computer may not have enough memory to open the image, or the image may have been corrupted. Restart your computer, and then open the file again. If the red x still appears, you may have to delete the image and then insert it again.
The image cannot be displayed. Your computer may not have enough memory to open the image, or the image may have been corrupted. Restart your computer, and then open the file again. If the red x still appears, you may have to delete the image and then insert it again.
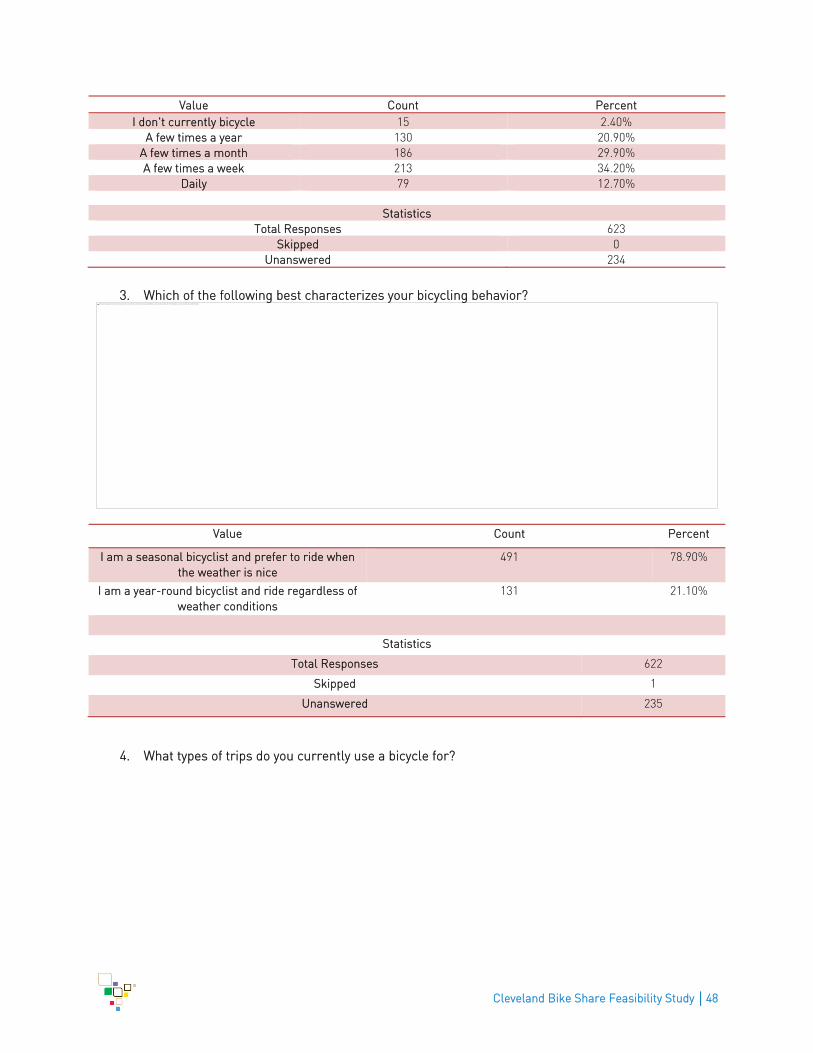
Cleveland Bike Share Feasibility Study │48
Value Count Percent
I don't currently bicycle 15 2.40%
A few times a year 130 20.90%
A few times a month 186 29.90%
A few times a week 213 34.20%
Daily 79 12.70%
Statistics
Total Responses 623
Skipped 0
Unanswered 234
3. Which of the following best characterizes your bicycling behavior?
Value Count Percent
I am a seasonal bicyclist and prefer to ride when
the weather is nice
491 78.90%
I am a year-round bicyclist and ride regardless of
weather conditions
131 21.10%
Statistics
Total Responses 622
Skipped 1
Unanswered 235
4. What types of trips do you currently use a bicycle for?
The image cannot be displayed. Your computer may not have enough memory to open the image, or the image may have been corrupted. Restart your computer, and then open the file again. If the red x still appears, you may have to delete the image and then insert it again.
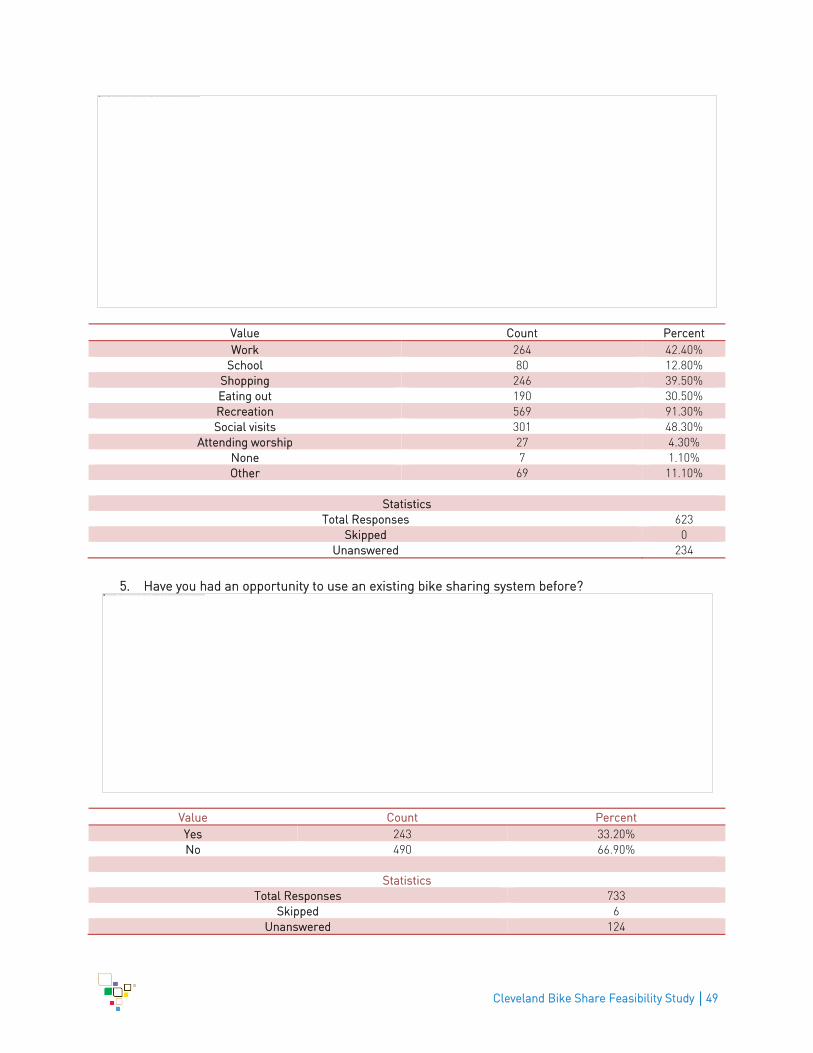
Cleveland Bike Share Feasibility Study │49
Value Count Percent
Work 264 42.40%
School 80 12.80%
Shopping 246 39.50%
Eating out 190 30.50%
Recreation 569 91.30%
Social visits 301 48.30%
Attending worship 27 4.30%
None 7 1.10%
Other 69 11.10%
Statistics
Total Responses 623
Skipped 0
Unanswered 234
5. Have you had an opportunity to use an existing bike sharing system before?
Value Count Percent
Yes 243 33.20%
No 490 66.90%
Statistics
Total Responses 733
Skipped 6
Unanswered 124
The image cannot be displayed. Your computer may not have enough memory to open the image, or the image may have been corrupted. Restart your computer, and then open the file again. If the red x still appears, you may have to delete the image and then insert it again.
The image cannot be displayed. Your computer may not have enough memory to open the image, or the image may have been corrupted. Restart your computer, and then open the file again. If the red x still appears, you may have to delete the image and then insert it again.
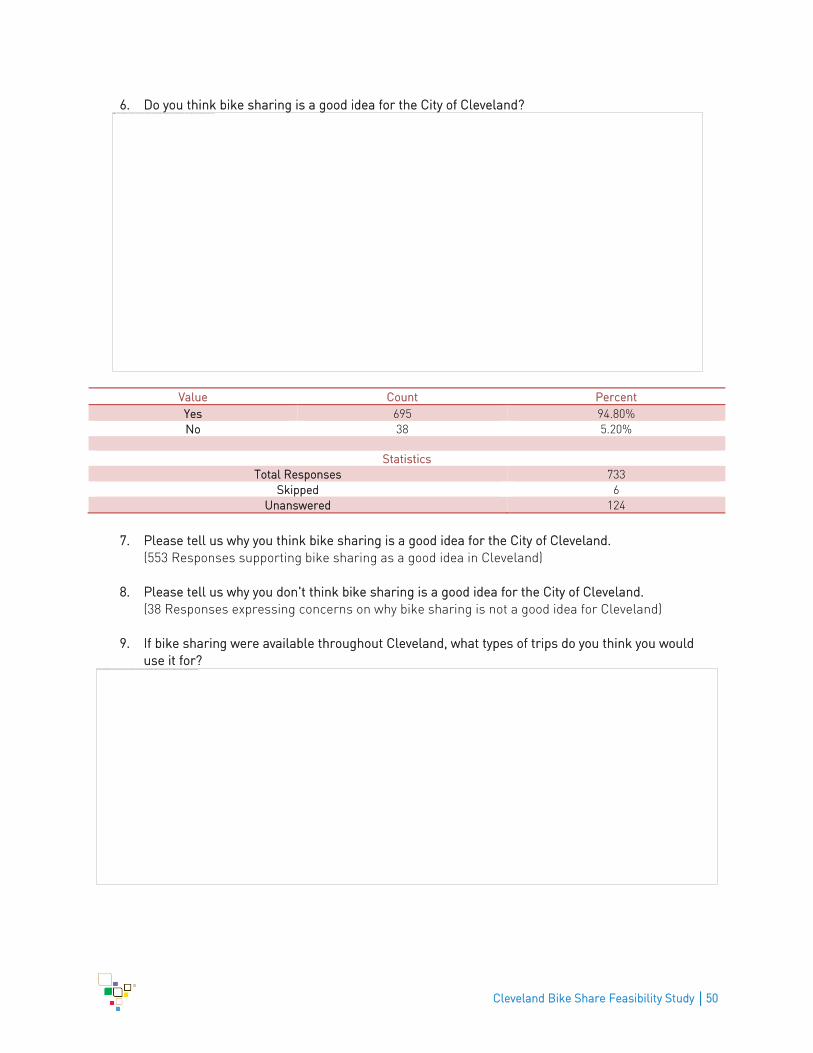
Cleveland Bike Share Feasibility Study │50
6. Do you think bike sharing is a good idea for the City of Cleveland?
Value Count Percent
Yes 695 94.80%
No 38 5.20%
Statistics
Total Responses 733
Skipped 6
Unanswered 124
7. Please tell us why you think bike sharing is a good idea for the City of Cleveland.
(553 Responses supporting bike sharing as a good idea in Cleveland)
8. Please tell us why you don't think bike sharing is a good idea for the City of Cleveland.
(38 Responses expressing concerns on why bike sharing is not a good idea for Cleveland)
9. If bike sharing were available throughout Cleveland, what types of trips do you think you would
use it for?
The image cannot be displayed. Your computer may not have enough memory to open the image, or the image may have been corrupted. Restart your computer, and then open the file again. If the red x still appears, you may have to delete the image and then insert it again.
The image cannot be displayed. Your computer may not have enough memory to open the image, or the image may have been corrupted. Restart your computer, and then open the file again. If the red x still appears, you may have to delete the image and then insert it again.
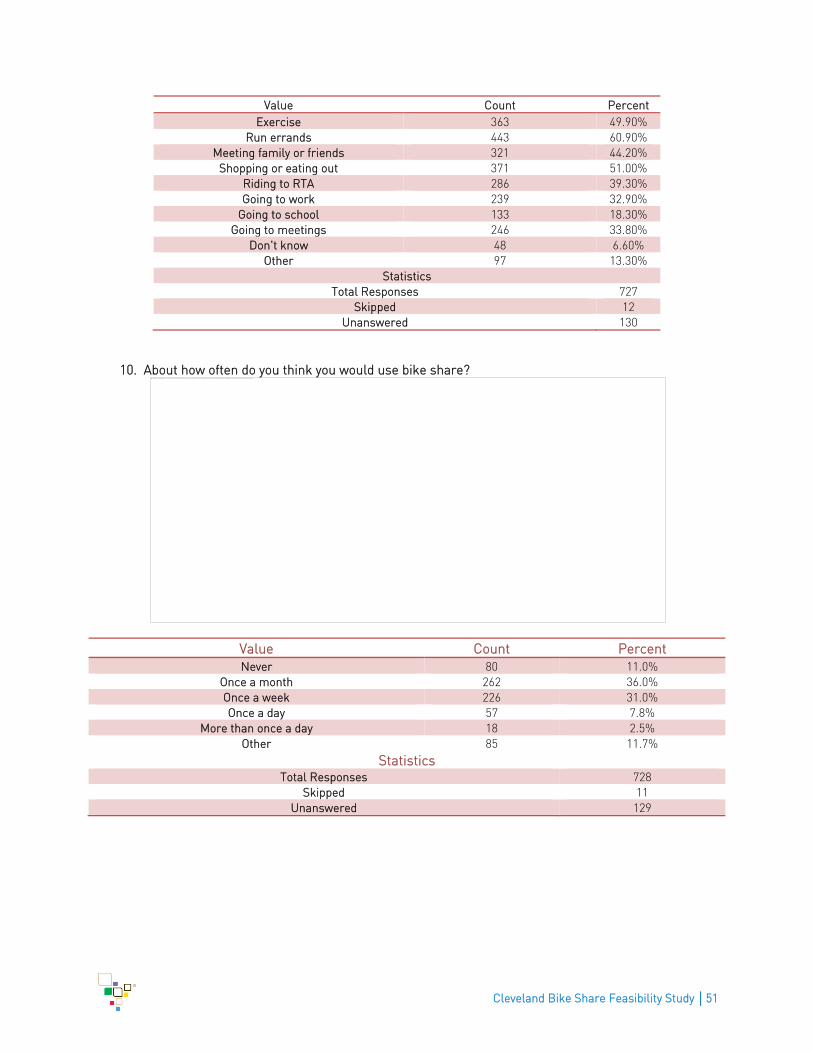
Cleveland Bike Share Feasibility Study │51
Value Count Percent
Exercise 363 49.90%
Run errands 443 60.90%
Meeting family or friends 321 44.20%
Shopping or eating out 371 51.00%
Riding to RTA 286 39.30%
Going to work 239 32.90%
Going to school 133 18.30%
Going to meetings 246 33.80%
Don't know 48 6.60%
Other 97 13.30%
Statistics
Total Responses 727
Skipped 12
Unanswered 130
10. About how often do you think you would use bike share?
Value Count Percent Never 80 11.0%
Once a month 262 36.0%
Once a week 226 31.0%
Once a day 57 7.8%
More than once a day 18 2.5%
Other 85 11.7%
Statistics Total Responses 728
Skipped 11
Unanswered 129
The image cannot be displayed. Your computer may not have enough memory to open the image, or the image may have been corrupted. Restart your computer, and then open the file again. If the red x still appears, you may have to delete the image and then insert it again.
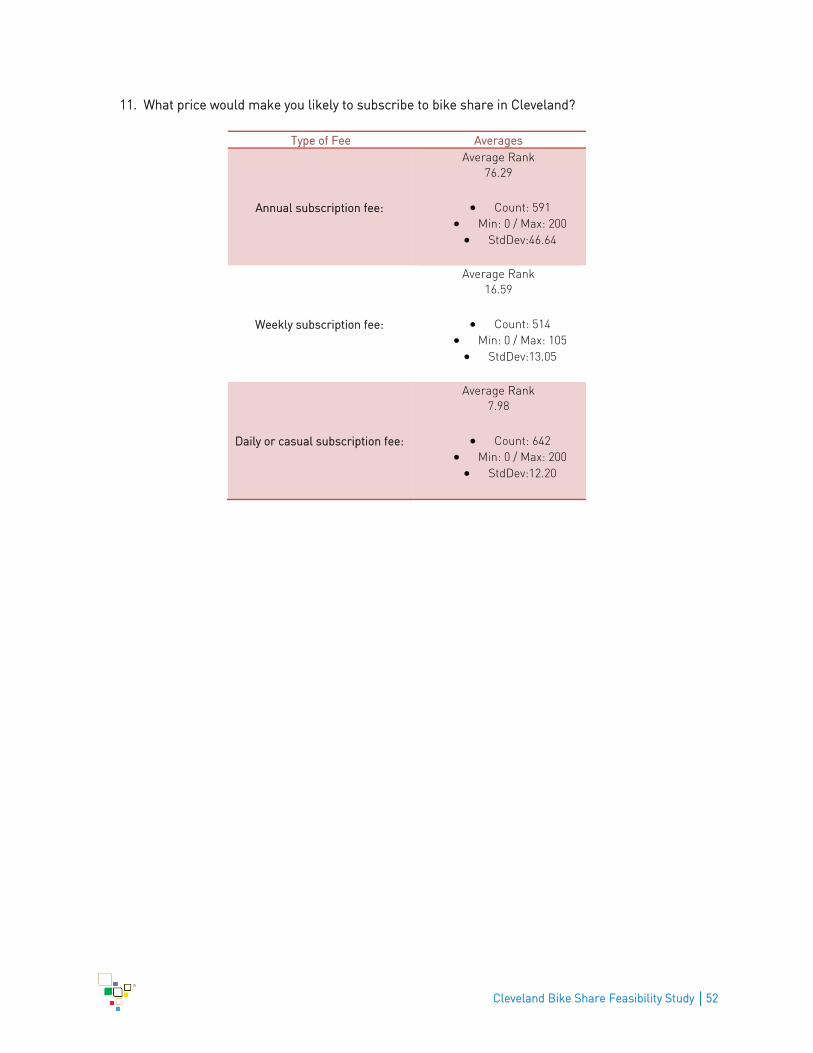
Cleveland Bike Share Feasibility Study │52
11. What price would make you likely to subscribe to bike share in Cleveland?
Type of Fee Averages
Annual subscription fee:
Average Rank
76.29
Count: 591
Min: 0 / Max: 200
StdDev:46.64
Weekly subscription fee:
Average Rank
16.59
Count: 514
Min: 0 / Max: 105
StdDev:13.05
Daily or casual subscription fee:
Average Rank
7.98
Count: 642
Min: 0 / Max: 200
StdDev:12.20
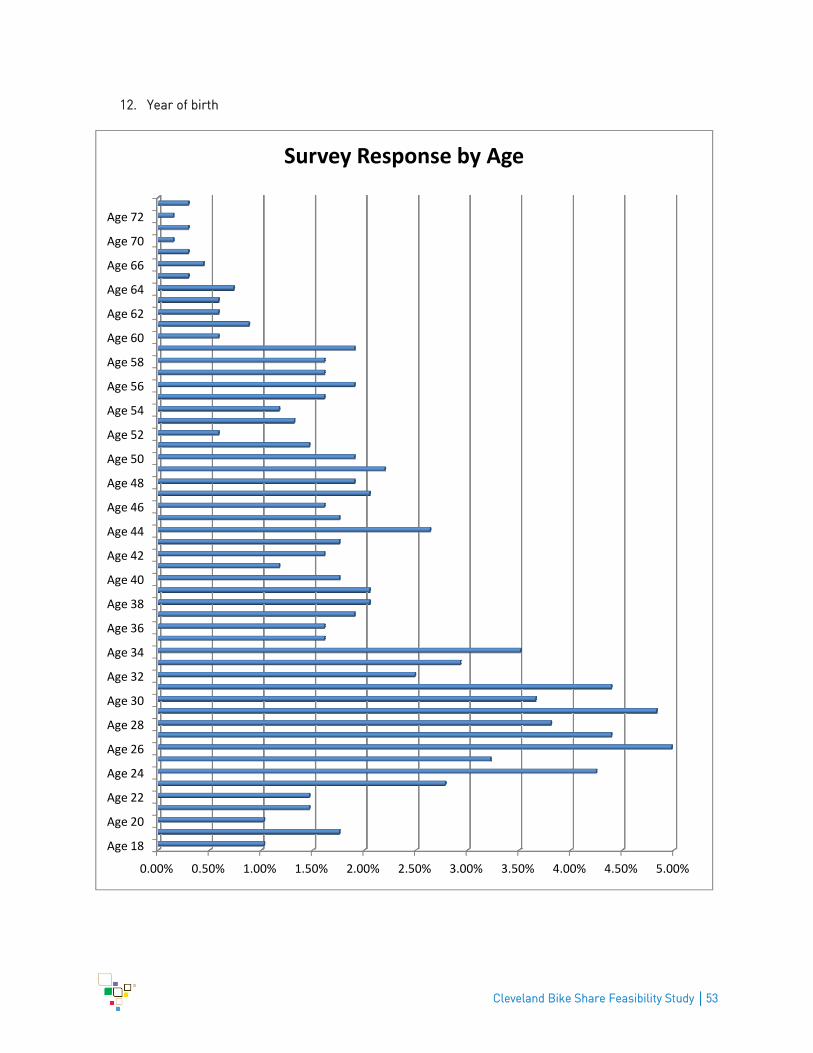
Cleveland Bike Share Feasibility Study │53
12. Year of birth
0.00% 0.50% 1.00% 1.50% 2.00% 2.50% 3.00% 3.50% 4.00% 4.50% 5.00%
Age 18
Age 20
Age 22
Age 24
Age 26
Age 28
Age 30
Age 32
Age 34
Age 36
Age 38
Age 40
Age 42
Age 44
Age 46
Age 48
Age 50
Age 52
Age 54
Age 56
Age 58
Age 60
Age 62
Age 64
Age 66
Age 70
Age 72
Survey Response by Age
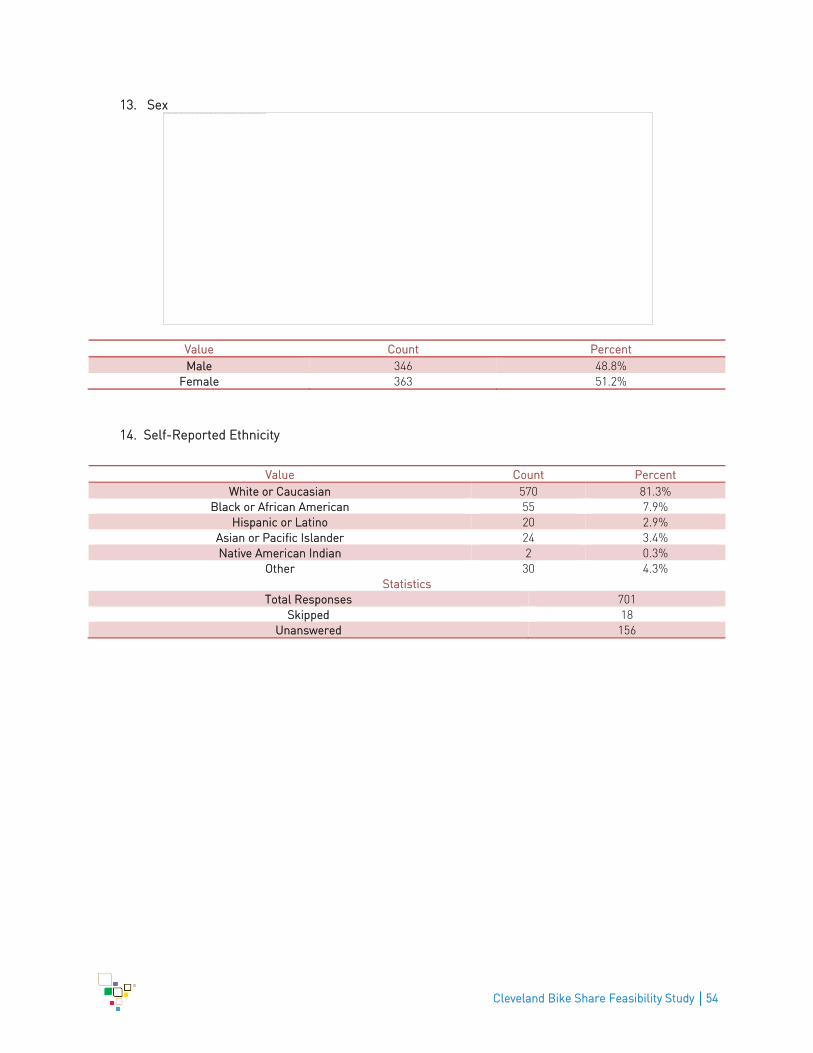
Cleveland Bike Share Feasibility Study │54
13. Sex
Value Count Percent
Male 346 48.8%
Female 363 51.2%
14. Self-Reported Ethnicity
Value Count Percent
White or Caucasian 570 81.3%
Black or African American 55 7.9%
Hispanic or Latino 20 2.9%
Asian or Pacific Islander 24 3.4%
Native American Indian 2 0.3%
Other 30 4.3%
Statistics
Total Responses 701
Skipped 18
Unanswered 156
The image cannot be displayed. Your computer may not have enough memory to open the image, or the image may have been corrupted. Restart your computer, and then open the file again. If the red x still appears, you may have to delete the image and then insert it again.
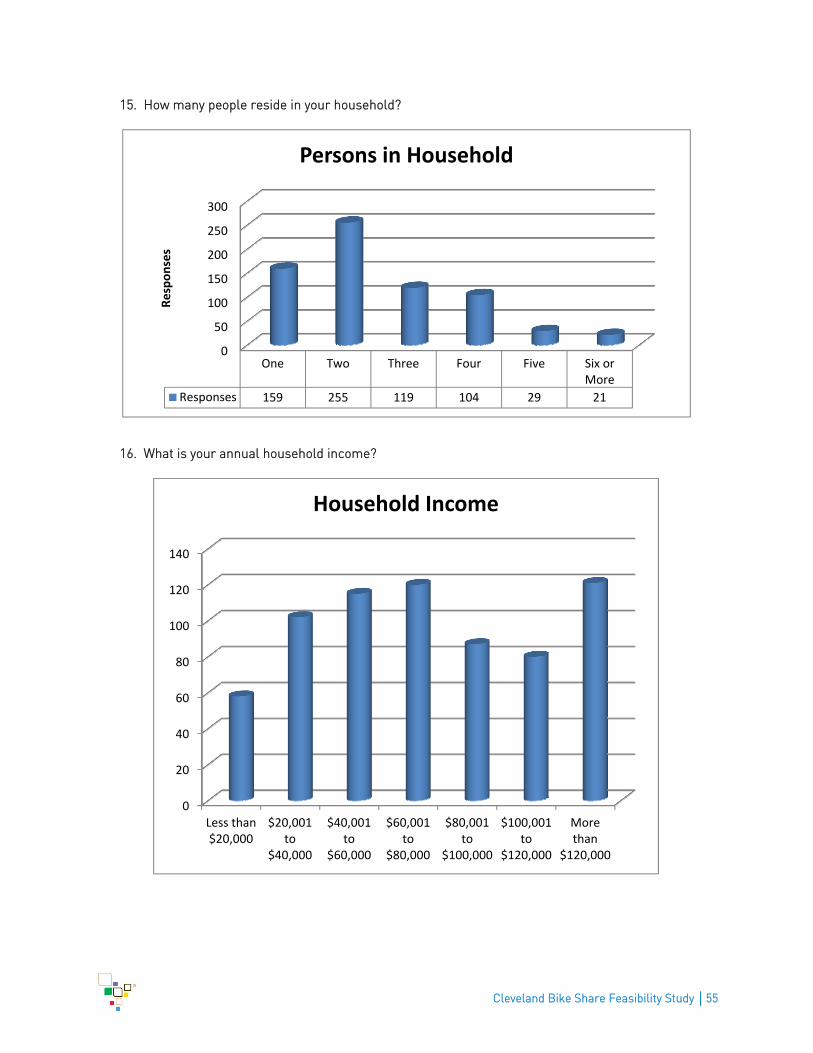
Cleveland Bike Share Feasibility Study │55
15. How many people reside in your household?
16. What is your annual household income?
0
50
100
150
200
250
300
One Two Three Four Five Six or More
Responses 159 255 119 104 29 21
Responses
Persons in Household
0
20
40
60
80
100
120
140
Less than $20,000
$20,001 to
$40,000
$40,001 to
$60,000
$60,001 to
$80,000
$80,001 to
$100,000
$100,001 to
$120,000
More than
$120,000
Household Income
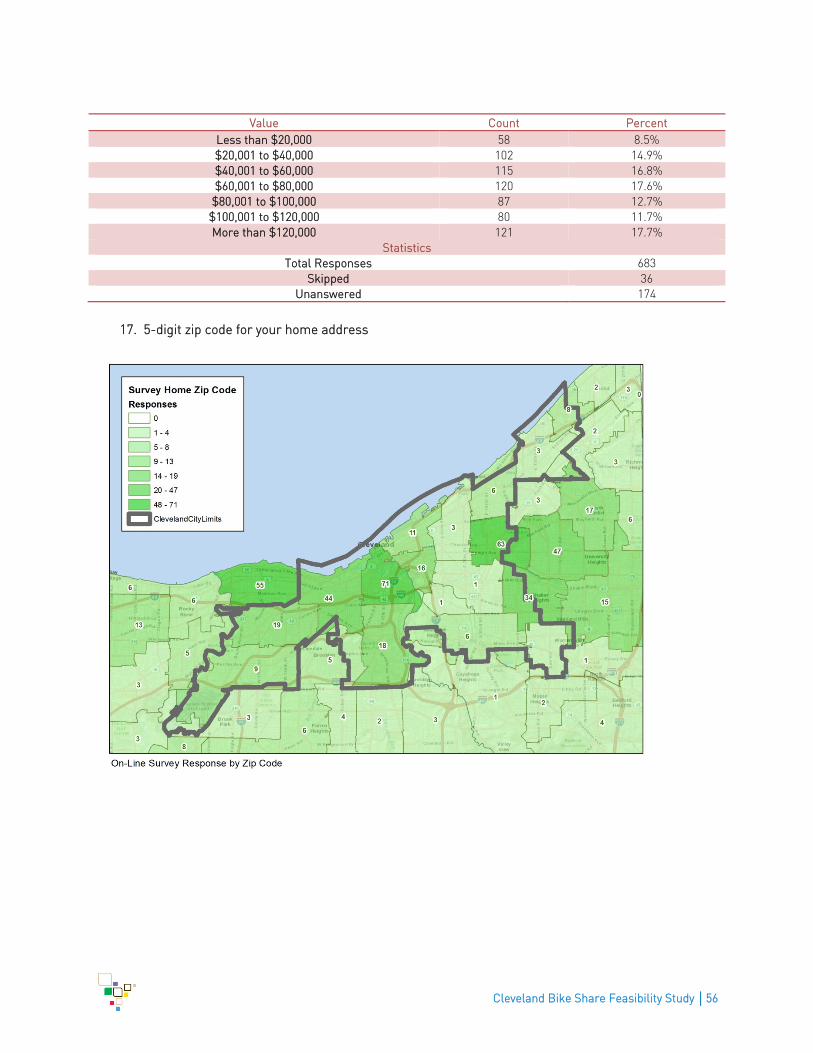
Cleveland Bike Share Feasibility Study │56
Value Count Percent
Less than $20,000 58 8.5%
$20,001 to $40,000 102 14.9%
$40,001 to $60,000 115 16.8%
$60,001 to $80,000 120 17.6%
$80,001 to $100,000 87 12.7%
$100,001 to $120,000 80 11.7%
More than $120,000 121 17.7%
Statistics
Total Responses 683
Skipped 36
Unanswered 174
17. 5-digit zip code for your home address
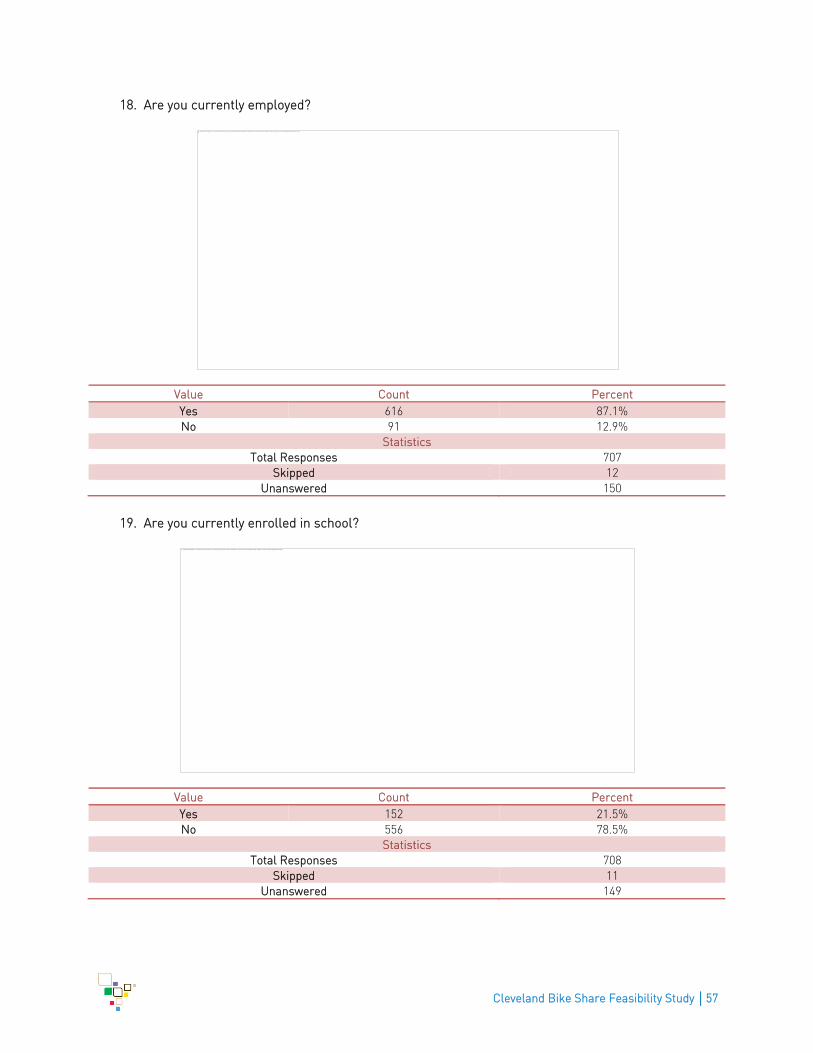
Cleveland Bike Share Feasibility Study │57
18. Are you currently employed?
Value Count Percent
Yes 616 87.1%
No 91 12.9%
Statistics
Total Responses 707
Skipped 12
Unanswered 150
19. Are you currently enrolled in school?
Value Count Percent
Yes 152 21.5%
No 556 78.5%
Statistics
Total Responses 708
Skipped 11
Unanswered 149
The image cannot be displayed. Your computer may not have enough memory to open the image, or the image may have been corrupted. Restart your computer, and then open the file again. If the red x still appears, you may have to delete the image and then insert it again.
The image cannot be displayed. Your computer may not have enough memory to open the image, or the image may have been corrupted. Restart your computer, and then open the file again. If the red x still appears, you may have to delete the image and then insert it again.