Embed Size (px)
Citation preview

Click to edit Master title style
1
Part II
The details

Click to edit Master title style
2
Core Indicator Data
• MIS Data– Data Elements
– Funding
– Accountability

Click to edit Master title style
3
Defining the Data
• SAM Codes• TOP Codes• Data Elements• Core Indicators
– “The Law”– Definitions– Negotiated Performance Targets– Measurement Approaches/Formulas
Funding

Click to edit Master title style
4
Student Accountability Model (SAM) & Taxonomy of Programs (TOP)
• Priority “A“ - Apprenticeship – Must have the of the Division of Apprenticeship Standards
approval
• Priority “B“ – Advanced Vocational– Used sparingly, no more than two courses in any one
program– “B” level courses must have a “C” prerequisite in the same
program area
• Priority "C" – Clearly Occupational– Generally taken in the middle stage of a program, detracts
"drop-ins."

Click to edit Master title style
5
Student Accountability Model (SAM) & Taxonomy of Programs (TOP), Continued
• Priority "D" – Possibly Occupational– Taken by students in the beginning stages of their
occupational programs– Can be survey course
• Priority “E” = Non-Occupational
Vocational Flag on TOP code– Designed to identify vocational “Programs” for federal
reporting (*) - see Taxonomy of Programs, Sixth Edition, July 2007

Click to edit Master title style
6
Data ElementsMIS System
• Students, Courses, Degrees, Services
• Student VTEA Data Elements– Economically Disadvantaged– Single Parent– Displaced Homemaker– Cooperative Work Experience Education– Tech Prep– Migrant Worker - Implementation in MIS SU 09

Click to edit Master title style
7
Accountability Requirements Section 113(b)
5 core indicators of performance:1. Student attainment of technical skill proficiencies;
2. Student attainment of credential, certificate, or degree;
3. Student retention in postsecondary education or transfer;
4. Student placement in military, apprenticeship, or employment
5. Student participation/completion of non-traditional training
State and Local adjusted levels of performance
– Levels of performance negotiated with USDE / State
Results reported annually

Click to edit Master title style
8
Perkins IV (2006) Core Indicators
1. Technical Skill AttainmentSuccessful CTE course completion (GPA)
2. Completions Program completion–Certificate, Degree & Transfer Prepared
3. Persistence & TransferStudent persistence in Higher Ed
4. Placement Placement in apprenticeship, employment, military, fed gov
5. Equity -- Nontraditional Fields Participation (5a)/Completion (5b) - nontraditional “fields”

Click to edit Master title style
9
Cohort Definitions Used for Measurement
Participant: NT Participation
– Perkins III -Any enrollment in a CTE course (TOP)
– Perkins IV – concentrator using assigned major
Concentrator: All other indicators
• Cohort of students enrolled during the cohort year and
– Successfully completed at least one course in the middle or end of a program (SAM A-C) and 12 vocational units within a single discipline (two digit TOP) or
– Program completion as indicated by receipt of ANY vocational credit certificate or degree
Leavers: Not enrolled in year following cohort year
– 2P1 - Completions
– 4P1 - Placement (Employment)

Click to edit Master title style
10
Assigning a Program to a Student
1. Award –TOP code of CTE Certificate or Degree
2. Concentrators
• Hierarchy based on SAM Priority code
• Assigned to the TOP where most CTE units occurred

Click to edit Master title style
11
Timeline for Outcomes & Outputs
• Negotiated Performance 2008-09– Negotiated Spring 2008– Reports publish in Spring 2009
• Cohort Year (2006-07)• +1 yr for outcomes (2007-08)
– Transfer– Persistence– Employment
• Outcomes have already occurred– Target low performance now!

Click to edit Master title style
12
Timeline for Outcomes & Outputs
Program Year 2006-07 2007-08 2008-09 2009-10
Negotiated in Fall 2007 Spring 2007 Fall 2007 Spring 2008 Fall 2008 Spring 2009 Fall 2009 Spring 2010
Measured in Fall 2006 Fall 2007 Spring 2008 Fall 2008 Spring 2009 Fall 2009 Spring 2010
Outcome Years 2007-08 cohort w/ 2008-09 outcomes
2006-07 cohort w/ 2007-08 outcomes
2005-06 cohort w/ 2006-07 outcomes

Click to edit Master title style
13
Core Indicator 1Technical Skill Attainment
• All Concentrators • Successful Course Completions
– Technical Skill Proficiencies• Vocational (CTE) Courses
– SAM A-C
– Vocational TOP
– G.P.A. – Grade reports (moved to Data Mart)
Click to edit Master title style
14
Core Indicator 1: Measurement &Performance Levels
SAM A - C Courses:
# Student concentrators with GPA > 2.00÷
# Students concentrators with Grades A – FExcludes students with only CR/NC or P/NP grades in SAM A-C courses
Plan Year Target Actual*2005-06 93.65%2006-07 92.58%2007-08 92.46%2008-09 92.46% 92.xx%2009-10 92.yy% %
* Based on spring 2008 Perkins IV reports.

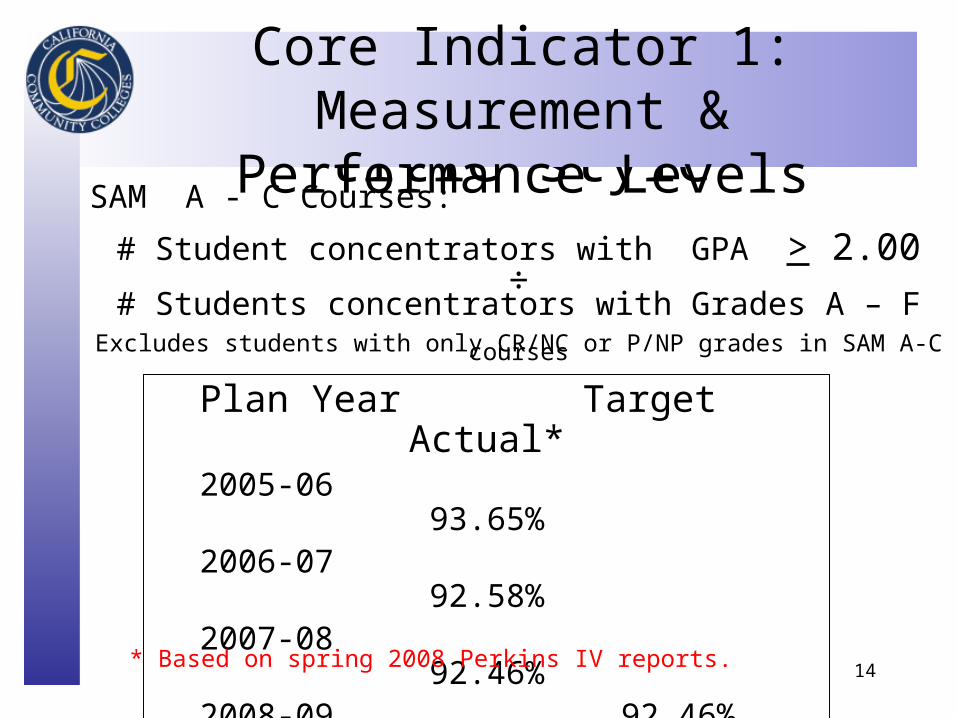
CI 1 - 2008 DataCore One 1P1 - Technical Skill Attainment
93.98% 93.89% 93.74% 93.65% 93.71% 93.65%92.58% 92.46%
80.00%
82.00%
84.00%
86.00%
88.00%
90.00%
92.00%
94.00%
96.00%
98.00%
100.00%
1998-99 1999-2000
2000-01 2001-02 2002-03 2003-04 2004-05 2005-06
Cohort Year
60.0%
65.0%
70.0%
75.0%
80.0%
85.0%
90.0%
95.0%
Total
Male
CA Empl Rate

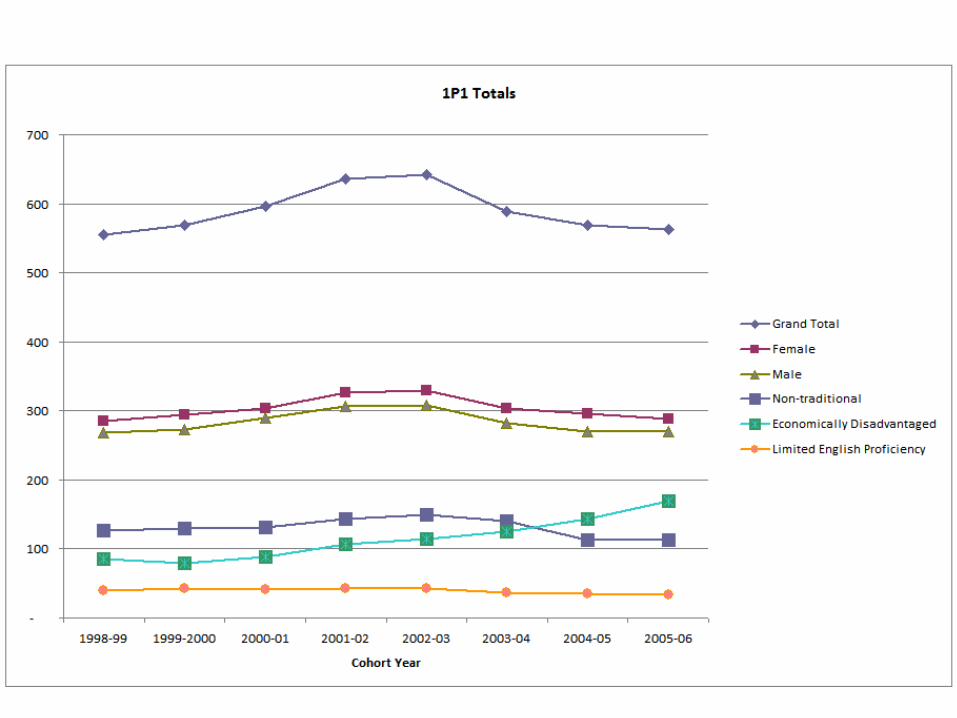
CI 1 - 2008 Data - Student counts
1P1 Totals
-
50,000
100,000
150,000
200,000
250,000
1998-99 1999-2000
2000-01 2001-02 2002-03 2003-04 2004-05 2005-06
Cohort Year
50.0%
55.0%
60.0%
65.0%
70.0%
75.0%
80.0%
85.0%
90.0%
95.0%
100.0%
Grand Total
Female
Male
Non-traditional
Economically Disadvantaged
Limited English Proficiency
CA Empl Rate
CI 1 - 2008 Data
Core One 1P1 - Technical Skill Attainment
93.98% 93.89% 93.74% 93.65% 93.71% 93.65%92.58% 92.46%
80.00%
82.00%
84.00%
86.00%
88.00%
90.00%
92.00%
94.00%
96.00%
98.00%
100.00%
1998-99 1999-2000
2000-01 2001-02 2002-03 2003-04 2004-05 2005-06
Cohort Year
60.0%
65.0%
70.0%
75.0%
80.0%
85.0%
90.0%
95.0%
Total
Male
EconomicallyDisadvantaged
CA Empl Rate

Core One 1P1 - Technical Skill Attainment
80.00%
82.00%
84.00%
86.00%
88.00%
90.00%
92.00%
94.00%
96.00%
98.00%
100.00%
1998-99 1999-2000 2000-01 2001-02 2002-03 2003-04 2004-05 2005-06
Cohort Year
60.0%
65.0%
70.0%
75.0%
80.0%
85.0%
90.0%
95.0%
100.0%
Total
Female
Male
CA Empl Rate
1998 2005
Fake DataExaggerated
93.67%

Core One 1P1 - Technical Skill Attainment
80.00%
82.00%
84.00%
86.00%
88.00%
90.00%
92.00%
94.00%
96.00%
98.00%
100.00%
1998-99 1999-2000 2000-01 2001-02 2002-03 2003-04 2004-05 2005-06
Cohort Year
60.0%
65.0%
70.0%
75.0%
80.0%
85.0%
90.0%
95.0%
100.0%
Total
Female
Male
CA Empl Rate
1998 2005
Fake DataExaggerated
84.3%83.2%
92.5%

Click to edit Master title style
20
Forecasting
• Wide range of forecasting techniques– Qualitative Forecasting Methods
• Judgmental Forecasting – Expert Forecasting – Consensus Forecasting– Informal
– Quantitative Forecasting Methods• Time Series
– Naïve Forecasting– Averaging
• Causal / Relational Models – assume cause and effect, and cause can be used to predict outcomes – if you know one variable, you can forecast the other
• Sophisticated
Click to edit Master title style
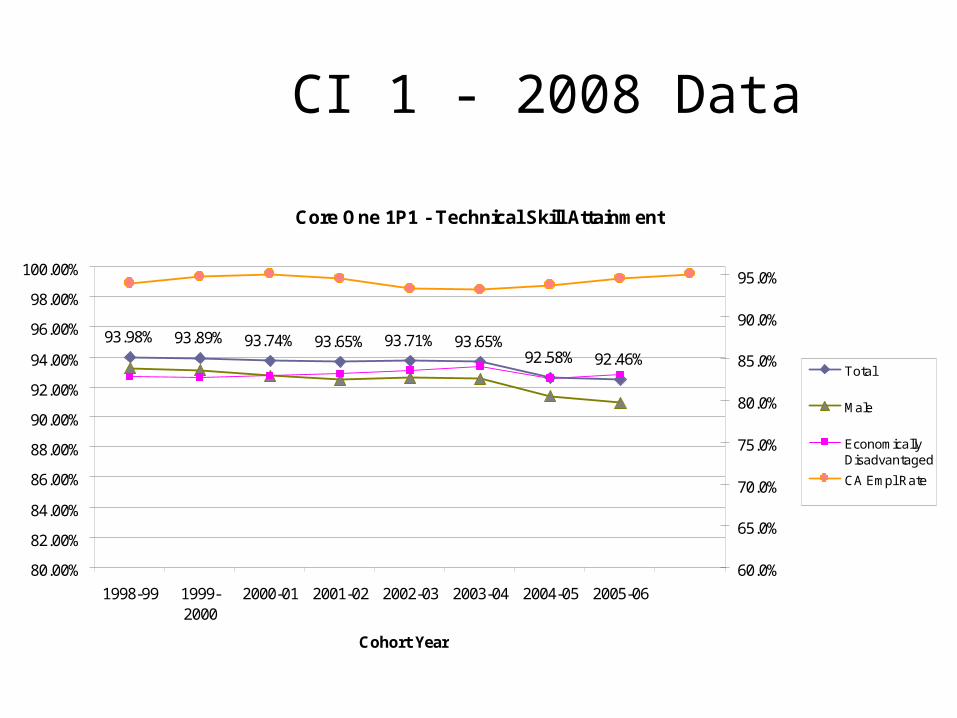
21
Qualitative Forecasting Methods
• Judgmental Forecasting – Expert Forecasting – Consensus Forecasting– Informal – Work best when background conditions are changing
rapidly • When economic, political or administrative conditions are in
flux,• When quantitative methods may not capture important
information about factors that are likely to alter historical patterns. (e.g., new large apprenticeship program)

Click to edit Master title style
22
Qualitative Forecasting Weaknesses
• anchoring events – allowing recent events to influence perceptions about future events, e.g. the college hosting a recent institute on student learning
• information availability– over-weighting the use of readily available information
• false correlation– incorporating information about factors that are assumed to influence outcomes, but do not
• inconsistency in methods and judgments – forecasters using different strategies over time to make their judgments, making them less reliable
• selective perceptions – ignoring important information that conflicts with the forecaster’s view about causal relationships
• wishful thinking – giving undue weight to what forecasters and government officials would like to see happen
• group think – when the dynamics of forming a consensus leads individuals to reinforce each other’s views rather than maintaining independent
judgments
• political pressure – where forecasters adjust estimates to meet the imperatives of budgetary or other college constraints.

Click to edit Master title style
23
Simple Quantitative
• Naïve Forecasting– Random Walk
• Last known• Random Walk with drift
– Averages– Seasonal adjustments
used in expert forecasting as the starting point for estimates that are then adjusted mentally

Click to edit Master title style
24
Random Walk
• Last known

Click to edit Master title style
25
• Last known
Random Walk

Click to edit Master title style
26
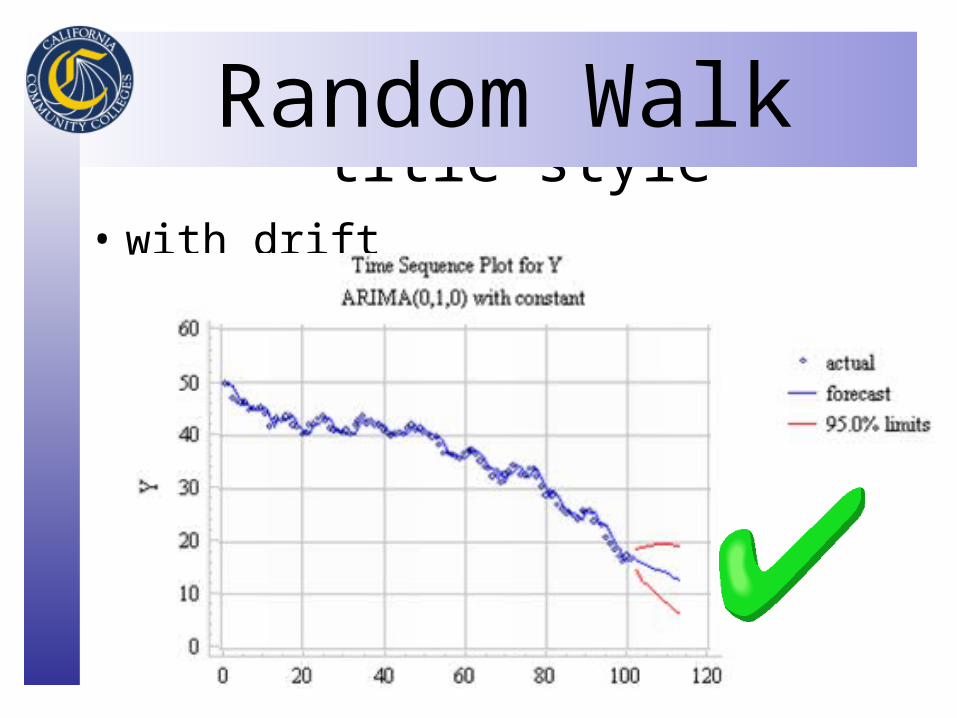
Random Walk
• with drift
Click to edit Master title style
27
Random Walk
• with drift
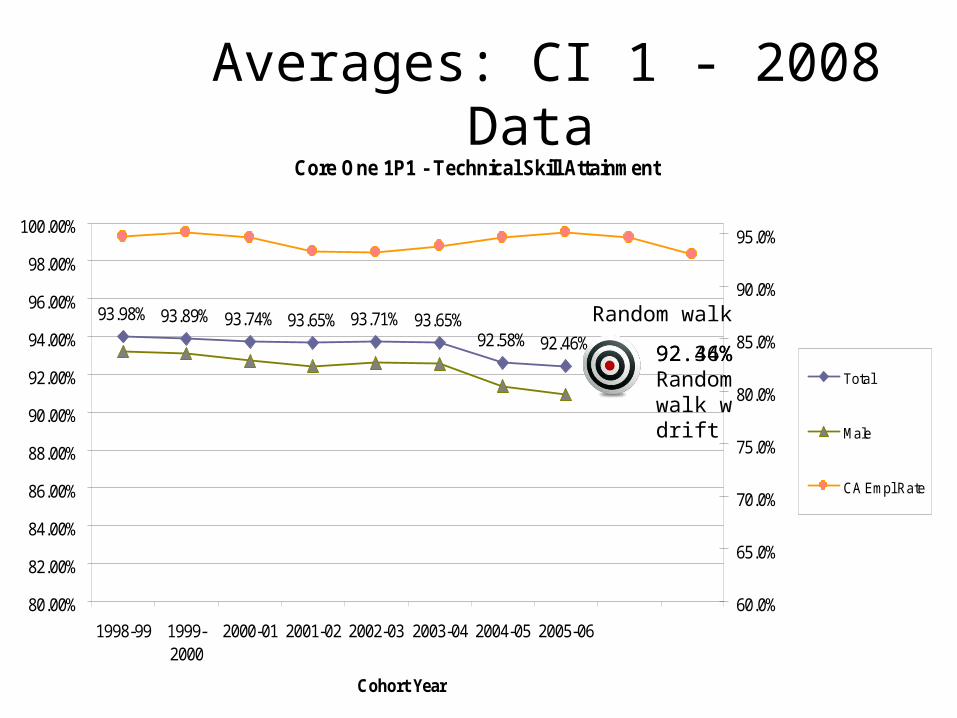
Averages: CI 1 - 2008 DataCore One 1P1 - Technical Skill Attainment
93.98% 93.89% 93.74% 93.65% 93.71% 93.65%92.58% 92.46%
80.00%
82.00%
84.00%
86.00%
88.00%
90.00%
92.00%
94.00%
96.00%
98.00%
100.00%
1998-99 1999-2000
2000-01 2001-02 2002-03 2003-04 2004-05 2005-06
Cohort Year
60.0%
65.0%
70.0%
75.0%
80.0%
85.0%
90.0%
95.0%
Total
Male
CA Empl Rate
2008
92.34%Random walk w drift
92.46%
Random walk
Click to edit Master title style
29
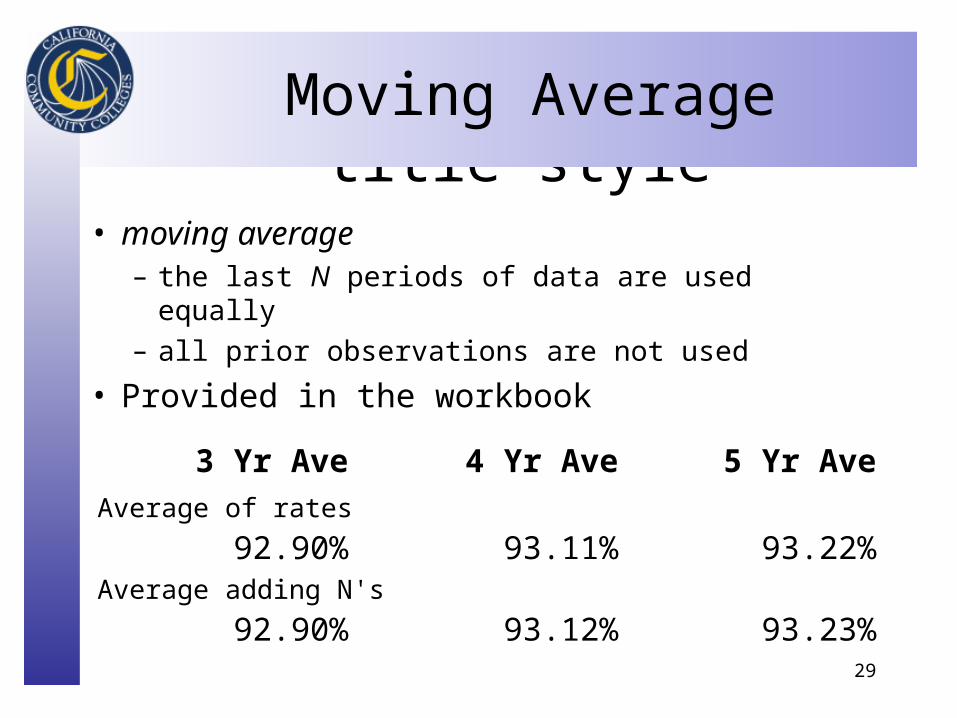
Moving Average
• moving average – the last N periods of data are used equally
– all prior observations are not used
• Provided in the workbook
3 Yr Ave 4 Yr Ave 5 Yr Ave
Average of rates
92.90% 93.11% 93.22%
Average adding N's
92.90% 93.12% 93.23%

Core One 1P1 - Technical Skill Attainment
93.98% 93.89% 93.74% 93.65% 93.71% 93.65%92.58% 92.46%
80.00%
82.00%
84.00%
86.00%
88.00%
90.00%
92.00%
94.00%
96.00%
98.00%
100.00%
1998-99 1999-2000
2000-01 2001-02 2002-03 2003-04 2004-05 2005-06
Cohort Year
60.0%
65.0%
70.0%
75.0%
80.0%
85.0%
90.0%
95.0%
Total
Male
CA Empl Rate
2008
Averages: CI 1 - 2008 Data
92.6%

Core One 1P1 - Technical Skill Attainment
93.98% 93.89% 93.74% 93.65% 93.71% 93.65%92.58% 92.46%
80.00%
82.00%
84.00%
86.00%
88.00%
90.00%
92.00%
94.00%
96.00%
98.00%
100.00%
1998-99 1999-2000
2000-01 2001-02 2002-03 2003-04 2004-05 2005-06
Cohort Year
60.0%
65.0%
70.0%
75.0%
80.0%
85.0%
90.0%
95.0%
Total
Male
CA Empl Rate
2008
What we used on CI 1 - 2008 Data
92.46%

Click to edit Master title style
32
Three Basic “Chuck” Rules
• With no application of local knowledge or sophisticated projections: – Declining for three or more years
• random walk, last known
– Increasing for three or more years • three year average
– Increasing and decreasing• three year average.

Click to edit Master title style
33
Core Indicator 2Program Completions
• Completers (numerator)– Transfer Prepared– Award in Current Year
– AA/AS degrees– Certificates
– Award in subsequent year with no Voc coursework– or Equivalent
• Leavers & Completers (denominator)– Left system (college) for one year and/or– Award in Current Year
– AA/AS degrees– Certificates– Transfer Prepared
– Award in subsequent year with no Voc coursework• Removed Persisters & Life-Long-Learners

Click to edit Master title style
34
CI 2-Completions: Measurement & Performance Levels
Certificate/Degree/Transfer Prepared÷
Concentrators (Leavers & Completers) Not LLL
* Based on Perkins IV data.
Year Target Actual*
2005-06 64.53%
2006-07 65.70%
2007-08 68.16%
2008-09 3 yr Ave 66.13% xx.xx%
2007-08 88.03%
2008-09 3 yr Ave 87.20% xx.xx%

Core Two 2P1 - Completions
64.76% 63.59%66.35% 65.28% 63.45% 64.53% 65.70%
68.16%
40.00%
50.00%
60.00%
70.00%
80.00%
90.00%
100.00%
1998-99 1999-2000
2000-01 2001-02 2002-03 2003-04 2004-05 2005-06
Cohort Year
Total Male Economically Disadvantaged Limited English Proficiency CA Empl Rate
CI 2 2008 data
66.13%

Core Two 2P1 - Completions
72.21% 71.73%
87.18% 87.25% 85.60% 86.68% 86.90% 88.03%
40.00%
50.00%
60.00%
70.00%
80.00%
90.00%
100.00%
1998-99 1999-2000
2000-01 2001-02 2002-03 2003-04 2004-05 2005-06
Cohort Year
Total Female Male Economically Disadvantaged Limited English Proficiency CA Empl Rate
fees increase Fall 2004from $18 - $26
fees increase Sp 2003from $11 - $18
CA hits 6.6% high unemp rate Jan 04
CI 2 2008 data revised
3 yr ave

Click to edit Master title style
37
Core Indicator 3 Persistence & Transfer
Concentrators who were not leavers in the year following the cohort yearor
Transfers to CCC/CSU/UC/Privates (National Student Loan Clearinghouse)÷
All Concentrators who were not completers with degrees or certificates (unless transferring)
Year Target Actual*
2005-06 93.02%
2006-07 92.80%
2007-08 93.03%
2008-09 3 yr Ave 92.95% xx.xx%

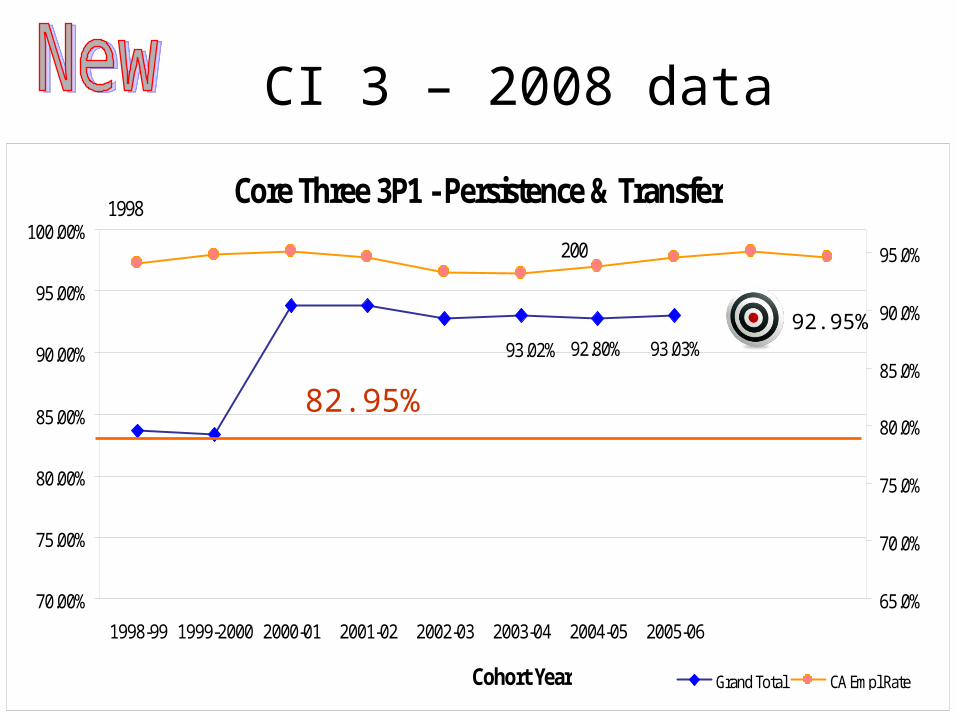
CI 3 – 2008 dataCore Three 3P1 - Persistence & Transfer
80.00%
82.00%
84.00%
86.00%
88.00%
90.00%
92.00%
94.00%
96.00%
98.00%
1998-99 1999-2000 2000-01 2001-02 2002-03 2003-04 2004-05 2005-06
Cohort Year
65.0%
70.0%
75.0%
80.0%
85.0%
90.0%
95.0%
Grand Total Female Male Economically Disadvantaged Non-traditional CA Empl Rate
19982007
Core Three 3P1 - Persistence & Transfer
93.02% 92.80% 93.03%
70.00%
75.00%
80.00%
85.00%
90.00%
95.00%
100.00%
1998-99 1999-2000 2000-01 2001-02 2002-03 2003-04 2004-05 2005-06
Cohort Year
65.0%
70.0%
75.0%
80.0%
85.0%
90.0%
95.0%
Grand Total CA Empl Rate
1998
200
2007
CI 3 – 2008 data
92.95%
82.95%

Click to edit Master title style
40
Core Indicator 4 Placement
• Placement– Leavers and Completers
• Minus Continuing in Two or Four Year Institutions – CCC or National Student Loan Clearinghouse
– Employment 1st year out• UI wage file match
– Employment any quarter in Academic Yr after cohort year
– Apprenticeship, Military, Fed Gov

Click to edit Master title style
41
CI 4 Placement : Measurement & Performance Levels
Leavers & Completers in UI covered employment or
Apprenticeship, Military, Fed Gov÷
All Leavers & Completers
*Based on Spring 2008 Perkins IV data.
Year Target Actual*
2005-06 78.40%
2006-07 80.15%
2007-08 81.04%
2008-09 3 yr Ave 79.86% xx.xx%
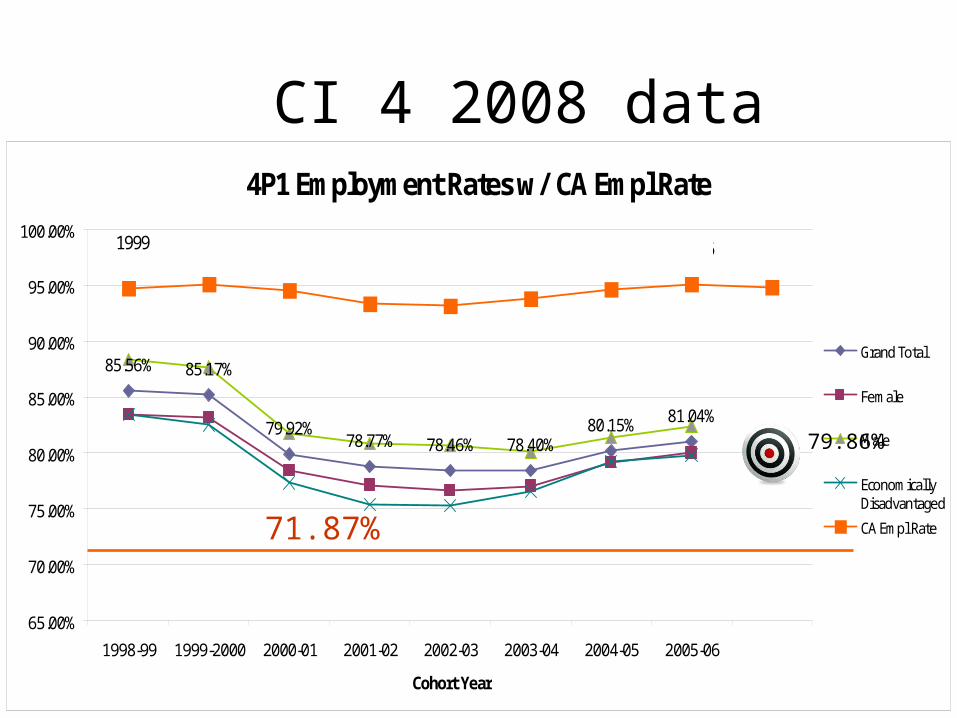
4P1 Employment Rates w/ CA Empl Rate
85.56% 85.17%
79.92%78.77% 78.46% 78.40%
80.15% 81.04%
65.00%
70.00%
75.00%
80.00%
85.00%
90.00%
95.00%
100.00%
1998-99 1999-2000 2000-01 2001-02 2002-03 2003-04 2004-05 2005-06
Cohort Year
Grand Total
Female
Male
EconomicallyDisadvantaged
CA Empl Rate
1999 2006
CI 4 2008 data
79.86%
71.87%
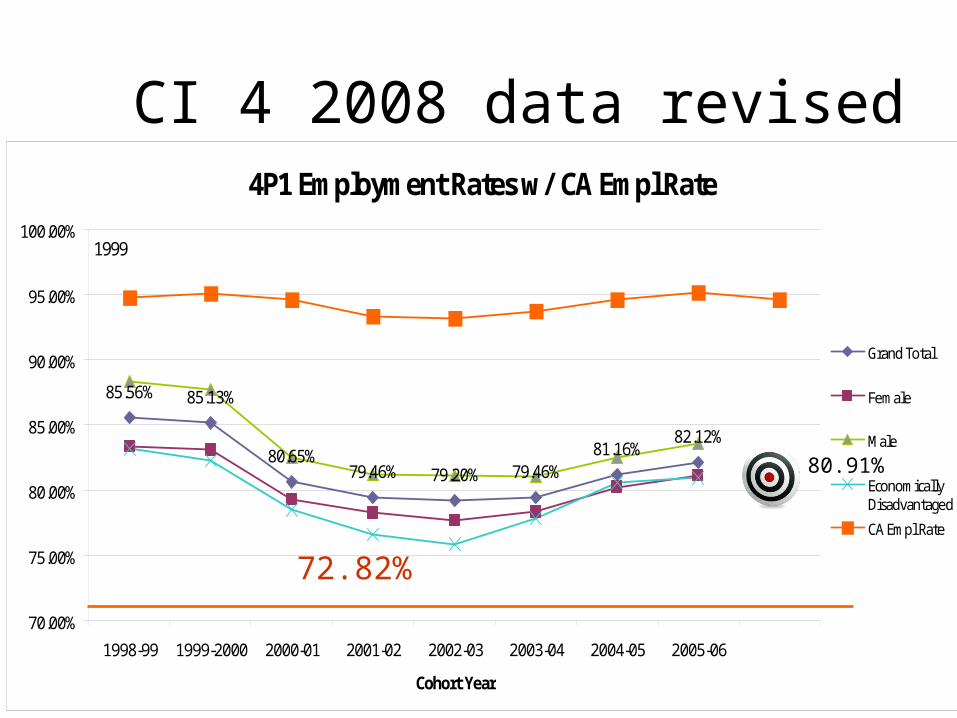
4P1 Employment Rates w/ CA Empl Rate
85.56% 85.13%
80.65%79.46% 79.20% 79.46%
81.16%82.12%
70.00%
75.00%
80.00%
85.00%
90.00%
95.00%
100.00%
1998-99 1999-2000 2000-01 2001-02 2002-03 2003-04 2004-05 2005-06
Cohort Year
Grand Total
Female
Male
EconomicallyDisadvantaged
CA Empl Rate
1999 2006
CI 4 2008 data revised
80.91%
72.82%
Click to edit Master title style
44
Core Indicator 5Gender Equity
Programs leading to Nontraditional Fields
(e.g., Men in Nursing – Women in Auto)
75% / 25% from 2000 census employment data
– NAPE developed Nontraditional CIP table
• Job codes (SOC) mapped to 2000 Census data
• SOC codes mapped to CIP (USDE)
• CIP codes mapped to TOP (CCC)

Click to edit Master title style
45
Core Indicator 5Gender Equity
Programs leading to Nontraditional Fields
Nontraditional Gender Students
÷
All Students in NT Program

Click to edit Master title style
46
CI 5a: Participation Measurement & Performance Levels
Nontraditional participants enrolled in a Nontraditional TOP Code
÷All participants enrolled in a
Nontraditional TOP Code
* Based on Spring 2008 Perkins IV data.
Year Target Actual*
2005-06 22.06%
2006-07 21.78%
2007-08 21.47%
2008-09 Random Walk 21.47% xx.xx%
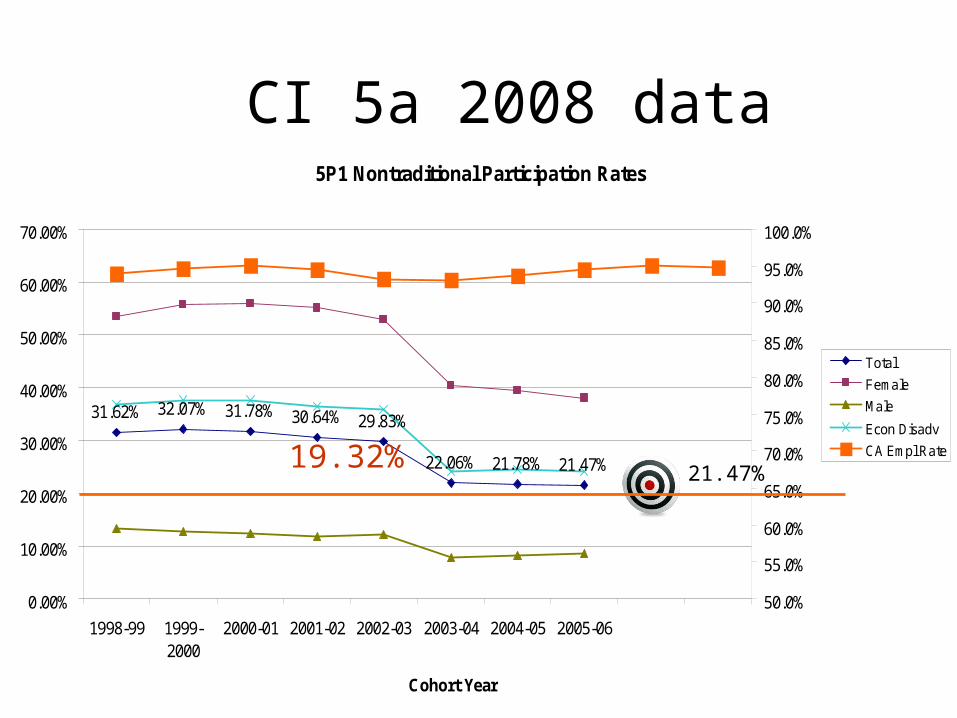
5P1 Nontraditional Participation Rates
31.62% 32.07% 31.78% 30.64% 29.83%
22.06% 21.78% 21.47%
0.00%
10.00%
20.00%
30.00%
40.00%
50.00%
60.00%
70.00%
1998-99 1999-2000
2000-01 2001-02 2002-03 2003-04 2004-05 2005-06
Cohort Year
50.0%
55.0%
60.0%
65.0%
70.0%
75.0%
80.0%
85.0%
90.0%
95.0%
100.0%
Total
Female
Male
Econ Disadv
CA Empl Rate
CA Employment Rates (BLS) 20071998
CI 5a 2008 data
21.47%19.32%
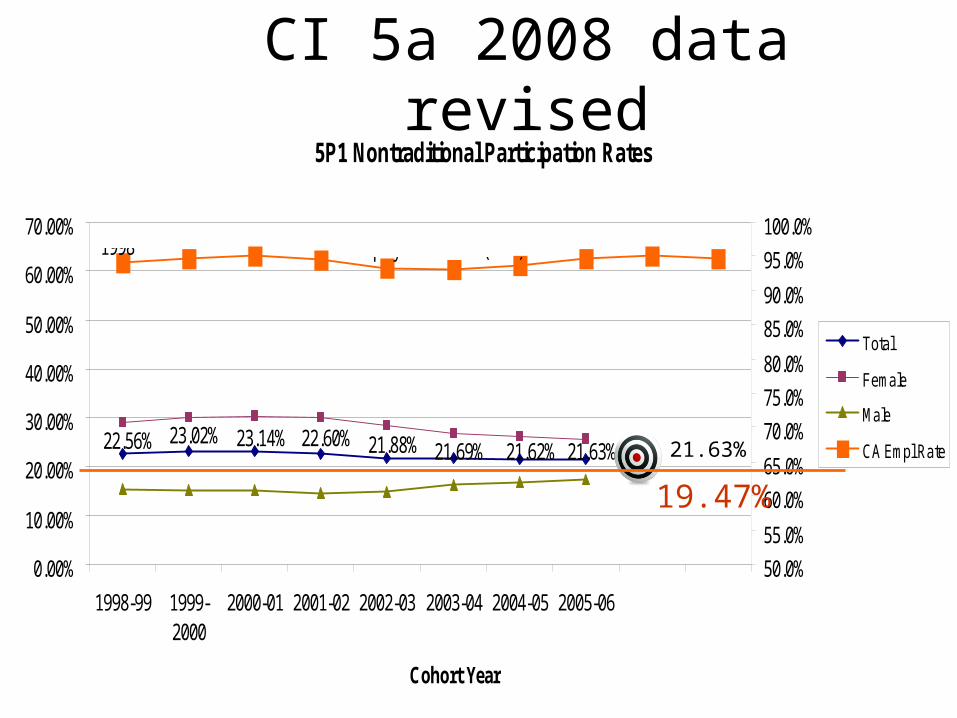
5P1 Nontraditional Participation Rates
22.56% 23.02% 23.14% 22.60% 21.88% 21.69% 21.62% 21.63%
0.00%
10.00%
20.00%
30.00%
40.00%
50.00%
60.00%
70.00%
1998-99 1999-2000
2000-01 2001-02 2002-03 2003-04 2004-05 2005-06
Cohort Year
50.0%
55.0%
60.0%
65.0%
70.0%
75.0%
80.0%
85.0%
90.0%
95.0%
100.0%
Total
Female
Male
CA Empl Rate
CA Employment Rates (BLS) 20071998
CI 5a 2008 data revised
21.63%
19.47%

Click to edit Master title style
49
Nontraditional “completers” of nontraditional programs
÷All “completers” of nontraditional programs
CI 5b Completion: Measurement & Performance Levels
* Based on Spring 2008 Perkins IV data.
Year Target Actual*
2005-06 23.85%
2006-07 23.33%
2007-08 23.28%
2008-09 Random Walk 23.28% xx.xx%

CI 5b – Spring 2008 data
23.28%
20.95%

CI 5b - 2008 data revised
25.38%
22.84%

Click to edit Master title style
52
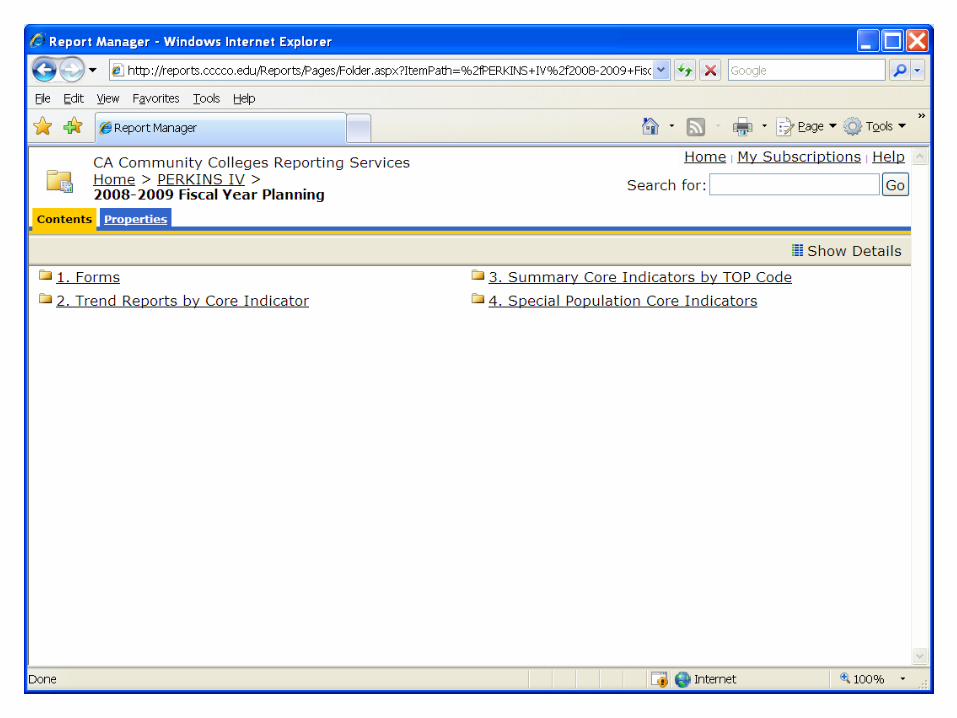
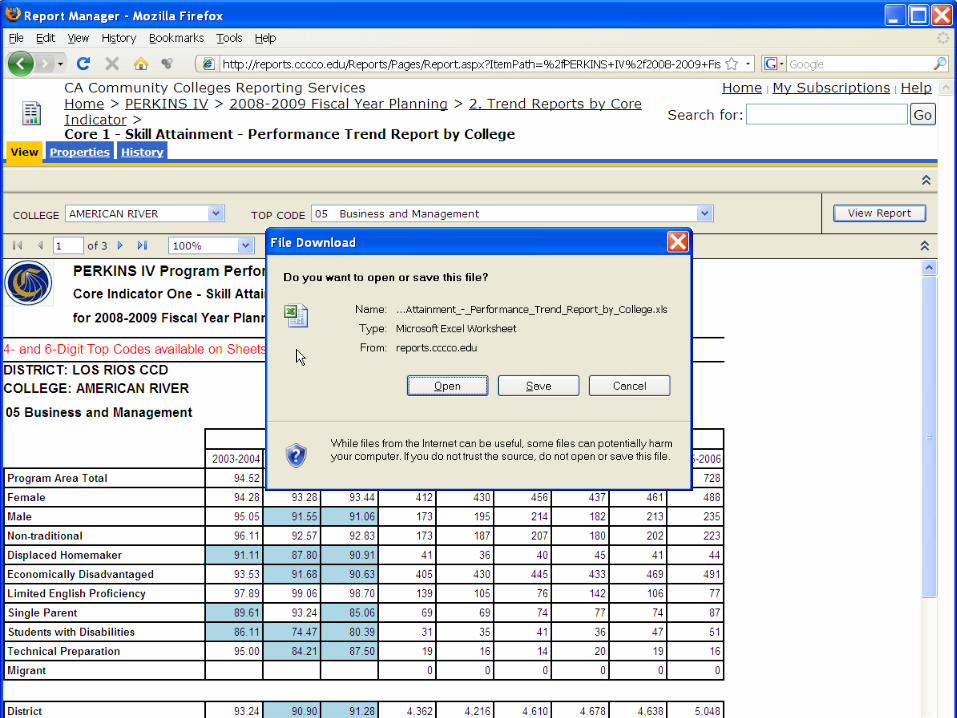
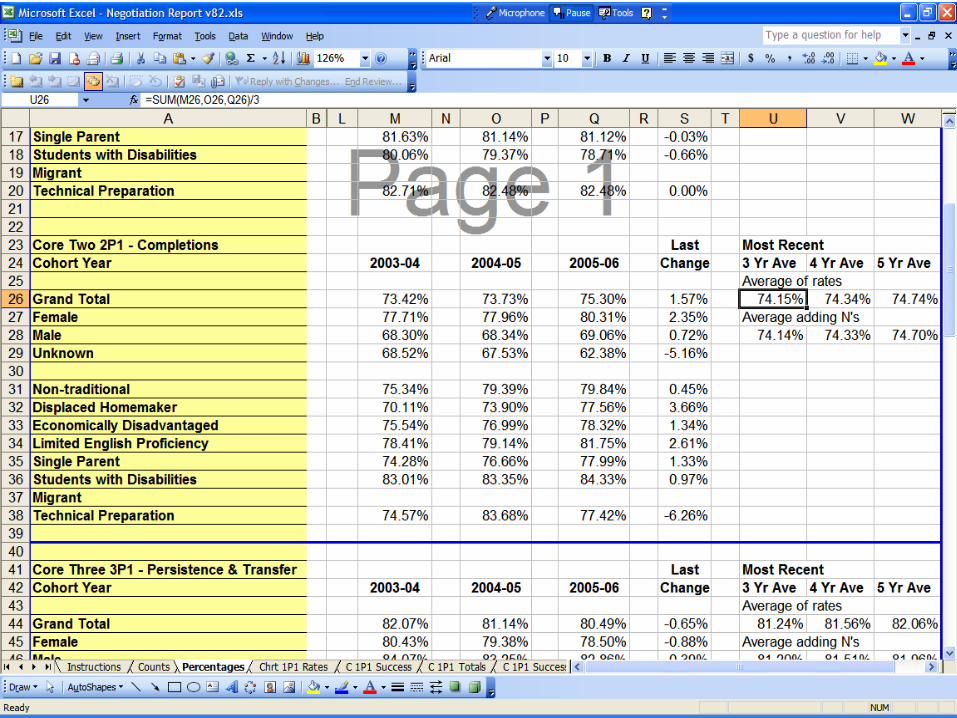
CI & Negotiation Reports
• Negotiation reports– Developed for negotiations
• College, District, and State Level• Special Pops detail • 8 years history• Final version 10/14/08
• All Core Indicator Reports– Easier access – Excel or PDF reports– Easier graphing in Excel
• Progressive scrutiny on use of reports– Below 90% of Target in any Indicator
Click to edit Master title style
53
Access
• http://www.cccco.edu• Important Documentation
– Negotiation Report Instructions (1st Tab)– Quick Reference (not yet available)– System Documentation– System Requirements
• No more Installing plug-in• No Administrative rights requirements• Best viewed with MS Internet Explorer
• Email notification when available

Report Selections

Report Years
Report Years

Report Years

Indicator 1P1

Indicator 1P1

Indicator 1P1

Indicator 1P1
Indicator 1P1

misweb

misweb

misweb

Click to edit Master title style
66
Report Structures
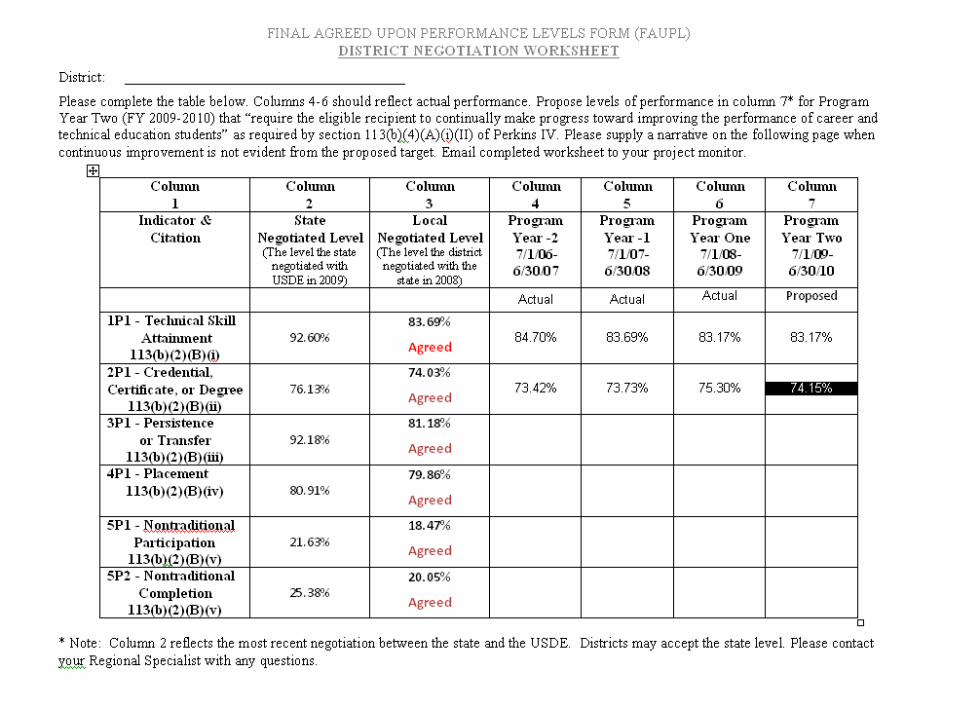
• Negotiation Workbooks– FAUPL negotiation worksheet
• Perkins IC - Local Application
• Forms • Perkins IC - Local Application
– Targets and Performance • Perkins IC - Final Report
• Summary Reports– All five Indicators on one page
• Answer sheet style• Detail Reports with counts
• Trend Reports – Percents and counts – Detailed breakouts for each Indicator component
• Special Population Reports

Click to edit Master title style
67
Negotiation Workbooks
Worksheets:• Instructions• Counts• Percentages• Charts
– Rates– Counts
• Data work tables– Percentages, Success, Totals “only” sheets– Fees– Employment

Negotiation Tables - Counts

Negotiation Tables - Percentages

Negotiation Charts

Click to edit Master title style
71
Practice using the Data
Negotiation Exercise:
• Review FAUPL Worksheet
• Walk through common scenarios
• Complete the FAUPL using first indicators
• Negotiate or Accept State Targets

Faupl

Click to edit Master title style
73
Local Application CTE-6

Click to edit Master title style
74
2008 FAUPL

FAUPL col 3

Click to edit Master title style
76
Percentages

FAUPL col 456

Indicator 1P1 Rates Default GroupsCore One 1P1 - Technical Skill Attainment
70.00%
75.00%
80.00%
85.00%
90.00%
95.00%
100.00%
1998-99 1999-2000
2000-01 2001-02 2002-03 2003-04 2004-05 2005-06
Cohort Year
Total
Female
Male
Nontrad
Econ Disadv
CA Empl Rate
1998 2005

Indicator 1P1 2 Rate

Indicator 1P1 Success
Indicator 1P1 Totals

Indicator 1P1

Indicator 1P1 2 Rate
83.17%
74.85%

Columns 4-5-6

Justification

Click to edit Master title style
86
Indicator 2P1

Click to edit Master title style
87
Indicator 2P1 table

Faupl paste
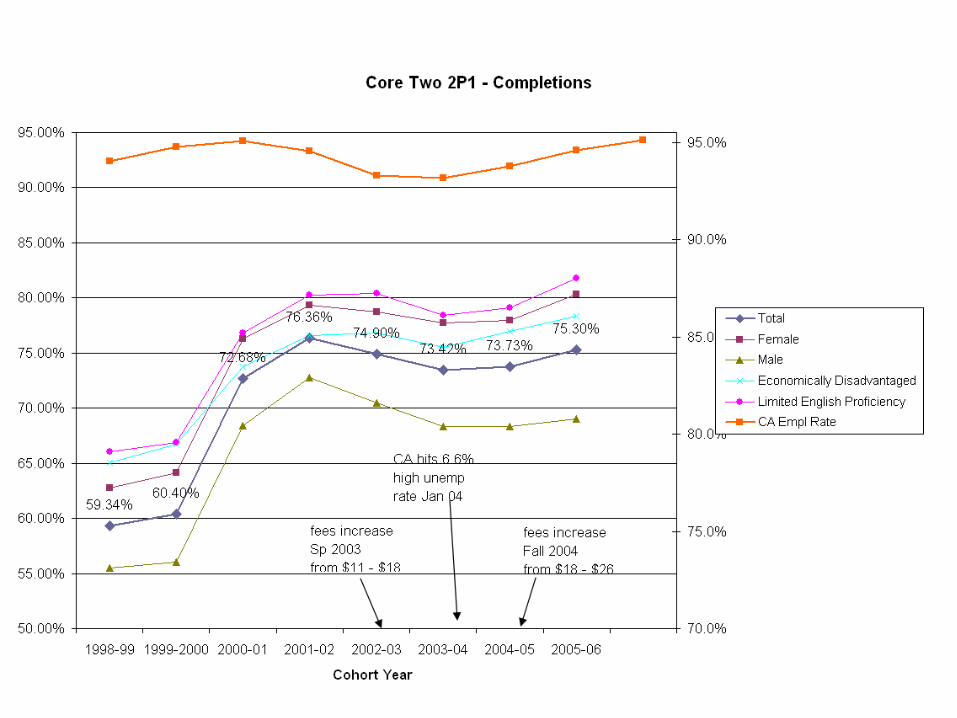
Chart 2p1
Click to edit Master title style
90
Average
Faupl 2p1
Faupl 2p1 complete
Click to edit Master title style
93
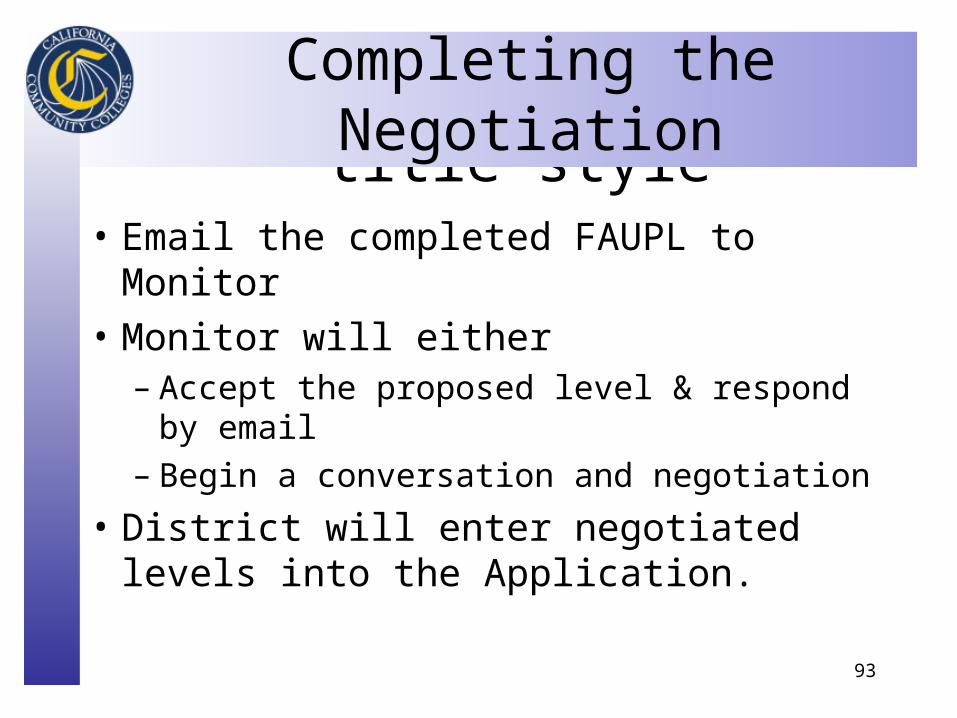
Completing the Negotiation
• Email the completed FAUPL to Monitor
• Monitor will either – Accept the proposed level & respond by email– Begin a conversation and negotiation
• District will enter negotiated levels into the Application.

Click to edit Master title style
94
Negotiating Targets
• State negotiates targets USDE– Targets for 1 year – Next 2 years (3rd & 4th)– Scheduled for April 2009
• Worksheets without state targets are available now• State Targets will be provided when available
• Locals either:– Accept state targets– Negotiate local targets
• Included in Local Plans– Targets for next year – Negotiations complete by May 15

Click to edit Master title style
95
The 10,000ft. View
1. District Assesses performance with form I-E-D a. Determine improvement status
b. If necessary, alter planning process
c. Complete 2009-10 planning
2. Complete the 2009-10 FAUPLEa. Analyze overall district performance
b. Determine proposed targets for the next year
3. Negotiate targets with System Office monitor
4. Complete local application form CTE-6
5. Complete local application form CTE-7

Click to edit Master title style
96
Questions?
Resources: – Project Monitor– Nontraditional
• Joint Special Populations Committee (JSPAC.org),• Institute for Women in Trades, Technology & Science
(IWITTS.com), • National Alliance for Partnerships in Equity (NAPE.org)
– Forecasting literature• Fee Impact Study - CCCCO -
– http://www.cccco.edu/Portals/4/Reports/impact_study_051.pdf
• Enrollment Management papers– http://www.cap-esp.com/
• Keith Guerin (1999)
Chuck Wiseley - [email protected], 916.327.5895