Embed Size (px)
Citation preview

Click to edit Master title style
Click to edit Master subtitle style
1
Modeling of 1,3-Butadiene
for Urban and Industrial Areas
B. Rappenglück and B. Czader
Department of Earth and Atmospheric SciencesUniversity of Houston

Click to edit Master title style
Click to edit Master subtitle style
2
Why 1,3-butadiene?• It is toxic and human carcinogen.
• It is designated as Hazardous Air Pollutant (HAP) by the Clean Air Act. Therefore, EPA is required to regulate its emissions.
• Its presence in the air accelerates ozone formation.Breathing ozone causes health effects as well as damages vegetation.
• Potential precursor of secondary organic aerosol (SOA) under high NOx levels (Sato et al., 2011)
Click to edit Master title style
Click to edit Master subtitle style
3
Why 1,3-butadiene?• It is toxic and human carcinogen.
• It is designated as Hazardous Air Pollutant (HAP) by the Clean Air Act. Therefore, EPA is required to regulate its emissions.
• Its presence in the air accelerates ozone formation.Breathing ozone causes health effects as well as damages vegetation.
• Potential precursor of secondary organic aerosol (SOA) under high NOx levels (Sato et al., 2011)
• High emissions and concentrations in the Houston metropolitan area:
City/StateObservation
countMean(ppbV)
Median(ppbV)
75th-percentile(ppbV)
90th-percentile(ppbV)
Port Neches, TX 61 1.02 0.51 1.40 2.66
Houston, TX 7218 1.30 0.18 0.68 2.10
Phoenix, AZ 26 0.19 0.14 0.34 0.46
New York, NY 12 0.14 0.13 0.25 0.30
Calexico, CA 31 0.20 0.11 0.21 0.39
Los Angeles, CA 25 0.13 0.10 0.18 0.23
Wilmington, NC 48 0.52 0.05 0.05 0.58
Seattle, WA 25 0.06 0.04 0.08 0.12
Year 2006
source: EPA AirData, available at http://www.epa.gov/airdata

Click to edit Master title style
Click to edit Master subtitle style
4
Measured data
Collected by an automated gas chromatograph (Auto_GC) by Texas Commission on Environmental Quality (TCEQ) and Houston Regional Monitoring (HRM); Reported in 1-h intervals
Aug. 25 – Sep. 30, 2006HRM3LynchburgMilby ParkTexas CityMustangDanciger
Aug. 25 – Aug. 31, 2006ChannelviewWallisvilleCesar Chavez
MethodologySimulated time period: August 25 – September 30, 2006
Simulation: CMAQv4.6 with an extended SAPRC99 mechanism 1,3-butadiene explicitly represented
Emission Inventory:Texas Point Source Inventory 2006 (TPSI2006)TCEQ’s area, mobile, and biogenic emissionsNational Emission Inventory 2002 (NEI 2002)

Click to edit Master title style
Click to edit Master subtitle style
5
SundaySaturday
SundaySaturday
National Level (EPA, 1996):National Level (EPA, 1996):Incomplete combustion of gasoline and diesel fuels:Incomplete combustion of gasoline and diesel fuels: ~ 82% ~ 82% Residential wood combustion, agricultural burning, forest fires, biomass burning: Residential wood combustion, agricultural burning, forest fires, biomass burning: ~ ~ 16%16%Petroleum refining and manufacturing facilities (production of plastic goods): Petroleum refining and manufacturing facilities (production of plastic goods): ~ 2% ~ 2%
Emissions of 1,3-Butadiene

Click to edit Master title style
Click to edit Master subtitle style
6
SundaySaturday
SundaySaturday
SundaySaturday
National Level (EPA, 1996):National Level (EPA, 1996):Incomplete combustion of gasoline and diesel fuels:Incomplete combustion of gasoline and diesel fuels: ~ 82% ~ 82% Residential wood combustion, agricultural burning, forest fires, biomass burning: Residential wood combustion, agricultural burning, forest fires, biomass burning: ~ ~ 16%16%Petroleum refining and manufacturing facilities (production of plastic goods): Petroleum refining and manufacturing facilities (production of plastic goods): ~ 2% ~ 2%
Emissions of 1,3-Butadiene

Click to edit Master title style
Click to edit Master subtitle style
7
SundaySaturday
SundaySaturday
Average daily profile of 1,3- butadiene emissions in HGB counties
8/25/2006 - 9/30/2006
0
0.5
1
1.5
2
2.5
3
0 1 2 3 4 5 6 7 8 9 10 11 12 13 14 15 16 17 18 19 20 21 22 23
CST
kg
/hr
National Level (EPA, 1996):National Level (EPA, 1996):Incomplete combustion of gasoline and diesel fuels:Incomplete combustion of gasoline and diesel fuels: ~ 82% ~ 82% Residential wood combustion, agricultural burning, forest fires, biomass burning: Residential wood combustion, agricultural burning, forest fires, biomass burning: ~ ~ 16%16%Petroleum refining and manufacturing facilities (production of plastic goods): Petroleum refining and manufacturing facilities (production of plastic goods): ~ 2% ~ 2%
Emissions of 1,3-Butadiene
Click to edit Master title style
Click to edit Master subtitle style
8
9 monitors in the Houston - Galveston area08/25 - 09/30/2006
0
0.04
0.08
0.12
0.16
0.2
0 1 2 3 4 5 6 7 8 9 10 11 12 13 14 15 16 17 18 19 20 21 22 23
CST
pp
bv
median observed
median modeled
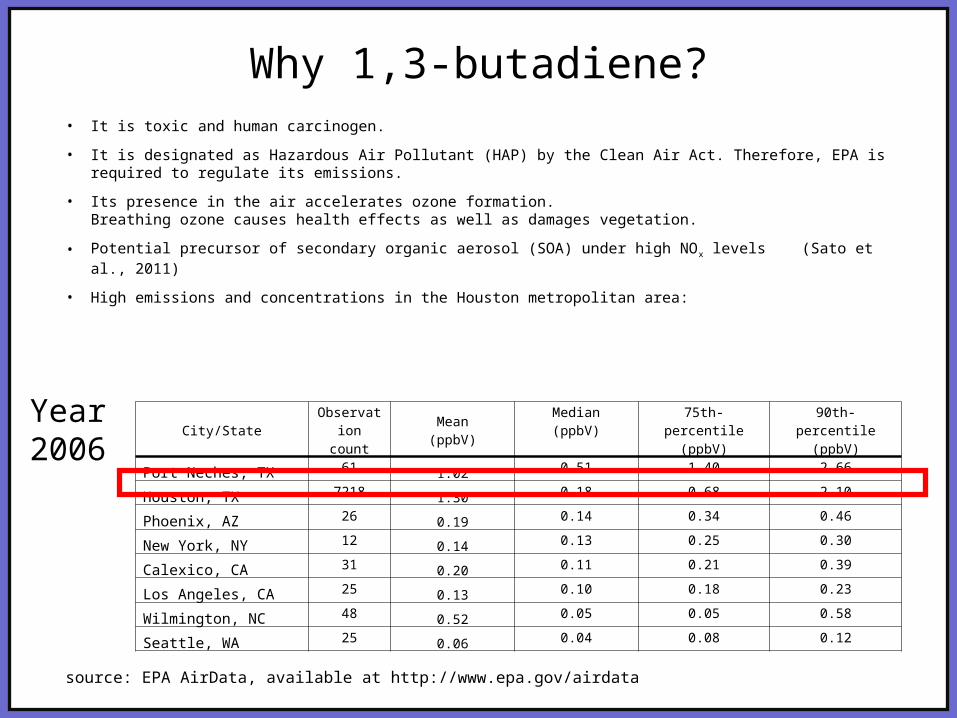
nitrate radical (NOnitrate radical (NO33))
ozone (Oozone (O33))
the average summertime the average summertime lifetime is ~ 4 h lifetime is ~ 4 h during photochemical episodes ~ 25 min during photochemical episodes ~ 25 min (Dollard et al. 2001).(Dollard et al. 2001).
1,3-butadiene + hydroxyl radical (OH) 1,3-butadiene + hydroxyl radical (OH) → → ozone (O3) ozone (O3)
→ → carbonyl compoundscarbonyl compounds1,3-butadiene + 1,3-butadiene + lifetime is ~11h (Olifetime is ~11h (O33))
lifetime is ~ 2.4 days (NOlifetime is ~ 2.4 days (NO33) )
(Dollard et al. 2001)(Dollard et al. 2001)
Removal of 1,3-butadiene
Dry and wet deposition of 1,3-butadiene is not a significant removal process.Dry and wet deposition of 1,3-butadiene is not a significant removal process.
1,3-Butadiene Mixing Ratios

Click to edit Master title style
Click to edit Master subtitle style
9
1,3-Butadiene Mixing Ratios
midnight
Nighttime mixing ratios are low, morning mixing ratios high due to mobile emissions
In the urban area
morning rush hours

Click to edit Master title style
Click to edit Master subtitle style
10
midnight
Nighttime mixing ratios are low, morning mixing ratios high due to mobile emissions
In the urban area
morning rush hours
In industrial areas Mixing ratios are higher in the industrial areas than in the urban area Mixing ratios high during night and morning hours
1,3-Butadiene Mixing Ratios
Click to edit Master title style
Click to edit Master subtitle style
11
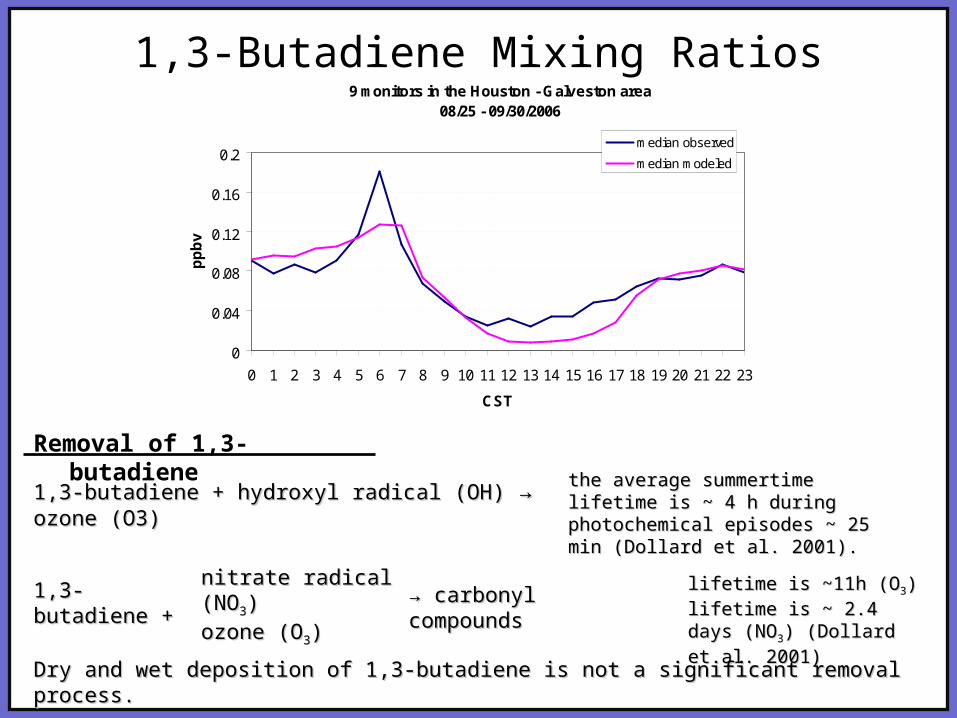
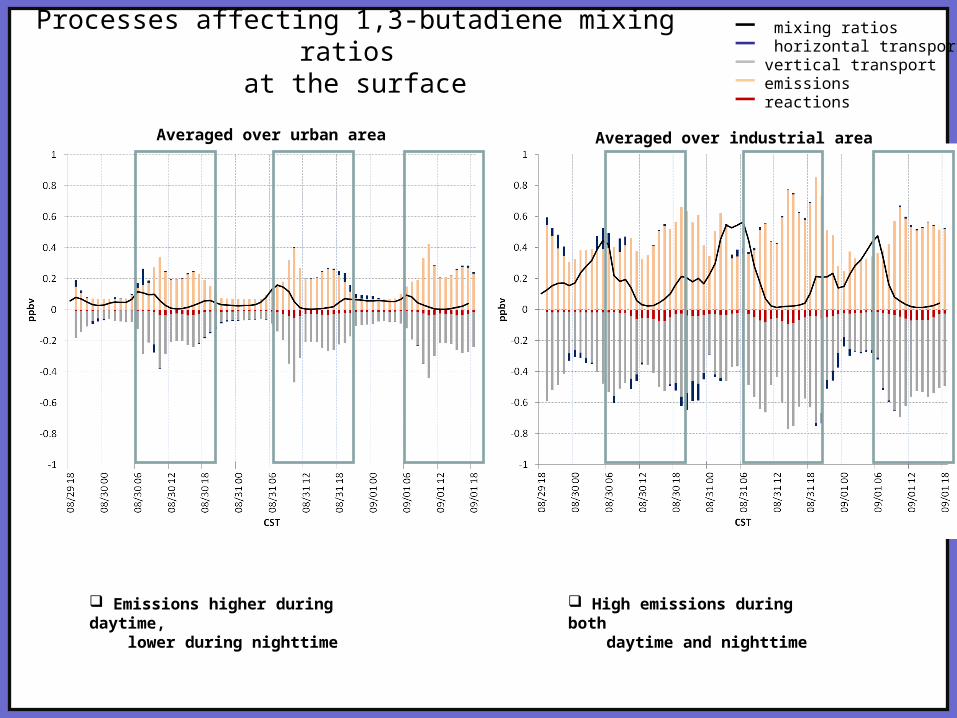
Processes affecting 1,3-butadiene mixing ratios at the surface
Averaged over urban area Averaged over industrial area
Emissions higher during daytime, lower during nighttime
High emissions during both daytime and nighttime
— mixing ratios— horizontal transport— vertical transport— emissions— reactions

Click to edit Master title style
Click to edit Master subtitle style
12
Averaged over urban area Averaged over industrial area
Processes affecting 1,3-butadiene mixing ratios at the surface
— mixing ratios— horizontal transport— vertical transport— emissions— reactions
Emissions are much higher in the industrial area; therefore, mixing ratios also higher in the industrial area 1,3-butadiene removed from the surface mainly by the vertical transport (~90%) Removal by chemical reactions (~10%). Contribution likely be higher when whole mixing layer is considered.

Click to edit Master title style
Click to edit Master subtitle style
13
Loss of 1,3-butadiene by means of chemical reactions
Averaged over urban area Averaged over industrial area
Daytime: ~90% of 1,3-butadiene reacts with the OH radical, both in urban and industrial environment
— O(3P)— NO3— O3— OH

Click to edit Master title style
Click to edit Master subtitle style
14
Loss of 1,3-butadiene by means of chemical reactions
Averaged over urban area Averaged over industrial area
~56% of 1,3-butadiene reacts with the NO3 radical in the urban area where high NOx emissions occur ~ 13 % contribution from reaction with ozone
reaction with OH significant, even at night (~57%); ~33% contribution from reaction with NO3
~10% contribution from reaction with ozone
— O(3P)— NO3— O3— OH
Nighttime, urban area: Nighttime, industrial area:

Click to edit Master title style
Click to edit Master subtitle style
15
TCEQ special point source inventory TCEQ base case inventory
Locations of auto-GC CAMS sites and point sources for 1,3-butadiene in the Houston area

Click to edit Master title style
Click to edit Master subtitle style
16
0.0
0.1
0.2
N
NNE
NE
ENE
E
ESE
SE
SSES
SSW
SW
WSW
W
WNW
NW
NNW
observed v > 0.2 m/s
simulated v> 0.2 m/s
HRM-309/16/06 - 09/30/06[ppbv]
1,3-Butadiene
0.0
0.1
0.2
N
NNE
NE
ENE
E
ESE
SE
SSES
SSW
SW
WSW
W
WNW
NW
NNW
observed v > 0.2 m/s
simulated v> 0.2 m/s
HRM-308/25/06 - 09/15/06[ppbv]
1,3-Butadiene

Click to edit Master title style
Click to edit Master subtitle style
17
Reported emission event:9/14/06 4 pm – 9/15/06 6:30 am in Houstonestimated 375.5 lbs. of 1,3-butadiene released (Source: http://www11.tceq.state.tx.us/oce/eer/index.cfm)
Peak ambient 1,3-butadiene reached 1.6 ppm !!!
SE
0.00.20.40.60.81.0
N
NNE
NE
ENE
E
ESE
SE
SSES
SSW
SW
WSW
W
WNW
NW
NNW
observed v > 0.2 m/s
simulated v> 0.2 m/s
Milby Park08/25/06 - 09/30/06[ppbv]
1,3-Butadiene
Change in scale!

Click to edit Master title style
Click to edit Master subtitle style
18
ESE
E SE
SE
0.00.20.40.60.81.0
N
NNE
NE
ENE
E
ESE
SE
SSES
SSW
SW
WSW
W
WNW
NW
NNW
observed v > 0.2 m/s
simulated v> 0.2 m/s
Milby Park08/25/06 - 09/30/06[ppbv]
1,3-Butadiene
0.00.20.40.60.81.0
N
NNE
NE
ENE
E
ESE
SE
SSES
SSW
SW
WSW
W
WNW
NW
NNW
observed v > 0.2 m/s
simulated v> 0.2 m/s
Milby Park08/25/06 - 09/30/06[ppbv]
1,3-Butadiene
Sep 14-15 data excluded
Change in scale!

Click to edit Master title style
Click to edit Master subtitle style
19
0.00
0.10
0.20
0.30
0.40
0.50
0.60
0.70
0.80
0.90
1.00
0 1 2 3 4 5 6 7 8 9 10 11 12 13 14 15 16 17 18 19 20 21 22 23
pp
bv
CST
HRM-308/25 - 09/30/2006 weekdays
observed mean
simulated mean
0.00
0.10
0.20
0.30
0.40
0.50
0.60
0.70
0.80
0.90
1.00
0 1 2 3 4 5 6 7 8 9 10 11 12 13 14 15 16 17 18 19 20 21 22 23
pp
bv
CST
Lynchburg Ferry08/25 - 09/30/2006
observed mean
simulated mean
0.00
0.10
0.20
0.30
0.40
0.50
0.60
0.70
0.80
0.90
1.00
0 1 2 3 4 5 6 7 8 9 10 11 12 13 14 15 16 17 18 19 20 21 22 23
pp
bv
CST
Milby Park08/25 - 09/30/2006 (09/15-15 excluded)
observed mean
simulated mean
High variability of measured mixing ratios.+ Variability caused by variable emissions from point sources that do not have specific daily or hourly patterns.
The model does not reflect high variability.+ Emission inventory does not reflect highly variable hourly emissions values.
Particular case: Milby Park siteHigh mixing ratios, both night and day!+ site very close to emission source+ fugitive emissions .
Highly polluted sites[daily mean 1,3-butadiene mixing ratio > 0.1 ppbv]

Click to edit Master title style
Click to edit Master subtitle style
20
0.00
0.05
0.10
0.15
0.20
0.25
0.30
0.35
0.40
0.45
0.50
0 1 2 3 4 5 6 7 8 9 10 11 12 13 14 15 16 17 18 19 20 21 22 23
pp
bv
CST
Texas City08/25 - 09/30/2006
observed mean
simulated mean
0.00
0.05
0.10
0.15
0.20
0.25
0.30
0.35
0.40
0.45
0.50
0 1 2 3 4 5 6 7 8 9 10 11 12 13 14 15 16 17 18 19 20 21 22 23
pp
bv
CST
Mustang08/25 - 09/30/2006
observed mean
simulated mean
0.00
0.05
0.10
0.15
0.20
0.25
0.30
0.35
0.40
0.45
0.50
0 1 2 3 4 5 6 7 8 9 10 11 12 13 14 15 16 17 18 19 20 21 22 23
pp
bv
CST
Danciger08/25 - 09/30/2006
observed mean
simulated mean
Moderately polluted sites[daily mean 1,3 butadiene mixing ratio > 0.1 ppbv]
Low mixing ratios. Less variability in both, measured and modeled values.
Click to edit Master title style
Click to edit Master subtitle style
21
Conclusions
Point source emissions of 1,3-butadiene are much higher than mobile and area emissions in the HGB area;
Emissions of 1,3 – butadiene are higher during daytimes, but its concentrations are higher during the nighttime and early mornings.
Mixing ratios are highly variable due to the impact of variable emissions
CMAQ captures background concentrations of 1,3-butadiene well,but is not able to capture irregular emission events.
1,3-butadiene is removed from the surface through vertical transport (~90%) and reactions (~10%). The contribution likely higher when whole mixing layer considered.
During daytime reaction with OH radical is the most significant removal reaction
During nighttimes reactions with O3 and NO3 are significant, contributing to a new radical formation without consuming a radical.
Under-prediction of 1,3-butadiene may lead not only to ozone (and potentially SOA) under-prediction but also under-prediction of nighttime radicals.