Embed Size (px)
Citation preview
Click to edit Master title style
Click to edit Master subtitle style© OGA 2018This presentation is for illustrative purposes only. The OGA makes no representations or warranties, express or implied, regarding the quality, completeness or accuracy of the information contained herein. All and any such
responsibility and liability is expressly disclaimed. The OGA does not provide endorsements or investment recommendations. Oil and Gas Authority is a limited company registered in England and Wales with registered number
09666504 and VAT registered number 249433979. Our registered office is at 21 Bloomsbury Street, London, United Kingdom, WC1B 3HF
Has the UK E&P Sector turned a Corner?
Gunther Newcombe
Operations Director
November 2018
1
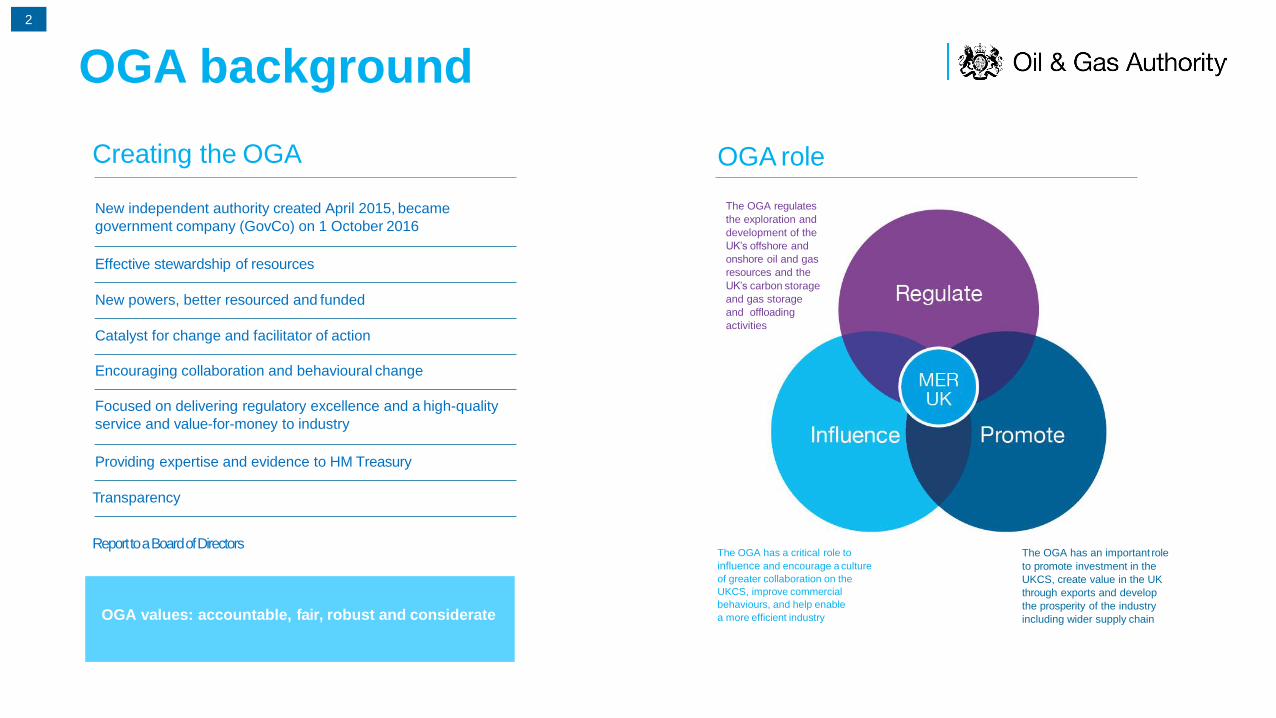
OGA background
Creating the OGA
New independent authority created April 2015, became
government company (GovCo) on 1 October 2016
Effective stewardship of resources
New powers, better resourced and funded
Catalyst for change and facilitator of action
Encouraging collaboration and behavioural change
Focused on delivering regulatory excellence and a high-quality
service and value-for-money to industry
Providing expertise and evidence to HM Treasury
Transparency
OGA role
OGA values: accountable, fair, robust and considerate
The OGA regulates
the exploration and
development of the
UK’s offshore and
onshore oil and gas
resources and the
UK’s carbon storage
and gas storage
and offloading
activities
The OGA has an important role
to promote investment in the
UKCS, create value in the UK
through exports and develop
the prosperity of the industry
including wider supply chain
The OGA has a critical role to
influence and encourage a culture
of greater collaboration on the
UKCS, improve commercial
behaviours, and help enable
a more efficient industry
Report to a Board of Directors
2

Today’s agenda
Reflection
Positive Indicators Graphic3
Issues facing UKCS
Key Messages
OGA Approach Graphic3
3
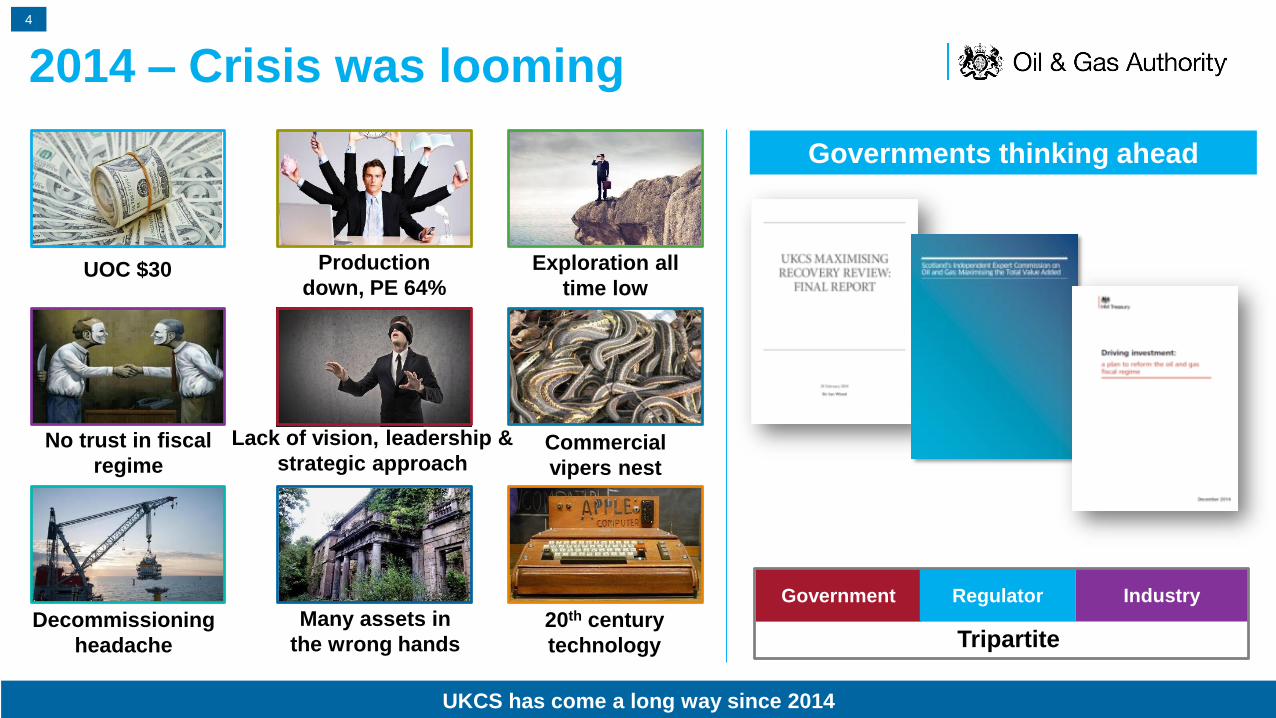
2014 – Crisis was looming
UKCS has come a long way since 2014
Governments thinking ahead
UOC $30 Production
down, PE 64%
Exploration all
time low
Commercial
vipers nest
20th century
technology
Decommissioning
headache
Many assets in
the wrong hands
No trust in fiscal
regime
Lack of vision, leadership &
strategic approach
Government Regulator Industry
Tripartite
4
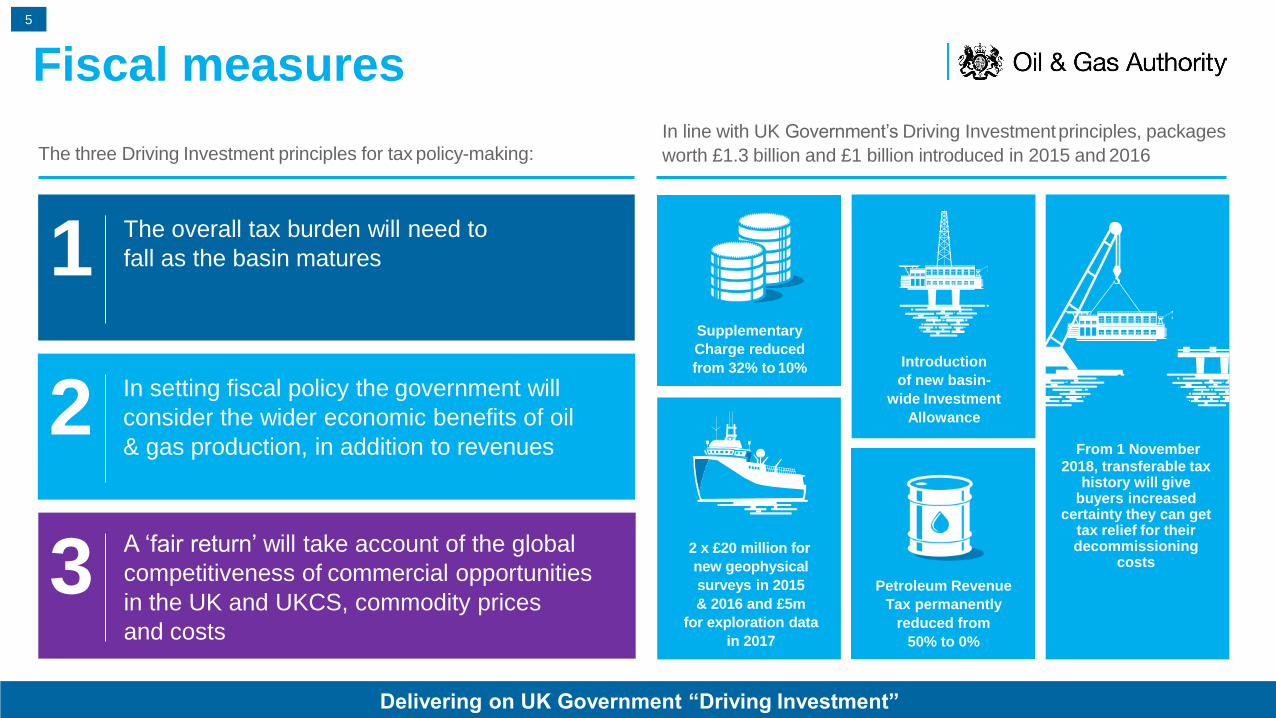
Fiscal measures
Delivering on UK Government “Driving Investment”
Supplementary
Charge reduced
from 32% to 10%
Petroleum Revenue
Tax permanently
reduced from
50% to 0%
Introduction
of new basin-
wide Investment
Allowance
2 x £20 million for
new geophysical
surveys in 2015
& 2016 and £5m
for exploration data
in 2017
From 1 November
2018, transferable taxhistory will give
buyers increased certainty they can get
tax relief for theirdecommissioning
costs
In line with UK Government’s Driving Investmentprinciples, packages
worth £1.3 billion and £1 billion introduced in 2015 and 2016The three Driving Investment principles for tax policy-making:
1The overall tax burden will need to
fall as the basin matures
In setting fiscal policy the government will
consider the wider economic benefits of oil
& gas production, in addition to revenues2
A ‘fair return’ will take account of the global
competitiveness of commercial opportunities
in the UK and UKCS, commodity prices
and costs
3
5
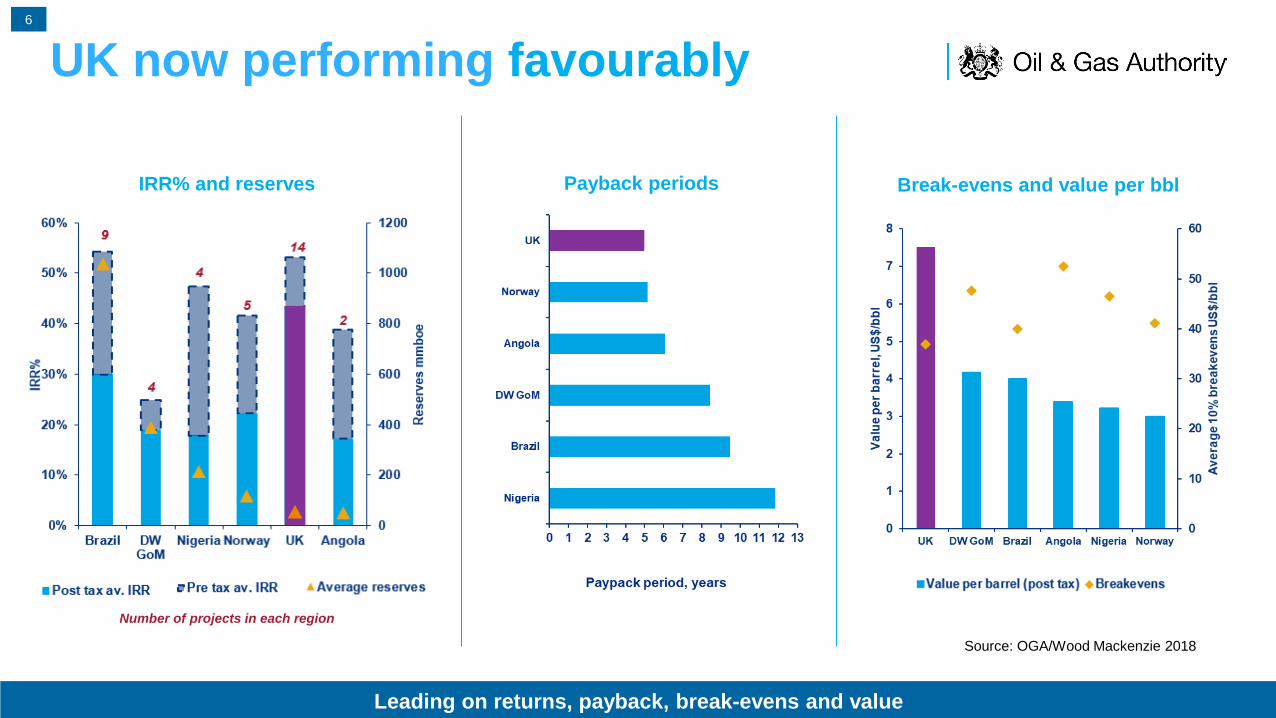
Leading on returns, payback, break-evens and value
Payback periods Break-evens and value per bbl
UK now performing favourably
Source: OGA/Wood Mackenzie 2018
Number of projects in each region
IRR% and reserves
6
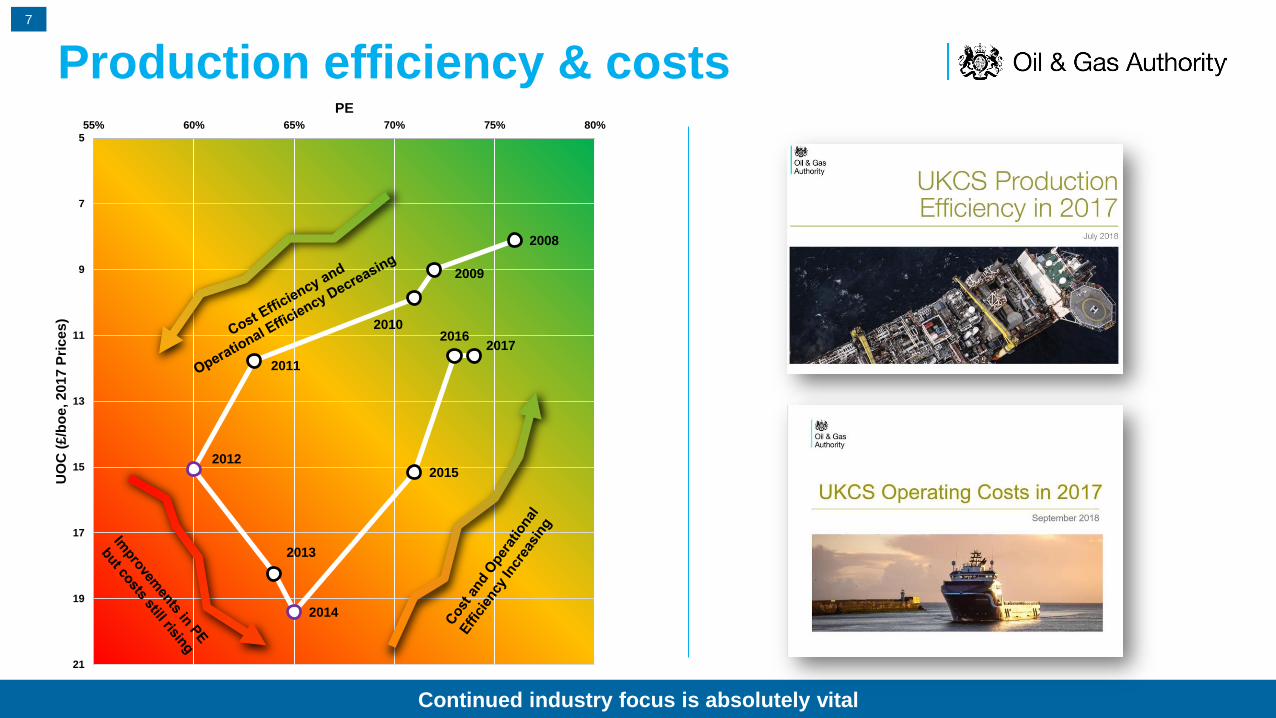
Production efficiency & costs
Continued industry focus is absolutely vital
2008
2009
2010
2011
2012
2013
2014
2015
20162017
5
7
9
11
13
15
17
19
21
55% 60% 65% 70% 75% 80%
UO
C (
£/b
oe
, 2
01
7 P
ric
es
)
PE
7
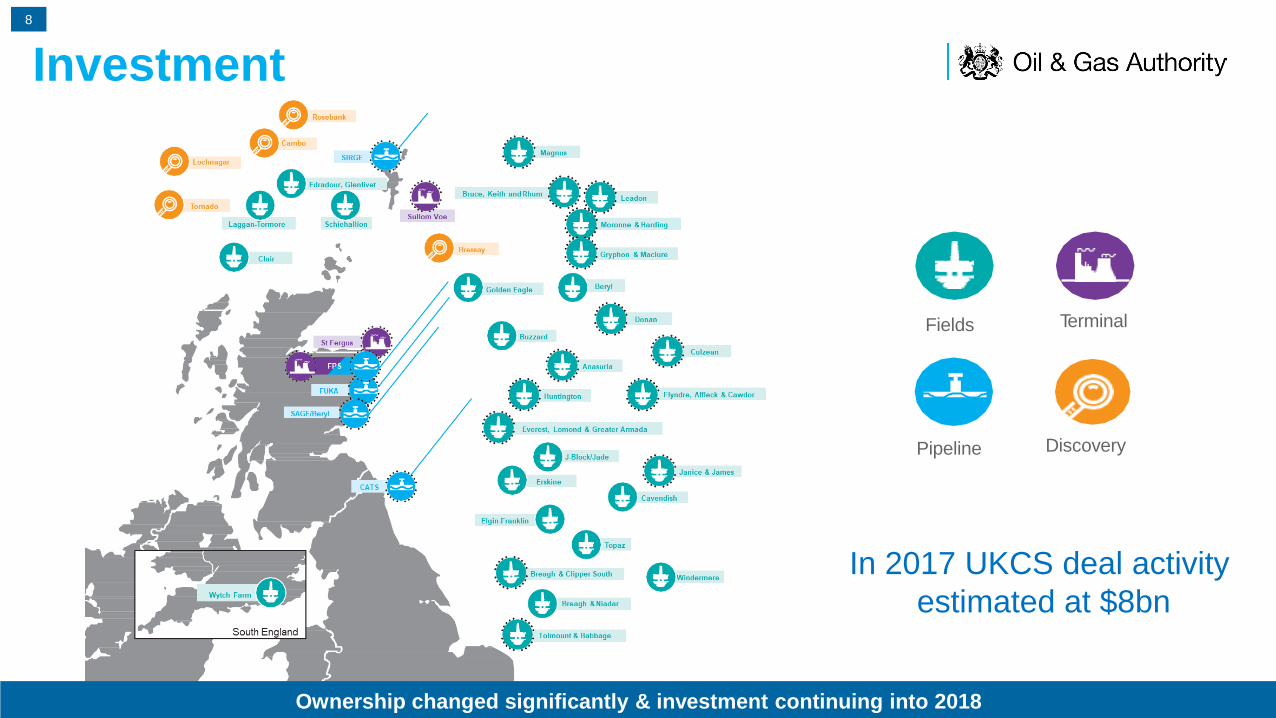
Investment
Fields
Pipeline
Terminal
Discovery
In 2017 UKCS deal activity
estimated at $8bn
Ownership changed significantly & investment continuing into 2018
8
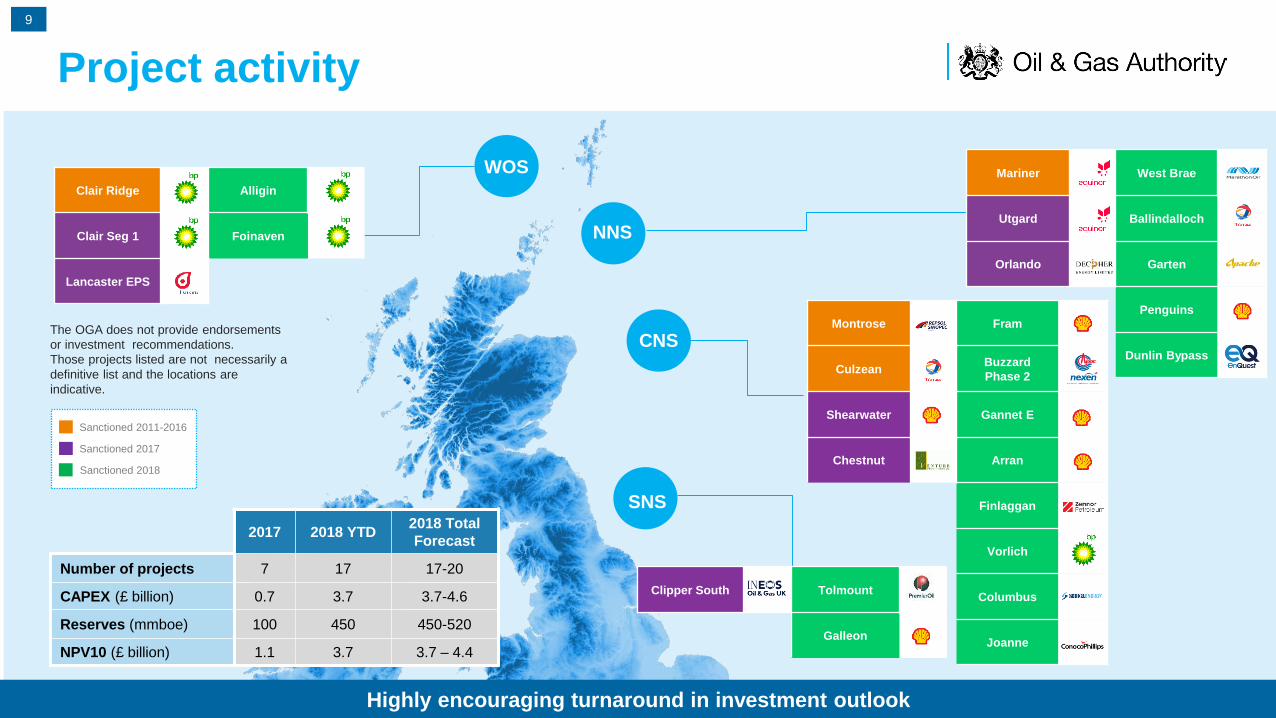
Highly encouraging turnaround in investment outlook
Project activity
The OGA does not provide endorsements
or investment recommendations.
Those projects listed are not necessarily a
definitive list and the locations are
indicative.
2017 2018 YTD2018 Total
Forecast
Number of projects 7 17 17-20
CAPEX (£ billion) 0.7 3.7 3.7-4.6
Reserves (mmboe) 100 450 450-520
NPV10 (£ billion) 1.1 3.7 3.7 – 4.4
WOS
Sanctioned 2017
Sanctioned 2018
Sanctioned 2011-2016
Clair Ridge Alligin
Clair Seg 1 Foinaven
Lancaster EPS
SNS
Mariner West Brae
Utgard Ballindalloch
Orlando Garten
Penguins
Dunlin Bypass
Clipper South Tolmount
Galleon
NNS
Montrose Fram
CulzeanBuzzard
Phase 2
Shearwater Gannet E
Chestnut Arran
Finlaggan
Vorlich
Columbus
Joanne
CNS
9
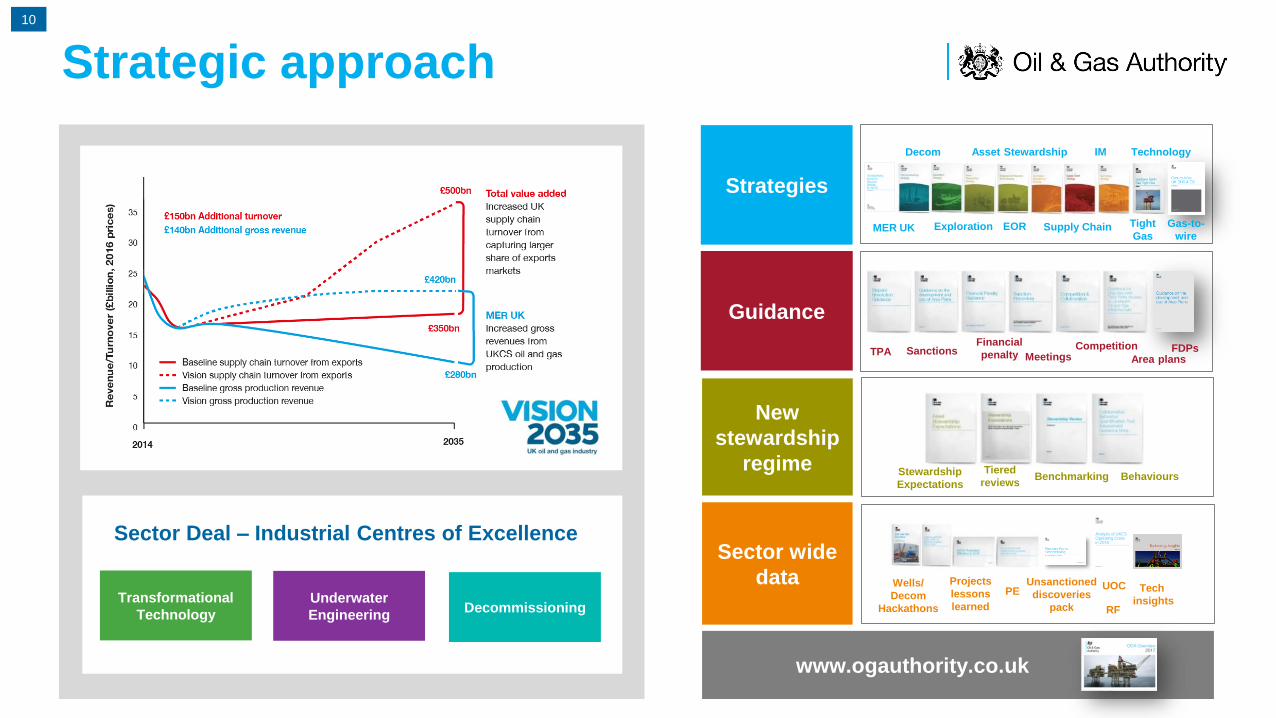
Strategic approach
New
stewardship
regime
Sector wide
data
Guidance
Strategies
Exploration
Decom
EOR
IM Technology
Tight
Gas
CompetitionMeetings
Financial
penaltySanctionsTPA
Stewardship
Expectations
Tiered
reviewsBenchmarking Behaviours
Projects
lessons
learned
Wells/
Decom
Hackathons
PE Unsanctioned
discoveries
pack
Asset Stewardship
Supply ChainMER UK
RF
UOC
www.ogauthority.co.uk
Government
Sector Deal – Industrial Centres of Excellence
Transformational
Technology
Underwater
EngineeringDecommissioning
Area plans
Tech
insights
FDPs
Gas-to-
wire
10

UKCS
operating
environment
Asset stewardship
driving cost
reduction and
efficiency increase
Access
to capital
Working with
investment
community to
promote
opportunities and
new commercial
models
Basin
maturity
Significant
undeveloped
discovered
Resource and
Exploration
potential
OGA has well
established powers
to facilitate tie back
developments and
help resolve tariff
issues
Access to
infrastructure
UKCS
exploration
OGA providing
flexible licensing
and high quality
open data
Competing
with
renewables
for capital
OGAconsidering
the opportunities
that the energy
transition will
present for UKCS
Fiscal
regime
Stable fiscal regime
and introduction of
transferable tax
history
Mitigating barriers to investment
Decom
Working with
industry to
develop strategic
decommissioning
plans to reduce
cost
Systematically removing barriers to deliver value for investors
11
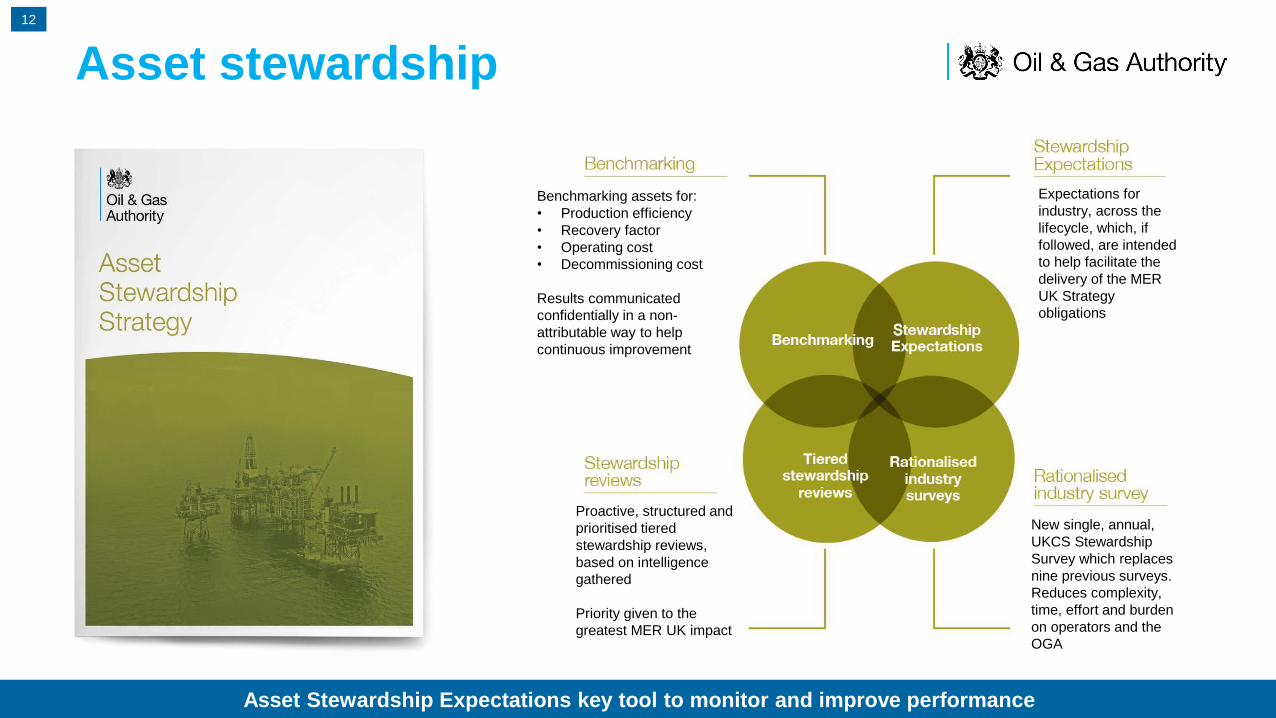
Asset stewardship
Asset Stewardship Expectations key tool to monitor and improve performance
Expectations for
industry, across the
lifecycle, which, if
followed, are intended
to help facilitate the
delivery of the MER
UK Strategy
obligations
Benchmarking assets for:
• Production efficiency
• Recovery factor
• Operating cost
• Decommissioning cost
Results communicated
confidentially in a non-
attributable way to help
continuous improvement
Proactive, structured and
prioritised tiered
stewardship reviews,
based on intelligence
gathered
Priority given to the
greatest MER UK impact
New single, annual,
UKCS Stewardship
Survey which replaces
nine previous surveys.
Reduces complexity,
time, effort and burden
on operators and the
OGA
12
0%
10%
20%
30%
40%
50%
60%
70%
80%
90%
100%
Processing (All Licences)
2012-2017 2006-2011 2001-2005 Before 2000 No Survey Return
0%
10%
20%
30%
40%
50%
60%
70%
80%
90%
100%
Acquisition (All Licences)
90%
100%
Operator A
2017 R
eserv
es R
epla
cem
ent
£/boe
Operator A
0 5 10 15 20 25 30
Pro
duction E
ffic
iency
(Econom
ic)
Operator A
0%
10%
20%
30%
40%
50%
60%
70%
80%
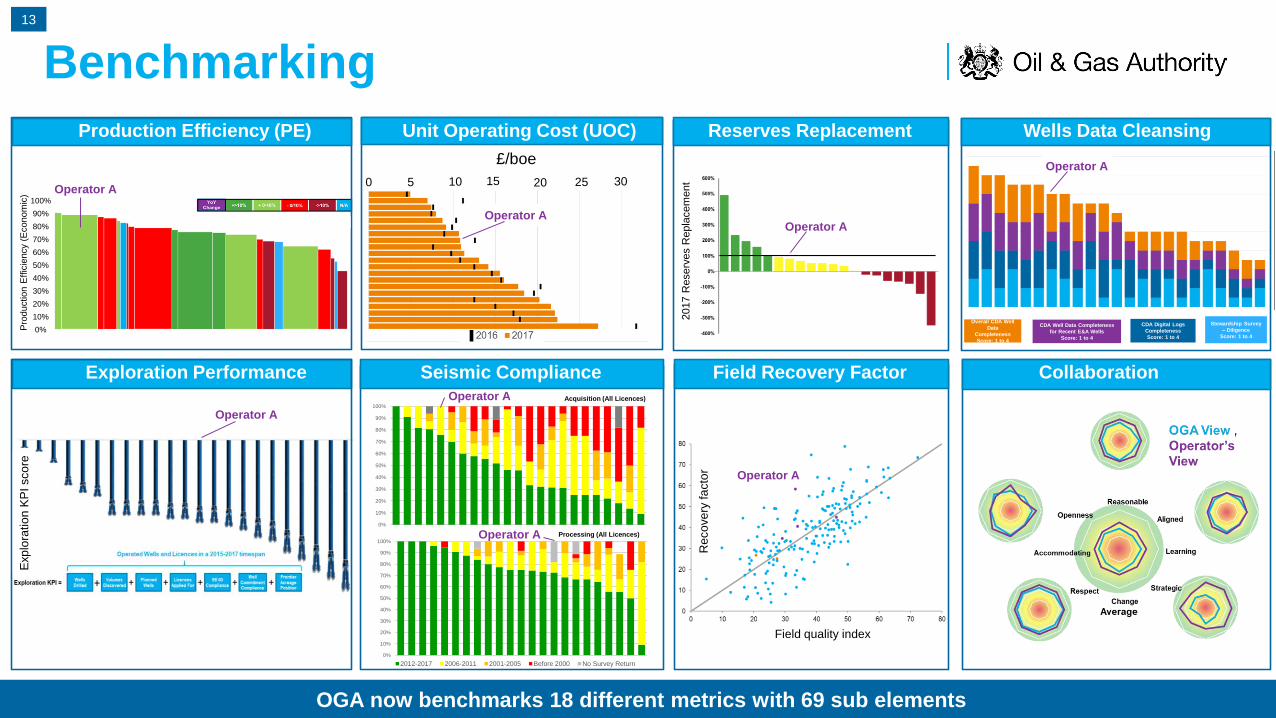
Unit Operating Cost (UOC) Reserves Replacement
Seismic Compliance
Production Efficiency (PE)
Field Recovery FactorExploration Performance
Benchmarking
OGA now benchmarks 18 different metrics with 69 sub elements
Wells Data Cleansing
Collaboration
Overall CDA Well
Data
Completeness
Score: 1 to 4
CDA Well Data Completeness
for Recent E&A Wells
Score: 1 to 4
CDA Digital Logs
Completeness
Score: 1 to 4
Stewardship Survey
– Diligence
Score: 1 to 4
Operator A
Operator A
Operator A
Operator A
Field quality index
Reco
ve
ry fa
cto
r
Exp
lora
tio
n K
PI sco
re
Operator A
13
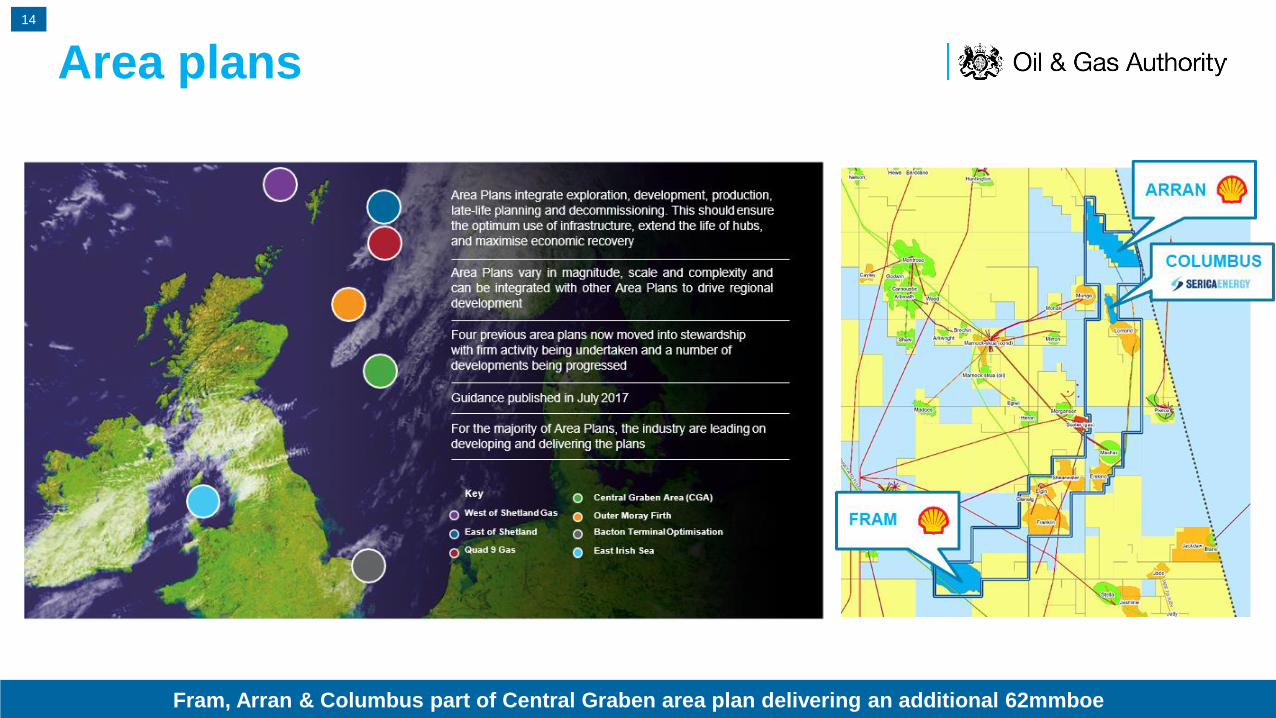
Area plans
Fram, Arran & Columbus part of Central Graben area plan delivering an additional 62mmboe
14
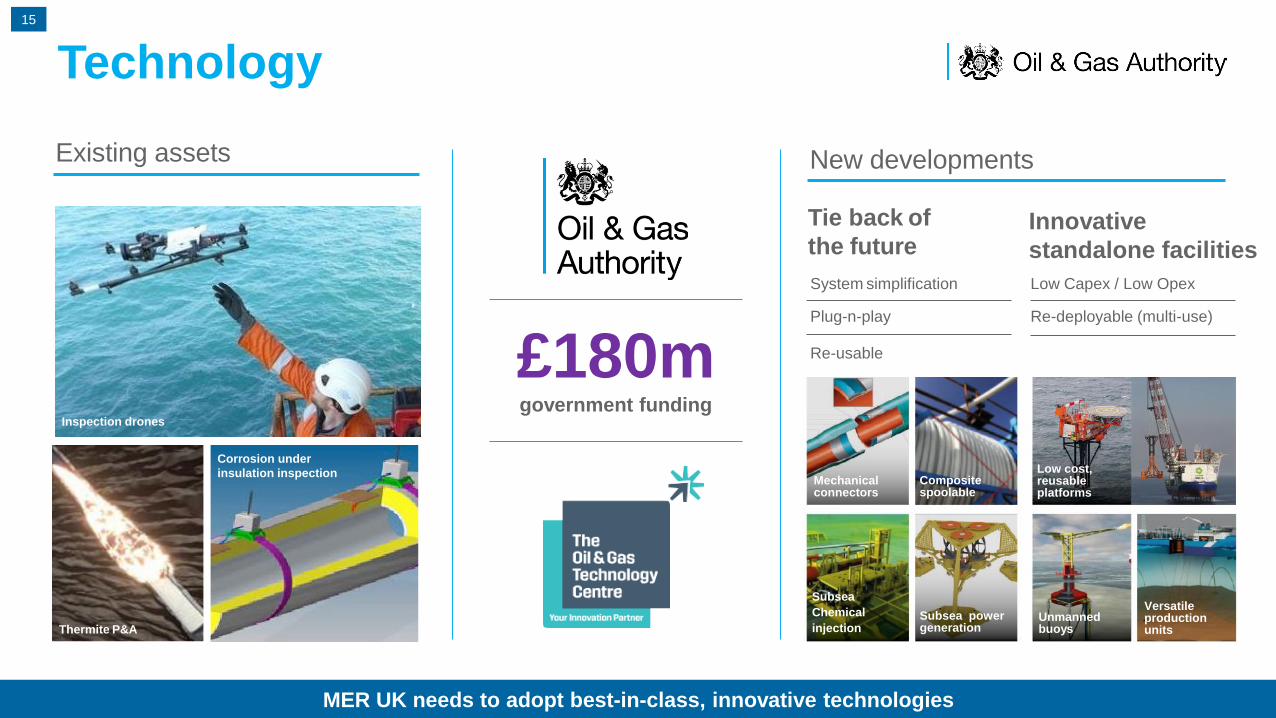
Corrosion under
insulation inspection
Inspection drones
Thermite P&A
MER UK needs to adopt best-in-class, innovative technologies
Technology
Existing assets New developments
Versatile production units
Unmanned buoys
Low cost, reusable platforms
Composite spoolable
Subsea
Chemical
injectionSubsea power generation
Mechanical connectors
£180mgovernment funding
Tie back of
the futureInnovative
standalone facilities
System simplification
Plug-n-play
Re-usable
Low Capex / Low Opex
Re-deployable (multi-use)
15
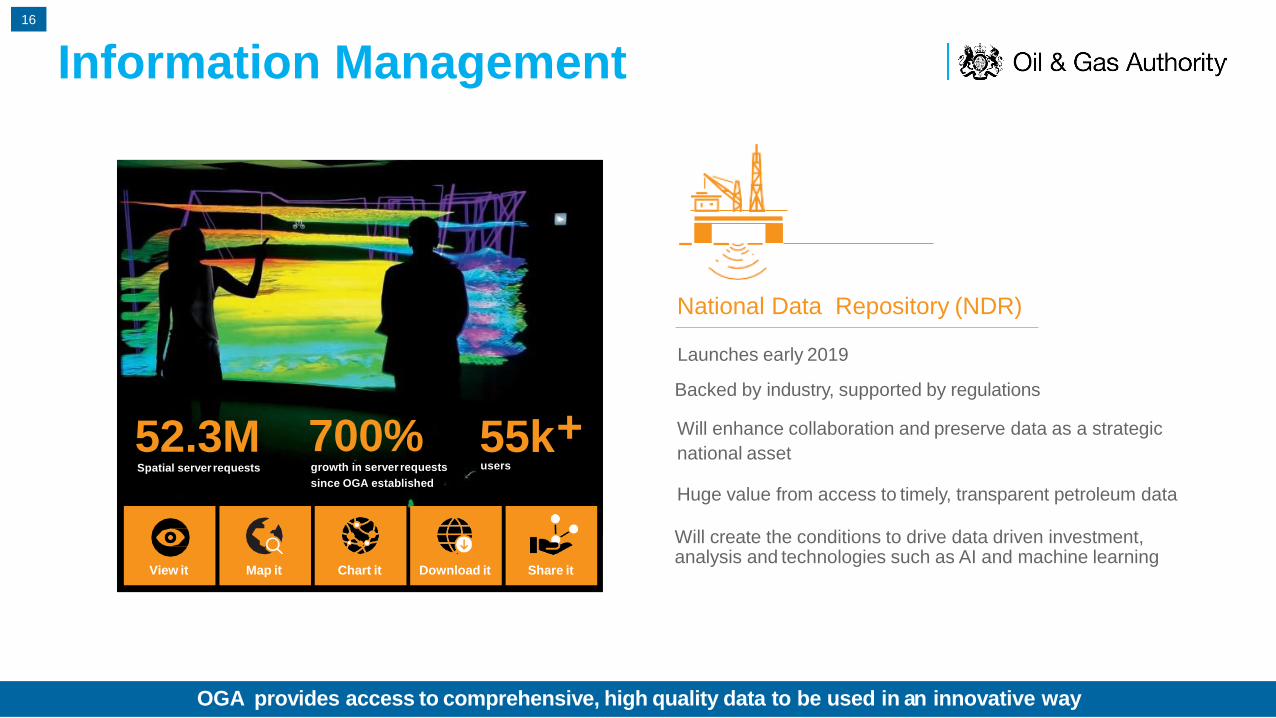
OGA provides access to comprehensive, high quality data to be used in an innovative way
Information Management16
52.3MSpatial server requests
700%growth in server requests
since OGA established
55k+users
Map it Download itView it Share itChart it
Launches early 2019
Backed by industry, supported by regulations
Will enhance collaboration and preserve data as a strategic
national asset
Huge value from access to timely, transparent petroleum data
Will create the conditions to drive data driven investment,analysis and technologies such as AI and machine learning
National Data Repository (NDR)
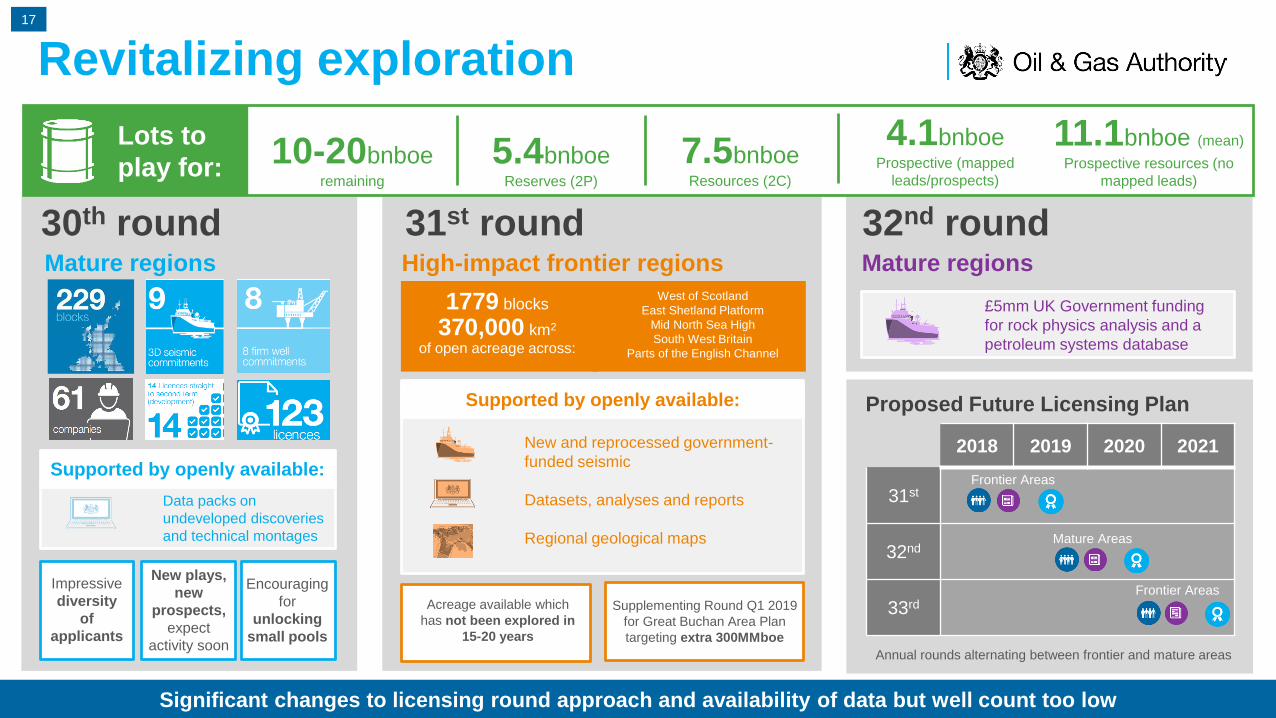
Revitalizing exploration
Impressive
diversity
of
applicants
30th round 31st round
New and reprocessed government-
funded seismic
Datasets, analyses and reports
Regional geological maps
High-impact frontier regions
1779 blocks
Supplementing Round Q1 2019
for Great Buchan Area Plan
targeting extra 300MMboe
Acreage available which
has not been explored in
15-20 years
West of Scotland
East Shetland Platform
Mid North Sea High
South West Britain
Parts of the English Channel
1779 blocks
370,000 km2
of open acreage across:
New plays,
new
prospects,
expect
activity soon
Encouraging
for
unlocking
small pools
Supported by openly available:
Data packs on
undeveloped discoveries
and technical montages
Mature regions
32nd roundMature regions
Proposed Future Licensing Plan
£5mm UK Government funding
for rock physics analysis and a
petroleum systems database
2018 2019 2020 2021
31st
32nd
33rd
Annual rounds alternating between frontier and mature areas
Frontier Areas
Mature Areas
Frontier Areas
Supported by openly available:
Lots to
play for:5.4bnboe
Reserves (2P)
7.5bnboeResources (2C)
4.1bnboe Prospective (mapped
leads/prospects)
11.1bnboe (mean)
Prospective resources (no
mapped leads)
10-20bnboeremaining
Significant changes to licensing round approach and availability of data but well count too low
17

Improving outlook but vital activity approved next 3 years
4 of the top 23 operators no development drilling plans for next 3 years
Use it or lose it
Well activity
Need for additional cost effective new wells, improved base management & P&A planning
Development well outlook Efficiency improvements required
Cost drivers (Platform wells)
Intervention rate
Operator
Nu
mb
er
of
we
lls
NPT
Yet to be
approved
Annual well abandonment
14%
140 wells
18
Industry needs to invest in more
drilling and well management
Conclusions
Collaborative and focussed leadership is vital for success
Significant improvement in
industry performance
Huge value added
through tripartite
approach
Investor confidence in UKCS as
a sector which generates value
19