Embed Size (px)
Citation preview

Click to edit Master title style
Presented by
Oscar N. Onyema, OON
CEO
2nd Capital Markets Committee Meeting
August 9th, 2016
CAPITAL MARKET UPDATE
of the Nigerian Stock Exchange

Click to edit Master title style|
The Nigerian Stock Exchange 2
Outline
1• Q2’16 Briefing – Overview of Operating Environment
2• NSE Market Statistics
3• Global Competitive Report
August 2016

Click to edit Master title style
Q2’16 Briefing – Overview of Operating Environment

Click to edit Master title style|
The Nigerian Stock Exchange
The World at a Glance
4August 2016
LATIN AMERICA & THE CARIBBEAN: -0.4%Economic contraction due topolitical uncertainty, policy stanceand climate–related factors e.g. Zikavirus.
US: 2.2%Moderate growth supported by a strongUSD and gradual monetary policynormalization.
THE MIDDLE EAST & NORTH AFRICA*: 3.4%Recent recovery in oil prices and continuing fiscalconsolidation increase regional growth prospects,despite economic effects of regional conflicts.
EUR0 AREA: 1.6%Growth driven by strong domestic demand and investmentrebound; with significant downside risks posed by uncertaintiesover the UK referendum and legacy issues in the banking sector.
SUB-SAHARAN AFRICA: 1.6%Challenging macroeconomic conditionsin leading economies drag on regionalgrowth as commodity prices remaindepressed.
ASIA & THE PACIFIC: 6.4%Growth driven by policy stimulus,increased infrastructure spending,credit growth and buoyant activity inleading regional economies.
• Despite modest recovery in financial and oil markets, global growth for 2016 was revised downward in July to 3.1%(Apr’16: 3.2%), as financial market disruptions and macroeconomic concerns over ‘Brexit’ continue to fuel uncertainty.
• Prospects for large emerging and developing economies (EMDEs) such as Brazil, China and Russia have improved in thenear term due to policy support and higher oil prices, amongst other factors.
• In Sub-Saharan Africa growth is expected to slow down to 1.6% in 2016, from 3.3% in 2015, amidst projections of acontraction of the Nigerian economy and flat growth of South Africa’s GDP.
KEY TRENDS IN THE GLOBAL ECONOMY**
*includes Afghanistan and Pakistan; **IMF World Economic Outlook, July 2016

Click to edit Master title style|
The Nigerian Stock Exchange
Nigeria’s Economic Conditions
1 2
OVER A DECADE OF STABLE GROWTH HALTED BY THE EFFECTS OF LOW GLOBAL OIL PRICES
REAL GDP GROWTH DIPS TO NEGATIVE TERRITORY
5
CONTRACTION IN NOMINAL GDP
• On the back of low oil prices, dwindling foreign exchange revenues and resulting currency volatility, fuel shortages andpolicy uncertainty, the Nigerian economy recorded its first negative growth rate since the second quarter of 2004.
• Real GDP growth contracted to -0.36% in Q1’16, declining 2.47 ppts from Q4’15 , and 4.32 ppts over Q1’15.
• In nominal terms, Q1’16 GDP (N22.26Tn) declined 14.1% over the previous quarter (Q4’15: N25.93Tn).
• Supply chain disruptions resulting from foreign exchange and fuel shortages, reflected on the performance of themanufacturing sector, which declined 6.3 ppts (YoY) from -0.7% in Q1’15 to -7.0% in Q1’16.
• At the end of June’16, the Manufacturing Purchasing Managers' Index (PMI)* had recovered by 2.0 ppts to a fractionallypositive headline of 50.2 – still significantly below the June’15 headline of 56.0.
2.35%2.84%
2.11%
-0.36%
-1%
0%
1%
2%
3%
4%
Q2'15 Q3'15 Q4'15 Q1'16
YoY
GD
P G
row
th (
%)
22.86
24.31
25.93
22.26
20
22
23
25
26
28
Q2'15 Q3'15 Q4'15 Q1'16
No
min
al G
DP
(N
‘Tn
)
*PMI= First Bank of Nigeria (FBN) Quest Purchasing Managers Index
August 2016

Click to edit Master title style|
The Nigerian Stock Exchange
Capital Market Reacts to Economic Trends
6August 2016
20,000
22,000
24,000
26,000
28,000
30,000
32,000
Jan-16 Feb-16 Mar-16 Apr-16 May-16 Jun-16
NSE
All
Shar
e In
dex
Feb’16: Saudi, Russia, Qatar & Venezuela agree to freeze production.
Jan’16: NSE ASI records 2016 low of 22,456.32 on Jan 19th, shedding 21.60%.
May’16: NSE ASI dips slightly in reaction to EFCC arrests of bank MDs.
May – Jun’16:Rally & profit taking due to new FX stance; NSE ASI trending upward
Jan’16:CBN banssale of FXto BDCs.
May’16: President Buhari signs 2016 Budget into law.
Mar – Apr’16: Weak results of some major banks and other companies reveal fall in FY’15 earnings vs. FY’14 as highlighted in profit warnings issued in Q1’16.
Jun’16: The UK votes to leave Europe & FMDQ launches FX derivative products.

Click to edit Master title style|
The Nigerian Stock Exchange
Nigerian Capital Importation Trends – CBN
7August 2016
• Total capital imported into Nigeria in Q1’16
amounted to $711Mn, the lowest quarterly
figure recorded since 2007.
• At $271Mn, Foreign Portfolio Investment (FPI)
declined by 72% from Q4’15.
• Fixed income as a component of FPI declined
sharply from 13% in 2015 to less than 1% in
Q1’16 highlighting the impact of Nigeria’s
exclusion from JP Morgan’s Gov’t bond index
in 2015.
FACTS AND FIGURES CAPITAL IMPORTATION BY TYPE – Q1’161 2
FOREIGN PORTFOLIO INVESTMENT BY TYPE 3
82% 88% 87% 77% 78% 74%
1% 4% 7% 16% 13%0.55%
17% 8% 6% 7% 10%25%
0%
50%
100%
2011 2012 2013 2014 2015 Q1'16
Equity Bonds Money Market
38%
37%
25%
Foreign PortfolioInvestment
OtherInvestment
Foreign DirectInvestment
Total value $711Mn
Source: NBS, CBN

Click to edit Master title style|
The Nigerian Stock Exchange
Impact of Capital Controls on NSE FPI Activity
8August 2016
134.14
42.46
-100
-50
0
50
100
150
Jan
-14
Feb
-14
Mar
-14
Ap
r-1
4
May
-14
Jun
-14
Jul-
14
Au
g-1
4
Sep
-14
Oct
-14
No
v-1
4
Dec
-14
Jan
-15
Feb
-15
Mar
-15
Ap
r-1
5
May
-15
Jun
-15
Jul-
15
Au
g-1
5
Sep
-15
Oct
-15
No
v-1
5
Dec
-15
Jan
-16
Feb
-16
Mar
-16
Ap
r-1
6
May
-16
Jun
-16
Total Foreign Inflow (N'Bn) Total Foreign Outflow (N'Bn) Total Net Flow (N'Bn)
• Net inflow in April’16 of N76Mn after9 consecutive months of net outflowamounting to N99Bn.
• Net inflow sustained in May’16 andJune’16 following flexible FX policy inMay’16.

Click to edit Master title style
NSE Market Statistics

Click to edit Master title style|
The Nigerian Stock Exchange
NSE Market Snapshot
10August 2016
67% 61% 51% 58% 54%43%
33% 39% 49% 42% 46%57%
0%
25%
50%
75%
100%
2011 2012 2013 2014 2015 H1'16
Mar
ket
par
tici
pat
ion
(%
)
Foreign Domestic
DOMESTIC VS. FOREIGN (EQUITY)NSE TOTAL MARKET CAPITALIZATION1 2
DOMESTIC INVESTOR BASE: H1’16 TOTAL FOREIGN PORTFOLIO FLOW (EQUITY)3 4
N1.04Tn N1.53Tn N1.02Tn N269.22Bn
11.21
15.92
19.08 16.88 17.00 17.28
0
5
10
15
20
2011 2012 2013 2014 2015 Jun'16
Mar
ket
Cap
(N
’Tn
)
51% 45% 46% 45%
49% 55% 54% 55%
0%
25%
50%
75%
100%
2013 2014 2015 H1'16
Fore
ign
Po
rtfo
lio F
low
(%
)
Inflow Outflow
52%48%
InstitutionalInvestors
Retail Investors

Click to edit Master title style|
The Nigerian Stock Exchange
NSE Trading Statistics – Equity
11August 2016
FACTS AND FIGURES CROSS DEALS 1 2
VALUE TRADED AND NO. OF DEALS13 EQUITY MARKET MAKER VALUE TRADED 4
67 6273
63
88101
0
30
60
90
120
0
20
40
60
80
Jan Feb Mar Apr May Jun
No
. of
De
als
(‘0
00
)
Val
ue
Tra
de
d (
N’B
n)
Negotiated Deals EOB No of Deals
1.7 1.6
2.62.2
2.42.7
0
1
2
3
0
10
20
Jan Feb Mar Apr May Jun No
. of
De
als
(‘0
00
)
N’B
n
Value of Trades No. of Deals
823 851751
1,464
0
300
600
900
1,200
1,500
1,800
Q3'15 Q4'15 Q1'16 Q2'16
Val
ue
Tra
de
d (
N’M
n)
• The number of deals done on the NSE steadilyincreased between Jan‘16 and Jun’16 growingfrom 67,000 (N42.05Bn) to 101,000 (N77.92Bn).
• Cross deals increased by 59%, from 1,700(N5.65Bn) in Jan‘16 to 2,700 (N9.28Bn) inJun‘16.
• Value traded by Equity Market Makers have alsoincreased considerably from N823Mn in Q3’15to N1.45Bn in Q2’16.

Click to edit Master title style|
9%
23%
68%
Scheme shares
Placing
Merger andAcquisition
The Nigerian Stock Exchange
NSE Listing Statistics
12August 2016
96%
Corporate, 3%
State Gov't, 1%
FGN: New issue
Corporate
State Gov't
Equity, 1%
99%
ETF,0% Equity
Bond
ETF
• As at June 30th 2016, total value of new listingsin 2016 amounted to N781.90Bn ($2.76Bn).
• Total equity listings were valued at 4.36Bn($15.39Mn).
• Federal gov’t raised N745.84Bn ($2.64Bn) –95% of total debt capital raised in 2016; Stategov’ts raised N11.95bn ($42.23Mn).
• Corporate entities raised a total of N19.76Bn($69.82Mn).
FACTS AND FIGURES NEW LISTINGS BY ASSET CLASS (BY VALUE) 1 2
NEW EQUITY LISTINGS BY METHOD OF ISSUE 4BOND LISTINGS BY ISSUER3
Total value N781.90bn
Total value N4.36bn
Total value N777.55bn

Click to edit Master title style
Global Competitive Report

Click to edit Master title style|
The Nigerian Stock Exchange
Global Index Performance - 2016
14August 2016
1
2
REGIONAL INDEX PERFORMANCE – COMPARABLE AFRICAN INDICES1
GLOBAL INDEX PERFORMANCE – DEVELOPED, EMERGING AND FRONTIER MARKET INDICES
MSCI WORLD 2.69%
MSCI FM -2.65%
MSCI EM 10.25%
NSE ASI -2.08%
Nairobi ASI-2.58%
JSE/FTSE ASI5.11%
NSE ASI-2.08%
EGX3014.63%
FTSE ASEA -19.67%
70%
100%
130%
Dec-15 Jan-16 Feb-16 Mar-16 Apr-16 May-16 Jun-16 Jul-16
Ind
ex
MSCI FM MSCI EM MSCI WORLD NSE ASI
70%
100%
130%
Dec-15 Jan-16 Feb-16 Mar-16 Apr-16 May-16 Jun-16 Jul-16
Ind
ex
NSE ASI JSE/FTSE ASI FTSE ASEA EGX30 Nairobi ASI

Click to edit Master title style|
The Nigerian Stock Exchange
Equity Market Snapshot H1‘16 – MINT + S
15August 2016
EQUITY MARKET CAPITALIZATION AVERAGE DAILY VALUE TRADED (USD’MN) 1 2
TURNOVER VELOCITY (ANNUALIZED)13 MARKET ACTIVITY – DOMESTIC VS. FOREIGN (%)4
0%
50%
100%
150%
Q3'15 Q4'15 Q1'16 Q2'16
Ind
ex
Borsa Istanbul IDX BMV JSE NSE
150%
30% 27% 21%8%
0%
60%
120%
180%
BorsaIstanbul
JSE BMV IDX NSE
1,6011,469
488 433
120
600
1200
1800
JSE BorsaIstanbul
BMV IDX NSE
100% 99.9%88%
70%57%
0.1% 12%30%
43%
0%
50%
100%
IDX BorsaIstanbul
BMV JSE NSE
Domestic Foreign

Click to edit Master title style|
The Nigerian Stock Exchange
H1’16 Listing Activity – Benchmark Exchanges
16August 2016
1 EQUITY LISTINGS 1
Listings LSE JSE NSE
Equity Listings in 2016* 66 6 3
Value of 2016 Equity Listings* (USD‘Mn) 27,544 2,675 15
IPOs in 2016** 41 Nil Nil
Value of 2016 IPOs** (USD‘Mn) 1,357 Nil Nil
Number of Listed ETFs 889 46 7
New ETF Listings in 2016 83 Nil Nil
Value of 2016 ETF Listings (USD‘Mn) N/A Nil Nil
*Includes listing by IPOs, rights issue, placing, M&A, takeover bid, listing of underwriting commitment shares, employee share plan, memorandum listing, conversion of preference shares to ordinary shares, re-admission, introduction, waiver of pre-emptive rights.**Includes international offerings, offer for subscription, placing and placing & offer for subscription. USD/GBP = 0.75, USD/RAND = 14.73, USD/NGN = 283

Click to edit Master title style
NSE Stakeholders’ Engagement

Click to edit Master title style|
The Nigerian Stock Exchange
NSE Stakeholders’ Update
18August 2016
• FPI’s free exit from the
market hindered by
capital control
measures.
• Market accessibility is a
key criterion for
inclusion in global
benchmark indexes.
• MSCI is currently
monitoring the
situation in Nigeria and
reviewing feedback
from investors.
• Successful prevention of N150Mn fraud in Q1’16 collaborating with EFCC.
• IPF claims worth N42.2Mn approved for payment.
• ~200 investor events held across Nigeria reaching ~13,000 people.
• Compliance status indicator (CSI) codes introduced to indicate compliance status of listed companies.
• 223 DMs were inspected under the MOS, and 209 (94%)* firms have complied with the standards.
• 24 active DMs suspended in Jan’16 in line with SEC capital requirements, seven (7) of which have now recapitalized.
• Palliatives of over N200Mn provided by NSE to support adherence to MOS.
• 12 listed companies
processed through the
CGRS program in 2015.
• 48%** of 132 active
listed companies have
submitted their CGRS
results.
• The NSE introduced a
Facts Behind the
Restructuring forum
for issuers undergoing
restructuring to
engage the investing
public.
MARKET PARTICIPANTS
INVESTOR COMMUNITY
DEALING MEMBERS
ISSUERCOMMUNITY
*As at August 9th, 2016**As at March 9th, 2016

Click to edit Master title style
NSE Strategic Focus in 2016
Click to edit Master title style|
The Nigerian Stock Exchange
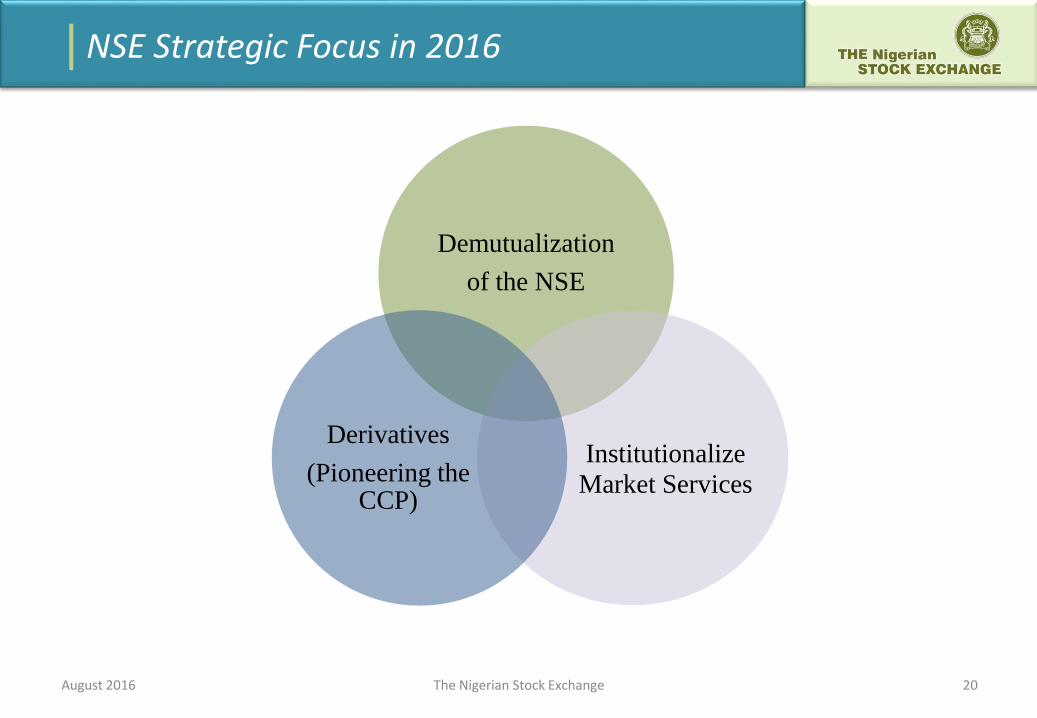
NSE Strategic Focus in 2016
20August 2016
Demutualization
of the NSE
Institutionalize
Market Services
Derivatives
(Pioneering the CCP)

Click to edit Master title style|
The Nigerian Stock Exchange
Demutualization & Derivatives Project Update
21August 2016
DERIVATIVES PROJECT UPDATE
DEMUTUALIZATION PROJECT UPDATE
• Financial and legal advisers onboard to design
framework for the CCP entity.
• Foreign technical partners engaged to deliver the
systems.
• The derivative project indicative product rollout
schedule established.
• Meetings to sensitize and engage major stakeholders of
the CCP are ongoing.
• The NSE has commenced training of regulators and
market participants on derivatives.
• The NSE recently took part in a study tour of the
Chicago Mercantile Exchange and Chicago Board
Options Exchange as part of efforts to launch
derivatives.
• In November 2015, the NSE appointed financial, legal and tax advisers respectively on the proposed
demutualization of the NSE.
• The advisers completed their due diligence work in Q1‘16.
• The NSE together with its advisers have begun stakeholder engagement meetings to begin to address key
issues pertaining to the demutualization process.
• The project is currently ongoing.

Click to edit Master title style|NSE Awards & Accolades
22August 2016

Click to edit Master title style
THANK YOU