Embed Size (px)
Citation preview

Climate and Cropping Patternsin Brazil
Presented on Behalf of the
USDA 2016 Agricultural Outlook Forum:Transforming Agriculture
February 26, 2016
Agricultural Weather AssessmentsWorld Agricultural Outlook Board
Mark D. BrusbergDeputy Chief Meteorologist
USDA Office of the Chief Economist / World Agricultural Outlook Board

Part I: Climate
Source: Perry‐Castañeda Library Map Collection (University of Texas at Austin) Agricultural Weather AssessmentsWorld Agricultural Outlook Board

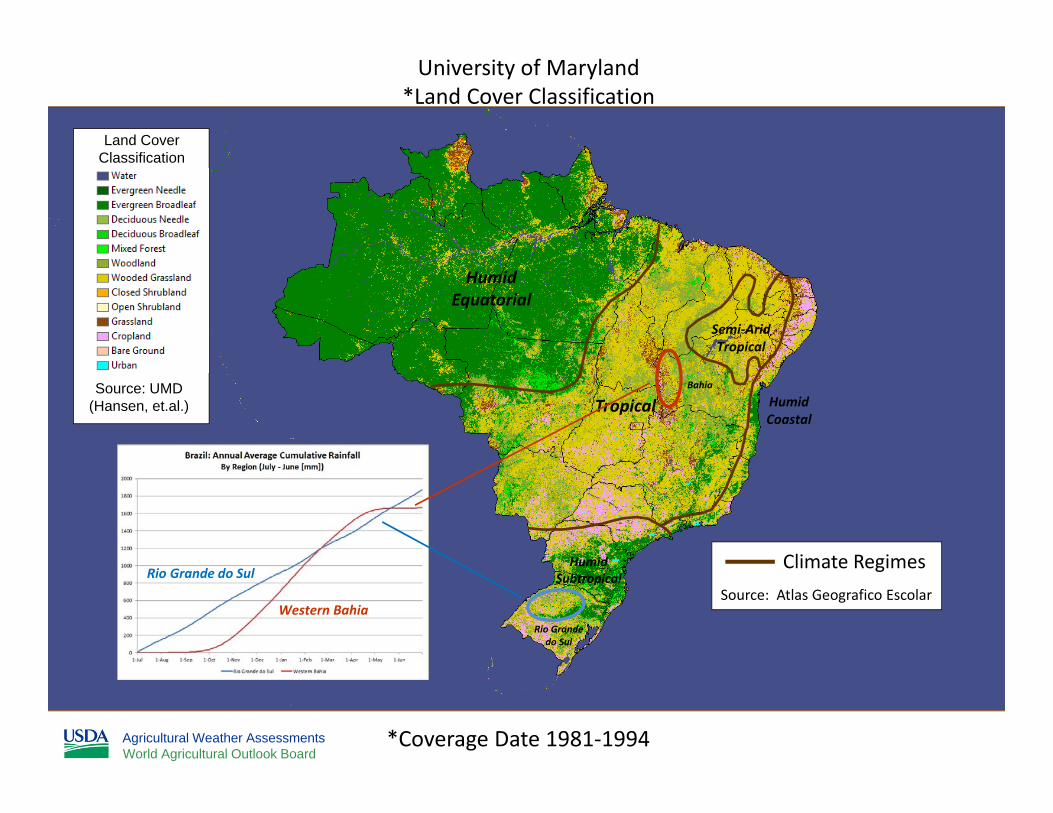
Land CoverClassification
Source: UMD(Hansen, et.al.)
University of Maryland*Land Cover Classification
*Coverage Date 1981‐1994Agricultural Weather AssessmentsWorld Agricultural Outlook Board
Rio Grandedo Sul
SantaCatarina
Mato GrossoBahia
Mato Grossodo Sul
Parana
SaoPaulo
MinasGerais
Goias
Tocantins
Maranhao
Piaui
a – Cearab – Rio Grande do Nortec – Paraibad – Pernambucoe – Alagoasf – Sergipeh – Espirito Santoi – Rio de Janeiro
a b
cd
ef
h
i
ParaAmazonas
Rondonia
RoraimaAmapa
Acre

University of Maryland*Land Cover Classification
*Coverage Date 1981‐1994
HumidEquatorial
Tropical
Semi‐AridTropical
HumidCoastal
Source: Atlas Geografico Escolar
Climate Regimes
Land CoverClassification
Source: UMD(Hansen, et.al.)
Agricultural Weather AssessmentsWorld Agricultural Outlook Board
HumidSubtropical

University of Maryland*Land Cover Classification
*Coverage Date 1981‐1994
HumidSubtropical
Tropical
Semi‐AridTropical
HumidCoastal
Source: Atlas Geografico Escolar
Climate Regimes
Land CoverClassification
Source: UMD(Hansen, et.al.)
Western Bahia
Rio Grande do Sul
Bahia
Rio Grandedo Sul
Agricultural Weather AssessmentsWorld Agricultural Outlook Board
HumidEquatorial

0
200
400
600
800
1000
1200
1400
1‐Jan 1‐Feb 1‐Mar 1‐Apr 1‐May 1‐Jun 1‐Jul 1‐Aug 1‐Sep 1‐Oct 1‐Nov 1‐Dec
Western BahiaCumulative Average Daily Rainfall (mm)
Daily Average Rainfall (1985‐2015)
Virtually No RainExpected
(May through September)
Source: World Meteorological OrganizationAgricultural Weather AssessmentsWorld Agricultural Outlook Board

‐8
‐6
‐4
‐2
0
2
4
6
8
Rio Grande do SulLowest Minimum Temperatures by Day (°C)
Daily Minimum Temperature (1985‐2015)
Freezing TemperaturesPossible
(May through September)
Source: World Meteorological OrganizationAgricultural Weather AssessmentsWorld Agricultural Outlook Board

Part II: Agricultural Expansion
Photo: Jose Reynaldo da FonsecaAgricultural Weather AssessmentsWorld Agricultural Outlook Board

Agricultural Weather AssessmentsWorld Agricultural Outlook Board
Source: PSD‐Online

Agricultural Weather AssessmentsWorld Agricultural Outlook Board
Source: PSD‐Online

Agricultural Weather AssessmentsWorld Agricultural Outlook Board
Source: PSD‐Online

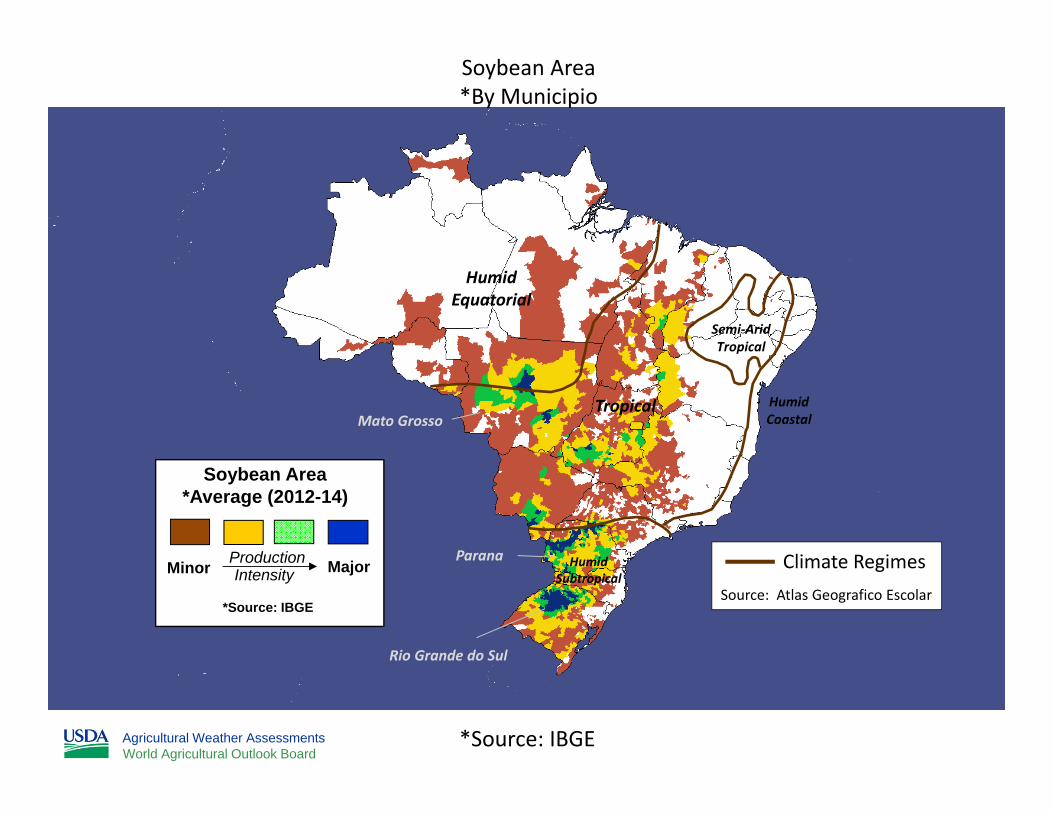
HumidSubtropical
HumidEquatorial
Semi‐AridTropical
HumidCoastal
Soybean Area*By Municipio
*Source: IBGE
Tropical
Major
Soybean Area*Average (1990-92)
IntensityProductionMinor
*Source: IBGE
Agricultural Weather AssessmentsWorld Agricultural Outlook Board
Mato Grosso
Parana
Rio Grande do Sul
Source: Atlas Geografico Escolar
Climate Regimes

State Planted Area (ha)
Harvested Area (ha)
Production(mMT)
Percent of Total (%)
Rio Grande do Sul 3,177,338 3,169,731 4,727,577 26.2Parana 2,019,915 2,016,944 3,873,811 21.5Mato Grosso 1,394,725 1,382,014 3,148,623 17.5Mato Grosso do Sul 1,102,469 1,087,355 1,975,912 11.0Goias 875,977 864,343 1,572,457 8.7Sao Paulo 510,078 510,078 924,772 5.1Minas Gerais 501,755 500,165 898,194 5.0Santa Catarina 281,047 277,185 384,738 2.1Bahia 296,672 296,672 380,472 2.1Federal District 46,202 46,202 91,196 0.5Tocantins 13,887 12,520 18,435 0.1Maranhao 13,671 13,646 12,081 0.1Rondonia 3,240 3,240 7,012 0.0Piaui 1,683 1,683 1,492 0.0Pernambuco 9 9 4 0.0Total 10,238,667 10,181,787 18,016,774 100.0
Brazil Soybean ProductionBy State (1990‐92 Average)
Source: IBGE
Agricultural Weather AssessmentsWorld Agricultural Outlook Board
HumidSubtropical
HumidEquatorial
Semi‐AridTropical
HumidCoastal
Source: Atlas Geografico Escolar
Climate Regimes
Soybean Area*By Municipio
*Source: IBGE
Tropical
Major
Soybean Area*Average (2012-14)
IntensityProductionMinor
*Source: IBGE
Agricultural Weather AssessmentsWorld Agricultural Outlook Board
Mato Grosso
Parana
Rio Grande do Sul

State Planted Area(ha)
Harvested Area(ha)
Production(mMT)
Percent of Total(%)
Mato Grosso 7,847,068 7,835,990 23,917,983 30.7Parana 4,743,520 4,743,181 13,929,563 17.9Rio Grande do Sul 4,662,374 4,623,486 10,581,180 13.6Goias 2,931,615 2,931,592 8,750,173 11.2Mato Grosso do Sul 1,961,379 1,960,562 5,497,821 7.0Minas Gerais 1,142,239 1,138,682 3,264,913 4.2Bahia 1,200,088 1,200,088 3,061,562 3.9Sao Paulo 622,231 621,896 1,707,045 2.2Maranhao 599,421 599,028 1,699,221 2.2Tocantins 557,121 556,794 1,642,989 2.1Santa Catarina 511,262 510,939 1,444,759 1.9Piaui 541,072 534,923 1,217,390 1.6Rondonia 173,737 172,664 553,354 0.7Para 177,745 177,678 519,528 0.7Federal District 59,850 59,850 181,470 0.2Roraima 11,967 11,967 29,383 0.0Amapa 10,885 10,177 26,849 0.0Ceara 1,145 1,145 3,854 0.0Acre 230 229 625 0.0Paraiba 350 175 420 0.0Amazonas 120 120 360 0.0Total 27,755,417 27,691,164 78,030,443 100
Brazil Soybean ProductionBy State (2012‐14 Average)
Source: IBGEAgricultural Weather AssessmentsWorld Agricultural Outlook Board

Major
Soybean Area*Average (1990-92)
IntensityProduction
Minor
*Source: IBGE
Major
Soybean Area*Average (2012-14)
IntensityProduction
Minor
*Source: IBGE
Brazil Soybean Area1990‐92 versus 2012‐14
Agricultural Weather AssessmentsWorld Agricultural Outlook Board
Shift in Area (% of Total Area)
Mato GrossoParanaRGDS
2012‐1430.7%17.9%13.6%
1990‐9217.5%21.5%26.2%
Mato Grosso
Parana
Rio Grande do Sul
Mato Grosso
Parana
Rio Grande do Sul

Agricultural Weather AssessmentsWorld Agricultural Outlook Board
Brazil: Key Production Regions
Center‐West Region:Mato GrossoGoiasMato Grosso do Sul
“MaToPiBa” Region:MaranhaoTocantinsPiauiBahia
South Region:ParanaSanta CatarinaRio Grande do Sul

0
2,000,000
4,000,000
6,000,000
8,000,000
10,000,000
12,000,000
14,000,000
16,000,000
1990 1991 1992 1993 1994 1995 1996 1997 1998 1999 2000 2001 2002 2003 2004 2005 2006 2007 2008 2009 2010 2011 2012 2013 2014
Brazil Soybean Area (ha)By Region
Sul Centro‐Oeste MaPiToBaAgricultural Weather AssessmentsWorld Agricultural Outlook Board
Center West
“MaPiToBa”
South

Center‐West Region:1990‐92: 38%2012‐14: 50%
Brazil: Key Production RegionsPercent of Total National Production
Agricultural Weather AssessmentsWorld Agricultural Outlook Board
“MaToPiBa” Region:1990‐92: 2%2012‐14: 10%
South Region:1990‐92: 50%2012‐14: 33%

Part III: Impacts on National Production
Source: PSD‐OnlineAgricultural Weather AssessmentsWorld Agricultural Outlook Board

Center‐West Region:1990‐92: 38%2012‐14: 50%
Brazil: Key Production RegionsPercent of Total National Production
Agricultural Weather AssessmentsWorld Agricultural Outlook Board
“MaToPiBa” Region:1990‐92: 2%2012‐14: 10%
South Region:1990‐92: 50%2012‐14: 33%

0.00
0.50
1.00
1.50
2.00
2.50
3.00
3.50
1990 1991 1992 1993 1994 1995 1996 1997 1998 1999 2000 2001 2002 2003 2004 2005 2006 2007 2008 2009 2010 2011 2012 2013 2014
SouthSoybean Yields
Observed PredictedAgricultural Weather AssessmentsWorld Agricultural Outlook Board Source: IBGE
High variability / drought prone

Run 1: r2 ~ .98All values: pcp, temp, days between rain forNov – March;
Run 2: r2 ~ .97Dec pcp & tempJan pcp, Feb precip, temp, days between rain,Mar pcp & days between rain
20112.3 - 2.4 mT/ha
20121.3 - 1.4 mT/ha
Agricultural Weather AssessmentsWorld Agricultural Outlook Board

0.00
0.50
1.00
1.50
2.00
2.50
3.00
3.50
1990 1991 1992 1993 1994 1995 1996 1997 1998 1999 2000 2001 2002 2003 2004 2005 2006 2007 2008 2009 2010 2011 2012 2013 2014
Center WestSoybean Yields
Observed PredictedAgricultural Weather AssessmentsWorld Agricultural Outlook Board Source: IBGE
Fairly Stable Yields

0.00
0.50
1.00
1.50
2.00
2.50
3.00
3.50
1990 1991 1992 1993 1994 1995 1996 1997 1998 1999 2000 2001 2002 2003 2004 2005 2006 2007 2008 2009 2010 2011 2012 2013 2014
MaToPiBaSoybean Yields
Observed PredictedAgricultural Weather AssessmentsWorld Agricultural Outlook Board Source: IBGE
Prone to extended periods of dryness

Run 1: r2 ~ .98All values: pcp, temp, days between rain forNov – March;
Run 2: r2 ~ .98Nov pcp & days between rainDec pcp, temp & days between rainJan days between rain Feb precip, temp, days between rain,Mar pcp & days between rain
2011~3.5 mT/ha
20123.2 – 3.5 mT/ha
Agricultural Weather AssessmentsWorld Agricultural Outlook Board

For more information go to: http://www.cpc.noaa.gov/products/precip/CWlink/MJO/enso.shtml
Jan-March 1998 Jan-March 1989
El Niño La Niña
Agricultural Weather AssessmentsWorld Agricultural Outlook Board
ENSO‐Related Rainfall PatternsTypical Rainfall departures (mm)

0.00
0.50
1.00
1.50
2.00
2.50
3.00
3.50
1990 1991 1992 1993 1994 1995 1996 1997 1998 1999 2000 2001 2002 2003 2004 2005 2006 2007 2008 2009 2010 2011 2012 2013 2014
SouthSoybean Yields
Observed PredictedAgricultural Weather AssessmentsWorld Agricultural Outlook Board Source: IBGE
El Niño
La NiñaSource: Climate Prediction Center

0.00
0.50
1.00
1.50
2.00
2.50
3.00
3.50
1990 1991 1992 1993 1994 1995 1996 1997 1998 1999 2000 2001 2002 2003 2004 2005 2006 2007 2008 2009 2010 2011 2012 2013 2014
Center WestSoybean Yields
Observed PredictedAgricultural Weather AssessmentsWorld Agricultural Outlook Board Source: IBGE
El Niño
La NiñaSource: Climate Prediction Center

0.00
0.50
1.00
1.50
2.00
2.50
3.00
3.50
1990 1991 1992 1993 1994 1995 1996 1997 1998 1999 2000 2001 2002 2003 2004 2005 2006 2007 2008 2009 2010 2011 2012 2013 2014
MaToPiBaSoybean Yields
Observed PredictedAgricultural Weather AssessmentsWorld Agricultural Outlook Board Source: IBGE
El Niño
La NiñaSource: Climate Prediction Center

http://envam1.env.uea.ac.uk/mjo.html
Professor Adrian Matthews School of Environmental Sciences and School of Mathematics, University of East Anglia, Norwich, UK
Agricultural Weather AssessmentsWorld Agricultural Outlook Board
Madden Julian Oscillation

Agricultural Weather AssessmentsWorld Agricultural Outlook Board
Suppressed RainfallDuring Active MJO
W. Bahia

Brazil Corn Production
Major
Corn Production*Average (2011-13)
IntensityProductionMinor
*Source: IBGE
JAN FEB MAR APR MAY JUN JUL AUG SEP OCT NOV DEC
1st Corn crop calendar for most of Center-South Brazil
In Northeast Brazil, 1st crop planted Dec - Jan (harvested May - Jul).
Period of Highest Intensity Plant
Harvest
Source: IBGE Brazil
* State-Level Production(as % of total)
Minas GeraisParanaRio Grande do SulSanta CatarinaGoiasSao PauloBahiaMaranhaoPiauiParaMato GrossoMato Grosso do SulCeara
Other States
20201410995222111
~4* 2011 to 2013 Average
JAN FEB MAR APR MAY JUN JUL AUG SEP OCT NOV DEC
2nd Corn crop calendar for most of Center-South Brazil
Plant
Harvest
Source: IBGE Brazil
* State-Level Production(as % of total)
Mato GrossoParanaMato Grosso do SulGoiasSao PauloMinas GeraisSergipeBahiaMaranhaoRondoniaOther States
39251512
311111
~1
* 2011 to 2013 Average
Agricultural Weather AssessmentsWorld Agricultural Outlook Board

0%
10%
20%
30%
40%
50%
60%
70%
80%
90%
100%19
80/198
119
81/198
219
82/198
319
83/198
419
84/198
519
85/198
619
86/198
719
87/198
819
88/198
919
89/199
019
90/199
119
91/199
219
92/199
319
93/199
419
94/199
519
95/199
619
96/199
719
97/199
819
98/199
919
99/200
020
00/200
120
01/200
220
02/200
320
03/200
420
04/200
520
05/200
620
06/200
720
07/200
820
08/200
920
09/201
020
10/201
120
11/201
220
12/201
320
13/201
420
14/201
520
15/201
6
Brazil Corn Production: Percent of Total Production by Season
1st CORN PRODUCTION 2nd CORN PRODUCTION
Source: 1980/81 to 2012/13 CONAB‐Series Historica
Agricultural Weather AssessmentsWorld Agricultural Outlook Board
Since 2012, Second CropLarger than First
Summary
• Brazilian agricultural production has increased over the past 25 years, largely due to a significant shift toward farming in central Brazil and the northeastern interior;
• One of the main benefits to this migration is a reduction in the percent of acreage in drought‐prone areas;
• Another benefit has been the ability of farmers in the Center‐West Region to expand the production of second‐crop corn.
Thanks!
Agricultural Weather AssessmentsWorld Agricultural Outlook Board

University of Maryland*Land Cover Classification
*Coverage Date 1981‐1994
HumidSubtropical
HumidEquatorial
Tropical
Semi‐AridTropical
HumidCoastal
Source: Atlas Geografico Escolar
Climate Regimes
Land CoverClassification
Source: UMD(Hansen, et.al.)
Western Bahia
Rio Grande do Sul
Bahia
Rio Grandedo Sul
Agricultural Weather AssessmentsWorld Agricultural Outlook Board

0
1,000,000
2,000,000
3,000,000
4,000,000
5,000,000
6,000,000
7,000,000
8,000,000
9,000,000
10,000,000
1990 1991 1992 1993 1994 1995 1996 1997 1998 1999 2000 2001 2002 2003 2004 2005 2006 2007 2008 2009 2010 2011 2012 2013 2014
Brazil Soybean Area (ha)Selected States
Paraná Rio Grande do Sul Mato GrossoAgricultural Weather AssessmentsWorld Agricultural Outlook Board
Mato Grosso
Parana
Rio Grandedo Sul

Agricultural Weather AssessmentsWorld Agricultural Outlook Board
Source: PSD‐Online