Embed Size (px)
Citation preview

Climate and Disaster Resilience

Pacific Island countries face unique development challenges. They are far away from major markets, often with small populations spread across many islands and vast distances, and are at the forefront of climate change and its impacts. Because of this, much research has focused on the challenges and constraints faced by Pacific Island countries, and finding ways to respond to these. This paper is one part of the Pacific Possible series, which takes a positive focus, looking at genuinely transformative opportunities that exist for Pacific Island countries over the next 25 years and identifies the region’s biggest challenges that require urgent action. Realizing these opportunities will often require collaboration not only between Pacific Island Governments, but also with neighbouring countries on the Pacific Rim. The findings presented in Pacific Possible will provide governments and policy-makers with specific insights into what each area could mean for the economy, for employment, for government income and spending. To learn more, visit www.worldbank.org/PacificPossible, or join the conversation online with the hashtag #PacificPossible.
Cover photo: Vlad Sokhin/Panos

2
Table of Contents Executive Summary ................................................................................................................................. 3
Introduction .......................................................................................................................................... 13
1. Current Risks and Projected Climate Changes .............................................................................. 15
1.1 Current Risk and Exposure in PICs ........................................................................................ 15
1.2 Climate Change and its Effect on PICs .................................................................................. 19
1.3 Impact on Poverty and Gender ............................................................................................. 22
2. Managing climate and Disaster Risks ............................................................................................ 27
2.1 Reducing Exposure ................................................................................................................ 28
2.2 Reducing vulnerability........................................................................................................... 28
2.3 Adaptation and Development Deficit ................................................................................... 30
3. Adaptation to Climate Change and Disaster Risk for Key Sectors ................................................ 30
3.1 Estimating Costs of Adaptation ............................................................................................. 30
3.2 Sea Level Rise and Coastal Protection .................................................................................. 31
3.3 Managing Water Resources and Flooding ............................................................................ 35
3.4 Adapting Infrastructure to Changes in Rainfall and Temperature ........................................ 43
3.5 Improving the resilience of buildings to tropical cyclone winds........................................... 49
3.6 Adaptation in the Agricultural Sector ................................................................................... 56
4. The Case of Atoll Islands ............................................................................................................... 60
Reference .............................................................................................................................................. 64
Annex on detailed methodology (Volume II of the report): ................................................................. 67
Annex 1 - Climate change and Pacific Islands ....................................................................................... 67
Annex 2 - Sea Level Rise and Coastal Protection .................................................................................. 67
Annex 3 - Managing Water Resources and Flooding ............................................................................ 67
Annex 4 - Adaptation for Infrastructure ............................................................................................... 67
Annex 5 - Improving the Resilience of Buildings to Tropical Cyclones ................................................. 67

3
Executive Summary The Pacific region is known to be one of the most exposed to natural hazards and climate change in the world. Pacific Island Countries (PICs) are exposed to a wide variety of natural hazards, including cyclones, droughts, earthquakes, electrical storms, extreme winds, floods, landslides, storm surges, tsunami and volcanic eruptions. Some of these hazards will be exacerbated by climate change. Average ocean and land temperatures are increasing, and the seasonality and duration of rainfall is changing. Over the coming decades, tropical cyclones are expected to increase in intensity, though not necessarily in frequency, and to move closer to the equator. Because of higher ocean temperature and ice sheet melt, sea level is rising, thereby worsening coastal erosion and saline intrusion and increasing the severity of storm surges. All these impacts adversely affects agriculture, fisheries, coastal zones, water resources, health, and ecosystems and thus threaten entire communities and economies. The mere existence of low-lying atoll island nations like Kiribati, Tuvalu and RMI is threatened by sea level rise and storm surges, since they are only 1-3m above sea level.
People and economies in the Pacific are particularly vulnerable to hazard and climate change impacts because of geographical remoteness and isolation, dispersion across a large area in the Pacific Ocean, economic and social challenges and the degradation of natural resources. Vulnerability to extreme climate events is now increasing with population growth and migration (internal and external), poor coastal development and land use planning, unplanned urban growth, and water and ecosystem degradation including pollution of sub-surface and coastal waters. Vulnerability is exacerbated for the poorest populations (mostly in Kiribati, Vanuatu and FSM), who live in small communities on remote outer-islands, often on lands which are vulnerable to flooding and cyclones, and who rely on subsistence-farming and fishing for their livelihoods. These people have limited access to education and health facilities and lack the financial capacity (savings, insurance) to cope with the impacts of natural hazards and climate change. Women also suffer more from climate extremes than men, because they tend to depend more on natural resources for livelihood and subsistence, and are vulnerable to gender-based violence in the aftermath of disasters.
Despite a consensus that PICs will be disproportionately impacted by climate change, assessing the future cost of climate-change impacts in the Pacific Region is challenging. Firstly, there are deep uncertainties on the speed and sometimes direction of climate changes, especially at local scales. There are large differences on rainfall and storm surges changes between the projections of different climate models that do not seem to be diminishing with time. And given the small size of the PICs and the extensive ocean dominated areas where they are located, downscaling changes in climate and natural hazards at the country level gives an even wider range of potential changes. For instance, in Kiribati some models project an increase in extreme peak daily rainfall of 53% in 2050 while others predict an increase of 92%, for the same emissions scenarios. In addition, even if models were perfectly accurate, uncertainty would not disappear because future levels of greenhouse gas emissions, which by nature cannot be forecasted, largely determine future climate change. Secondly, climate change impacts will depend on the socio-economic choices made by countries for the next decades. It will be much more expensive to adapt to climate change in a society which heavily depends on agriculture production, with high poverty rates, inequalities, and poorly-managed infrastructure than in an inclusive society with safety nets and resilient infrastructure. Rapid and inclusive development can mitigate some climate change impacts by 2030, especially the impacts on the poorest (Hallegatte et al, 2016). Finally, the costs and benefits of adaptation will be determined by

4
priorities of individual PICs. For instance, the best adaptation strategy will differ if the objective is economic efficiency, or if the objective is to remain below a defined level of risk.
Despite these challenges, it is possible to design resilient development strategies using new decision frameworks. Indeed, many decisions made now concerning development strategies and infrastructure investment in the PICs need to take into account climate change. Given the uncertainties around future climate change and associated impacts, infrastructure should be made resilient to possible changes in climate conditions. This aim implies that policy makers using climate information must change their practices and decision-making frameworks, for instance by adapting uncertainty-management methods. Five methods can be considered (Hallegatte, 2009):
(i) Selecting strategies that yield benefits even in absence of climate change, and therefore create no or little regret if the climate does not change as expected. Example of no-regret strategies include reducing leaks in water distribution systems, increasing the standards of new buildings, or increasing the frequency of road maintenance.
(ii) Favouring reversible and flexible options, like insurance, early-warning systems or easy-to-retrofit coastal defences.
(iii) Buying ‘‘safety margins’’ in new investments, with for instance restrictive land-use planning, higher coastal protection defences or bigger drainage capacity for urban infrastructure and roads.
(iv) Promoting strategies focused on institutions, policies and behaviour change, including the ‘‘institutionalization’’ of long-term investment planning, multi-criteria assessment and use of a range of policy and financial investment instruments.
(v) Reducing decision time horizons. For instance, in areas that could be flood-prone in the future, building cheaper houses with shorter lifetime that can be replaced quickly and at lower cost.
This report uses these generic methods to provide recommendations for climate resilient development in the PICs in the following sectors: coastal protection, flood management, water resources management, protection of infrastructure against changes in temperature and precipitations, protection of buildings against cyclone winds, and adaptation in the agriculture sector.
Improving Coastal Protection
The highest adaptation costs for PICs by 2040 will be coastal protection. In order to protect PICs from coastal erosion, sea and river flooding, and submergence, three “hard” options have been considered within this report including: (i) beach nourishment (particularly in areas with high tourism revenue); (ii) sea and river dike construction; and (iii) port upgrade. The level of protection required and the associated cost of these options varies largely between countries and the sea level rise scenarios, but the costs are always significant. In the best case, with a sea level rise of 40cm by 2100, costs in the 2040s vary between USD 3 million per year in Palau (1% of GDP assuming constant growth) to USD 97 million in the Solomon Islands (3% of GDP) and USD 17 million in Kiribati (4% of GDP). In the worst case, with a sea level rise of 126cm by 2100 and increased cyclones intensity, costs go up to USD 329 million per year in Fiji (3% of GDP) and USD 58 million in the Marshall Islands (13% of GDP). These figures far exceed the cost of coastal adaptation reported in other region – 0.8 % of the GDP for Sub Saharan Africa and less than 0.4% in other regions. Those high costs are primarily comprised of

5
expenditure on the construction and maintenance of sea walls (more than 75% of the total in most countries). It is important to note that these costs assume that only the principal population centres will be protected, and not the outer islands and less densely populated coastal segments. This means that additional costs will be associated with internal migrations and densification of the population behind coastal protections.
Table 1 Range of adaptation costs for coastal protection by country (best case-worst case scenario) (million USD per year at 2012 international prices)
Country 2020s 2040s 2040s as % of projected GDP (includes residual damages)
Fiji 71-230 86-329 1-3% Micronesia, Fed. Sts. 6-20 8-28 1-3% Kiribati 13-42 17-54 4-11% Marshall Islands 13-42 16-58 4-13% Palau 2-9 3-11 1-2% Solomon Islands 81-280 97-347 3-11% Tonga 8-28 9-35 1-4% Vanuatu 36-130 42-161 2-8% Samoa 4-15 7-21 0-1%
Source: World Bank estimates
There is little prospect that the high costs of building sea walls could be financed by the countries themselves. Accordingly, the international community will have to assess the trade-off between large initial expenditures on construction that is designed to protect coastal communities for many years into the future versus expenditures and emergency relief and recovery programs when disasters occur. Some countries – e.g. the UK and France – have abandoned attempts to protect all of their coastlines from storm and wave damage; some of the Pacific Island countries may need to make a similar choice and set priorities in the geographical allocation of expenditures on coastal protection.
To manage the uncertainties around future climate change and shoreline behaviour, flexibility should be incorporated into the design of coastal protection interventions. In some situations, hard structural options could be combined with softer non-structural options (e.g: ecosystem based approaches, beach nourishment) to reduce the cost and mitigate the environmental and social impacts. Ensuring that future population growth is concentrated outside coastal zones and relocation of the existing population may be considered, although the implementation might be challenging due to land scarcity and tenure issues. Another option could be to raise buildings above coastal inundation levels to reduce the need for hard-infrastructure protection. In all cases, strengthening institutional capacity for integrated coastal management is an essential element of responding to climate change.
Managing floods and water resources
Many climate scenarios suggest that total annual precipitation will increase in most PICs as a result of climate change. This increase will be accompanied by greater variation in rainfall between wet and

6
dry months, with more intense rainfall in the wettest periods of the year. For example, in Fiji while the 1 in 20 year peak rainfall event in 24 hours today is 245 mm, it would be about 300 mm in 2050 with climate change. There is also a potential for more severe droughts, especially for the Solomon Islands and Tuvalu and to a less extend Fiji, Palau and RMI. Hence, adaptation to climate change should involve measures to: (i) increase the capacity to store water that is accumulated in wetter months for use in the drier months; and (ii) manage the run-off caused by more intense periods of rain.
Table 2– Changes in high 1 in 20 year rainfall over 24 hour period by country for 2050 (mm of rain relative to recent climate)
Country No Climate Change Median Climate change Extreme Climate Change
FJI 245 292 348 FSM 63 78 123 KIR 145 224 365 MHL 72 85 125 PLW 197 245 284 SLB 84 102 119 TON 57 68 82 TUV 83 102 127 VUT 189 230 281 SAM 79 97 116
Investment in increased water storage and rainwater harvesting, especially on islands with limited amounts of land suitable for reservoirs, will be critical. The alternative to investing in more water storage may be reliance upon desalination facilities or other alternative water resources, which (depending on scale) can result in a significant capital costs in addition to ongoing operational and maintenance costs.
A combination of initiatives will be required to minimize future flood risk. A key approach should be effective land-use planning for future urban development, as in general it is cheaper to keep economic assets out of flood prone areas than to build storm and flood defences to protect them. However, as for coastal protection, the implementation of such initiatives may be constrained by land scarcity and tenure issues. Alternatives include any combination of measures to provide protection to assets or accommodation to flood flows. One option for adapting to climate change would be to increase the existing design standards for flood defences, drainage infrastructure and buildings to a higher standard of protection, which would cater for any increases in risk due to higher rainfall, without resulting in a lower standard of protection over time due to climate change. Another strategy may be to ensure that the floor levels of all new buildings are raised so that their main thresholds are a metre or more above ground level. This would also benefit PICs who are vulnerable to coastal inundation and sea level rise.
A “one size fits all” approach to flood risk and drought management will not be appropriate for PICs. The selection of the best combination of interventions for each PIC will require a comprehensive investigation of the costs and benefits of each option, which will be specific to the needs of the beneficiaries. Limited investigations have been conducted in PICs to date, in part due to the lack of quality hydrological data upon which to base investigations.

7
Adapting infrastructure to changes in rainfall and temperature
Even if coastal protection is provided to protect infrastructure from seal level rise and storm surges, additional expenses will be required to protect power and telecommunication, water and sewers, urban, roads and other transport, hospitals, schools and housing infrastructure from changes in rainfall and temperature. The materials and designs used in building infrastructure, as well as the frequency of maintenance, would need to be altered to maintain the same quality of infrastructure services as in the absence of climate change. For example, in buildings it will be necessary to increase the capacity of ventilation systems in order to cope with more humidity and higher temperatures, and to strengthen the roofs to withstand higher levels of rain. In urban designs larger drainage and water storage systems will be required to cope with higher rainfall.
Assuming countries raise construction standards as they become richer (for example new urban drainage systems are built to withstand a 1 in 20 years event instead of 1 in 10, because the value of the assets that need protection is higher), the cost of protecting infrastructure against changes in rainfall and temperature due to average climate change in 2040 will vary from 2% to 20% of expenditures across the PICs. Fiji and Vanuatu will have lower adaptation costs, while atoll countries such as FSM and Kiribati will have higher costs. Roads account for more than 50% of the average costs of adaptation for most PICs and exceed 90% of the average costs in Solomon Islands and Samoa.
Table 3- Costs of protecting infrastructure relative to baseline expenditures (Average cost of pre-emptive adaptation for all infrastructure assets by country for 2011-50; 20 year planning horizon; $ million per year at 2010 international prices with no discounting)
Country Average cost % of baseline expenditure
Fiji 20.2 3.0% FSM 13.4 13% Kiribati 18.9 21% MHL 8.1 11% Palau 4.5 6.3% SLB 17.3 8.6% Tonga 8.4 12% Tuvalu 0.3 5.8% Vanuatu 7.0 3.9% Samoa 7.8 7.0%
For most type of infrastructure (e.g: health and schools infrastructure, housing, water supply and sewers) the lowest regret option is to adapt now to future climate changes. The lowest-regret strategy often entails planning ahead for only one or two decades. For example, for infrastructure that has generally a short life-span (such as houses), decision-makers and engineers should not be asked to design houses with a view to extend their lifetime beyond 20 years. It is cheaper to build infrastructure that can withstand the climate conditions of the next 10 to 20 years than building infrastructure that can withstand both current climate and the climate that will be experienced in 30 years. For many types of infrastructure the pre-emptive strategy is fully justified as the marginal cost is low (e.g: ICT, health and schools, water and sewers).

8
For roads, due to the the high costs of comprehensively protecting infrastructure against the worst case scenario and the high uncertainty surrounding future changes in rainfall, the optimum solution will be a combination of pre-emptive measures and strengthening preparedness. The lowest regret option for many PICs appears to be a mix of: (ii) relatively low cost adaptation measures (e.g. first and foremost proper maintenance but also increase the slope of pavement and/or the capacity of the drainage systems to reflect changes in future expected runoff or water flow) and (ii) be reactive to climate change impacts which would involve rebuilding those sections of the roads if and when they are damaged. However, this assumes that governments will have the financial and technical resources to react quickly in case of disasters and repair damaged roads promptly, whereas if those conditions are not met, the costs of being reactive may be largely underestimated. A possible cost-effective solution for managing future changes in climate and minimize the economic costs associated with a road failure could be to focus on non-engineering measures such as realignment, environmental management (increased vegetation land cover, preservation of mangroves…) and land-use planning, and on strengthening preparedness, and maintaining accessibility to essential infrastructure such as schools and hospitals following a disaster event by increasing the redundancy of the road network, thus making sure there are alternatives even if the main road is damaged.
The results provided within this report are indicative, but adaptation strategies need to be designed on a case by case basis. For instance in some places it may make sense to adapt roads to climate change by installing higher drainage capacity and elevating the road, while in other places increasing redundancy in the road network can be a more cost-effective solution. The best solution will depend on the local context, and in particular on the acceptable level of service failure.
Protecting buildings against cyclone winds
In addition to adapting buildings to withstand sea level rise, increased flooding and changes in temperature, it may also be necessary to protect them against stronger cyclone winds, as the intensity of tropical cyclones is likely to increase.
Ensuring that new buildings can withstand at least 1 in 50 year cyclone wind speeds should be a high priority for policymakers. The changes required to ensure that structures are more robust to cyclones will usually involve modest adjustments to designs when the buildings are constructed, and small additional costs. However, the successful implementation of higher building standards will require actions to improve compliance with the new code, including investment in training of engineers and contractors, strengthening of the design and construction permitting process, and provision of enforcement resources.
Reconstruction efforts should seek to ensure that buildings – especially, public buildings – should incorporate the code improvements necessary to ensure greater resilience to the current and future distribution of cyclone risks. The benefits of greater wind resistance will increase as a consequence of climate change over the life of the buildings that are either replaced or reconstructed during the recovery from these storms.
For existing buildings, cyclone wind retrofitting options can decrease expected losses by 35-50% (Figure 1). However, such investments are not always justified when the costs of heavy retrofitting to meet higher standards which would accommodate increased wind speeds are high relative to the

9
benefits in terms of loss reduction. It is therefore necessary to prioritize the countries and the buildings for which retrofitting would be appropriate, in order to ensure cost-efficiency. For instance, retrofitting will be more cost-efficient in countries which face higher cyclone risks - notably Vanuatu, Fiji, RMI, Tonga and Samoa where retrofitting public buildings (e.g. schools, hospitals) appears to be economically justified.
The heavy retrofitting of public buildings becomes a viable policy option when factoring in their role as evacuation shelters during cyclones. Benefits including avoidance of potential loss of life or injuries and the loss of the services provided by buildings should be considered in future analyses. For housing stock, retrofitting is shown to be too expensive in many countries, and therefore early replacement of the buildings in combination with upgraded construction standards may be a better strategy.
Figure 1 - Loss reductions due to cyclone wind retrofitting options
Adapting the agriculture sector
As the climate changes, increased temperatures and higher risk of seasonal droughts are likely to decrease crop productivity and negatively affect livestock in PICs. For example, papaya is sensitive to temperature increase during flower production and higher temperatures result in lower productivity. Although increases in carbon dioxide concentrations could act as a “fertilizer” for some crops in the short-run (e.g. rice, sugarcane and sweet potato), the crop yields of cassava, maize, and taro is likely to decrease by 2050. Livestock may also be negatively impacted due to increased risk of heat stress.
0% 10% 20% 30% 40% 50% 60%
FJI
FSM
MHL
TON
VUT
WSM
% Reduction of Expected Annual Loss
Public Heavy Public Light Res Light

10
Table 4: Relative Changes in Crop Yields (%) under Climate Change in 2050 Relative to 2000
Country
Cassava Maize Rice Sugarcane Sweet potato Taro
Worst case
Best case
Worst case
Best case
Worst case
Best case
Worst case
Best case
Worst case
Best case
Worst case
Best case
Fiji -36.5 -8.8 -7 1 -11 3.5 -8.3 2.8 -13.4 2 -17.5 1.1
Solomon Islands
-27.8 -17.9 -16.5 -0.3 -16.2 5.9 -12.9 0.9 -15 1.5 -18.6 -4.7
Source: Rosegrant et al. 2013, in ADB 2013
While the impact on GDP could be overall neutral for the Pacific region by 2050 (although some countries may experience negative impacts of 1-3 percent of GDP in this time period), by 2100 the impact could be strongly negative, equivalent to approximately 5 percent of Pacific GDP as all crop yields decrease. These impacts are likely to be underestimated given that they do not take into account interaction effects with other biophysical processes, such as salinity intrusion or the incidence of pests and diseases.
Adaptation to climate change in agriculture in PICs needs to be based on both low-cost no regret options and perhaps more expensive long-term solutions. Simple low-cost options that both improve productivity and increase resilience to climate change include mulching and multiple cropping, and improved farmer education. Longer term solutions should build agriculture systems that can be resilient to multiple changes, such as short periods of floods or droughts, saline intrusion, extremes of temperature, erosion, altered patterns of pests and diseases and changes in growing seasons. As agro-ecological conditions change, farmer re-education will be vital – preferably promoted through farmer-to-farmer exchanges. Other solutions are likely to incorporate more substantial and sustained investments, such as the development of new climate-smart crop varieties at regional or national level, higher design standards for agricultural assets (such as storage sheds and livestock shelters) to help reduce storm damage, or insurance mechanisms to address residual risks, which require considerable government involvement including consideration of premium subsidies and product development and loss assessment.
The Case of Atoll Islands
The atoll nations of Kiribati, Marshall Islands, and Tuvalu are particularly vulnerable to sea level rise and storm surges. As their highest point of elevation is only a few meters above sea level, in the absence of adaptation sea level rise will reduce the habitable surface over time and may lead to a dislocation of the island. For example, for Majuro Atoll in RMI, a 50cm rise in sea level may mean the disappearance of 80% of its land area (ADB, 2013). In Tuvalu’s Fongafale Island (Funafuti), sea level rise by 2040 would lead to a more modest but still large loss of about 5.8-10% of Fongafale’s land area and expose a further 10-11% of land area to occasional inundations.
The cost of managing the risk of sea level rise on atoll nations is likely to be significant. In Kiribati for example, the cost of coastal adaptation could be between US$ 17 to 54 million in the 2040s, which

11
is about 4 to 11% of Kiribati’s GDP. It is unlikely to be affordable for the Government of Kiribati to allocate such an amount in its annual budget to coastal protection for the next decades and significant financial support from the international community will be required. Ensuring decent living conditions on the atoll requires to arbitrate between hard protection options (i.e., through atoll raising, land reclamation, coastal protection) and softer ones (like rehabilitation or protection of mangroves and wetlands, early-warning systems, social protection or financial instruments) and to prioritize between investments in coastal protection, water desalinization, or other infrastructure in transport and energy. It also requires to carefully identify the trade-offs and synergies between multiple objectives in different sectors.
In the event that the international community will not allocate an estimated USD 10 to 50 million a year per atoll nation to protect them against sea level rise, or if the costs of adaption are much higher than expected, other long term options will need to be considered. Consideration should be given to the feasibility of a progressive relocation. Such an approach would need to be carefully planned and available resources would still need to be used to maintain acceptable living conditions on the atolls for the coming decades. There are political, social and economic sensitivities that would need to be carefully considered and addressed in the event that this option is adopted, as discussed in Wyett (2013). It is clear that a progressive and planned relocation of the population away from the most exposed areas would be less costly and preferable to a last-minute abandonment, which would require a significant level of emergency assistance.
Former President Anote Tong of Kiribati has spoken of the need to ensure “migration with dignity” for the country’s population. While the Government of Tuvalu (2012) specifically mentions migration as a possible climate change outcome, survey data shows that the vast majority of Tuvaluans do not view this as a major reason for concern and are not, as yet, preparing to migrate due of climate change (Mortreux and Barnett, 2009). The decision to plan for a relocation of the population, or part of the population to another country is a difficult one to make, given the uncertainties surrounding the speed and strength of climate change and sea level rise. In addition, there is also uncertainty related to the availability of international aid, along with challenges linked to the social acceptability of a planned migration. However, it makes a lot of sense to start considering this option as a long-term solution to climate change impacts in atoll countries, using an integrated approach that involves all stakeholders and carefully examines the threats that climate change poses to life on the atoll nations. The costs of maintaining acceptable living conditions on the atoll nations for different time horizons should also be considered.
Conclusions
The findings and recommendations provided in this report should be used carefully and considered in accordance with the local contexts. Resilient development in PICs under tight budget constraints will require a compromise between hard protection options (such as sea walls, building retrofitting, and desalinisation plants, which are very expensive in Pacific Islands given the cost of importing materials and equipment) and softer options (such as rehabilitation or protection of mangroves and wetlands, early-warning systems, social protection and rainwater harvesting). It will also require prioritization between investments in coastal protection, flood protection, water supply, or resilient infrastructure.
12
The trade-offs and synergies between multiple objectives in different sectors will need to be identified. For instance, water desalinization requires a lot of energy (therefore opportunities for alternative energy sources such as solar energy should be sought), changes to climate-resistant crops can affect water demand by the agricultural sector, and land-use patterns can affect the exposure of the population to extreme events. Integrated design and assessment of adaptation across multiple sectors should be supported.

13
Introduction Pacific Island Countries (PICs) are among the most exposed nations in the world to natural hazards (including floods, droughts, tropical cyclones, storm surges, earthquakes, volcanic eruptions, and tsunamis). They are also highly vulnerable to these hazards, which can result in disasters that affect their entire economies, human and physical capital, and impact their long-term development agendas. Since 1950, natural disasters have affected approximately 9.2 million people in the Pacific region, causing approximately 10,000 reported deaths. This has cost the PICs around US$3.2 billion (in nominal terms) in associated damage costs (EM-DAT, 20101). The PICs are some of the most economically affected by disasters in the world, with, for instance, average annualized losses estimated to amount to 6.6% of the GDP for Vanuatu and 4.4% of the GDP for Tonga.
These losses may be compounded by the impacts of climate change. Sea level rise, increasing land temperatures, changes in the seasonality and duration of rainfall will affect infrastructure, coastal zones, water resources, agriculture, food security, and thus lives, livelihoods and economies.
Disasters, climate and weather extremes and projected changes in climate, are increasingly recognized as a major development challenge, as they adversely impact social and economic development and poverty reduction efforts. Accordingly, the Pacific Possible Strategic Report is being prepared, in order to take a long term view of the development challenges and opportunities faced by PICs and focus on activities that could have transformational impacts on countries in the region. Pacific Possible aims to identify and whenever possible quantify development gains that could be achieved if the right preconditions are in place. The long-term perspective adopted by Pacific Possible will consider major changes in the economic environment for PICs and their impact on the PICs development opportunities. Such changes will include climate change, with projected severe impacts on PICs, and in particular, atoll nations.
The Pacific Possible includes six thematic focus areas, one of which is “Managing increased stress on pacific livelihoods.” This focus area will include consideration of natural disasters and the impacts of climate change on PICs, and this background paper has been prepared to support this process. This background paper will consider the following key issues regarding the changes in PICs by the year 2040:
1. The potential socio-economic impacts from natural hazards and climate change; 2. The cost of adaptation to minimise potential socio-economic impacts; and identification of
the combination of investments and policies that are likely to have the highest impact in reducing the socio-economic impacts.
In order to develop effective adaptation strategies, it is essential to distinguish between the impacts of: (a) changes in the frequency and/or severity of extreme weather events; and (b) changes in “normal” climate conditions, such as higher mean temperatures, higher mean sea level the level and pattern of precipitation, ENSO cycles, etc.
1 EM-DAT: The OFDA/CRED International Disaster Database – www.emdat.be – Université Catholique de Louvain – Brussels – Belgium

14
For extreme weather events that underlie disaster risks, the starting point for PICs must be an assessment of whether current standards and practices offer an appropriate level of resilience in the context of current climate hazards. As countries develop they tend to invest in higher levels of resilience because the benefits of preventing losses outweighs the costs as the assets and incomes at risk grow. Today, the PICs invest less in disaster resilience than would be required to provide them with a high level of resilience. As such, it is possible that the additional costs of adapting to climate change-driven increases in extreme weather may be small relative to the costs of investing in greater resilience to current risks.
Adapting to changes in average climate conditions requires a gradual response. For example, this could be through changes in the design of infrastructure and other assets, investments in agricultural research & development, the management of water resources, or coastal adaptation. Given the uncertainties that exist around the future impacts of climate changes, (particularly future changes in rainfall patterns or impacts on extreme events), adapting will require flexible or low-regret options which perform well whatever the future brings. In some cases, the lowest regret option may be to wait and adapt reactively to climate change impacts, while in some sectors the lowest regret strategy will be to adapt pre-emptively.
This background paper considers adaptation for a range of sectors and situations, including infrastructure and buildings, coastal protection, the water sector, and agriculture. Special consideration is given to regional atoll islands due to their unique challenges, with many of them only 1-3m above sea level and sea levels predicted to rise by 25 cm by 2050 and 60 cm or more by 2100. It also considers the economic costs of adaptation and proposes some prioritised support for the 2040 timeframe of the Pacific possible.
15
1. Current Risks and Projected Climate Changes
1.1 Current Risk and Exposure in PICs
The Pacific region is known to be one of the most prone to natural disasters and climate change in the world. Key reasons are their high exposure to a wide variety of natural hazards (cyclones, droughts, earthquakes, electrical storms, extreme winds, floods, landslides, storm surges, tsunami and volcanic eruptions), geographical remoteness and isolation, and dispersion across a large area in the Pacific Ocean. The region is frequently hit by hazard events. Between 1950 and 2011, extreme weather-related events in the Pacific islands region affected approximately 9.2 million people in the Pacific region, approximately 10,000 reported deaths and damage costs of around US$3.2 billion. Recent estimates show that the expected losses due to natural disasters on an annualized basis in the Pacific far exceed those in almost all other countries in the world. The impact of natural disasters is equivalent to an annualised loss of 6.6 percent of GDP in Vanuatu, and 4.3 percent in Tonga.
Climate change is exacerbating the vulnerabilities of PICs. Tropical cyclones- a major cause of losses and damage for PICs -, are expected to increase in intensity, though not necessarily frequency, over the coming decades. In addition to changing extreme weather events, climate change is adding pressure on fragile island systems via increasing average ocean and land temperatures, changes in the seasonality and duration of rainfall, coastal erosion, saline intrusion and increasing sea level2. Climate Change may threaten the existence of entire low-lying atoll island nations, such as Kiribati, Tuvalu and RMI. These states are only 1-3m above sea level, and thus are threatened by projected sea level rises of around 60 cm or more by 2100. Climate change is already adversely affecting agriculture, fisheries, coastal zones, water resources, health, ecosystems and thus economies of countries and communities. If greenhouse gas emissions are not drastically reduced, continued changes in climate are likely to exacerbate these negatives effects3.
In addition, the vulnerability of PICs is also increasing due to economic and social changes and the degradation of natural resources. Key drivers include population growth and migration (internal and external), poor coastal development and land use planning, unplanned urban growth, and water and ecosystem degradation including pollution of sub-surface and coastal waters.
Natural hazards and climate change affect countries differently as highlighted by the country risk profiles developed under the Pacific Catastrophe Risk Assessment and Financing Initiative (PCRAFI). Whereas atoll island nations outside the cyclone belt and seismic zones are more affected by slow-onset events, such as saline intrusions and coastal erosion, rapid onset disasters are frequent occurrences in the high-volcanic islands. Overall, hydro-meteorological disasters cause the majority of economic loss, whereas geo-hazards are by far the major cause of human loss.
2 IPCC, 2014 and Australian Bureau of Meteorology and CSIRO, 2011. 3 World Bank, 2012b

16
1.1.1 Tropical cyclones
Tropical Cyclones have traditionally been the most serious climate hazard for PICs in terms of total damage and loss (Figure 2). Vanuatu is the most at risk from cyclone events, and is expected to lose on average 36.8million dollars annually.
Figure 2. Expected Average Annual Losses due to Cyclones in Pacific Island Countries
Source: PCRAFI Country Risk Profiles (World Bank, 2015)
From 1981 to 2016, there have been 27 Category 5 and 32 Category 4 cyclones which have had significant impacts on PICs. Being struck by a Category 5 cyclone has been a 1 in 10 year event for Fiji, Tonga and Samoa and a 1 in 5 year event for the Solomon Islands and Vanuatu. Samoa has been struck by seven Category 4 or Category 5 cyclones with peak wind speeds of greater than 58 metres per second (m/s). Tropical Cyclone Evan, which struck Samoa in December, 2012, caused total damage and losses of approximately US$210 million (30% of annual GDP), and Tropical Cyclone Ian, which struck Tonga in January 2014, resulted in total damage and losses of approximately US$50 million (11% of annual GDP). In March 2015, Tropical Cyclone (TC) Pam struck Vanuatu, Tuvalu and Kiribati. In Vanuatu, the cyclone killed 11 people and resulted in an estimated US$450 million damage and losses, equivalent to 64 percent of the GDP. More Recently, TC Winston struck Fiji as an extremely destructive Category 5 cyclone in February 2016, resulting in the death of at least 42 people and damage and loss that may exceed that seen following TC Pam.
The historical record suggests that the dramatic increase in impacts associated with tropical cyclones in the past several decades globally is largely due to increased exposure and vulnerability, rather than an increase in intensity or frequency of cyclone hazards. There is no consensus on

17
changing frequencies or intensities of tropical cyclones on the global scale,4 although there is emerging evidence of such changes in the Atlantic which has a record of longer-time series for these low probability events. For the Pacific, cyclones the time series is not sufficient to identify changes in their frequency and intensity.5
Cyclone season in the Pacific is influenced by the El Niño events. This was evident during one of the most active seasons in 2015/16.i For the first time since satellite observation started, three tropical cyclones of Category 4 (Saffir-Simpson scale) were observed simultaneously across the north-east Pacific - Kilo, Ignacio and Jimena - in September 2015. All three were over open water and thus did not cause damage to PICs.ii
1.1.2 Floods and droughts
Flood risk (from rainfall not associated with cyclones) is very significant in the region yet it is not consistently recorded. However, ad-hoc information for particular events suggests massive losses from floods. For example, Fiji experienced devastating floods in 2004, 2009, 2012 (twice) and 2014. The 2009 event caused damage and loss of 135 million USD (SOPAC, 2009).6 More recently, flash flooding in the Solomon Islands in 2014 caused damage and loss estimated at US$108.9 million, equivalent to 9.2 percent of gross domestic product (GDP), and resulted in the death of 22 people and affecting approximately 52,000 people in total. The flooding caused damage to major infrastructure, fully destroying some 675 houses along with the food gardens that many people depend upon for their livelihood.
Droughts are increasingly affecting PICs. Only 52% of the populations in PICs currently have access to improved water supply.7 Water sources are vulnerable to the effects of El Niño events, which have the potential for significant water-related impacts for many communities across the region. Both FSM and RMI have declared a state of emergency due to the 2015/16 El Niño induced drought, which has resulted in increased distance to water sources for many communities across the region. Previous examples of significant drought in the region include the drought that occurred in Tuvalu in 2011, which led to severe rationing of fresh water supplies in September/October of that year.
1.1.3 Coastal hazards
Coastal erosion, storm surges and king tides are majors hazards affecting the coasts of the PICs. There are up to 30,000 islands located within the Pacific Ocean with a total coastline of over 50,000 km. Most of the population, urban centres and critical infrastructure are located on the coast and
4 See Weinkle et al., 2012 and Woodruff et al. 2013. 5 Crompton et al. (2011), for example, argue that one would need to have 260 years of hurricane data to identify any trends in hurricane frequency associated with anthropomorphic climate change in the Atlantic Ocean. Since South Pacific cyclones are even less frequent than Atlantic ones, the time series necessary to identify historical trends there would be even longer. Complete Pacific cyclone data is only available from 1981, so clearly no trend can be deduced from observing this data. There is a somewhat longer time series available for the Atlantic, but even there the trends are uncertain. 6 For Fiji, in EMDAT for example, there are zero damages recorded for the 2004 flood, 43 million USD for the 2009, 89 million USD for 2012 – but only one event is registered, and there is no record of the flood event in 2014. 7 WHO & UNICEF Joint Monitoring Programme, 2013

18
therefore exposed to coastal hazards. However as for floods only ad-hoc information is available on the economic impact of particular events. For example in November 1979, December 2008 and March 2014 large extratropical storms caused large swell and flooding throughout Majuro, RMI. The cost of property damaged during the 1979 event was estimated at USD26M and 110 homes were damaged during the March 2014 event (Hess et al., 2015). According to a recent study 57% of the assessed built infrastructure for the 12 Pacific island countries is located within 500 metres of their coastlines, amounting to a total replacement value of US$21.9 billion (Kumar and Taylor, 2015).
1.1.4 Tsunami and Earthquakes
Many PICs are situated within the Pacific “ring of fire” which aligns with the boundaries of the tectonic plates, making them extremely vulnerable to earthquakes and tsunamis. These tectonic plate boundaries are extremely active seismic zones, capable of generating large earthquakes and in some cases, major tsunamis that can travel great distances. Of all hazards that impact on PICs, tsunamis tend to result in the highest number of fatalities.
The potential impacts of earthquakes and tsunamis various significantly across PICs (Figure 3). Vanuatu is the most at risk to earthquakes and tsunamis of all PICs, and was affected by devastating earthquakes and tsunamis several times in the last few decades. For example, in 1999, a magnitude 7.5 earthquake caused extensive damage to Pentecost Island, leaving more than 10 dead, over 100 injured and millions of USD in losses. The earthquake generated a large tsunami including a six-meter wave. In 2002, a magnitude 7.3 earthquake struck near the national capital of Port Vila, causing millions of USD in damage to buildings and infrastructure. More recently, in 2009 a devastating tsunami struck Samoa following an 8.1 magnitude earthquake, resulting in waves of 14 meters which destroyed over 20 villages and led to 189 fatalities. In 2013, a tsunami struck the Solomon Islands, following an 8.0 magnitude earthquake, destroying homes and killing 9 people.

19
Figure 3. Expected Average Annual Losses due to Earthquakes and Tsunamis in Pacific Island Countries
Source: PCRAFI Country Risk Profiles (World Bank, 2015)
1.2 Climate Change and its Effect on PICs
1.2.1: Historical changes and their effects
For PICs, climate change manifests itself as changes in air and ocean temperatures, ocean chemistry, rainfall, wind strength and direction, sea-levels, wave actions, storm surges along with extremes such as tropical cyclones, drought and storm swell events. The effects of these changes depend on the biophysical nature of the island and its social, economic and political setting8 .
Sea level rise, storm surge and swells particularly impact infrastructure. Rates of sea-level rise in the tropical Pacific, between 1993 and 2009 were about four times the global average (approximately 12 mm per year).9 Swell events, particularly those that occur during strong El Niño events, lead to waves surging across low-lying islands causing severe damage to housing and infrastructure as well as natural
8 Nurse et al., 2014 9 Ibid. Global average over 1993-2011 are about 3.3mm yr-1. . Rates of sea-level rise are however not uniform across the globe and large regional differences have been detected including in the tropical Pacific, where reported rates have been approximately 12 mm yr -1 between 1993 and 2009; these are generally thought to describe transient rates associated with natural cyclic climate phenomena such as ENSO. Global sea level is likely to increase in the range of 0.17m (or 170mm) to 0.38m (or 38mm) by 2050 (IPCC fifth Assessment report, WG1, SPM).

20
resources, and affect thousands of people across the region. In many islands, changing patterns of human settlement affect the shoreline processes and cause shoreline erosion. Cyclones can cause shoreline erosion and damage, but depending on the location can also nourish and replenish a coast10. Human activity such as sand mining, pollution and settlement in the near-shore are currently major factors which have to be addressed to reduce the risk from climate change to shoreline, infrastructure and ecosystems.
Decreased rainfall threatens freshwater lenses, especially in islands with relatively low mean rainfall such as Tonga, Cook Islands and Niue, a 25% decrease in the replenishment of groundwater reduces the thickness of the freshwater lens by about 50%.iii Salt water intrusion from high sea levels/storm surges can take months or years to recover as freshwater lenses require recharge from significant rainfalls. Recovery from such shocks during the last El Niño in 1997 in the Cook Islands for example, took 3 years.iv
1.2.1 Projected changes in temperature and rainfall
Projecting climate change for small islands is challenging. Firstly, the size of the islands are much smaller than the grid squares of the global circulation models (GCM) that underpin the climate projections (which are between 200 and 600 km2, depending on the model), resulting in inadequate resolution over the land areas of virtually all small islands. Secondly, there are limited regional socio-economic scenarios available at scales relevant to the small islands. Methodology has been developed to overcome these challenges for the Pacific at the regional level, and allows the determination of general trends rather than specific outcomes at the country level. Accordingly, although this paper presents projections for individual PICs, these results should be viewed with caution and as a general guide for projected changes in climate.
By 2050 mean temperatures in the Pacific Islands are expected to increase by 0.8 to 1.4oC relative to a baseline of 1980. The latest IPCC projections are between 1.5 oC and 3.7oC by 2100 with much variation in different seasons11.
Mean annual precipitation by 2050 is likely to increase slightly in most PICs, with the exception of Kiribati, where it is likely to increase by 20-25% compared to the historical rainfall data (1948 to 2008) . However, there is considerable difference amongst the different climate models making it uncertain as to the extent of change that might occur in the populated areas of Tarawa. There is likely to be significant variation in the monthly precipitation – that is some months are likely to be dryer and some wetter – with the annual precipitation remaining about the same (see Annex 1).
10 Etienne and Terry (2012) found that in Fiji, a category 4 cyclone nourished shorelines with fresh coralline sediments despite localized storm damage. 11 Nurse et al, (2014).

21
1.2.2 Projections for tropical cyclones
There are likely to be more intense tropical cyclones and associated intense rainfall in the Pacific12. Modelling results indicate that it is unlikely that Cyclone Pam and Winston will remain unique, and more Pam-like storms of similar magnitude affecting the Pacific would be expected in the coming decades. Cyclones have a big impact on coastlines through storm surges that can be a long way from the main cyclone area. In March 2015, tidal surges associated with Cyclone Pam (estimated to be 3–5 m), swept across the low-lying islands of Tuvalu and caused more than US$ 10 million in damage, equivalent to 27% of the GDP. Impact of cyclones are likely to be exacerbated by increasing flooding as drainage will be hampered by sea-level rise, and the ongoing coastal erosion.
As the Pacific Ocean warms, the range of cyclones could move to the north and south of the current “typhoon/hurricane belt” and be more damaging. El Niño events are associated with equator-ward shift in cyclone tracks. Thus, if El Niño like events are to become more frequent or more intense – as suggested by some climate models - the long-term storm trajectory trends may be going both ways leading to a larger spread of cyclones outside of the historical cyclone belt (both closer to the equator, and pole-ward outside the current zone). This trend of changing trajectories is likely to end up being the most important shift for cyclones associated with climate change in the foreseeable future.
Experience shows that by far most of the mortality, morbidity and damage from cyclones is experienced in regions that are unaccustomed to them and therefore unprepared. However, most of the PICs are within the belt, but countries like Tuvalu that are close to the equator may experience more serious damage as they did in TC Pam and the damages can be severe in such low-lying atoll countries.
1.2.3 Projections for floods and droughts
Floods and seasonal droughts are likely to continue to increase. The intensity of rainfall is likely to increase, along with the possibility of urban floods and the associated damage to people and assets. In low-lying islands and coastal areas, these effects would be compounded by effects of storm surges which would affect infrastructure and freshwater lenses. The increased temperature and changes in the rainfall patterns also increase the likelihood of seasonal droughts. Given that much of the agriculture is rain fed and there is very little water storage, this would also in turn affect agriculture and water supply.
1.2.4 Projection for sea level rise and ocean acidification
Sea level rise for the Pacific is likely to be about higher than the global average, which is in the range of 0.17 m to 0.38 m by 2050, and influenced by El Niño–Southern Oscillation (ENSO) like events13. However, some recent global sea level rise estimates are considerably more alarming as more information on glacial melting and other feedback loops has been incorporated into climate models.
12 IPCC 2014, Fifth Assessment Report, Work Group I, Technical Summary 13Ibid.

22
Sea level rise poses obvious difficulties for the atoll nations, but will also have an impact on low-lying areas elsewhere. Shorelines are particular vulnerable, as sea level rise will lead to continual increases in the damages caused by storm and wave surges and earthquake induced tsunamis. Wave overtopping and wash over events are likely to become more frequent with sea level rise and impact freshwater lenses dramatically. For example, on Pukapuka Atoll, Cook Islands storm surge over-wash in 2005 caused the fresh water lenses to become immediately brackish, taking around eleven months to recover. In very low-lying central areas of Fongafale Island, Tuvalu, during extreme high ‘king’ tides, large areas of the inner part of the island become inundated with brackish waters.
While some recent studies have observed increases in total land areas on some Pacific Islands over the past decades14, they have generally occurred on mobile reef-top islands. Mobility of the shoreline is a natural process, and coasts have always been evolving, but constructions on the shoreline combined with sand beach mining and other disturbance in the sediment transport might significantly affect the normal process. Furthermore, the land area is not the only indicator to be considered. Other recent studies have pointed some modification of the morphology of the islands, with especially some reduction in the overall elevation of the islands, which might prove to be highly problematic for both fresh water resources and protection to coastal flooding.
These impacts will be compounded by ocean acidification and the consequent adverse effect on coral reefs. Coral reefs and mangrove forests serve as wave barriers and prevent the full force of storm surges from hitting coastal regions. Recent study shows that coral reefs decrease 97 percent of the storm-wave power and reduce wave height by 84 percent15. Their potential loss due to increased acidification and inability to grow can increase the effect of storm surge, wave actions and lead to increased erosion of coastal areas.
The combination of sea level rise and deterioration in coral reef and mangrove ecosystems and the increase concentration of population economic activity will make coastal areas more vulnerable to storms, regardless of whether storms will be more frequent and/or more intense. The increased vulnerability of coastal zones has been due to development decisions and is more recently being compounded by climate change.
1.3 Impact on Poverty and Gender
1.3.1 Poverty
Although there are pockets of extreme poverty throughout the Pacific Island countries, the majority of the poor can be found in just three countries, with around 90% of people in poverty in Kiribati, Vanuatu and FSM. There is no country where extreme poverty in urban areas is greater than 3
14 Webb and Kench, 2010 15 Ferrario et al., 2014

23
percent. However, it is much higher in the outer islands of some countries, particularly Kiribati. Most of the poor in the Pacific live on outer islands, and here poverty is structural and persistent.
The typical poor household in the Pacific lives in a small community on a remote outer-island far from the nation’s capital and any other economic centres. They rely on garden-farming and fishing for their livelihoods, but many have poor soils where few crops grow. They lack basics like electricity, water supply and decent roads. Education and health facilities exist but are hard to get to, charge for service and are poor quality, so they are not used. The household is hit frequently by natural disasters like droughts, cyclones and earthquakes regularly and each time needs to appeal to extended family or wait for government assistance in order to go on with their life. Poorer populations tend to live on low value land, often close to flood prone waterways and in higher-risk coastal areas, making them more likely to be affected by adverse natural events.
While disasters impact whole societies, when they strike, the poor and vulnerable (including women, children and the elderly) are hit the hardest, exacerbating poverty. Poorer people in PICs may be disproportionately affected by disasters and climate for several reasons, for example: (i) the poor typically have inadequate financial means to deal with disaster events; (ii) poorer people have less access to insurance, cash reserves and alternative income sources that provide the mechanisms to recover quickly; (iii) in the face of more ‘immediate’ challenges, for example the threat of hunger, access to water or livelihood opportunities, poor people may be inclined to underestimate or ignore the risks incurred by living in hazard prone areas; (Iv) people who are at risk of falling into poverty and hardship –people just above the poverty line and vulnerable populations (i.e., children, women, elderly) – can be pushed into transient poverty when a disaster hits as their livelihoods become destroyed; (v) as poorer groups become affected by disasters and climate shocks repeatedly (for instance by low-intensity, high-probability shocks such as frequent storms, floods, or droughts), they have less chances of re-building their livelihoods and investing in human capital, thus becoming trapped in a cycle that sinks them further down into poverty. Insecurity and risk are closely associated with poverty in PICs, and people cite the impact of natural disasters as a contributing and frequently occurring trigger that pushes households into, or pushes them deeper, into poverty. In Fiji, a national level analysis of the relationship between poverty and disasters found that the level of poverty negatively affects the impacts of the disaster (SOPAC, 2009).
Climate and disaster risks strongly affect people’s well-being in terms of health, environmental sustainability, gender equality, livelihoods and access to education. The poorest segments of the population in PICs are more likely to rely on subsistence farming, which makes them vulnerable to the impacts of disasters and climate change on crops, as was seen in Vanuatu following Tropical Cyclone Pam, where low-income individuals and those depending on subsistence livelihoods were disproportionally impacted due to reduced incomes and food sources. Increased hardship due to the impact of disasters on schools also has the potential to disproportionally impact poorer communities, with communities in rural areas already often having very restricted access to good quality education, and this can be compounded if a disaster event destroys school infrastructure, of if school buildings are used for emergency accommodation for an extended period following a disaster.

24
Disasters and climate change also threaten economic growth and poverty reduction in PICs, causing losses in lives and infrastructure, and these losses disproportionately affect the poor and most vulnerable. In addition, poverty can actually increase disaster risks due to potential linkages between poverty and the over-utilization of resources. For example cutting trees for firewood can increase erosion, impact the natural drainage basin, and thus increase the risk of flooding.
Given the extreme vulnerability of PICs to natural disasters, economic shocks, and climate change, adaptation measures to reduce exposure and vulnerability to risk lie at the heart of poverty reduction and shared prosperity. Reducing the exposure to risk will be crucial for improving living conditions in PICs, which is an important, non-monetary dimension of poverty reduction and shared prosperity. Approaches to reducing exposure are explored in Section 2 of this paper.
1.3.2 Gender
Women are disproportionately vulnerable to the impacts of natural disasters and climate change16. Globally, existing socio-economic inequalities, such as restricted education, decision-making and economic opportunities, increase women’s vulnerability to natural hazards,17 and there is a direct relationship between women’s risk of being killed during disasters and their socio-economic status.18
Ingrained gender inequality and discrimination against women and girls can place them at higher risk to the effects of climate change and hazard events. Studies have shown that disaster fatality rates are much higher for women than for men, primarily due to gendered differences in capacity to cope with such events and insufficient access to information and early warnings19,20. For example, in 2007, when Bangladesh was hit by Tropical Cyclone Cidr, five times more women were killed than men. When Cyclone Nargis struck Myanmar in 2008, 61% of casualties were female.
Children are also particularly vulnerable to disasters and climate change, with more than 50% of all those affected by disasters worldwide being children21. Girl infants are at a particular risk. Recent research conducted by economists from the University of San Francisco and UC Berkeley on how typhoons in the past 25 years affected the Philippines shows that for up to 2 years after the disaster, post-typhoon mortality among baby girls is approximately 15 times higher than post-typhoon mortality among the general population, likely due to the indirect poverty-worsening effects of the
16 World Bank, 2012a, World Development Report- Gender Equality and Development 17 World Bank, 2013a. Improving Women’s Odds in Disasters, available at: 18 Neumayer and Pluemper, 2006. The Gendered Nature of Natural Disasters: The Impact of Catastrophic Events on the Gender Gap in Life Expectancy, 1981–2002, Annals of the Association of American Geographers, 97(3), 2007, pp. 551–566. Link. For further data on gendered impacts of disasters, see International Union for Conservation of Nature: http://cmsdata.iucn.org/downloads/disaster_and_gender_statistics.pdf. For further resources on gender and DRM, see Gender and Disaster Network: http://www.gdnonline.org/wot_papers.php. 19 Peterson, 2007. 20 Ikeda, 1995. 21 UNISDR, 2010: http://www.unisdr.org/files/20108_mediabook.pdf.
25
storm.22 Their chance of dying is even higher if they have siblings: it doubles if they have an older sister, and quadruples if they have an older brother. Contributing factors include reduction of health-related expenditure, including nutrition and medical visits, with infant inadvertently bearing the brunt of the economic devastation as families cut spending.23 Baby boys show no increase in mortality rate.
The global trend of increased vulnerability for women and children during disaster and climate events is reflected in the Pacific region. In PICs, gendered asymmetry in vulnerability to disaster risk is primarily due to socio-economic, cultural, educational/informational and political power imbalances across all levels, as well as geographical and other factors. Socio-cultural norms may cause restrictions in movement to escape disasters (particularly water-related hazards), for example, where women have the primary role for caring for children and the elderly. In addition, women often have lower levels of access to economic resources, may be excluded from decision making in regards to disaster preparedness, and may have lower levels of literacy or access to information on natural hazards and climate risks, making it more difficult read and act upon disaster warnings.24
In terms of economic activity and employment opportunities, women in PICs have lower employment rates and are more likely to be unemployed, making them particularly vulnerable to external impacts such as disasters or climate change. The unemployment rate from Census data is over 70 percent for women in RMI, compared to 49 percent for men. In Kiribati, Vanuatu and FSM the difference is more marginal, while in Tuvalu women are slightly less likely to be unemployed. Less available income means that in case of a disaster, they might lack financial resources to restore their livelihoods and that of their families. Women are also more likely to report they are not active in the labor market because of home duties or caring responsibilities. These factors impact on the ability of women and female headed households to ensure they have the financial means required to recover from disaster events and adapt to climate change.
Women often live and work closely with the natural resources and geographical features that are most effected by disasters and shocks. For example, within the Pacific region, women’s productive roles are often linked to natural resources, which mean that the physical impacts of rising sea levels, flooding and increased salt-water intrusion have the potential to jeopardize sustainable livelihood strategies, food security and family well-being. This was seen in Vanuatu following Cyclone Pam, the impact of which on subsistence farming resulted in decreases to women’s resources to generate income and provide food for their families.25
22 Antilla Hughes &. Hsiang, 2013 23 Ibid: ‘The study found that in an average year, the income of Filipino households in typhoon-hit areas is depressed 6.6 percent due to typhoons that occurred the year before, leading to a 7.1 percent reduction in average household spending. However, when particularly strong storms strike, incomes may fall more than 15 percent the following year – compounding loss from damage to a family’s home and belongings.’ 24 Aguilar, L. et al, 2009 25Government of Vanuatu, ‘ Vanuatu Post Disaster Needs Assessment – Tropical Cyclone Pam’, March 2015.

26
In addition to the potential impacts on life and livelihoods, disasters and climate change have the potential to increase the exposure of women and children in PICs to sexual gender-based violence (SGBV). Women in PICs are already subject to high levels of sexual and gender-based violence, but violence has the potential to escalate following disasters and climate events. For example, after two tropical cyclones in Vanuatu in 2011, there was an increase of 300% in new domestic violence cases that were reported.26
Effective measures to adapt to climate and hazard risks in the future should recognize that roles and responsibilities are not uniform across PICs, and rather are influenced by culture and community, in addition to gender. Consideration of gendered divisions of labor and traditional knowledge can strengthen disaster and climate risk management in PICs. While PICs are not homogeneous, gender often dictates where women and men work and separates traditional knowledge into women’s and men’s knowledge. Traditional or local knowledge is therefore important for understanding gender roles and responsibilities in order to best manage climate and hazard risks.
While women have a higher vulnerability to natural hazards, they also play an important role in community level efforts to minimize the risks, including in community early warning and preparedness. For example, in Samoa, women tend to have higher secondary and tertiary education levels than do men (although this is not the case for all PICs) and as such, offer a well-educated human resource that can be utilized for risk mitigation initiatives, and mobilized as part of community awareness campaigns and disaster contingency planning. Separate consultations should be undertaken with women in regards to early warning and preparedness initiatives. For example, women’s input should be sought in relation to evacuation shelter design, including how to make them more accessible and safe (in turn, reducing the threat of post-disaster SGBV), and also in regards to how early warning communication can be improved to ensure warning messages reach entire communities.
Opportunities to emphasise the agency, rather than vulnerability of women during the coming decades will be particularly forthcoming during recovery activities following disaster events. Practical actions to support gender equality can be readily integrated into recovery initiatives. Examples include the potential to issue deeds for newly constructed houses in both the woman’s and man’s names (subject to land ownership laws), building non-traditional skills through income-generation projects, utilising women for the distribution of humanitarian relief, and providing financing for women’s groups to monitor disaster recovery projects.27
26 UNWomen, 2014 27 Arnold, Margaret ,2012

27
2. Managing climate and Disaster Risks This section describes some general principles on how to manage and reduce climate and disaster risks and strengthen resilience of Pacific islands Countries. The standard framework distinguishes between hazard, exposure, and vulnerability. In the short term, we have little control on the hazards themselves, and in the long term our main impact on hazard patterns is through our effect on the climate. But, policies can reduce exposure and/or vulnerability, and can also aim to reduce either damages or losses.
Climate change, poorly planned development, poverty and environmental degradation are all drivers that can increase the magnitude of this interaction, leading to larger disasters. The rising concentration of population and assets in naturally at-risk areas remains the most important driver of growing disaster risk28. This includes rapidly expanded settlements in low-lying coastal areas and floodplains, inadequate spatial planning and regulation enforcement, and lack of compliance or weak building standards. In addition, degradation of ecosystem (such as mangrove, coral reefs, sea grasses) lowers the capacity to buffer for the effects of climate extremes and provide for basic needs. Thus development choices, poverty, climate change are inter-connected and affect the risk and exposure of the people, economy and ecosystems. Weather-related hazards, exacerbated by climate change, can interact with local drivers of exposure (such as location of settlements in high-risk areas) and vulnerability (such as poverty or environmental degradation) to increase disaster risk.
Figure 4. Disaster Risk Assessment Framework - Source: Adapted from IPCC, 2012; World Bank 2013)
As a result, exposure, vulnerability and hazards have to be managed collectively to minimize disaster risk (Figure 4). Addressing climate and disaster risks without addressing the development deficit could be an ineffective response. It also requires global efforts to reduce greenhouse gas emissions so that magnitude of climate-related hazards do not increase.
28 IPCC, 2012; World Bank, 2013b

28
2.1 Reducing Exposure
The most obvious of the menu of policies that reduce exposure is risk-based land-use planning, which can account for the risk profile of areas and the appropriate zoning laws and planning strategies that should accompany that risk profile. Environmental assessments of projected development does not always include an assessment of current and future risk profiles, nor an assessment of the resilience of the projected development to all identifiable and quantifiable risks. All too often, new settlements, especially within urban centers, are located in areas with high exposure to flood risks in particular.
Integrated coastal and watershed management plans are proving to be effective approaches for risk-based planning. Tools such as Simplecoast are participatory approaches being used in the Indian Ocean and West Atlantic islands for effective risk-based planning. Urban planners are increasingly using risk-based approaches to identify areas of high exposure but also factors that can increase vulnerability of the populations to flood risk, such as storm drains being blocked with solid waste, debris, branches, silt... Risk-based planning is also being used to ensure settlements and key-assets are not put into high exposure areas (e.g. in Samoa and Sao Tome) and the participatory approaches are providing means of getting consensus building to take action, such a relocation of a coastal roads.
Emphasizing irreversible risks in planning decisions irrespective of exposure can also be used. Using methods like ‘rule-of-thumb’ guidelines and emphasising irreversible risks to ‘life and limb’ can be used as a major aim for risk reduction in public policy. In practice, for example, this may mean a policy that reduces earthquake vulnerability of public buildings by some fixed amount (e.g., 50%) irrespective of the assumed exposure to hazards in each region or locality. Similar approaches can be used for hazards impacted by climate change, for which there is uncertainty on future probability distributions (e.g. floods, droughts, or cyclones).
Efficient and timely warning systems and impact forecasting is clearly the most efficient policy intervention to reduce mortality exposure. The major challenges is to develop an effective early warning system with last km connectivity and securing an effective response to the warnings that are supplied. The magnitude of benefits, in terms of life saved per dollar spent, are very large. An effective early-warning system for cyclones has been widely credited with reducing the likely death toll from Cyclone Pam in Vanuatu, which was one of the strongest cyclones to ever hit the South Pacific, and yet the mortality rate was relatively low.
2.2 Reducing vulnerability
Planners typically manage the vulnerability to extreme events by setting design standards capable of withstanding 1 in 50 or 100 year events – i.e. events with a probability of occurring in any year of either 2% or 1% - without suffering significant damage. The standards are set to balance the higher costs of building assets that are capable of withstanding more intense but less frequent storms against the potential benefits of lower damages. Residual risks can be covered by asset insurance mechanisms. If this trade-off is properly managed, the expected losses caused by the very infrequent
29
events which do exceed the design standard will be quite small relative to the cost of building and maintaining the assets, especially if the damage is reduced by more resilient designs. Climate change will however alter this risk assessment.
An assessment of whether current standards offer an appropriate level of resilience in the context of current risks is important. Cyclones generally cause damage in PICs that is much smaller in absolute terms than in developed countries, but represent more than 5% of the GDP (see section 1.1.1) – this is rarely the case for richer countries. Two major aspects contribute to the differences. First, richer countries tend to invest in higher levels of resilience than poorer countries because benefits of preventing losses outweighs the costs as the assets and incomes at risk grow. Second, even if increasing resilience in the PICs was economically beneficial, they may not be investing as much in disaster resilience as might be warranted, given their income levels and the distribution of weather risks that they face. It seems likely that current design standards for buildings and infrastructure provide protection against storms with a return period of up to 10 year, but not against worse storms with a longer return period.
Even without climate change, it is not straightforward to assess the trade-off between the costs and benefits of investing in greater protection against storm damage caused by tropical cyclones in the Pacific. By definition, extreme events are outliers. Time series of 200+ years may be required to obtain reliable estimates of low probability events, whereas the data available covers less than 50 years. It is possible to combine statistical modelling with the experience of other regions to obtain an indication of the standards which may be reasonable, as was done with the PCRAFI assessment. These standards should be forward looking by taking account of the expected increase in the value of social and economic assets at risk as a consequence of economic growth over the next 20 or 30 years. Suppose that the design standards adopted would protect buildings and infrastructure against a 1 in 50 year storm. This means that the design standards are intended to ensure that there would less than a 2% chance of significant storm damage in any year. Two points or lines of enquiry would follow from this assessment of design standards.
• First, all new projects should be required to comply with more protective design standards with more or less immediate effect. The same principle should apply to the reconstruction and/or replacement of existing assets if they are affected by storms or other hazards.
• Second, consideration should be given to upgrading or retrofitting existing assets so that they are brought into compliance with the new standards. The net benefits of retrofitting buildings or infrastructure depend upon their residual life, since early replacement may be cheaper than a short term retrofit, and on the costs of modifying structures. An approach that is often adopted is to require that assets should be upgraded or replaced within a period of 10 or 15 years. This provides flexibility in implementing a strategy to upgrade and/or replace long-lived assets.
Vulnerability is closely aligned with poverty and inequality. Reducing poverty, increasing the access of the poor to resources (economic, political and social) and reducing unequal distributions of assets and incomes, will all contribute to enhance resilience and reduce vulnerability to disasters. As such, sustainable development goals, especially if they ‘mainstream’ disaster risk reduction, will contribute
30
to reduce the impact of disasters under any future scenario. This will be especially important in reducing the indirect losses associated with disasters.
Vulnerability can be further reduced when disaster strikes through ‘build back better’ policies that enhance resilience and can potentially reduce both exposure and vulnerability. Disasters should thus be seen also as an opportunity to reconstruct infrastructure, and even institutions and social arrangements in ways that correct the vulnerabilities that were exposed by the event, and guarantees that a future hazard event will have less of an adverse impact on the exposed region. Often, these are missed opportunities, to implement equitable ‘build back better’ policies that can provide immense benefits to build long term resilience in exposed communities.
2.3 Adaptation and Development Deficit
Adaptation and development deficit have to be addressed before addressing future risks. Collectively reducing exposure, hazard and vulnerability as part of climate and disaster resilient development is proving to be good practice. However, it means that the current development needs have to be met. It is generally also true that a country with adequate resources and institutions is able to withstand the shocks of disasters better than the poorer countries with weak institutions. It is also clear that many countries, especially PICs, cannot manage the effects of current climate risks. Thus there is perceived “adaptation gap”. Given the dynamic and interlinked nature of hazard, exposure and vulnerability, a long-term programmatic approach across multiple sectors is needed to address such gaps, ensure corrective action and financial and human resources for sustainable and resilient outcomes.
Achieving climate and disaster resilient development requires international community and national governments to promote approaches that progressively link climate and disaster resilience to broader development paths. There also has to be recognition that despite the best adaptation efforts, a residual risk of disasters must also be managed.
3. Adaptation to Climate Change and Disaster Risk for Key Sectors
3.1 Estimating Costs of Adaptation
Assessing the future cost of climate-change impacts in the Pacific Region is challenging for at least three reasons. First, there are deep uncertainties on the speed and intensity of climate change, especially at local scales. There are large differences between the projections of different climate models that do not seem to be diminishing with time. And given the small size of the PICs and the extensive ocean dominated areas where they are located, downscaling changes in climate and natural hazards at the country level gives an even wider range of potential changes. In addition, even if models were perfectly accurate, uncertainty would not disappear because future levels of greenhouse gas emissions, which by nature cannot be forecasted, largely determine future climate change. Second, climate change impacts will depend on the socio-economic choices made by countries for the next

31
decades. It will be much costlier to adapt to climate change in a society which heavily depends on agriculture production, with high poverty rates, inequalities, and poorly-managed infrastructure than in an inclusive society with safety nets and resilient infrastructure. Finally, the costs and benefits of adaptation are determined by the framework that is used to assess them and the objectives that are set. For instance, the best adaptation strategy will be different in a cost-benefit analysis where the objective is economic efficiency than if the objective is a defined acceptable level of risk. These vary with context, country and stakeholders. In addition, estimates of the cost and benefit of adaptation are always incomplete as it is very difficult to model dynamic feedback between sectors, to model distributional impacts and to quantify social impacts.
Despite all these challenges, the Pacific Possible intends to give estimates of adaptation costs in the Pacific. Results use different methods for different sectors, and are based on previous studies29, on models designed for the EACC30, on the PCRAFI results modified to consider climate change impacts, and on the DIVA model. Importantly, this report proposes decision frameworks to account for the deep uncertainties on future climate change. Five methods can be considered:
(i) Selecting ‘‘no-regret’’ strategies that yield benefits even in absence of climate change. Example of no-regret strategies include reducing leaks in water distribution systems, increasing the standards of new buildings, or increasing the frequency of road maintenance.
(ii) Favouring reversible and flexible options, like insurance, early-warning systems or easy-to-retrofit coastal defences.
(iii) Buying ‘‘safety margins’’ in new investments, with for instance restrictive land-use planning, higher flood defences or bigger drainage capacity for urban infrastructure and roads.
(iv) Promoting soft adaptation strategies, including the ‘‘institutionalization’’ of long-term planning exercises and financial instruments.
(v) Reducing decision time horizons. In areas that could be flood-prone in the future, building cheaper houses with shorter lifetime can make sense.
The best adaptation strategies depend in the local context and are likely to be a mix of these options. The sections below only provide leads to orient decision-makers towards what can be done. Interactions between sectors call for integrated design and assessment of adaptation across multiple sectors, which are often developed by distinct communities.
3.2 Sea Level Rise and Coastal Protection
This section examines the implication of climate change on coastal zones focusing particularly on sea level rise, coastal erosion and inundation, as well as the cost of adaptation through approaches such as beach nourishment, sea and river dike construction as well as port upgrade.
29 The Economics of Climate Change in the Pacific, ADB, 2013 30 World Bank, 2010b

32
Methodology
The costs of adaptation are mainly derived from the DIVA model31 , which provided an estimate of the average costs (capital and maintenance) per year for 3 decades (2020-29, 2930-39 & 2040-49). The model incorporates a simple cost-benefit test so that investment in coastal protection only occurs when either the density of population or the level of economic activity protected is high enough to justify the costs incurred. The analysis considers two main impact types---(1) coastal erosion; and (2) sea and river flooding, and submergence ---and three main adaptation approaches--- (1) beach nourishment (particularly in areas with high tourism revenue); (2) sea and river32 dike construction; and (3) port upgrade due to climate change are considered (see Annex 2 for more details). Four different scenarios of global sea-level rise (SLR) were examined: (a) no SLR – the reference case to establish the baseline costs of coastal protection without climate change, (b) low SLR – a rise in average sea level of 40 cm above 1990 by 2100, (c) medium SLR – a rise of 87 cm, and (d) high SLR – a rise of 126 cm. Note that impacts due to salinization and wetland loss are not considered. Some modifications have been made to the original model and database, in order to better reflect the particular circumstances of the Pacific Island Countries (PICs). For this present study it has been assumed that only the principal population centres will be protected but not the outer islands and thinly populated coastal segments.
Results
There are large variations in costs across countries and SLR scenarios but overall the costs of protecting the pacific islands would be very high relative to the country’s GDP. Table 5 shows the adaptation costs and residual damages over time by country for the medium SLR scenario (which does not include Tuvalu). Averaged over time and normalized by population in 2012 the coastal protection costs in the Medium SLR scenario range from about $50 per person per year for Samoa to $360 for the Solomon Islands and $620 for the Marshall Islands. Over 30 years the total cost of adaptation would be $1,500 per person for Samoa, but $11,000 for the Solomon Islands and $18,500 for the Marshall Islands. For Kiribati, the Marshall Islands, and Vanuatu the cumulative cost of adaptation per person would exceed 5 times the GDP per capita at PPP (Purchasing Power Parity).
31 Hinkel et al., 2014 32 This concerns the incremental costs of upgrading river dikes in coastal lowlands where sea-level rise will raise extreme water levels. Additional upgrade may be required if extreme river flows are increased, but this is not investigated here.

33
Table 5. Range of adaptation costs for coastal protection by country (best case-worst case scenario) (million USD per year at 2012 international prices)
Country 2020s 2040s 2040s as % of projected GDP (includes residual damages)
Fiji 71-230 86-329 1-3% FSM 6-20 8-28 1-3% Kiribati 13-42 17-54 4-11% RMI 13-42 16-58 4-13% Palau 2-9 3-11 1-2% Solomon Islands 81-280 97-347 3-11% Tonga 8-28 9-35 1-4% Vanuatu 36-130 42-161 2-8% Samoa 4-15 7-21 0-1%
Source: World Bank estimates
The main component of the costs of adaptation is expenditure on the construction and maintenance of sea walls – more than 75% of the total in most countries. The second component is beach nourishment as river dike costs are negligible in most pacific island countries. The main difference between these costs is that sea dikes must be built in advance of sea level rise and then maintained, whereas beach nourishment is a recurrent cost that can be adjusted as needs require. While the capital costs of sea dikes can be spread over time, the incidence of damage caused by permanent inundation and temporary flooding is likely to be much more uneven. In the absence of a long term strategy for the construction and maintenance of dikes the impact of sea level rise will be felt as intermittent but very large expenditures to deal with the aftermath of severe storm surges and exceptional tides.
The cost of coastal protection and residual damage exceed 5% of GDP in each decade for 4 countries – Marshall Islands, Kiribati, Solomon Islands and Vanuatu in the medium SLR rise scenario (Table 5). In addition, it may be assumed that the result would be the same or worse for Tuvalu. These figures far exceed the scale of adaptation costs relative to GDP reported in the EACC study by World Bank region – less than 0.8% of GDP for Sub Sahara Africa and less than 0.4% for the other regions.
The costs of adaptations vary significantly according to the SLR scenarios, with adaptations and residual damages estimated to be three times more costly in a high SLR scenario than in a low SLR one (see Annex 3 for more details).
Emerging policy message
There is little prospect that the high costs of building sea dikes could be financed by the countries themselves, so the international community will have to assess the trade-off between large initial expenditures on construction that is designed to protect coastal communities for many years into the future versus expenditures and emergency relief and recovery programs when disasters occur.

34
However, there is no consensus on how to respond to the potential impact of sea level rise. Some countries – e.g. the UK and France - have abandoned attempts to protect all of their coastlines from storm and wave damage. Though this is controversial, it is almost unavoidable in the face of steady and substantial land erosion.
A similar choice may have to be made by some of the Pacific Island countries which may need to set priorities in the geographical allocation of expenditures on coastal protection. For instance, coastal protection infrastructure could be prioritized in areas with high concentration of population (e.g: urban centres) and assets. In some situations, hard structural options can be combined with soft structural options (e.g: ecosystem based approaches, beach nourishment) in order to reduce the cost and mitigate the environmental and social impacts. Ensuring that future population growth is concentrated outside coastal zones and relocating the existing population may also be considered, although the implementation might be challenging due to the unavailability of land or land tenure issues. The development of any particular solution should be informed by a coastal hazard and vulnerability assessments, taking into account potential impacts of climate change. Uncertainties in the future climate change scenarios should not prevent the implementations of actions on coastal protections. Particular attentions should be provided as to provide enough flexibility in the design of these actions, in order to be able to adapt them when uncertainties on climate change scenarios and the way shorelines will respond.
Box 1: Coastal protection and Integrated Coastal Zone Management (ICZM)
There are three main types of adaptation response strategies that can be considered for reducing coastal risks, protection of human life and ecosystems – retreat, accommodate or protect. Options are also often grouped into three main categories: (i) Non-structural options which include development restrictions and relocation of people or assets away from high risk areas. However, these options are often difficult to implement in the pacific due to land unavailability or land tenure issues. Non-structural options also includes change in building codes such as elevation of floor levels, and reducing sand mining, (ii) Soft-structural (e.g. beach nourishment, ecosystem based approach such as mangroves plantation), and (iii) Hard-structural options (e.g. offshore structure, groynes, revetments and sea walls). In some cases, it may be appropriate to consider a combination of structural and non-structural options which can provide a balance between construction costs and the environmental and social impacts.
The selection of a particular solution should be informed by a coastal hazard and vulnerability assessment. Such assessment will allow to better understand the exposure to, and likely impact of, extreme events and ongoing climate change processes, enable targeted early warnings and assist in planning disaster response, prioritise capital works and inform design, and feed into building code and zoning requirements including floor levels and setbacks.
More broadly it is recommended that coastal protection become part of an Integrated Coastal Zone Management (ICZM) approach. It is “a comprehensive, multi-sectoral, integrated approach to the planning and sustainable development management of coastal areas”. This would allow to manage coast in an integrated way taking into account all aspects of development planning including the development of

35
Clearly, a wider range of adaptation options than considered in DIVA are available in practice and should be part of an integrated approach to coastal management. These include options which allow a planned retreat from the coast or which accommodate higher water levels by raising buildings above flood levels. These could lead to a reduced need for hard-infrastructure protection and may lead to successful adaptation at a lower cost than estimated here. Such measures are difficult to cost and require long-term strategies involving the integration of coastal planning and management. Few Pacific states have this capacity today. Strengthening institutional capacity for integrated coastal management is an essential element of responding to climate change.
3.3 Managing Water Resources and Flooding
The impacts of both flooding and drought may be exacerbated by future climate change and future increases in exposure due to increased population and poor land use planning. Many Pacific Islands have identified concerns about water supplies and their vulnerability to climate change as the primary environmental priority for many communities. In addition, there is a history of significant losses from floods within PICs, and there is the potential that these may increase with the onset of climate change. This section examines the implications of climate change for the management of water resources, focusing in particular on:
1. The problems of ensuring adequate resources for domestic and non-domestic water supply 2. Managing flooding caused by periods of intense rainfall.
Methodology
The potential impact of climate change on vulnerability to droughts and floods has been examined for several PICs based on the RCP4.5 climate scenarios. Statistics for historical rainfall data from records during the period 1948-2008 have been generated and then use as the baseline to investigate future rainfall changes. The model outputs from the RCP45 scenario have been used, and because of large inter-model spread in climate sensitivity and precipitation, the range of uncertainties (here, simulated precipitation) is considered wide enough to cover a range of plausible futures. A standard extreme value distribution known as the Gumbel distribution that has been used extensively to model extreme events such as floods and droughts has been created for the baseline and plausible futures. An example of this is presented in Annex 3.
For the drought analysis, a Gumbel distribution has been calculated for the Baseline period for low rainfall and the model outputs for each of the 19 RCP4.5 global climate models33 (resulting in a total of 20 Gumbel distributions). For each of these distributions, the 1 in 20 year, and 1 in 50 year low rainfall has been calculated. Given that there are 20 Gumbel distributions that have been developed
33 Model outputs for drought analysis include 19 low rainfall distributions – one for each of the 19 climate change scenarios included in RCP4.5 - plus one baseline minimum rainfall distribution, totaling 20 Gumbel distributions for the drought analysis

36
as part of this analysis, the results include 20 values of the 1 in 20 year drought, and 20 values for the 1 in 50 year drought for the year 2050. Low rainfall under low and medium plausible futures has been approximated for this analysis by respectively adopting the 10th and 50th percentile model outputs from the RCP4.5 climate scenarios. Drought results have been presented for the Baseline, compared to model outputs for extreme and medium climate change (Table 6).
For flooding, the analysis focuses on short term flooding, in which extreme amounts of rain in a period of 24 hours cause flooding within a relatively short distance of the original precipitation. The results should be taken as indicative of potential trends, as they are based on generic assumptions that should be refined with more specific information about actual conditions. Similar to the methodology used for droughts, the distributions of high 24 hour rainfall have been assumed to follow the Gumbel distribution, and the distributions have been estimated for the Baseline period for flooding and for the model outputs of the RCP4.5 climate change projections for 205034. High rainfall under high and medium climate change has been approximated for this analysis by respectively adopting the 90th and 50th percentile results from the 19 Gumbel distributions that have been developed35. Flooding results have been presented for the Baseline, compared to the outputs for high and medium climate plausible futures.
Results
Drought
Under a medium climate change scenario, the risks of more severe drought in 2050 are small in most countries. Fiji, RMI, Palau, FSM, Vanuatu and Solomon Islands may experience a small reduction in some of the 1 in 50 year and 1 in 20 year low rainfall values, but the changes should not require major investment in additional water storage.
The results show the risks are likely to be much more significant should more extreme climate change take place, especially for the Solomon Islands and Tuvalu and to a lesser extent Fiji, Palau and RMI. There is a small but significant chance that changes in climate may lead to extended periods of little or no rain, particularly in Solomon Islands and Tuvalu, necessitating investment in either water storage or alternative sources of water (such as desalination) as a supplement to normal rainfall. Table 2 shows the changes in low rainfall that could be expected in 2050 under medium and extreme climate change for various 1 in 20 year and 1 in 50 year droughts, compared to the Baseline.
34 Model outputs for flood analysis include 19 high rainfall distributions – one for each of the 19 climate change scenarios included in RCP4.5 - plus one baseline minimum rainfall distribution, totaling 20 Gumbel distributions for the flood analysis 35 The differences between the high and medium model output results reflect the uncertainty concerning future climate projections (i.e., 19 models are included in RCP4.5, and there is significant variation between these models, due to factors such as varying future emissions levels etc.) rather than weather variability (such as dryer years or wetter years).

37
Table 6. Changes in low rainfall by country for 2050 (mm of rain relative to baseline)
Country
Change in 1 in 50 year minimum rainfall Change in 1 in 20 year minimum rainfall 30
days 60
days 90
days 120 days
30 days
60 days
90 days
120 days
Model Outputs for Median Climate Change FJI 0 -5 -14 -6 -1 -6 -10 -5 FSM 0 -10 3 14 -2 -5 8 15 KIR 0 0 0 -17 0 0 -18 -5 MHL 0 -1 -7 -2 -1 -2 -4 0 PLW 0 -12 -6 2 -1 -10 3 8 SLB -4 -17 -26 6 -4 -15 -23 10 TON 0 0 0 0 0 0 -0 -4 TUV 1 0 19 30 4 4 20 31 VUT 0 0 -3 -6 0 -0 -3 -10 WSM 0 0 0 0 0 0 2 4 Model Outputs for Extreme Climate Change FJI -1 -22 -59 -67 -5 -36 -72 -84 FSM -2 -27 -39 -36 -7 -30 -31 -35 KIR 0 0 0 -17 0 0 -19 -50 MHL 0 -13 -75 -71 -5 -33 -74 -75 PLW 0 -39 -51 -45 -5 -30 -47 -46 SLB -65 -197 -332 -415 -65 -179 -299 -375 TON 0 0 0 0 0 0 -0 -5 TUV -28 -102 -155 -230 -32 -98 -150 -221 VUT 0 0 -5 -10 0 -3 -13 -25 WSM 0 0 0 0 0 0 -16 -27 Source: World Bank estimates Note: The differences between the medium and extreme model outputs reflect the uncertainty concerning future climate projections, rather than weather variability. Surface water flooding
The results suggest that most of the PICs will experience an increased probability and severity of flooding, due to increased rainfall during high rainfall events36. Table 7 shows results for the peak 1 in 20 year rainfall over a 24 hour period for the No Climate Change Baseline compared to the medium and extreme model outputs for the RCP4.5 Climate Change model scenarios.
36 Unfortunately, variations across the RCP4.5 climate scenarios point to increased flooding in a particular grid square for some scenarios and decreases for other scenarios, so that the level of uncertainty about the actual outcome is high.

38
Table 7. Changes in high 1 in 20 year rainfall over 24 hour period by country for 2050 (mm of rain relative to no climate change)
Country
Baseline (mm)
Model Outputs for Median Climate change
Model Outputs for Extreme Climate Change
Rainfall (mm) Increase from Baseline (mm) Rainfall (mm) Increase from
Baseline (mm)
FJI 245 292 47 348 103 FSM 63 78 15 123 60 KIR 145 224 79 365 220 MHL 72 85 13 125 53 PLW 197 245 48 284 87 SLB 84 102 18 119 35 TON 57 68 11 82 25 TUV 83 102 19 127 44 VUT 189 230 41 281 92 WSM 79 97 18 116 37
Source: World Bank estimates Note: The differences between the medium and extreme model outputs reflect the uncertainty concerning future climate projections, rather than weather variability.
If it is assumed that the current standard is adequate (although recent flooding in PICs such as that which occurred in Solomon Islands in April 2014 and Fiji in April 2016 suggests that it is not), then consideration can be given to how best adapt to cater for increased rainfall due to future climate change. For example:
• Option 1 could be to enhance the defences to cater for future climate change, while maintaining the current standard of protection (i.e., to cater for 1 in 20 year events under future climate change conditions).
• Option 2 could be to increase the level of protection from the current standard for existing flooding to a higher standard of protection for existing flooding (i.e., move from a catering for a 1 in 20 year event under today’s conditions, to a 1 in 50 year event under today’s conditions. This option would not take future impacts of climate change into account).
• Option 3 could be to increase the level of protection from the current standard for existing flooding and also to cater for future climate change in 2050 (i.e., moving from a 1 in 20 year event under current climate conditions, to a 1 in 50 year event under future climate change conditions.
Catering for an increased standard of protection and increased rainfall due to climate change is likely to be prohibitively costly and may not be reasonable for PICS. Option 1 and Option 2 above are likely to provide realistic solutions for flood management in the future. Given that there is still a high degree of uncertainty surrounding the degree to which climate change may impact on future rainfalls, it may be that adopting a higher standard of protection for current standards could act as a proxy for catering for increased rainfall under future climate change scenarios.

39
For example, if it is assumed that PICs currently offer a standard of flood protection to cater for 1 in 20 year rainfall events, adopting a standard of protection to cater for a 1 in 50 year rainfall event under current conditions, could act as an approximation for catering for 1 in 20 year rainfall events in 2050 which are expected to increase due to climate change in some countries. This has been observed in several additional island countries such as Palau and Solomon Islands. This is illustrated in the figures below in Table 8. To use the example of Fiji, the 1 in 20 year peak rainfall for current conditions could be expected to be 245mm based on historical data. The 1 in 50 year peak rainfall based on historical data is 17% more than this. Looking at the RCP4.5 model outputs for median climate change, the 1 in 20 year peak daily rainfall would be expected to be only 2% higher than the current level. However, the 1 in 20 year peak daily rainfall resulting under the high climate change scenario would be an increase of 19% on current levels. This illustrates that adopting an increased standard of protection for flooding (i.e., for Fiji, moving from a 1 in 20 year standard to a 1 in 50 year standard) could serve to cater for increased rainfall even under the more extreme climate change scenarios, while maintaining the current minimum standard of protection over time. It would still be necessary to monitor the impacts of climate change, but this strategy would provide time to identify trends and respond appropriately in the future if needed once a more accurate understanding is obtained of the impacts of climate change on flooding in PICs.
Table 8. Comparison of baseline peak rainfall with peak rainfall in 2050 (by country and return period)
Country
Baseline Model Outputs for Median Climate Change
Model Outputs for high Climate Change
1 in 20 year peak rainfall
(mm)
% increase to 1 in 50 year peak
rainfall
% increase in 1 in 20 year peak daily
rainfall
% increase in 1 in 50 year peak daily
rainfall
% increase in 1 in 20 year peak
daily rainfall due to climate change
% increase in 1 in 50 year peak
daily rainfall due to climate change
FJI 245 17% 2% 19% 19% 40% FSM 63 12% 10% 23% 59% 82% KIR 145 18% 31% 53% 63% 92% MHL 72 14% 4% 19% 46% 69% PLW 197 16% 7% 24% 16% 35% SLB 84 14% 7% 22% 16% 31% TON 57 14% 4% 19% 21% 40% TUV 83 14% 8% 23% 24% 42% VUT 189 16% 5% 22% 22% 42% WSM 79 14% 8% 23% 19% 37%
Source: World Bank estimates Note: The differences between the median and 10th percentile case reflect the uncertainty concerning future climate projections, rather than weather variability.

40
Table 8 illustrates that for some countries, adoption of a higher standard of protection plus adaptation to future climate change would necessitate an even larger investments in flood defences. For example, for FSM, Kiribati and the Marshall islands, moving from a 1 in 20 year standard of protection to a 1 in 50 year standard of protection while catering for extreme climate change would require the need to cope with around 70-90% increases in peak rainfall..
Rather than utilising flood defences, in some countries a better strategy may be to ensure that the floor levels of all new buildings are raised so that their main thresholds are a metre or more above ground level. This would also assist these countries to prepare for sea level rise. It may be prohibitively expensive to retrofit all existing buildings, but the design standards for new buildings – particularly, important public buildings – should set out to raise floor levels above future flood levels wherever possible and to encourage the implementation of other measures that would minimise the impact of flood damage. This could include raising power outlets and key services as well as avoiding the use of materials that are badly affected by flood water.
Changes in flood exposure and damage
Flood exposure and damage costs are high for many PICs under current climate conditions. Table 9 summarises the baseline flooding exposure (using historic data for 1981-2000) for four countries, showing the distribution of population and economic activity that are subject to various impacts (from no impact to very high impacts). It shows the current flooding risk exposure is high to very high in Fiji, and medium to high in Solomon Islands and Samoa. In Fiji 38% of the population and 19% of economic activity fall into the high or very high impact category. The hazards for these people are high to very high, not merely relative to other areas in Fiji but by comparison with flood exposure in all countries around the world. The proportion of the population subject to High and Very High impacts are much lower for the other countries, though 7-8% of economic activity in the Solomon Islands and Samoa is located in areas with high or very high flood impacts. Clearly, the areas at risk of flooding with high or very high impacts are candidates for additional investment in flood defences to raise the level of protection and reduce the flood losses which occur as a result of extreme weather under current climate conditions.
Table 9. Severity of flood impacts under current standard of protection and current climate conditions
Source: World Bank estimates
Country Exposure by impact
No impact Low Medium High Very High Proportion of population Fiji 11% 14% 37% 32% 6% Solomon Islands 59% 19% 19% 1% 1% Vanuatu 63% 36% 1% 0% 0% Samoa 62% 0% 36% 0% 1% Proportion of economic activity Fiji 23% 17% 41% 16% 3% Solomon Islands 68% 25% 1% 5% 2% Vanuatu 92% 8% 0% 0% 0% Samoa 76% 0% 16% 0% 8%
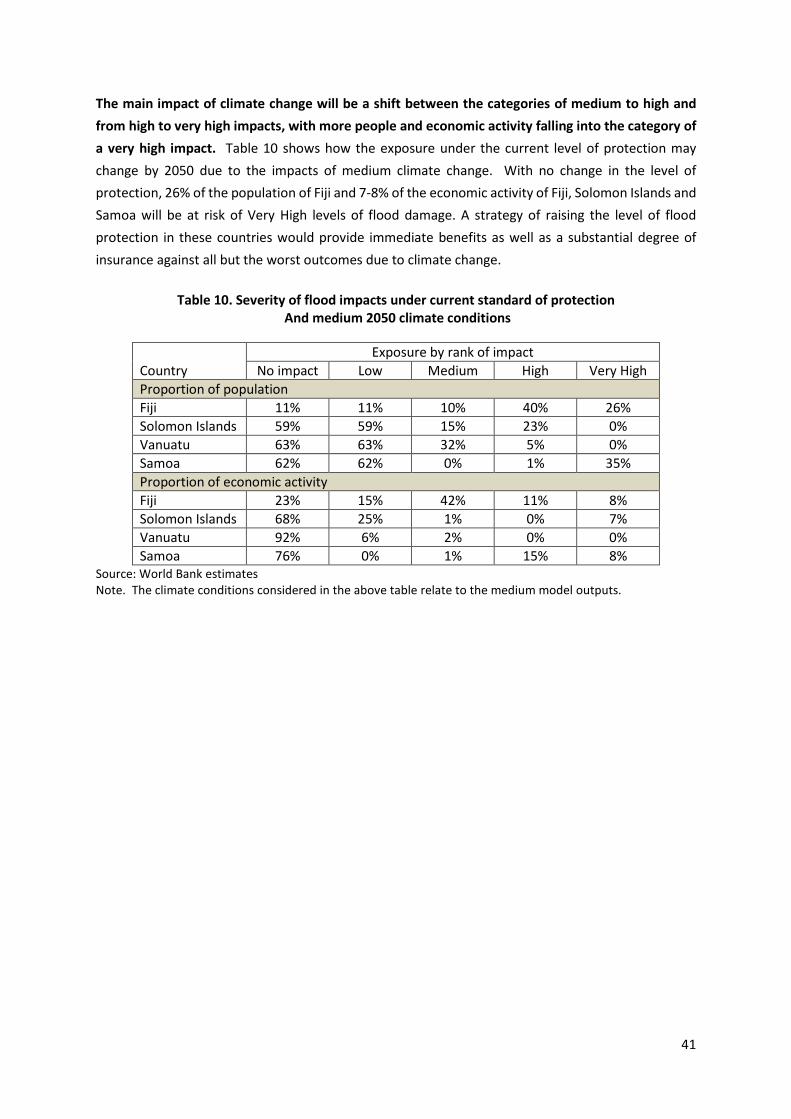
41
The main impact of climate change will be a shift between the categories of medium to high and from high to very high impacts, with more people and economic activity falling into the category of a very high impact. Table 10 shows how the exposure under the current level of protection may change by 2050 due to the impacts of medium climate change. With no change in the level of protection, 26% of the population of Fiji and 7-8% of the economic activity of Fiji, Solomon Islands and Samoa will be at risk of Very High levels of flood damage. A strategy of raising the level of flood protection in these countries would provide immediate benefits as well as a substantial degree of insurance against all but the worst outcomes due to climate change.
Table 10. Severity of flood impacts under current standard of protection And medium 2050 climate conditions
Source: World Bank estimates Note. The climate conditions considered in the above table relate to the medium model outputs.
Country Exposure by rank of impact
No impact Low Medium High Very High Proportion of population Fiji 11% 11% 10% 40% 26% Solomon Islands 59% 59% 15% 23% 0% Vanuatu 63% 63% 32% 5% 0% Samoa 62% 62% 0% 1% 35% Proportion of economic activity Fiji 23% 15% 42% 11% 8% Solomon Islands 68% 25% 1% 0% 7% Vanuatu 92% 6% 2% 0% 0% Samoa 76% 0% 1% 15% 8%

42
Emerging Policy Message
Even under existing climate conditions, several PICs experience flood and drought related challenges. There are significant economic impacts from river-based flooding, and significant water shortages due to drought, particularly during El Niño periods.
RCP4.5 Climate scenarios suggest that total annual precipitation will increase in most Pacific Island countries as a result of climate change. This increase will be accompanied by greater differences in rainfall between wet and dry months and more intense rainfall in the wettest periods of the year. Hence, adaptation to climate change will involve measures to: (i) increase the capacity to store water that is accumulated in wetter months for use in the drier months; and (ii) manage the run-off caused by more intense periods of rain.
Box 2 - Cost of flooding and adapting to flooding in Pacific Island Countries
Floods have caused millions of dollars of damage and loss to Pacific Island Country economies. In the case of Fiji, it is apparent that over the last 12 years, floods cost Government and communities some FJD$35 million a year. This figure would likely increase if the full range of potential floods and costs were accounted for (data is lacking) – the 100 year flood at Nadi alone is estimated to cost F$794M (NIWA, 2014). Only one study is known to have estimated the annual average damage from flooding, for the Vaisigano catchment in Apia, Samoa, at SAT 620,000/year (Woodruff, 2008). What is not readily detected by viewing raw damage figures is the effect of flooding on national economies – but as an example, flooding in and around Honiara in April 2014 had an economic impact equivalent to 9.2% of the Solomon Island’s GDP.
Climate change and urbanisation are likely to increase the costs of flooding. Studies of two catchments in Fiji estimated that with ‘moderate’ climate change, annual flood losses would increase by 90%. With ‘severe’ climate change, annual flood losses could increase by nearly 275% (Brown et al., 2014).
The process of estimating the cost of adapting to flooding was outside the scope of this study, as it requires developing flood models on a catchment by catchment (or river by river) basis, and then establishing and costing the specific options that would be required to mitigate flooding for a particular situation. However, lessons can be learned from previous studies which have assessed the costs and benefits of interventions to reduce the risk of damage from flooding in specific PIC cities. For example, the cost of implementing the Navua River flood warning system in Fiji over 20 years was estimated at F$570K, yielding a benefit-cost ratio (BCR) of 3.7–7.3 (Holland, 2007). An assessment of management options for the Vaisigano floodplain in Apia, Samoa, found that house raising (BCR 8.0 for new wooden houses but still >1.0 for existing cement block houses) and improved flood forecasting systems (BCR 1.7–1.9) offered the best return (Woodruff, 2008).
Brown et al. (2014) compared the merits of various engineered solutions such as dredging rivers and riverbank reinforcement with ecosystem-based adaptation options for two catchments in Fiji. Under ‘moderate’ climate change, riparian buffers were judged to offer the best return (cost F$7M, BCR 2.3), followed by upland afforestation (but costing a prohibitive F$127M, BCR 1.1). Under ‘severe’ climate change, river dredging (cost $53M, BCR 1.3) and floodplain vegetation (cost F$22M, BCR 1.2) also had positive BCRs.

43
Investment in increased water storage, especially on islands with limited amounts of land suitable for reservoirs will be critical. The alternative to investing in more water storage may be reliance upon desalination facilities or other alternative water resources, which (depending on scale) may result in significant capital costs in addition to ongoing operational and maintenance costs.
Due to the high level of uncertainty surrounding the degree to which climate change may impact on future rainfalls, it may be that adopting a higher standard of protection for current flooding conditions could act as a proxy for catering for increased rainfall under future climate change scenarios. One option could be to increase the design standard for flood defences from 1 in 20 year floods to a higher standard of protection, such as the 1 in 50 year standard.
An integrated mix of carefully evaluated flood risk management measures is likely to offer most benefit. Greater investment in and application of the flood risk management approach is required to increase public safety, to mitigate adverse impacts and to build communities resilient to current and future climates. The alternatives could include any combination of measures to provide protection to assets or accommodation to flood flows. Both protection and accommodation measures may involve substantial capital and ongoing maintenance costs.
3.4 Adapting Infrastructure to Changes in Rainfall and Temperature
This section provides an overview of different adaptation strategies and the cost of adapting infrastructure assets to changing climate. Infrastructure assets include power and telecommunication, water and sewers, urban, roads and other transport infrastructure, hospitals, schools and housing. Importantly, the analysis below only considers risks associated with temperature increase and precipitation changes, so it assumes that buildings can withstand stronger winds and that coastal adaptation is in place to protect the infrastructure against sea level rise and stronger storm surges. The cost of protecting buildings against tropical cyclones is discussed in Section 3.5 while the cost of protecting against sea level rise and storm surges is discussed in Section 3.2, so they are not considered here. The major findings are summarised below and details are provided in Annex 4.
Methodology
Costs of adaptation are highly dependent on future development pathways. To assess the cost of adaptation for infrastructure, a number of assumptions are made about future infrastructure investments as well as about the design standards that would have been applied to build these assets in the absence of climate change. This set of assumptions is referred to as reference scenario. The costs of adaptation are then assessed as the difference between expenditures in the reference scenario and expenditures in scenarios with climate change impacts, where the infrastructure is designed to withstand changes in temperature and precipitations. Accordingly, if the reference scenario assumes that resilience will increase over time in the absence of climate change, adaptation costs are much lower than if the reference scenario assumes there will be no frequent maintenance regimes in the next decades and new resilient standards are not used.
Here, in the reference scenario, it is assumed that there will be an improvement in the quality and maintenance of infrastructure services over the next decades. It is assumed that over time and

44
development gains, a country will have a “normal” level of infrastructure defined as a function of GDP per capita, population, and a range of physical and climatic conditions with patterns similar to that of current high- and middle-income countries. The reference scenario also assumes that the quality, redundancy and maintenance levels of infrastructure increase over time, as a function of income growth, i.e. countries will invest in climate resilience infrastructure and will follow good practices in terms of maintenance to protect against current risk levels. Accordingly, PICs will not be protected against 1 in 1,000 or even 1 in 10,000 year floods like the Netherlands, because the opportunity cost of such defences – e.g. the sacrifice of expenditure on health or education – may not justify such high protection. But improving the resilience of current infrastructure can bring many economic benefits. Today infrastructure in the PICs is often badly damaged by cyclones. For example, Tropical Cyclone Pam (2015) caused losses to Vanuatu equivalent to 64% percent of GDP, of which 60% are related to infrastructure assets. Design standards often specify assets being able to withstand 1 in 50 or 100 year events – i.e. events with a probability of occurring in any year of either 2% or 1% - without suffering significant damage. Clearly these are not sufficient for the current conditions suggesting that changes in standards and codes and/or their enforcement are needed.
There are deep uncertainties on climate change impacts at local level in PICs, which makes it difficult to choose the best investment and the best adaptation strategy. For example, the construction of paved roads can include pavement surface that incorporate binders that are specified to perform to a particular level of pavement temperature – an indicator which depends upon maximum temperature and latitude. Designing for a higher level of the pavement temperature increases the initial cost of constructing the paved road but reduces the cost of maintenance due to avoided degradation of the pavement surface when/if the pavement temperature exceeds the design specification. Hence, the decision on adaptation strategy involves a trade-off between capital and maintenance costs which is affected by the probability that future climate conditions will exceed critical values for the pavement temperature.
Decision-makers face two major adaptation strategies: “wait, observe and then act” or “plan for a changed climate”. In the former strategy, focus could end up on disaster risk management. The strategy would mean, for example for a road, binders or culverts are not changed compared to the reference scenario, but the road may have to be replaced before the end of its lifetime and there may also be service disruptions especially after heavy rainfall events. In the reference scenario, costs of the service disruption and/or increased maintenance due to climate change are not included. When decision-makers decide to plan ahead for a changed climate, the concepts of building back better and resilient reconstructions are incorporated. This strategy requires designing investment that will resist many different climate change impacts while being cost-effective and that could perform relatively well in a large number of possible scenarios. It may mean deciding, for example, to build flood defences today which are high enough to protect against a 1 in 100 year flood under the worst case climate scenarios for 2050, to construct paved roads and bridges capable of withstanding the high temperatures that are projected to occur in the next 30 years or to change the design standards for buildings so that they incorporate cooling and ventilation that can cope with projected temperatures and levels of humidity in 2030 or 2050. Upstream decisions may also be needed and should be

45
informed by risk planning to help move assets out of high risk and exposure areas. The socio-economic costs and implications of such decisions are not included here.
The analysis presented in this section used 19 simulations run by 12 Global Climate Models (GCMs) runs using the RCP4.5 climate scenario (see Annex 1) for emissions of CO2 and other greenhouse gases. It calculated the costs associated with the two major adaptation strategies in all those scenarios, always starting from the same reference scenario. However, the uncertainty on the reference scenario was not explored. Such an analysis produced a large number of possible outcomes.
Given the large number of outcomes, an approach based on criteria of “minimum maximum regret” is used to select the most appropriate strategy in each sector and each country. In this approach, the cost associated with every strategy is calculated and compared to the least-cost strategy, in each climate scenario. This is called the regret. From this the maximum regret associated with each strategy across all scenarios is calculated and the strategy with the lowest maximum regret is selected. For instance, investing in expensive planned adaptation option, when the climate change turns out to be the lowest possible might create a higher regret than waiting and reacting with adaptation options even if the world ends up with high climate change. If this is the case, the most appropriate strategy is to wait, observe and act. Results of such analysis and the trade-offs needed at the local level could be strengthened by considering several reference scenarios and taking into account the views of the local population and stakeholder, especially the level of disruption to the services that might be acceptable to them. Given the scale of the analysis – at best at a country level – such considerations are not included in the results presented.
Results
Using the 19 climate scenarios from RCP4.5, the average cost of adaptation where decision-makers plan for a climate changed future varies from 2% to 20% of baseline expenditures across the PICs (table 11). This result is across all 19 model outputs and for all infrastructure types. Fiji and Vanuatu are at the low end with very low adaptation costs while costs can reach more than 8% of baseline expenditure for FSM and Kiribati on average. The variation comes from different climate change impacts in different countries: for instance in all scenarios rainfall increases significantly in Kiribati while impacts are much smaller in Fiji, with sometimes a decrease in rainfall (see Annex 1).

46
Table 11. Costs of pre-emptive adaptation relative to baseline expenditures
(Average cost of pre-emptive adaptation for all infrastructure assets by country for 2011-50; 20 year planning horizon; $ million per year at 2010 international prices with no discounting)
Country Average cost of pre-emptive
adaptation over GCMs % of reference scenario
Fiji 20.2 2.8% FSM 13.4 13.4% Kiribati 18.9 20.9% MHL 8.1 11.5% Palau 4.5 6.3% SLB 17.3 8.6% Tonga 8.4 11.7% Tuvalu 0.3 5.8% Vanuatu 7.0 3.9% Samoa 7.8 7.0%
Roads account for more than 50% of the average costs of adaptation in all but two countries and exceed 90% of the average costs in Solomon Islands and Samoa (Table 12). Urban infrastructure and housing are important contributors to the average cost of adaptation in the Marshall Island, Palau and Tuvalu where there are limited road networks.
Table 12. Average cost of adaptation by infrastructure type over 20 year planning horizon across all 19 climate scenarios (costs as % of expenditures in reference scenario)
Country Power & phones
Water & sewers Roads Other
transport Health & schools Urban Housing
Fiji 0.4% 0.1% 14.8% 0.3% 0.4% 0.6% 0.3% FSM 0.9% 0.2% 40.1% 1.6% 1.0% 1.2% 1.5% Kiribati 0.6% 0.6% 41.4% 1.7% 2.2% 2.8% 2.9% MHL 1.4% 0.8% 29.9% 2.1% 4.1% 4.2% 5.7% Palau 0.6% 0.0% 22.0% 2.6% 1.2% 1.4% 1.7% Solomon 0.8% 0.1% 34.3% 0.4% 0.5% 0.8% 0.4% Tonga 0.9% 0.7% 32.6% 1.0% 2.5% 2.7% 1.8% Tuvalu 0.9% 0.0% 43.8% 0.0% 0.0% 2.1% 1.7% Vanuatu 0.5% 0.1% 15.1% 0.4% 0.5% 0.9% 0.5% Samoa 0.6% 0.1% 22.5% 0.6% 0.4% 0.6% 0.5%
The high cost of adaptation, especially for the road sector may be justified if the worst climate scenario occurs, but may not be justified in lower climate change scenarios. The criteria of “minimum maximum regret” to select the most appropriate strategy in each sector and each country is used here. Table 13 shows the results for each country and infrastructure in 2040, using a 5% discount rate for calculating adaptation costs and regrets.

47
Table 13. Lowest regret adaptation strategies for the 2040s by country and by infrastructure type (for * the lowest regret strategy may be reactive, while for others it is pre-emptive adaptation. The
cost of the strategy in the worst case scenario as a % of expenditures in reference scenario.) Note: a 5% discount rate was used to calculate the regrets
Country Health & schools Housing
Other transport
Power & telecoms Roads Urban
Water & sewers
FSM (1.0%) (3.0%) (3.0%) * (0.6%) * (20.0%) * (3.0%) (0.3%) Fiji (0.5%) (0.7%) (0.7%) * (0.1%) * (3.0%) * (0.5%) (0.1%) Kiribati (2.0%) (4.0%) (3.0%) (0.6%) (20.0%) (2.0%) (0.4%) MHL (0.4%) (1.0%) (0.9%) (0.5%) * (10.0%) (0.8%) (0.09%) Palau (2.0%) (3.0%) (3.0%) * (0.6%) * (30.0%) (2.0%) (0.3%) SLB (0.4%) (0.8%) (0.8%) * (0.1%) * (4.0%) * (0.5%) (0.1%) Samoa (0.1%) (0.2%) (0.5%) * (0.2%) * (4.0%) (0.2%) (0.03%) Tonga (0.06%) (0.0%) (0.08%) (0.3%) * (2.0%) (0.4%) (0.02%) Tuvalu (0.8%) (2.0%) (1.0%) * (0.5%) * (20.0%) (0.8%) (0.2%) Vanuatu (0.6%) (1.0%) (1.0%) * (0.4%) * (10.0%) (1.0%) (0.1%)
For most type of infrastructure (e.g: health and schools infrastructure, housing, water supply and sewers) the lowest regret option is to adapt now to future climate changes. The lowest-regret strategy often entails planning ahead for only one or two decades. For example, for infrastructure that has generally a short life-span (such as houses), decision-makers and engineers should not be asked to design houses with a view to extend their lifetime beyond 20 years. It is cheaper to build infrastructure that can withstand the climate conditions of the next 10 to 20 years than building infrastructure that can withstand both current climate and the climate that will be experienced in 30 years. For many types of infrastructure the pre-emptive strategy is fully justified as the marginal cost is low (e.g: ICT, health and schools, water and sewers).
For roads, due to the the high costs of protecting infrastructure against the worst case scenario and the high uncertainty surrounding future changes in rainfall, decision has to be made case by case. The lowest regret option for many PICs appears to be reactive to climate change impacts which would involve rebuilding those sections of the roads if and when they are damaged. However, this assumes that governments will have the financial and technical resources to react quickly in case of disasters and repair damaged roads promptly, whereas if those conditions are not met, the costs of being reactive may be largely underestimated. In addition, in order to reduce the vulnerability of PICs, it is important to ensure vulnerable populations always have access to basic social services like schools and hospitals during disasters. A possible cost-effective solution for managing future changes in climate and minimize the economic costs associated with a road failure, could be to focus on strengthening preparedness (e.g: reducing the time needed to restore traffic, pre-selecting contractors, setting up an emergency fund, storing materials in advance to respond quickly) and maintaining accessibility to essential infrastructure such as schools and hospitals following a disaster event by increasing the redundancy of the road network, thus making sure there are alternatives even if the main road is damaged. More importantly the optimum solution will be a combination of relatively low cost adaptation measures (e.g. first and foremost proper maintenance but also increase the slope of pavement and/or the capacity of the drainage systems to reflect changes in future expected runoff or water flow) and strengthening preparedness.

48
Roads and urban infrastructure have relatively high costs of adaptation with the primary driver of adaptation costs being the increase in the amount and intensity of rainfall affecting maintenance as well as upgrading/reconstruction costs. This suggests investing in urban storm water drainage, especially in PICs where precipitations are projected to increase as in the Solomon Islands, FSM, Kiribati, and Marshall Islands. For roads, in some places like Kiribati it may be required to upgrade roads to higher standards to that they can withstand large increases in rainfall.
Emerging policy messages
Complying with the current construction standards and maintenance regimes should be a priority for all PICs. Current weather patterns affect the reliability of infrastructure especially road services and affect economies of many PICs. Given the present infrastructure is not able to withstand the current climate extremes, ensuring compliance, especially in the absence of new climate resilient standards together with maintenance based on good practices will decrease the damage to infrastructure and minimize service disruptions. Horizontal infrastructure such as water and electricity systems, transportation links (bridges, main roads), ports, are unique as their functioning have many impacts on other types of economic activities. Strengthening horizontal infrastructure therefore reduces both damages and the indirect losses associated with their failure to provide services during and after the emergency phase of a sudden-onset disaster event. Equally important as strengthening is inserting redundancies into crucial lifelines, so that a failure in one point does not lead to a collapse of the system. This is relevant not only for transportation, electricity and water systems, but also to other crucial lifelines like communication systems.
Assuming countries raise construction standards over time, the costs of adaptation for timeframe to 2050 is around 2-20% of baseline expenditures with the highest being more for countries where changes in precipitation particularly affect the road networks. But the actual costs may be higher in a more pessimistic reference scenario in which infrastructure would be closer to what it is like today. This is given that most of the infrastructure in PICs generally is not able to withstand the current climatic conditions.
The materials and designs used in building infrastructure, as well as the frequency of maintenance, would need to be altered to maintain the same quality of infrastructure services as in the absence of climate change. For example, in buildings it will be necessary to increase the capacity of ventilation systems in order to cope with more humidity, and to strengthen the roofs to withstand higher levels of rain. In urban designs larger drainage and water storage systems will be required to cope with higher rainfall.
Implementing adaptation options now for most infrastructure types would provide benefits irrespective of the severity of climate change in 2050s. For many types of infrastructure the pre-emptive strategy is also justified as the marginal cost is low.
For roads, the costs of raising standards to resist potential climate changes is high and the optimum solution will be a combination of pre-emptive measures and strengthening preparedness.
Adaptation strategies need to be designed on a case by case basis. For instance in some places it may make sense to adapt roads to climate change by installing higher drainage capacity and elevating the

49
road, while in other places increasing redundancy in the network can be a more cost-effective solution. Many uncertainties other than climate were not considered in the analysis but are important in the decision-making process. Such factors include the acceptable level of service disruption that communities are willing to bare, the economic basis of the area (e.g. agriculture, tourism or others which are less affected by climatic factors) and the soft adaptation measures already in place (e.g. early-warning systems, social safety nets, insurances).
3.5 Improving the resilience of buildings to tropical cyclone winds
This section focuses on the options for reducing the damage from tropical cyclone winds37 on housing and public building, both under current climate conditions and future climate scenarios up to 2050. The analysis focuses on national level options that can include combination of: i) retrofitting (upgrading) existing buildings to increase their wind resistance and ii) progressive replacement of the building stock using enhanced design standards that take account of increased wind speeds due to likely climate change conditions. Complementary analysis of progressive adjustment in design standards required to take account of changes in average temperatures, precipitation and humidity which affect the service life and habitability of buildings is presented in Section 3.5 and Annex 5.
Methodology
The PCRAFI modelling components have been combined with an analysis of the impacts of both climate change scenarios and strengthening measures for the building stock due to retrofitting and application of stringent building codes. The PCRAFI study developed a probabilistic risk model to estimate losses caused by tropical cyclones under historical climate conditions. Generally, the intensity of tropical cyclones is likely to increase by 3–5 percent per 1°C rise in sea surface temperature. This forms the basis of distributing changes in cyclone intensity38 as measured by the projected 1 in100 years wind speed for 2050 under historical climate, low and high-emission scenarios (Table 14), further details of the climate models and assumptions can be found in Annex 1.
37 Storm surge and flooding also damage buildings – however, the most effective protection options often require implementation of larger scale measures such as elevated dikes or changing land-use policies rather than measures that can be implemented at the individual building level. These topics are presented in Section 3.2 (Sea Level Rise and Coastal Protection) and Section 3.3 (Managing Water Resources and flooding) with further details in Annexes 5 and 6. 38 Cyclone frequency is likely to decrease with climate change but this was not considered here as it is too difficult to model. The climate change impacts on cyclones used here should therefore be considered as upper bound impacts.

50
Table 14. Estimated increases in cyclone wind intensity up to 2050 Country Likely wind speed with mean return period of 100 years (Kmph
sustained over 1 min)
Historical climate Low emission scenario High emission scenario
Fiji 157 162 168 FSM 154 160 166 Marshall Islands 142 149 155 Tonga 152 158 165 Vanuatu 182 190 197 Samoa 152 158 165
Engineering-based functions from PCRAFI were used to analyse the possible reduction in cyclone wind damages due to improved building performance from retrofitting and code upgrading. For a given wind speed level, the amount of damage depends upon features of building design, materials and construction methods. Damage curves have been compiled reflecting current design and construction practices and for two retrofitting options: i) lower cost measure that are easily implemented (light retrofit), and ii) more extensive and costly improvements (heavy retrofit). It has been assumed that heavy retrofitting would be restricted to public buildings, including emergency shelters.
Benefit-Cost Ratios (BCRs) were calculated to assess the cost-efficiency of investing in retrofitting. The calculations used the PCRAFI inventory of buildings for each country combined with estimates of costs for the light and heavy retrofitting measures. The benefits of the reduction in cyclone damage due to the retrofitting measures were calculated for each building type as the present value of the reduction in the expected annual losses over a period of 30 years using discount rates from 2 to 5 percent. The BCR is the present value of discounted benefits divided by the initial cost of retrofitting. Three sets of benefit-cost ratio under three scenarios were calculated: no climate change, low-emission and high-emission39.
The approach also evaluated the need to improve design standards to achieve a standard threshold of resilience to cyclone winds. This is important given that in many PICs, the existing building design practices offer limited resistance even to moderate 1 in 10 year or 1 in 20 year winds. A fairly low target design level resistance to the 1 in 50 year winds was used for this study. It means that over a 50 year service life, a building would still have a 60% chance of experiencing significant damage. This compares to design practices in some high income countries where building codes require resistance to the 1 – 500 year hazard, which offers a much lower (10%) chance of being exceeded in 50 years. The relative costs of implementing building codes that are resilient to projected climate change can be assessed by comparing the added cost to increase design thresholds to meet the 1 in 50 year wind intensity in 2050.
39 The calculation of the benefits of retrofitting requires some specific assumptions when taking account of the impact of climate change. For this analysis a program to upgrade buildings that have an expected life of at least 30 years in 2020 has been considered. The benefits of retrofitting increase steadily from the no climate change value in 2020 to the 2050 Low/High value in 2050.

51
Results
There are significant decreases in expected annual losses as a result of light and heavy retrofitting measures (Figure 5). A strategy of implementing light retrofitting for public and residential building types of buildings is predicted to decrease average annual damages by about 35 percent for all six countries. Implementing heavy retrofitting for public buildings is expected to result in about 50 percent reduction in average annual damages. These are quite significant numbers, and suggest that retrofitting is an effective tool for reducing cyclone damages; however, the next results are equally important for considering the cost-efficiency of such investments.
Figure 5: Changes in expected annual damages due to retrofitting:
(a) public buildings (b) residential buildings
Favourable cost-efficiencies are possible in several PICs for light retrofitting of public buildings. Although heavy retrofitting offers significant loss reduction benefits, the much higher costs to implement such measures limits the efficiency of such measures. Table 15 shows the BCRs for the most prevalent construction types among public buildings, including timber frame and masonry structures. The highest BCRs are associated with the combination of a low 2% discount rate and the higher 2050 Climate Change scenario – under these assumptions 9 out of 12 country-material BCR results are greater than one. The majority of these results are robust when compared to the historical climate (NoCC) and low emission scenario (2050 Low). However, fewer country-material BCR results are favourable when analysed with a higher 5% discount rate. On average, timber structures have higher BCRs compared to masonry because they are more vulnerable to begin with, and therefore have a higher benefits of avoided losses when strengthened by retrofitting. The highest BCR are shown for countries with higher cyclone risk.
0.00 1.00 2.00 3.00 4.00 5.00
FJI
FSM
MHL
TON
VUT
WSM
Million (USD) 2010
Heavy retrofit Light retrofit Original
0.00 10.00 20.00 30.00 40.00
FJI
FSM
MHL
TON
VUT
WSM
Million (USD) 2010
Light retrofit Original

52
Table 15. Benefit-Cost Ratios for Light Retrofitting of Public Buildings (White: BCR<0.8, Blue: BCR>0.8 and <1, Green: BCR>1)
Country Material BCR @ 2% discount rate BCR @ 5% discount rate NoCC 2050 Low 2050 High NoCC 2050 Low 2050 High
Fiji Timber 1.03 1.11 1.20 0.71 0.75 0.80 Masonry 1.04 1.13 1.23 0.72 0.76 0.82
FSM Timber 1.57 1.70 1.85 1.08 1.15 1.23 Masonry 0.49 0.53 0.58 0.34 0.36 0.39
Marshall Islands Timber 0.97 1.04 1.13 0.66 0.71 0.76 Masonry 0.30 0.32 0.35 0.20 0.22 0.24
Tonga Timber 1.21 1.30 1.40 0.83 0.88 0.94 Masonry 0.93 1.00 1.09 0.64 0.68 0.73
Vanuatu Timber 1.79 1.92 2.08 1.23 1.30 1.39 Masonry 1.67 1.81 1.97 1.14 1.22 1.32
Samoa Timber 1.34 1.44 1.56 0.92 0.98 1.04 Masonry 0.47 0.51 0.55 0.32 0.34 0.37
Cost-efficiencies are less favourable for light retrofitting of residential buildings due to higher relative retrofitting costs. For the most prevalent residential building types, the light retrofitting costs were originally estimated to range from 1-16% of replacement values. The results shown in Table 16 have capped the costs at 5% as an upper bound threshold given the uncertainty in estimating such costs. Even with the lower costs, there are limited combinations that yield favourable BCR results. Vanuatu is the only country for which the results are robust at both discount rates, and only for Timber and Traditional construction types.
Table 16. Benefit-Cost Ratios for Light Retrofitting of Residential Buildings (White: BCR<0.8, Blue: BCR>0.8 and <1, Green: BCR>1)40
Country Material BCR @ 2% discount rate BCR @ 5% discount rate NoCC 2050 Low 2050 High NoCC 2050 Low 2050 High Fiji Timber 0.90 0.97 1.05 0.62 0.66 0.70
Masonry 0.54 0.58 0.64 0.37 0.40 0.42 FSM Timber 0.79 0.85 0.93 0.54 0.58 0.62
Masonry 0.24 0.27 0.29 0.17 0.18 0.19 Tonga Timber 0.74 0.80 0.86 0.51 0.54 0.58
Masonry 0.26 0.28 0.31 0.18 0.19 0.20 Vanuatu Timber 2.78 2.99 3.23 1.91 2.03 2.16
Traditional 1.40 1.50 1.62 0.96 1.02 1.08 Masonry 0.87 0.94 1.03 0.60 0.64 0.69 Samoa Timber 0.73 0.78 0.85 0.50 0.53 0.57
Open/Fale 0.27 0.29 0.31 0.18 0.19 0.21 Masonry 0.24 0.25 0.28 0.16 0.17 0.18
A program of retrofitting and adaptation for implementation in the 2020s could combine retrofitting of existing buildings with the application of higher building standards for new buildings. The costs of the baseline investment program allow for the implementation of higher building standards to
40 The BCRs for Marshall Islands left out of the Residential loss table considering they were significantly below one for all building types and discount rates.

53
ensure that new buildings are resilient to 1 in 50 year cyclones under current climate conditions. The results are summarised in Table 17 which shows the costs of early replacement, retrofitting and adaptation to climate change relative to baseline investment separately for public and residential buildings by country. The incremental cost of adaptation to climate change are less than 1% of the baseline investment program. The costs of early replacement and light retrofitting are 8-14 percent of baseline investment for public buildings in 5 countries and 17 to 27% in 4 countries. The heaviest costs arise for residential buildings in Vanuatu and all buildings in Samoa. In both countries the reason is the number of traditional and open structure buildings which could be replaced and/or upgraded in order to reduce the costs of building damage caused by cyclones. The analyses suggest that the benefits of early replacement and/or upgrades of vulnerable building types exceed the costs incurred, but such a program would represent a substantial commitment in these two countries.
Table 17. Cost of adaptation to higher cyclone winds for buildings by country
(USD million per year, 2020-29)
Baseline capital cost Extra for early replacement
program
Extra for light retrofitting program
Extra for adaptation to 2050 High
Public Residential Public Residential Public Residential Public Residential (1) (2) (3) (4) (5) (6) (7) (8) Fiji 150.7 806.3 8.4 66.3 3.3 68.5 1.1 4.8 FSM 16.8 65.4 1.6 9.4 0.7 5.5 0.0 0.2 Marshall Islands 17.2 57.9 1.4 6.1 0.6 4.8 0.1 0.5 Tonga 25.0 82.1 1.8 8.7 0.7 13.4 0.0 0.3 Vanuatu 34.4 174.3 2.7 74.4 1.2 14.0 0.0 0.7 Samoa 21.4 55.0 4.6 44.5 1.0 4.1 0.0 0.3
Source: World Bank estimates

54
Emerging policy messages
The results highlight the need for a selective approach in identifying opportunities to retrofit existing buildings to provide greater resilience to cyclone winds. Additional strategy for prioritizing retrofitting interventions should consider the following:
• Retrofitting is more cost-effective in countries which face higher cyclone risks - notably Vanuatu, Fiji, RMI, Tonga and Samoa. Following TC Pam and TC Winston, there were significant damages to the building stock. A preliminary analysis using the retrofitting schemes showed that losses could have been reduced by 25% with light retrofitting and over 35% with heavy retrofitting.
• Retrofitting public buildings appears to be economically justified in multiple countries. The result is based on analysis that has focused on the costs of repairing buildings in the event of cyclone damage. Including other losses, such as potential loss of life or injuries and the loss of the services
Box 3 - Peru Safe School Program Case Study Development of a seismic risk reduction strategy for school infrastructure in Lima
Project Context: Peru lies in the ‘Pacific Ring of Fire’, a highly seismic region where about 80 percent of all the world’s earthquakes occur. In 2013, the Ministry of Education carried out the first nationwide public school infrastructure census of approximately 50,000 school facilities. With support from the World Bank/GFDRR the census results were analysed and a seismic risk assessment was conducted for the Lima Metropolitan area, which has a population of almost 10 million in a high seismic hazard zone. Objective: The general aims of the structural retrofitting project are the following: i) reduction of the risk of death and injury, ii) reduction of the risk of damage and protection of the built environment, and, iii) reduction of the service disruption. Technical Approach: The seismic risk assessment carried out for the 1,969 school facilities in Lima evaluated three components – hazard, exposure and vulnerability – and it provided an estimation of the expected losses taking into account the frequency of occurrence of various earthquake scenarios. Two main categories of intervention were recommended:
• Category 1: Demolition and replacement of school buildings with High probability of collapse according with the results of scenario analysis. The structural typologies under this category would face high costs and technical difficulties in order to retrofit.
• Category 2: Structural retrofitting of school buildings with High probability of structural damage according with the results of scenario analysis. Most of the school buildings under this category, which are viable at the technical and financial level, have a standard design and common seismic performance issues. The incremental retrofitting is the proposed approach for this category.
Prioritization: Given the number of school buildings in each category, the prioritization method became a critical tool for defining the investment plan. Three different parameters were used: Annual Average Loss (AAL) to define a risk rank of school facilities within the portfolio to know where the risk is concentrated, Cost Effective Analyses (CEA) for Category 1 to maximized the number of students to be covered in a specific investment plan, and Cost benefit analysis (CBA) for Category 2 to establish the order of retrofitting of school buildings in a specific investment plan. The concentration of risk, analysed through the AAL, showed that by intervening in 35 percent of the most vulnerable schools in the portfolio, about 75 percent of the risk would be reduced.
55
provided by buildings, would strengthen the case for retrofitting public buildings as they tend to have higher occupancy. In the case of seismically active countries, multi hazard retrofitting should be pursued to a standard that protects the life safety function of critical structures.
• The costs of heavy retrofitting are high relative to the benefits in terms of loss reduction. If large expenditures are required to bring buildings up to modern design specifications for wind resistance, early replacement may be a better strategy than retrofitting.
• Selective retrofitting could improve the efficiency of investing in both light and heavy retrofitting. A case study of schools in Lima, Peru (see Box 1) illustrates that focusing on the most vulnerable 35 percent of schools leads to a 75 percent reduction in risk.
Developing lower cost options for retrofitting, especially for housing, is critical. The low ratios of benefits to costs reflect the relatively high costs of upgrading housing. In Vanuatu, the average retrofit costs for residential buildings are often twice the average retrofit costs for public buildings when expressed as a proportion of average replacement values. Considering that it is not feasible to strengthen existing housing stock, it becomes critical to improve the safety of public buildings that can be used and evacuations shelters through retrofitting.
Reconstruction efforts should seek to ensure that buildings – especially, public buildings – should incorporate the code improvements necessary to ensure greater resilience to the current and future distribution of cyclone risks. The benefits of greater wind resistance will increase as a consequence of climate change over the life of the buildings that are either replaced or reconstructed during the recovery from these storms.
Additional cost of implementing higher design standards for new buildings that would ensure greater resilience to cyclone winds is small in relation to the total cost of construction. The changes required to ensure that structures are more robust to cyclones will usually involve modest adjustments to designs when the buildings are constructed. Lessons learned from New Zealand and USA, for example, indicate that new building codes offering greater seismic and cyclone resilience compared to the older code at the desired performance level are expected to add less than 5 percent to the cost of construction for new structure. On the other hand, it is often relatively expensive to retrofit existing buildings to meet higher design standards.
Moving ahead rapidly with the adoption and implementation of building codes to ensure that new buildings can withstand at least 1 in 50 year cyclone wind speeds should be a high priority for policymakers. However, the successful implementation would require actions to improve compliance with the new code including investment in training of engineers and contractors, and strengthening of the design and construction permitting process.
The results presented here provide a rough guide to assess the relative desirability of various retrofitting and code strategies. For any detailed analysis of retrofitting options, local circumstance including the specific costs of retrofitting, the age profile of the asset stock and the pattern of building usage must all be taken into account.
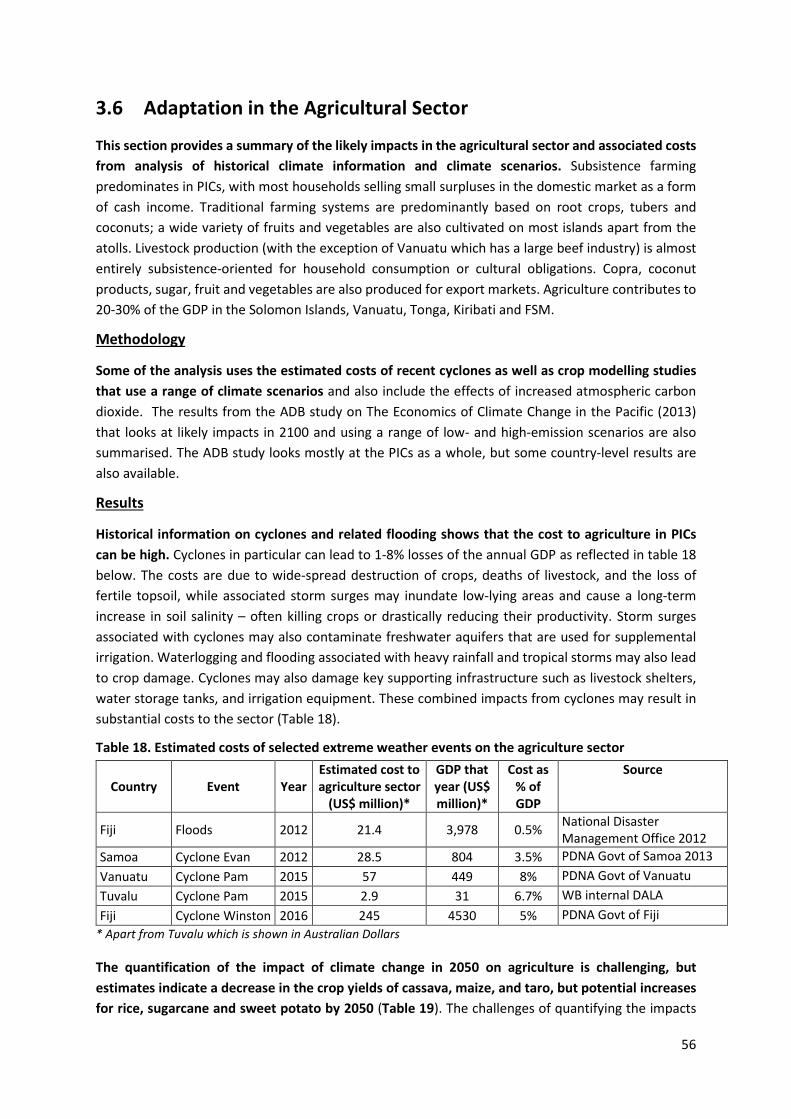
56
3.6 Adaptation in the Agricultural Sector
This section provides a summary of the likely impacts in the agricultural sector and associated costs from analysis of historical climate information and climate scenarios. Subsistence farming predominates in PICs, with most households selling small surpluses in the domestic market as a form of cash income. Traditional farming systems are predominantly based on root crops, tubers and coconuts; a wide variety of fruits and vegetables are also cultivated on most islands apart from the atolls. Livestock production (with the exception of Vanuatu which has a large beef industry) is almost entirely subsistence-oriented for household consumption or cultural obligations. Copra, coconut products, sugar, fruit and vegetables are also produced for export markets. Agriculture contributes to 20-30% of the GDP in the Solomon Islands, Vanuatu, Tonga, Kiribati and FSM.
Methodology
Some of the analysis uses the estimated costs of recent cyclones as well as crop modelling studies that use a range of climate scenarios and also include the effects of increased atmospheric carbon dioxide. The results from the ADB study on The Economics of Climate Change in the Pacific (2013) that looks at likely impacts in 2100 and using a range of low- and high-emission scenarios are also summarised. The ADB study looks mostly at the PICs as a whole, but some country-level results are also available.
Results
Historical information on cyclones and related flooding shows that the cost to agriculture in PICs can be high. Cyclones in particular can lead to 1-8% losses of the annual GDP as reflected in table 18 below. The costs are due to wide-spread destruction of crops, deaths of livestock, and the loss of fertile topsoil, while associated storm surges may inundate low-lying areas and cause a long-term increase in soil salinity – often killing crops or drastically reducing their productivity. Storm surges associated with cyclones may also contaminate freshwater aquifers that are used for supplemental irrigation. Waterlogging and flooding associated with heavy rainfall and tropical storms may also lead to crop damage. Cyclones may also damage key supporting infrastructure such as livestock shelters, water storage tanks, and irrigation equipment. These combined impacts from cyclones may result in substantial costs to the sector (Table 18).
Table 18. Estimated costs of selected extreme weather events on the agriculture sector
Country Event Year Estimated cost to agriculture sector
(US$ million)*
GDP that year (US$ million)*
Cost as % of GDP
Source
Fiji Floods 2012 21.4 3,978 0.5% National Disaster Management Office 2012
Samoa Cyclone Evan 2012 28.5 804 3.5% PDNA Govt of Samoa 2013 Vanuatu Cyclone Pam 2015 57 449 8% PDNA Govt of Vanuatu Tuvalu Cyclone Pam 2015 2.9 31 6.7% WB internal DALA Fiji Cyclone Winston 2016 245 4530 5% PDNA Govt of Fiji
* Apart from Tuvalu which is shown in Australian Dollars The quantification of the impact of climate change in 2050 on agriculture is challenging, but estimates indicate a decrease in the crop yields of cassava, maize, and taro, but potential increases for rice, sugarcane and sweet potato by 2050 (Table 19). The challenges of quantifying the impacts

57
are due to the need to consider the interacting effects of salt water intrusion, flooding, effects on livestock and/or general ecosystem functioning. As climate changes, the increased temperatures and higher risk of seasonal droughts are likely to decrease crop productivity and negatively affect livestock. For example, papaya is sensitive to temperature increase during flower production and higher temperatures result in lower productivity. Although increases in carbon dioxide concentrations could act as a “fertilizer” for some crops, such benefits depend on the type of crop, water and nutrient availability, and the incidence of pest and diseases – which is likely to increase under climate change. Livestock may also be negatively impacted due to increased risk of heat stress.
Table 19. Relative Changes in Crop Yields (%) under Climate Change in 2050 Relative to 2000
Country Cassava Maize Rice Sugarcane Sweet
potato Taro
Worst case
Best case
Worst case
Best case
Worst case
Best case
Worst case
Best case
Worst case
Best case
Worst case
Best case
Fiji -36.5 -8.8 -7 1 -11 3.5 -8.3 2.8 -13.4 2 -17.5 1.1 Solomon Islands -27.8 -17.9 -16.5 -0.3 -16.2 5.9 -12.9 0.9 -15 1.5 -18.6 -4.7
Source: Rosegrant et al. 2013, in ADB 2013 The impact of climate change on agriculture’s contribution to GDP may be slightly positive up to 2050 and strongly negative thereafter. According to ADB (2013), the contribution to the total economic cost of climate change may be equivalent to approximately 5 percent of Pacific GDP by 2100 (Table 20). As the relative importance of agriculture to the Pacific economy is likely to decline over the coming years, due to the importance of other sectors increasing, it may be that the effect on GDP is lower than what might be expected. However, the impact is also likely to be underestimated given that the modelling shown below does not take into account interaction effects with other biophysical processes, e.g. salinity intrusion or the incidence of pests and diseases. Given the essential role of agriculture in many Pacific livelihoods and in ensuring domestic food security, it would be prudent and important to consider implementing adaptation options that would respond to the observed impacts such as those due to drought and salt water intrusion. Table 20: Estimated impact of climate change on GDP by 2050 and 2100 of some countries due to effects on agriculture
Country Impact of climate change on GDP Of which % attributable to agriculture sector
2050 2100 2050 2100 Fiji -2.75% -4.0% -1.25% -1.5% Samoa -1.9% -3.8% 0% 0% Solomon Islands -1.5% -4.8% 0.0% -1.6% Vanuatu -3.2% -6.1% -1.5% -2.6% PNG -4.0% -15.0% +0.5% -8.0% Pacific Region* -3.5% -12.7% 0.0% -5.4%
Source: ADB 2013 * Including PNG and Timor-Leste

58
Given the potential impacts and uncertainties it is important that adaptation strategies that are relatively low-cost are adopted now to minimise risk in the long-term. Adaptation may involve relatively simple and low-cost options that both improve productivity and increase resilience to climate change. Such solutions are increasingly being promoted within the framework of ‘climate-smart agriculture’ (see Box 4). Climate-smart agricultural practices can often be mainstreamed into the delivery of extension services, and generally require little or no additional inputs from farmers by promoting better agricultural practices such as mulching and multiple cropping (see Table 21). Others may require moderate or substantial and sustained investments such as developing new climate-smart crop varieties at regional or national level (such as the taro varieties developed by SPC), higher design standards for agricultural assets (such as storage sheds and livestock shelters) to help reduce storm damage, or insurance mechanisms to address residual risks (Table 22). Box 2: Adaptation options integrated as part of climate-smart agriculture
Climate-smart agriculture (CSA) is an integrative approach to address the interlinked challenges of food security and climate change, that aims to (i) sustainably increase agricultural productivity, to support equitable increases in farm incomes, food security and development; (ii) adapt and build resilience of agricultural and food security systems to climate change at multiple levels; and (iii) reduce greenhouse gas emissions from agriculture where possible. Examples of climate-smart agricultural practices include: Building resilience: crop insurance; seasonal forecasting; early warning systems; adopting irrigation and other innovations; using conservation agriculture techniques to improve soil health e.g. mulching to retain soil moisture; etc. Climate proofing: adapting cropping systems to heat and water stress such as through improved varieties or changing the timing of planting; upgrading irrigation and drainage systems to allow for more intense precipitation; etc. Transformational change: shift water-intensive agriculture away from areas threatened by climate change; transform agricultural systems from high-input to low-input
Source: FAO 2013, Climate-Smart Agriculture Sourcebook The cost of many adaptation measures is low to moderate as reflected in the table below.

59
Table 21 Assessment of adaptation costs in agriculture
Adaptation measure Expected cost Quantification Farmers adopt better agricultural practices such as mulching, multiple cropping, to improve resilience
Minimal Could assume to be zero, if mainstreamed into existing extension services
Agricultural asset insurance Moderate 1% of agriculture value-added* Expansion of irrigation systems including supplemental irrigation using water-efficient/conservation systems.
Moderate Unknown
Research and development to identify more resilient plant/livestock varieties
Substantial Potential increase in costs of 25-30%*
Higher design standards for agricultural assets Substantial Unknown
* World Bank 2010, Economics of Adaptation to Climate Change Agriculture asset insurance requires a range of considerations. These include what sort of insurance might be appropriate (e.g. single crop or area-based – see Table 22). In all cases, the role of the government is critical. In many OECD countries, insurance in the agriculture sector has a heavy government involvement (Mahul & Stutley, 2010) including subsidies in premiums for crop insurance, development of likely premiums, support products, coverage and loss assessments.
Table 22 Potential categories of insurance in the agriculture sector
Type of insurance Description Single peril crop insurance, or damage based indemnity insurance
Insurance for a single hazard, for example fire, extreme rain. The claim payment is based on the percentage damage to a field of crops. This is the most common type of crop insurance
Multi-Peril Crop insurance (MPCI), or yield based crop insurance
Instead of directly insuring a crop, this provides insurance on the crop yield. Historical yield averages are established and the insurance pays out when yield drops below a percentage of the historical average (typically 50-70%)
Area yield index insurance (AYII) Claims are paid out on the basis of a decrease in average yield in an area. Similar to MPCI but the historical yield is computed over an area greater than a single farm
Indirect index insurance (III)
Claims are paid on the basis of an index correlated with yield. Indices are typically calculated using rainfall or satellite data, but other data may be used. This may only be suitable for some PICs that have large scale production and data.
Calamity funds and ad hoc aid In some countries, farmers may reasonably expect government aid in the event of large scale disasters
Source: Adopted from Vivid Economic 2016. Building an evidence base on the role of insurance-based mechanisms in promoting climate resilience. Report prepared for the Climate Investment Funds; and Mahul & Stutley, 2010
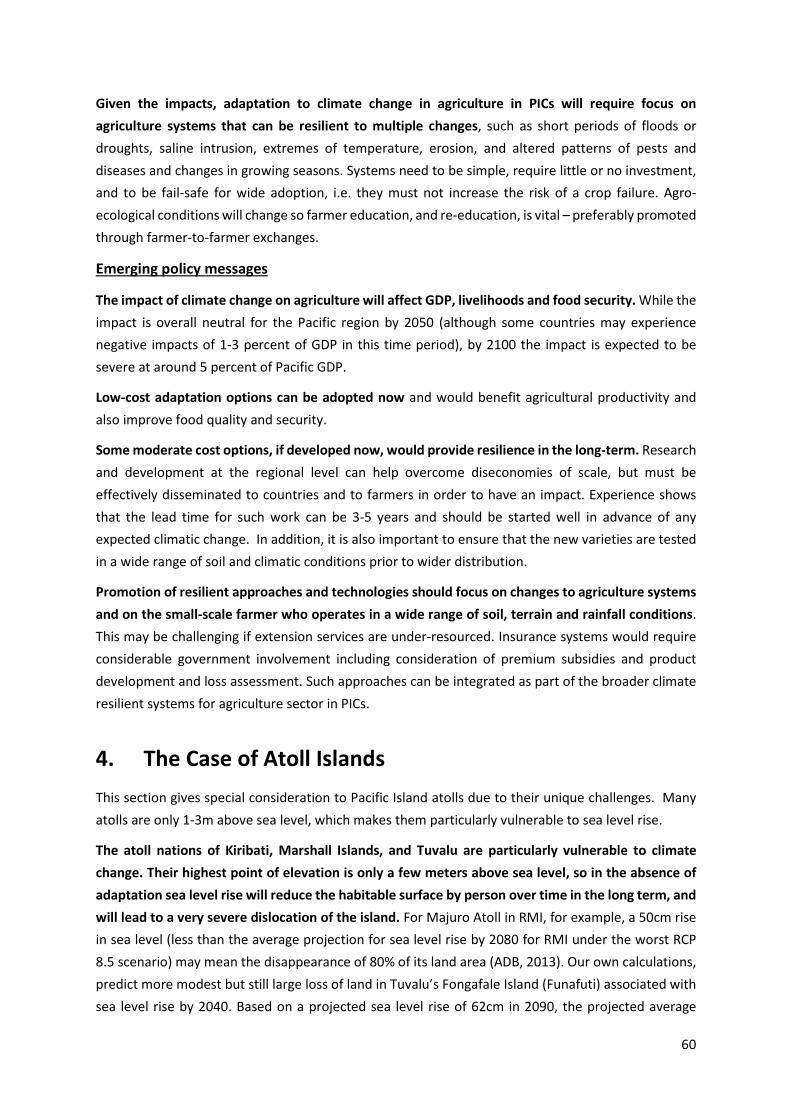
60
Given the impacts, adaptation to climate change in agriculture in PICs will require focus on agriculture systems that can be resilient to multiple changes, such as short periods of floods or droughts, saline intrusion, extremes of temperature, erosion, and altered patterns of pests and diseases and changes in growing seasons. Systems need to be simple, require little or no investment, and to be fail-safe for wide adoption, i.e. they must not increase the risk of a crop failure. Agro-ecological conditions will change so farmer education, and re-education, is vital – preferably promoted through farmer-to-farmer exchanges.
Emerging policy messages
The impact of climate change on agriculture will affect GDP, livelihoods and food security. While the impact is overall neutral for the Pacific region by 2050 (although some countries may experience negative impacts of 1-3 percent of GDP in this time period), by 2100 the impact is expected to be severe at around 5 percent of Pacific GDP.
Low-cost adaptation options can be adopted now and would benefit agricultural productivity and also improve food quality and security.
Some moderate cost options, if developed now, would provide resilience in the long-term. Research and development at the regional level can help overcome diseconomies of scale, but must be effectively disseminated to countries and to farmers in order to have an impact. Experience shows that the lead time for such work can be 3-5 years and should be started well in advance of any expected climatic change. In addition, it is also important to ensure that the new varieties are tested in a wide range of soil and climatic conditions prior to wider distribution.
Promotion of resilient approaches and technologies should focus on changes to agriculture systems and on the small-scale farmer who operates in a wide range of soil, terrain and rainfall conditions. This may be challenging if extension services are under-resourced. Insurance systems would require considerable government involvement including consideration of premium subsidies and product development and loss assessment. Such approaches can be integrated as part of the broader climate resilient systems for agriculture sector in PICs.
4. The Case of Atoll Islands This section gives special consideration to Pacific Island atolls due to their unique challenges. Many atolls are only 1-3m above sea level, which makes them particularly vulnerable to sea level rise. The atoll nations of Kiribati, Marshall Islands, and Tuvalu are particularly vulnerable to climate change. Their highest point of elevation is only a few meters above sea level, so in the absence of adaptation sea level rise will reduce the habitable surface by person over time in the long term, and will lead to a very severe dislocation of the island. For Majuro Atoll in RMI, for example, a 50cm rise in sea level (less than the average projection for sea level rise by 2080 for RMI under the worst RCP 8.5 scenario) may mean the disappearance of 80% of its land area (ADB, 2013). Our own calculations, predict more modest but still large loss of land in Tuvalu’s Fongafale Island (Funafuti) associated with sea level rise by 2040. Based on a projected sea level rise of 62cm in 2090, the projected average

61
estimate according to the ABN and CSIRO (2014) report, will permanently flood about 5.8-10% of Fongafale’s land area. Holding constant the strength of storm surges and king tides, however, this will expose a further 10-11% of land area to these occasional inundations.41 Overall, about 20% of the land area will be either permanently or temporarily flooded. The more significant short-term risk, however, for the atoll nations, is the risk of storm surges. This risk is already very high, and with sea level rise and the deterioration of the ocean’s ecology (coral reefs) this risk is becoming greater. Overall, for the atoll countries sea-level rise can result in 15-20% direct loss of habitable land in this century alone, thereby significantly increasing population density and reducing the amount of land available for cultivation and further concentrating the risk exposure from storm surges.
In addition, sea level rise and changes in rainfall patterns already stress their fresh water supply while ocean temperature increase and acidification threaten the marine ecosystems they depend on. There is wide agreement that the combination of sea level rise and deterioration in coral reef and mangrove ecosystems will make coastal areas considerably more vulnerable to storms. Climate change can also have negative impacts on agriculture revenues (see previous section).
Vulnerability is worsened by poor development planning and the countries’ limited ability to respond and manage the risks. Kiribati, in particular, is one of the poorest of the Pacific Islands with 22 percent of the population living in extreme poverty in 2006 (the latest available survey) and as much as 66 percent of the population living at high risk of falling in poverty in case of external shock (climatic or economic). Although water consumption per person (around 60L per day42) is very low, water supply will soon become insufficient in the South Tarawa Island, because of high population growth and unsustainable levels of abstraction.
Former President Anote Tong of Kiribati spoke of the need to ensure “migration with dignity” for the country’s population (about 110,000 people). At this point, we assume that Tuvalu and RMI do not have plans for migration that are viable and carefully planned. While the Government of Tuvalu (2012) specifically mentions migration as a possible climate change outcome, survey data show that the vast majority of Tuvaluans do not view this as a major reason for concern and are not, yet, preparing to migrate because of climate change43. The decision to plan for a relocation of the population, or part of the population, to another country, is a difficult one to make. It requires an integrated approach that carefully examines the threats climate change poses to life on the atoll and the costs of maintaining decent living conditions on the atoll at different time scales. It may be affordable to maintain access to land and fresh water for the next 40 years, but maybe not later. And
41 These calculations are based solely on elevation maps of the island, using a ‘bathtub fill’ approach as in Shepard et al. (2012). Yamano et al. (2007) point out that Fongafale (Funafuti) includes significant land area that was reclaimed, and will likely flood given future events. 42 White, 2010 43 Mortreux and Barnett, 2009

62
planning for the next decades is very different whether the long-term perspective is to stay on the atoll or to leave.
Let’s look at cost estimates for adaptation between now and 2050.
Mack (2015) estimates that the cost of desalination, to increase water supply by 1700kL a day in Kiribati, would be around 2.2 million USD per year between now and 2050. It would require investments in energy production (e.g. solar), which remain to be costed, but whose impact on the overall cost should remain limited.
The cost of coastal protection however competes in a different category. The DIVA model estimates that the cost of coastal protection in Kiribati (with dikes and beach nourishment) could be between 13 and 42 million USD per year in the 2020’s and between 17 and 54 million USD per year in the 2040’s, depending on sea level rise, and assuming that population and economic activities continue to settle and grow in the same areas as today – i.e. there is no active land use planning to relocate people and economic activities in safer zones. These costs can be put in perspective with the value of assets, such as buildings and infrastructure, estimated at US$ 1.2 billion (PCRAFI 2010). Taking into account residual risk, the cost of coastal adaptation could be between 4 and 11% of Kiribati’s GDP in the 2040’s.
It is pretty clear that the Government of Kiribati cannot allocate this amount on coastal protection in its annual budget for the next decades, even if all those investment are justified economically. The Government also needs to invest in transport and energy infrastructure, in education, health, social protection and many other sectors. And there is no point in protecting the island against storms if the basic living conditions are not insured.
We may assume that the international community is willing to finance coastal protection for Kiribati and pay between 10 and 50 million USD a year for the next 50 years. Adaptation on an atoll remains challenging and ensuring decent living conditions requires to arbitrate between hard protection options (i.e., through atoll raising, land reclamation, coastal protection) and softer ones (like rehabilitation or protection of mangroves and wetlands, early-warning systems, social protection or financial instruments) and to prioritize between investments in coastal protection, water desalinization, or other infrastructure in transport and energy. It also requires to carefully identify the trade-offs and synergies between multiple objectives in different sectors. For instance, water desalinization requires more energy (e.g. solar energy), changes to climate-resistant crops can affect water demand by the agricultural sector, land-use patterns affect agriculture production, water and energy demand, and the vulnerability of the population to extreme events. In addition, adaptation requires to invest in the education of the population, to ensure that there are qualified people able to maintain protection, install solar panels and operate desalination plants. It also requires to monitor fish populations and maintain fishing agreements to make sure their long-term income source – fishery licenses – remains sustainable.
If 10 to 50 million USD a year cannot be found externally, or if the costs of adaption are much higher than expected, other long term options will need to be considered. Consideration should be given to the feasibility of a progressive relocation. Such an approach would need to be carefully planned

63
and available resources would need to be used to maintain acceptable living conditions on the atolls for the coming decades. There are political issues associated with this scenario, as discussed in Wyett (2013), but it is clear that this scenario is less costly and preferable to a last-minute abandonment with huge emergency assistance.
The World Bank in collaboration with other development partners is planning to help decision makers in Kiribati and maybe other atoll islands make these difficult decisions, given the uncertainties that exist on the speed and strength of climate change and sea level rise, and the uncertainties on the availability of international aid to finance coastal adaptation. We will use methods called “Decision Making under Deep Uncertainty” (DMU), that offer a decision making framework to help plan adaptation in an integrated way and prioritize resilient investments and adaptation strategies in spite of the deep uncertainties about future threats and budgets.
DMU methods help identify “no-regret” or “low-regret” solutions that have high utility no matter what the future brings. Thus, they can be robust even to deep uncertainties. For example, reducing leaks in water distribution systems or the conservation of natural costal inundation protection like mangroves or wetlands are always a good investment, regardless of how the climate, future demand, and other factors change. Similarly, shelters and early-warning systems are relatively low-cost options that would reduce disaster losses and save lives in the present climate. These examples suggest that finding a system’s existing shortcomings may reveal no-regret or low-regret strategies: such strategies are beneficial over the short term (and thus easier to implement from a sociopolitical point of view) and may offer benefits under a wide range of future conditions.
DMU methods also favor options that are reversible and flexible and that enable decision-makers to adjust their decisions as new information becomes available. In this way, reversible and flexible decisions can help us reduce our regret. For example, insurance and early warning systems can be adjusted every year in response to new information on emerging risks.
Importantly, DMU methods recognize the importance of decision maker and stakeholder involvement in the (more quantitative) decision analysis. Consultations will therefore be conducted with decision makers, during all the steps of the analysis, in order to identify their preferences and objectives, and discuss available short-term and long-term solutions, including the option of leaving the atoll.

64
Reference ADB (2013). The economics of climate change in the Pacific, Technical Report, Asian Development Bank, Mandaluyong City, Philippines 2013.
Anttila-Hughes, J. K., & Hsiang, S. M. (2013). Destruction, disinvestment, and death: Economic and human losses following environmental disaster. Report. 86 pp. Available at SSRN: http://ssrn.com/abstract=2220501. Arnold, M. (2012) Gender Disaster and Climate Change, Communication at the Social Development Week, the World Bank, Washington DC, United States of America, February 22, 2012,
Australian Bureau of Meteorology and CSIRO (2011). Climate Change in the Pacific: Scientific Assessment and New Research. Volume 1: Regional Overview. Volume 2: Country Reports.
AusAID (2005). Economic Impact of Natural Disasters on Development in the Pacific: Economic assessment tools (Vol. 2). Australian Agency for International Development, Canberra Australia, 42 pp
Brown, H., Spickett, J., & Katscherian, D. (2014). A Health Impact Assessment framework for assessing vulnerability and adaptation planning for climate change. International journal of environmental research and public health, 11(12), 12896-12914.
Crompton, R. P., Pielke Jr, R. A., & McAneney, K. J. (2011). Emergence timescales for detection of anthropogenic climate change in US tropical cyclone loss data. Environmental Research Letters, 6(1), 014003.
EM-DAT (2015). The OFDA/CRED International Disaster Database – www.emdat.be, Université Catholique de Louvain, Brussels, Belgium (Last access: April 09th 2016)
Etienne, S., & Terry, J. P. (2012). Coral boulders, gravel tongues and sand sheets: features of coastal accretion and sediment nourishment by Cyclone Tomas (March 2010) on Taveuni Island, Fiji. Geomorphology, 175, 54-65.
FAO (2013). Climate-Smart Agriculture Sourcebook, Food and Agriculture Organization, Rome, Italy, 570pp. Ferrario, F., Beck, M. W., Storlazzi, C. D., Micheli, F., Shepard, C. C., & Airoldi, L. (2014). The effectiveness of coral reefs for coastal hazard risk reduction and adaptation. Nature communications, 5.
Hess, D., Hwand, D. Fellenius, K., Robertson, I., Stege, M., Chutaro, B. (2015). Homeowner’s Handbook to prepare for Natural Hazards; Republic of the Marshall Islands, University of Hwai’I Sea Grant College Program, Majuro, Republic of the Marshall Islands. 88p.
Hinkel, J., Nicholls, R. J., Tol, R. S., Wang, Z. B., Hamilton, J. M., Boot, G., ... & Klein, R. J. (2013). A global analysis of erosion of sandy beaches and sea-level rise: An application of DIVA. Global and Planetary Change, 111, 150-158.
Ikeda, K. (1995). Gender differences in human loss and vulnerability in natural disasters: a case study from Bangladesh. Indian Journal of Gender Studies, 2(2), 171-193.
IPCC (2012) Managing the Risks of Extreme Events and Disasters to Advance Climate Change Adaptation . A Special Report of Working Groups I and II of the Intergovernmental Panel on Climate Change [Field, C.B., V. Barros, T.F. Stocker, D. Qin, D.J. Dokken, K.L. Ebi, M.D.

65
Mastrandrea, K.J. Mach, G.-K. Plattner, S.K. Allen, M. Tignor, and P.M. Midgley (eds.)]. Cambridge University Press, Cambridge, UK, and New York, NY, USA, 582 pp.
IPCC (2014) Climate Change 2014: Synthesis Report. Contribution of Working Groups I, II and III to the Fifth Assessment Report of the Intergovernmental Panel on Climate Change [Core Writing Team, R.K. Pachauri and L.A. Meyer (eds.)]. IPCC, Geneva, Switzerland. 151 pp.
IUCN, UNDP & GGCA (2009). Training Manual on Gender and Climate Change, Report, San Jose, Costa Rica, 278pp. Available at https://portals.iucn.org/union/sites/union/files/doc/training_manual_on_gender_and_climate_change.pdf (Last access, April 8th, 2016).
Kumar, L., & Taylor, S. (2015). Exposure of coastal built assets in the South Pacific to climate risks. Nature Climate Change, 5, 992-996
Mack, P. (2015. Bonriki Inundation Vulnerability Assessment (BIVA) -Summary Report. SPC Technical Report SPC00014, Secretariat of the Pacific Community, Suva, Fiji, 29pp.
Mahul, O., Stutley, C., J. (2010). Government Support to Agricultural Insurance: Challenges and Options for Developing Countries. The World Bank, Washington, DC, USA, 250 pp.
Mortreux, C., & Barnett, J. (2009). Climate change, migration and adaptation in Funafuti, Tuvalu. Global Environmental Change, 19(1), 105-112.
Neumayer, E., & Plümper, T. (2007). The gendered nature of natural disasters: The impact of catastrophic events on the gender gap in life expectancy, 1981–2002. Annals of the Association of American Geographers, 97(3), 551-566.
Nurse, L. A., McLean, R. F., Agard, J., Briguglio, L. P., Duvat-Magnan, V., Pelesikoti, N., ... & Webb, A. (2014). Small islands. Climate Change 2014: Impacts, Adaptation, and Vulnerability. Part B: Regional Aspects. Contribution of Working Group II to the Fifth Assessment Report of the Intergovernmental Panel on Climate Change, 1613-1654.
Peterson, K., 2007. Reaching Out to Women When Disaster Strikes. Soroptimist White Paper, Soroptimist International of the Americas, Philadelphia. Available online at:http://www.soroptimist.org/whitepapers/wp_disaster.html
Shepard, C. C., Agostini, V. N., Gilmer, B., Allen, T., Stone, J., Brooks, W., & Beck, M. W. (2012). Assessing future risk: quantifying the effects of sea level rise on storm surge risk for the southern shores of Long Island, New York. Natural Hazards, 60(2), 727-745.
SOPAC (2009) Economic Costs of Natural Disasters in the Pacific Islands region and measures to address them, Briefing paper, prepared for the Forum Economic Ministers’ meeting, Rarotonga, Cook Islands, 27-28-October 2009 at:
http://gsd.spc.int/sopac/docs/Economic%20Costs%20of%20Natural%20Disasters%20in%20the%20Pacific%20Islands%20Region.pdf
UNICEF & WHO, (2015). 25 years Progress on sanitation and drinking water – 2015 update and MDG assessment. World Human Organization, Geneva, Switzerland , 90 pp., Available at http://www.unicef.org/publications/files/Progress_on_Sanitation_and_Drinking_Water_2015_Update_.pdf (last access April 7, 2016)
UNISDR (2010). Disaster Through a Different Lens: Behind every effect, there is a cause. The United Nations Office for Disaster Risk Reduction, New York, NY, USA. 188 pp Available at http://www.unisdr.org/files/20108_mediabook.pdf.
UNWomen, 2014, Climate Change, Gender and Health in the Pacific, UN Women, Suva, Fiji, 4pp

66
Webb, A. P., & Kench, P. S. (2010). The dynamic response of reef islands to sea-level rise: evidence from multi-decadal analysis of island change in the Central Pacific. Global and Planetary Change, 72(3), 234-246.
Weinkle, J., Maue, R., & Pielke Jr, R. (2012). Historical global tropical cyclone landfalls*. Journal of Climate, 25(13), 4729-4735.
Woodruff, A. (2008). Samoa technical report: Economic analysis of flood risk reduction measures for the Lower Vaisigano Catchment Area. EU-SOPAC Project Report 69g. Secretariat of the Pacific Community, Suva, Fiji. 81 pp.
Woodruff, J. D., Irish, J. L., & Camargo, S. J. (2013). Coastal flooding by tropical cyclones and sea-level rise. Nature, 504(7478), 44-52.
World Bank (2010a) Economics of Adaptation to Climate Change- Samoa, The World Bank, Washington, DC, USA, 72 pp.
World Bank (2010b) Economics of Adaptation to Climate Change- Synthesis Report, The World Bank, Washington, DC, USA, 136 pp.
World Bank (2012a) Gender Equality and Development, World Development Report, The World Bank, Washington, DC, USA
World Bank (2012b). Turn down the heat : why a 4°C warmer world must be avoided. Turn down the heat. the World Bank, Washington, DC, USA, 106pp. :http://documents.worldbank.org/curated/en/2012/11/17097815/turn-down-heat-4°c-warmer-world-must-avoided
World Bank (2013a) Improving Women’s Odds in Disasters, Blog post: available at: http://www.worldbank.org/en/news/feature/2013/12/12/improving-women-disasters. (Last Access: April 8th, 2016)
World Bank (2013b). Building Resilience: Integrating climate and disaster risk into development. Lessons from World Bank Group experience. The World Bank, Washington, DC, USA, 44pp.
World Bank (2015) Advancing Disaster Risk Financing & Insurance in the Pacific, Regional Summary Note and Options for consideration, PCRAFI, Pacific Catastrophe Risk Assessment & Financing Initiative, Technical Report, the World Bank, Washington, DC, USA, 280 p.
Wyett, K. (2014). Escaping a rising tide: Sea level rise and migration in Kiribati. Asia & the Pacific Policy Studies, 1(1), 171-185.
Yamano, H., Kayanne, H., Yamaguchi, T., Kuwahara, Y., Yokoki, H., Shimazaki, H., & Chikamori, M. (2007). Atoll island vulnerability to flooding and inundation revealed by historical reconstruction: Fongafale Islet, Funafuti Atoll, Tuvalu. Global and Planetary Change, 57(3), 407-416.

67
Annex on detailed methodology (Volume II of the report): Annex 1 - Climate change and Pacific Islands
Annex 2 - Sea Level Rise and Coastal Protection
Annex 3 - Managing Water Resources and Flooding
Annex 4 - Adaptation for Infrastructure
Annex 5 - Improving the Resilience of Buildings to Tropical Cyclones
i https://www.humanitarianresponse.info/en/system/files/documents/files/el_Niño_infographic_20150609.pdf
ii http://erccportal.jrc.ec.europa.eu/getdailymap/docId/1286
iii http://www.unescap.org/resources/el-Niño-20142015-impact-outlook-and-policy-implications-pacific-islands-advisory-note
iv http://www.unescap.org/resources/el-Niño-20142015-impact-outlook-and-policy-implications-pacific-islands-advisory-note


worldbank.org/PacificPossible