Embed Size (px)
Citation preview
CLIMATE ATTRIBUTION OF ENVIRONMENTAL CATASTROPHES
Professor Ted Shepherd, Grantham Chair of Climate ScienceDepartment of Meteorology, University of Reading
METEOROLOGY
2020
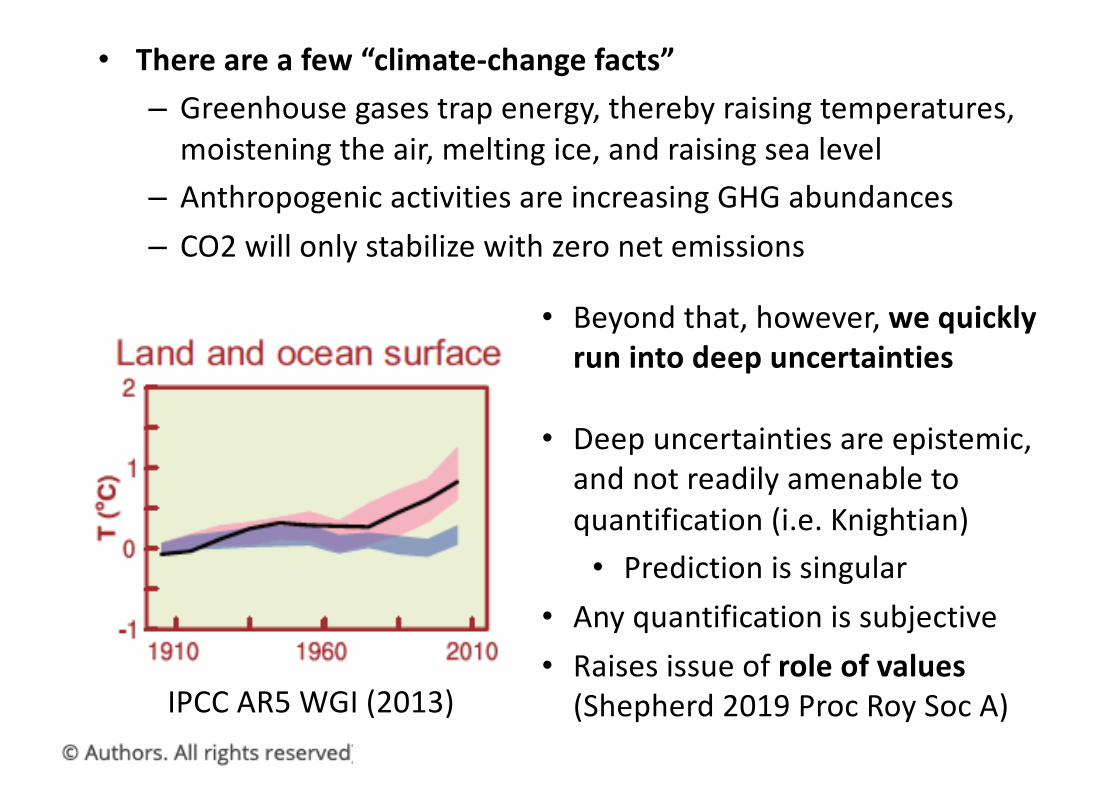
• There are a few “climate-change facts”– Greenhouse gases trap energy, thereby raising temperatures,
moistening the air, melting ice, and raising sea level– Anthropogenic activities are increasing GHG abundances– CO2 will only stabilize with zero net emissions
IPCC AR5 WGI (2013)
• Beyond that, however, we quickly run into deep uncertainties
• Deep uncertainties are epistemic, and not readily amenable to quantification (i.e. Knightian)• Prediction is singular
• Any quantification is subjective• Raises issue of role of values
(Shepherd 2019 Proc Roy Soc A)
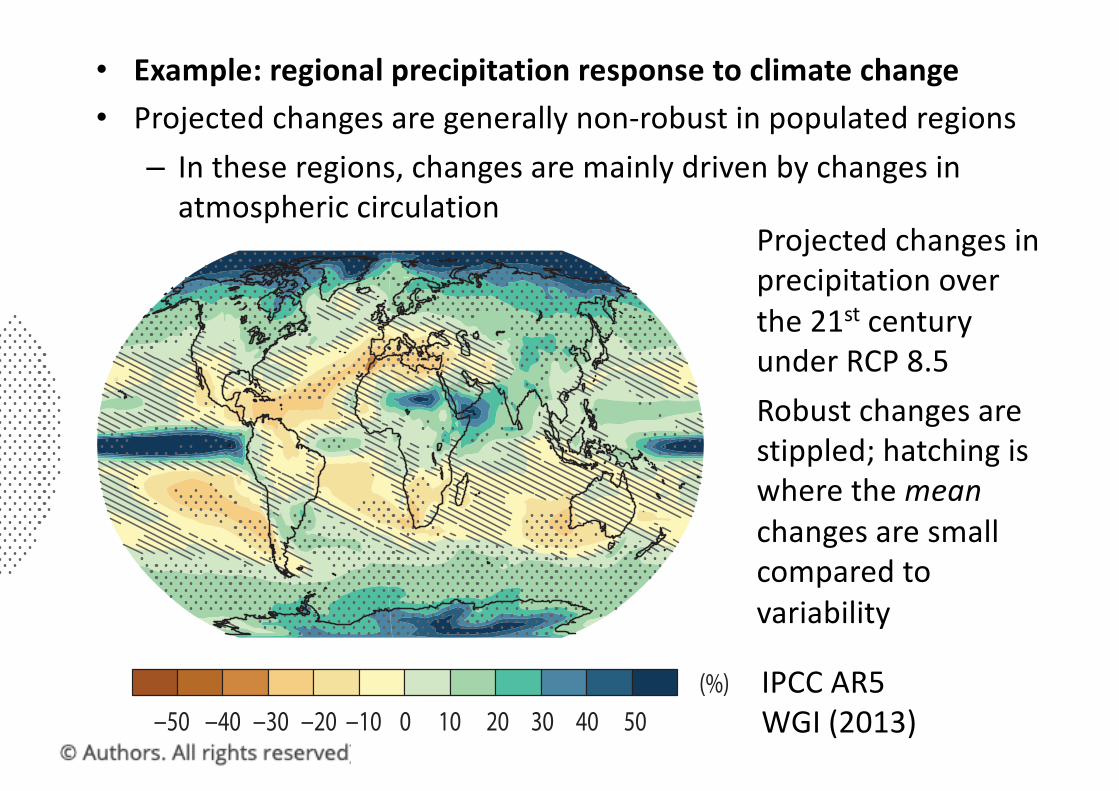
• Example: regional precipitation response to climate change • Projected changes are generally non-robust in populated regions
– In these regions, changes are mainly driven by changes in atmospheric circulation
IPCC AR5 WGI (2013)!20 !10!30!50 !40 0 10 20 30 40 50!0.5!1!2 !1.5 0 1 1.5 2 3 4 5 7 9 110.5
a bChange in surface temperature Change in precipitation
(°C) (%)
Projected changes in precipitation over the 21st century under RCP 8.5Robust changes are stippled; hatching is where the meanchanges are small compared to variability
• Every extreme event is unique– Heraclitus: “No man ever steps in the same river twice”
• We can either consider it as a singular event (case studyperspective) or create an ‘event class’ to produce a large sample size (statistical perspective)– The first approach sacrifices generalizability for specificity– The second approach: the opposite
• This sort of dichotomy, between specificity and generality, occurs in many areas of science (even weather vs climate)
• The concept of ‘extreme’ has two distinct meanings: can be extreme in impact, or extreme in rareness– Only the latter lends itself to a statistical approach– The two are not equivalent! (e.g. van der Wiel 2020 ERL)
The heart of the matter
• From the Good Practice Guidance Paper on Detection and Attribution Related to Anthropogenic Climate Change (IPCC 2010)
• Recommendations work against any consideration of the local (Shepherd & Sobel, CSSAAME, forthcoming)– “Detaches knowledge from meaning” (Jasanoff 2010)
• Interestingly, WGII defines climate change as any observed change, without requiring attribution to anthropogenic forcing!– Needed to avoid the “confidence straightjacket”
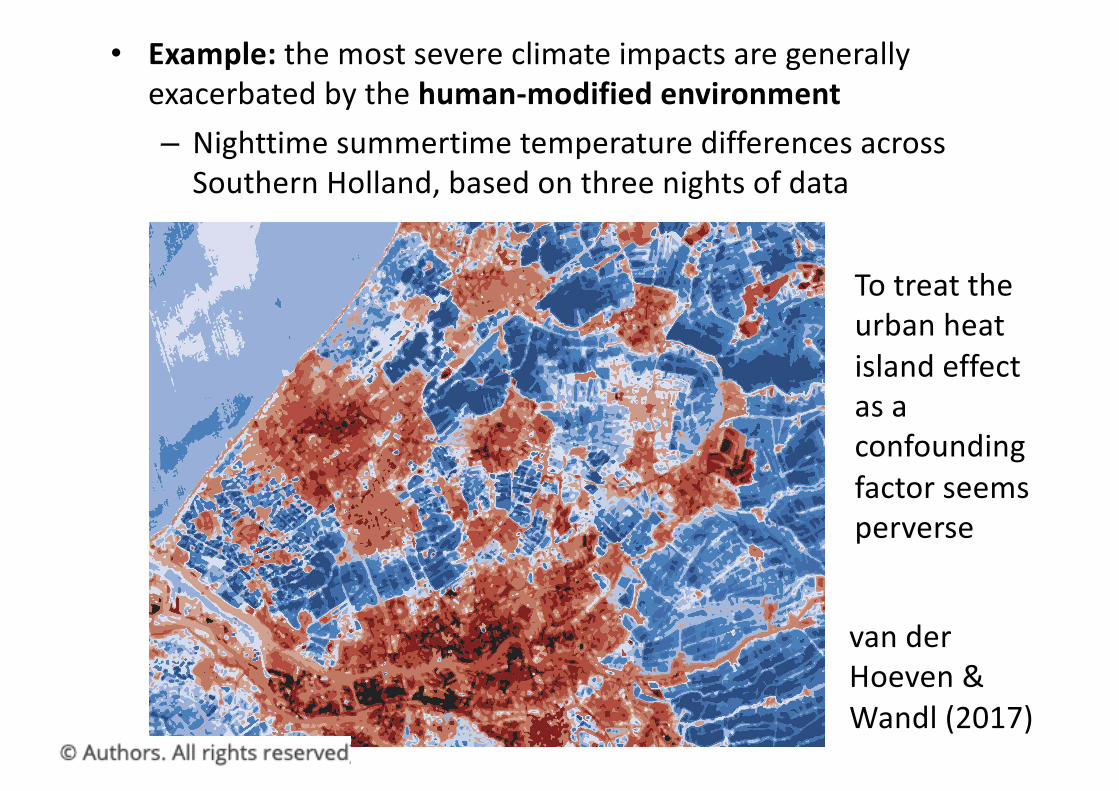
• Example: the most severe climate impacts are generally exacerbated by the human-modified environment– Nighttime summertime temperature differences across
Southern Holland, based on three nights of data
van der Hoeven & Wandl (2017)
To treat the urban heat island effect as a confounding factor seems perverse
• “A paradigm can…insulate the [scientific] community from those socially important problems that …cannot be stated in terms of the conceptual and instrumental tools the paradigm supplies” (Thomas Kuhn, The Structure of Scientific Revolutions, first published 1962)
• The societally relevant question is not “What will happen?” but “What is the impact of particular actions under an uncertain regional climate change?” (Shepherd 2019 Proc. Roy. Soc. A)
• Epistemic uncertainties are different from aleatoric (random) uncertainties, and cannot be treated in the same way
– Epistemic uncertainties are intrinsically subjective– Raises issue of trust and intelligibility (cf. Onora O’Neill)
• One approach is storylines: physically-based unfoldings of past climate or weather events, or of plausible future events or pathways (Shepherd et al. 2018 Climatic Change): causal accounts
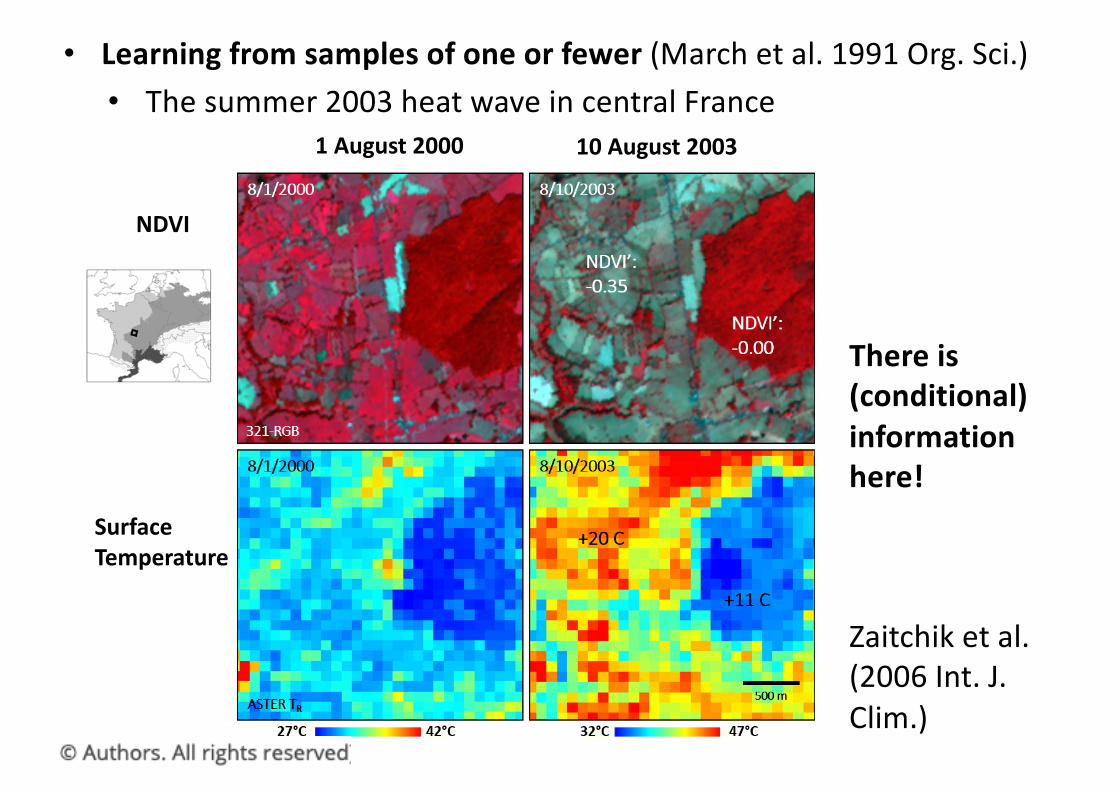
• Learning from samples of one or fewer (March et al. 1991 Org. Sci.)• The summer 2003 heat wave in central France
Zaitchik et al. (2006 Int. J. Clim.)
1 August 2000 10 August 2003
NDVI
Surface Temperature
There is (conditional) information here!
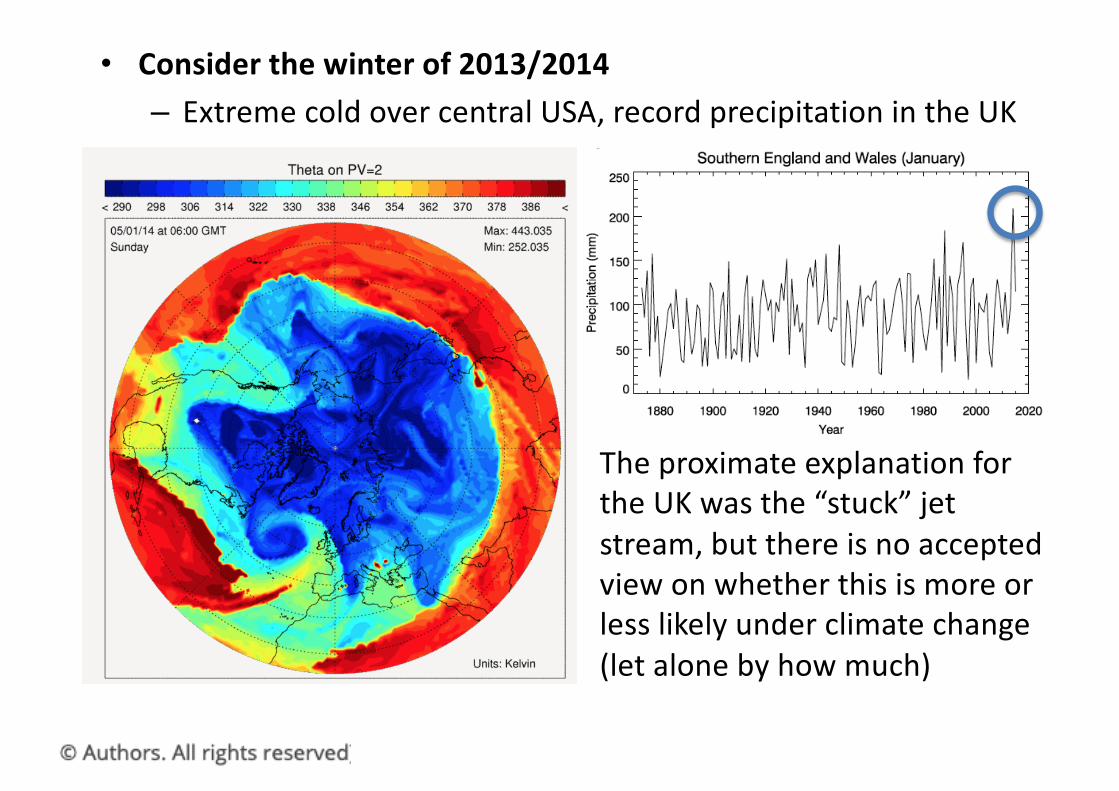
• Consider the winter of 2013/2014– Extreme cold over central USA, record precipitation in the UK
The proximate explanation for the UK was the “stuck” jet stream, but there is no accepted view on whether this is more or less likely under climate change (let alone by how much)

• Flooding in southern England in January 2014 was associated with this strong and persistent jet stream
• Left: Estimate of change in likelihood of this dynamical regime (ZO state) from weather@home; either no change, or very large change, depending on the estimated change in SSTs
• Right: The resulting circulation changes make the difference between increased and decreased flood risk
Schaller et al. (2016 Nature Climate Change)
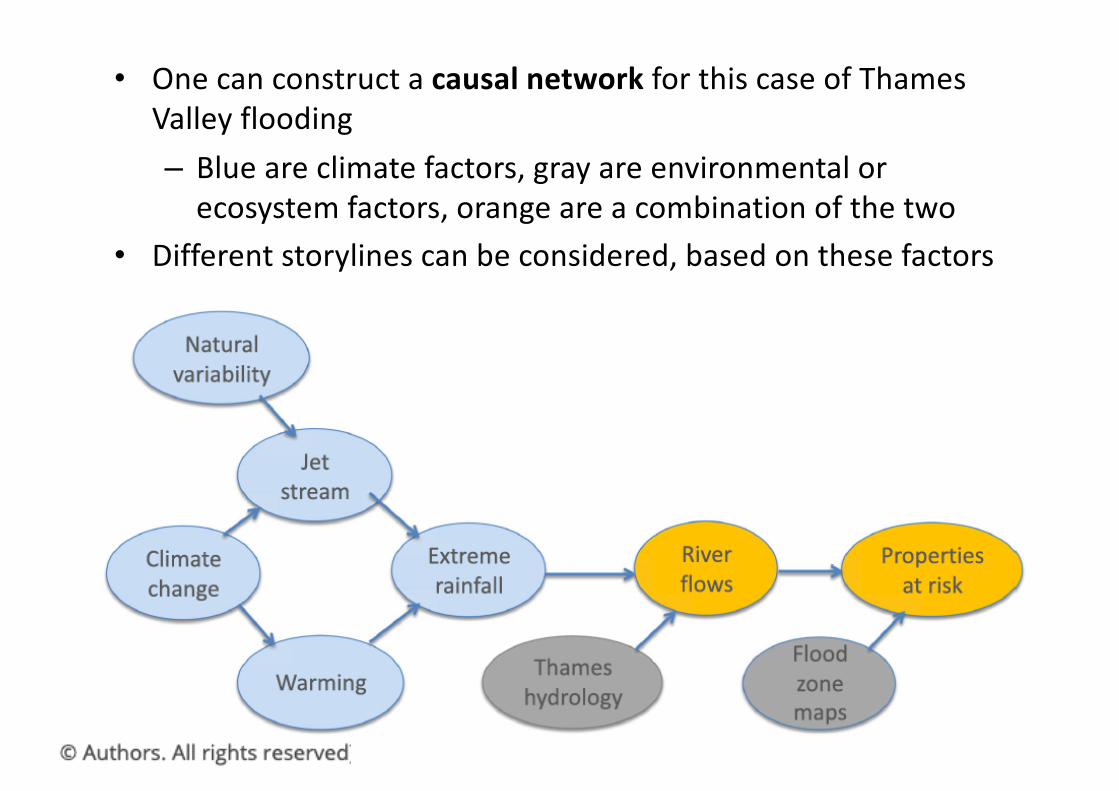
• One can construct a causal network for this case of Thames Valley flooding– Blue are climate factors, gray are environmental or
ecosystem factors, orange are a combination of the two• Different storylines can be considered, based on these factors
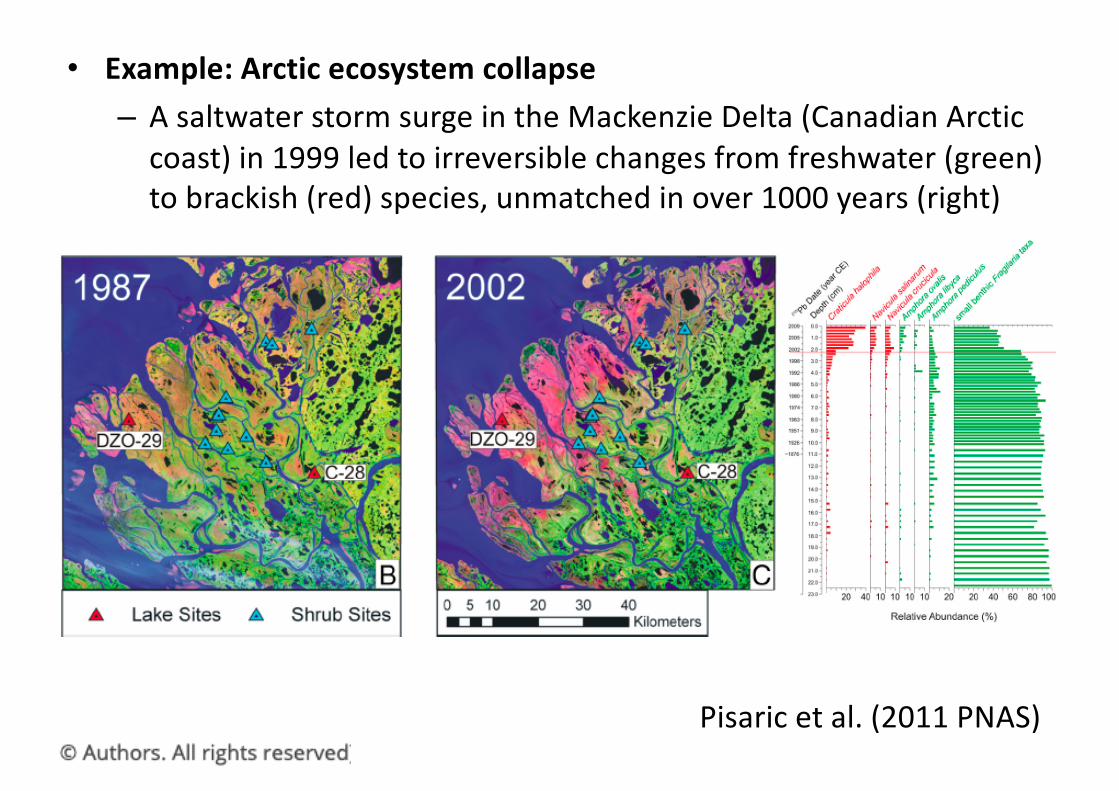
• Example: Arctic ecosystem collapse– A saltwater storm surge in the Mackenzie Delta (Canadian Arctic
coast) in 1999 led to irreversible changes from freshwater (green) to brackish (red) species, unmatched in over 1000 years (right)
Pisaric et al. (2011 PNAS)
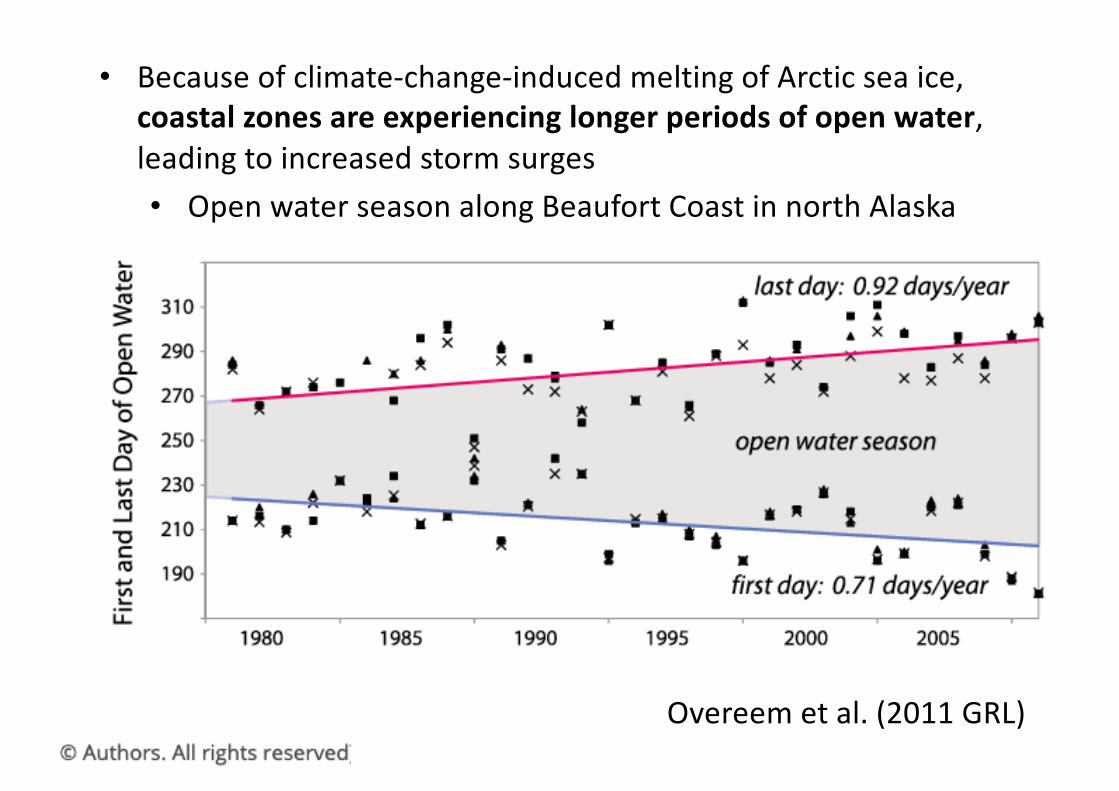
• Because of climate-change-induced melting of Arctic sea ice, coastal zones are experiencing longer periods of open water, leading to increased storm surges• Open water season along Beaufort Coast in north Alaska
Overeem et al. (2011 GRL)
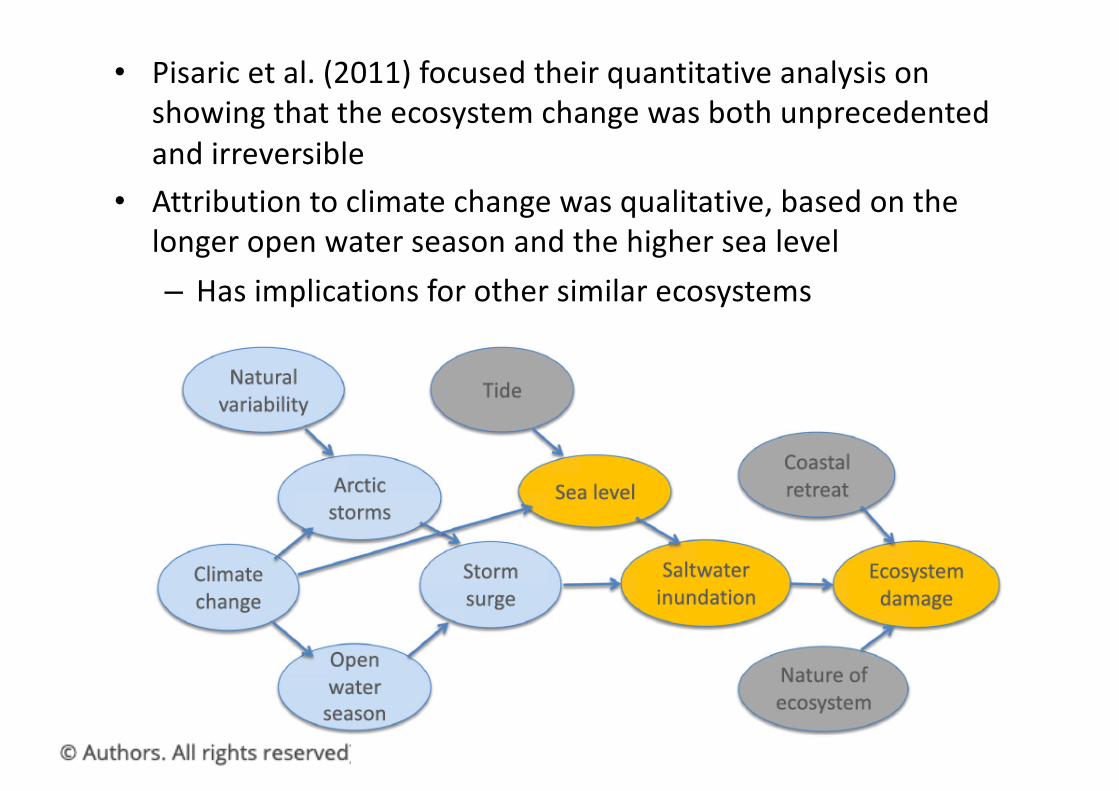
• Pisaric et al. (2011) focused their quantitative analysis on showing that the ecosystem change was both unprecedented and irreversible
• Attribution to climate change was qualitative, based on the longer open water season and the higher sea level– Has implications for other similar ecosystems
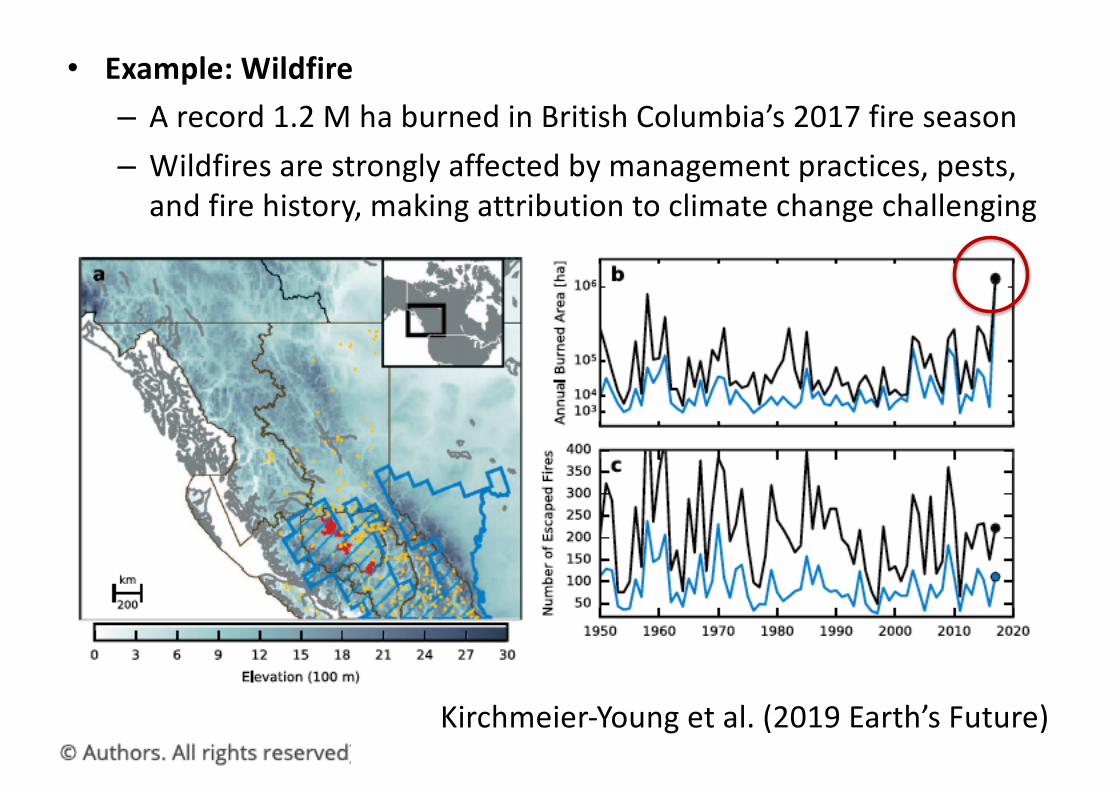
• Example: Wildfire– A record 1.2 M ha burned in British Columbia’s 2017 fire season– Wildfires are strongly affected by management practices, pests,
and fire history, making attribution to climate change challenging
Kirchmeier-Young et al. (2019 Earth’s Future)
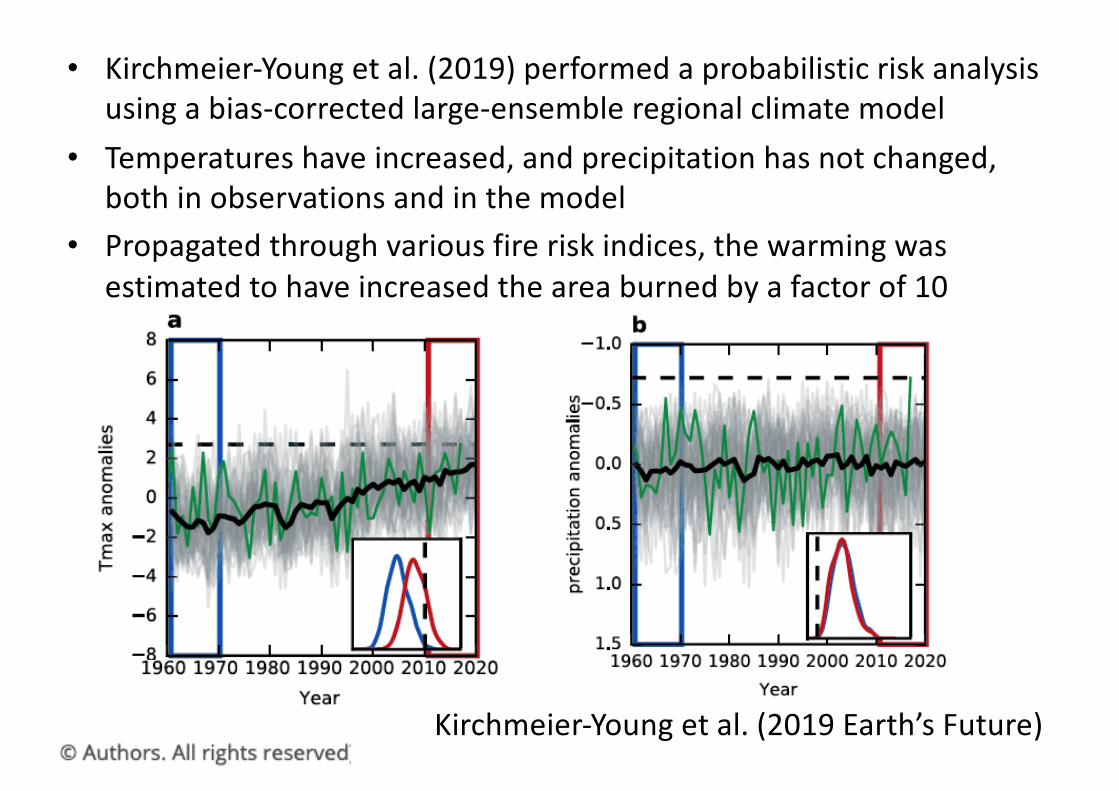
• Kirchmeier-Young et al. (2019) performed a probabilistic risk analysis using a bias-corrected large-ensemble regional climate model
• Temperatures have increased, and precipitation has not changed, both in observations and in the model
• Propagated through various fire risk indices, the warming was estimated to have increased the area burned by a factor of 10
Kirchmeier-Young et al. (2019 Earth’s Future)
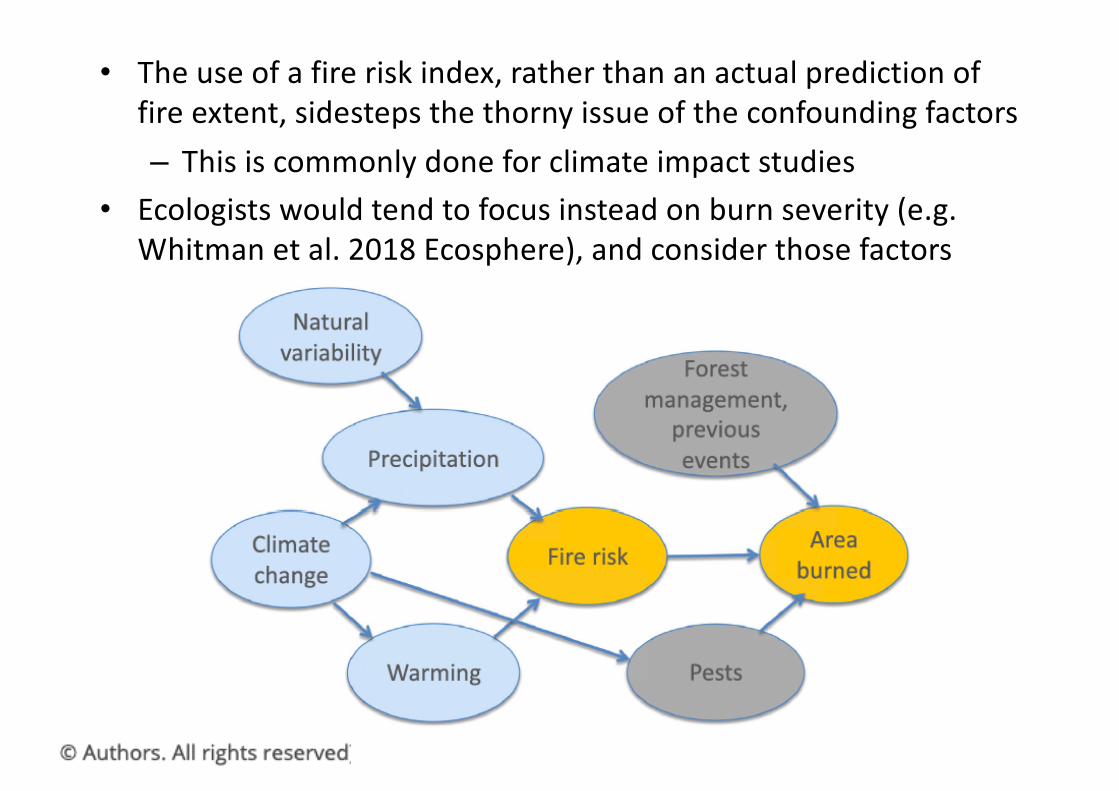
• The use of a fire risk index, rather than an actual prediction of fire extent, sidesteps the thorny issue of the confounding factors– This is commonly done for climate impact studies
• Ecologists would tend to focus instead on burn severity (e.g. Whitman et al. 2018 Ecosphere), and consider those factors
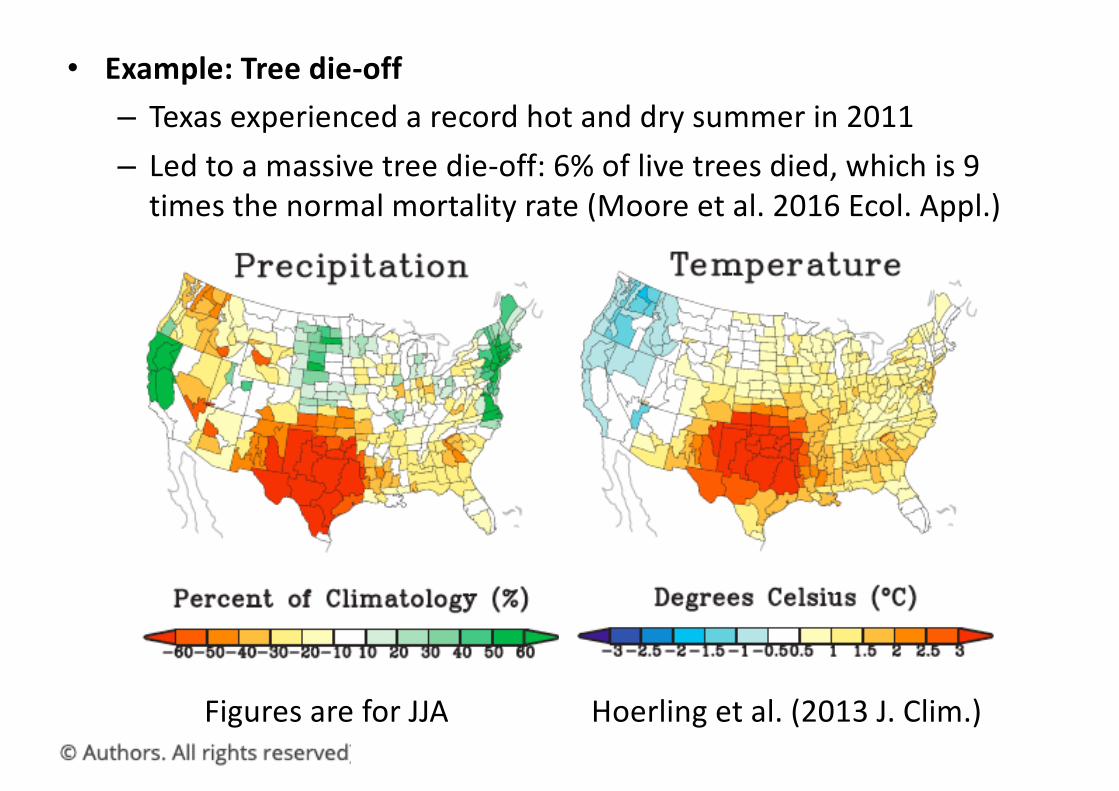
• Example: Tree die-off– Texas experienced a record hot and dry summer in 2011– Led to a massive tree die-off: 6% of live trees died, which is 9
times the normal mortality rate (Moore et al. 2016 Ecol. Appl.)
Hoerling et al. (2013 J. Clim.)Figures are for JJA

• But “drought and heat are no strangers to Texas” (Hoerling et al.)• Hoerling et al. (2013) used climate models to perform attribution
Hoerling et al. (2013 J. Clim.)Figures are for JJA
All of the drought, and 80% of the heat, attributed to La Niña
Only 20% of the heat attributed to climate change
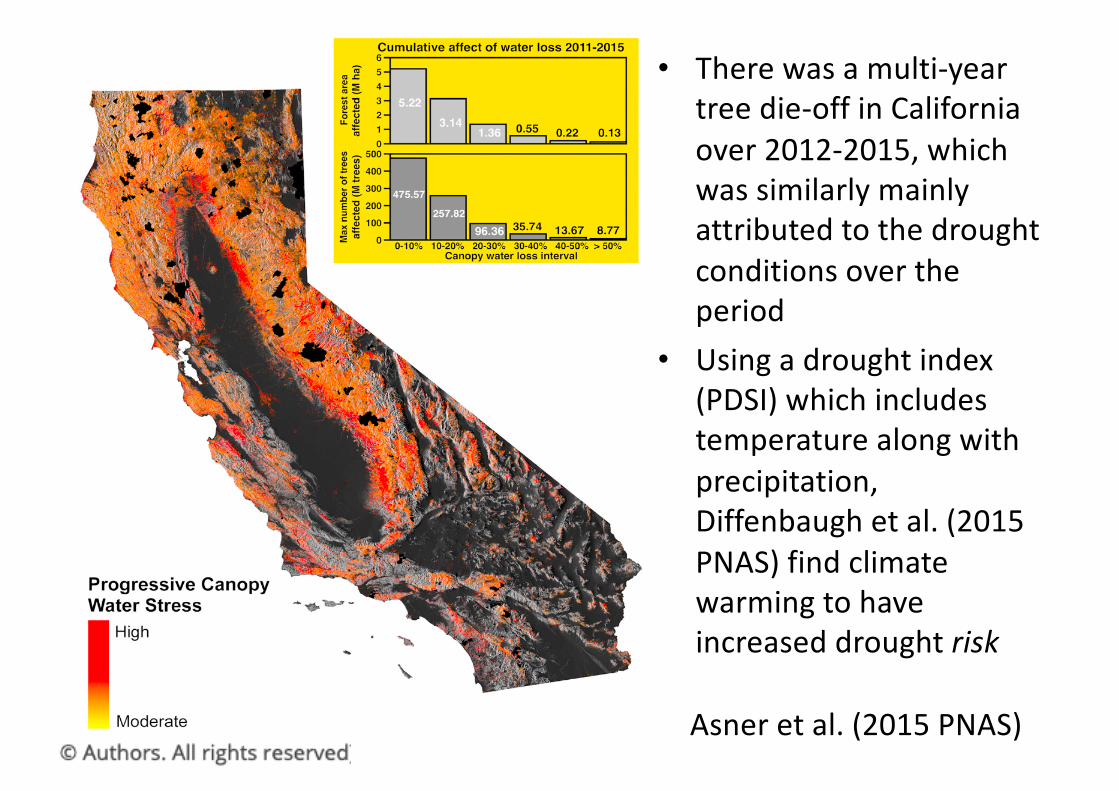
• There was a multi-year tree die-off in California over 2012-2015, which was similarly mainly attributed to the drought conditions over the period
• Using a drought index (PDSI) which includes temperature along with precipitation, Diffenbaugh et al. (2015 PNAS) find climate warming to have increased drought risk
Asner et al. (2015 PNAS)
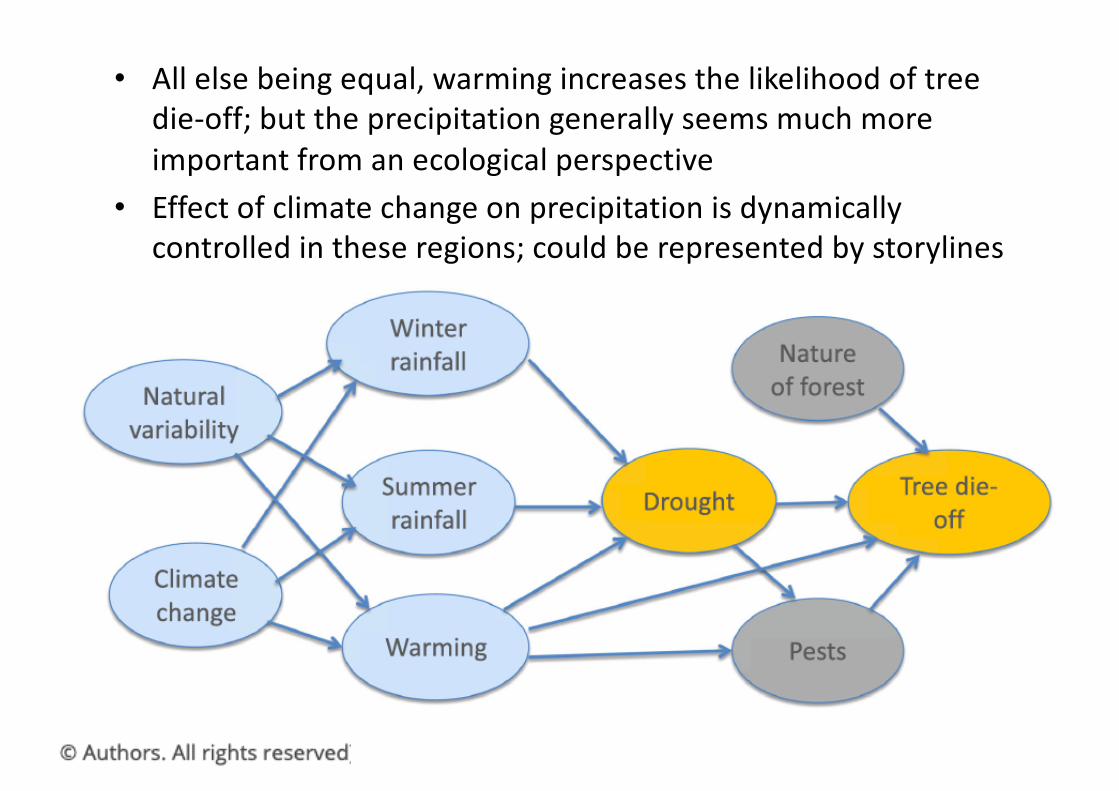
• All else being equal, warming increases the likelihood of tree die-off; but the precipitation generally seems much more important from an ecological perspective
• Effect of climate change on precipitation is dynamically controlled in these regions; could be represented by storylines
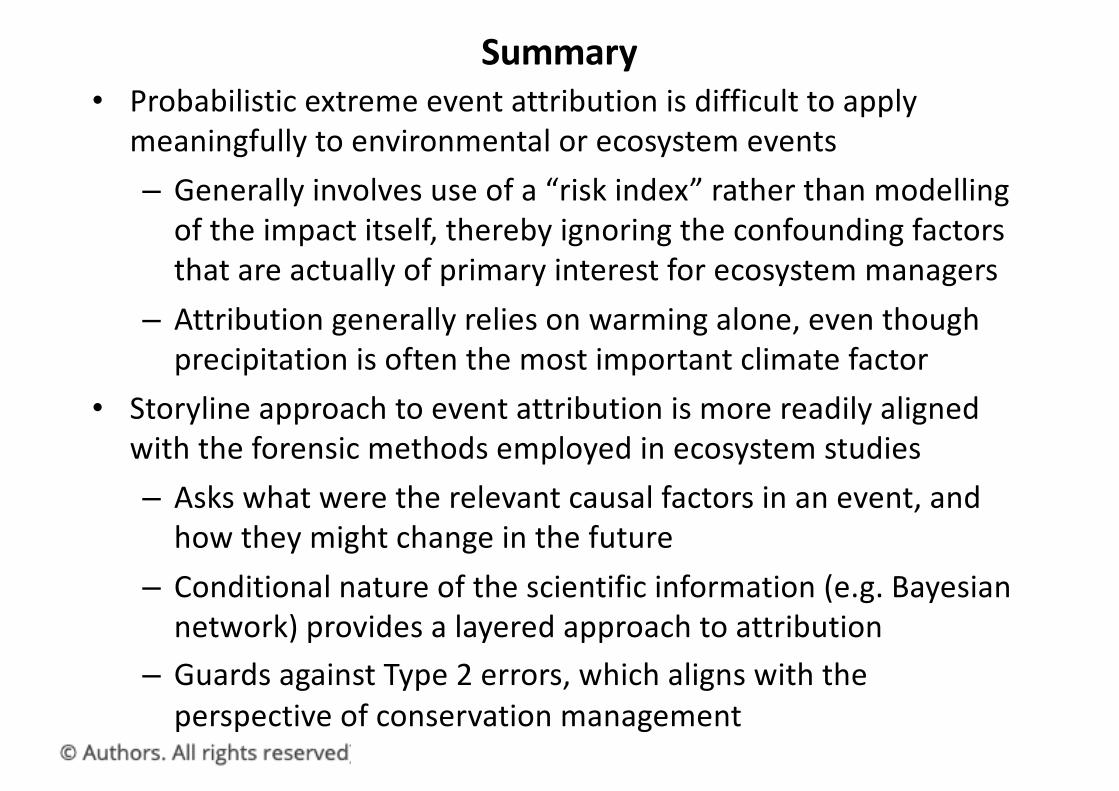
• Probabilistic extreme event attribution is difficult to apply meaningfully to environmental or ecosystem events– Generally involves use of a “risk index” rather than modelling
of the impact itself, thereby ignoring the confounding factors that are actually of primary interest for ecosystem managers
– Attribution generally relies on warming alone, even though precipitation is often the most important climate factor
• Storyline approach to event attribution is more readily aligned with the forensic methods employed in ecosystem studies– Asks what were the relevant causal factors in an event, and
how they might change in the future– Conditional nature of the scientific information (e.g. Bayesian
network) provides a layered approach to attribution– Guards against Type 2 errors, which aligns with the
perspective of conservation management
Summary