Embed Size (px)
Citation preview
Climate Change 101
Presentation for USBR Managers
Kevin Werner
Western Region Climate Service Director
David Easterling
Chief, NCDC Global Climate Applications Division
Paul Miller
Hydrologist, Colorado Basin River Forecast
Center
Outline
• Changing Climate
• Impact on Western US Watersheds
2
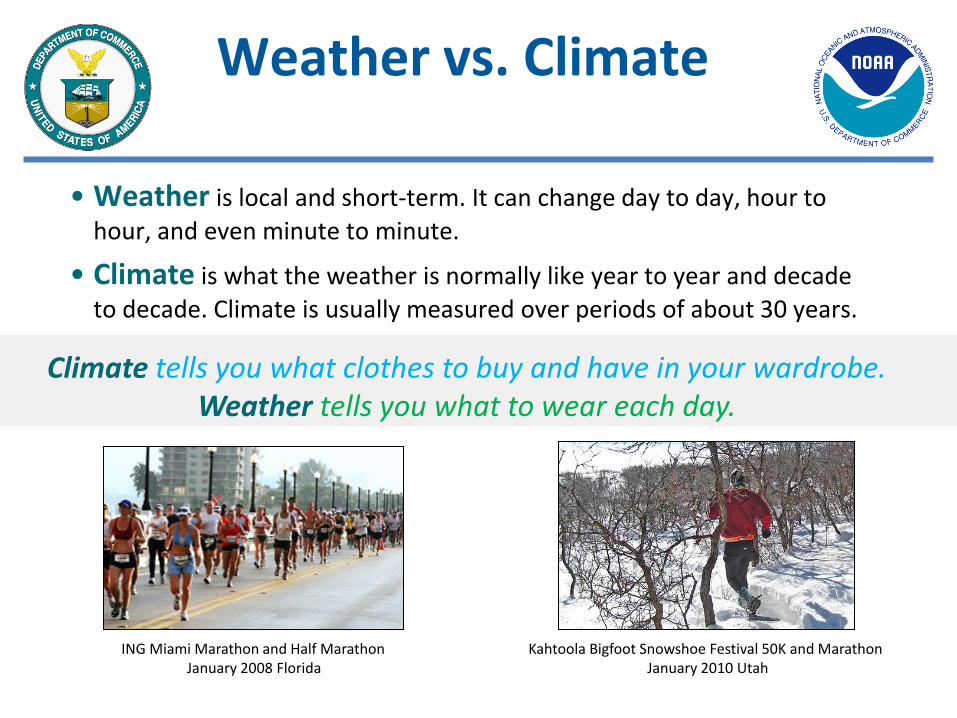
Weather vs. Climate
• Weather is local and short-term. It can change day to day, hour to
hour, and even minute to minute.
• Climate is what the weather is normally like year to year and decade
to decade. Climate is usually measured over periods of about 30 years.
Kahtoola Bigfoot Snowshoe Festival 50K and Marathon January 2010 Utah
ING Miami Marathon and Half Marathon January 2008 Florida
Climate tells you what clothes to buy and have in your wardrobe. Weather tells you what to wear each day.
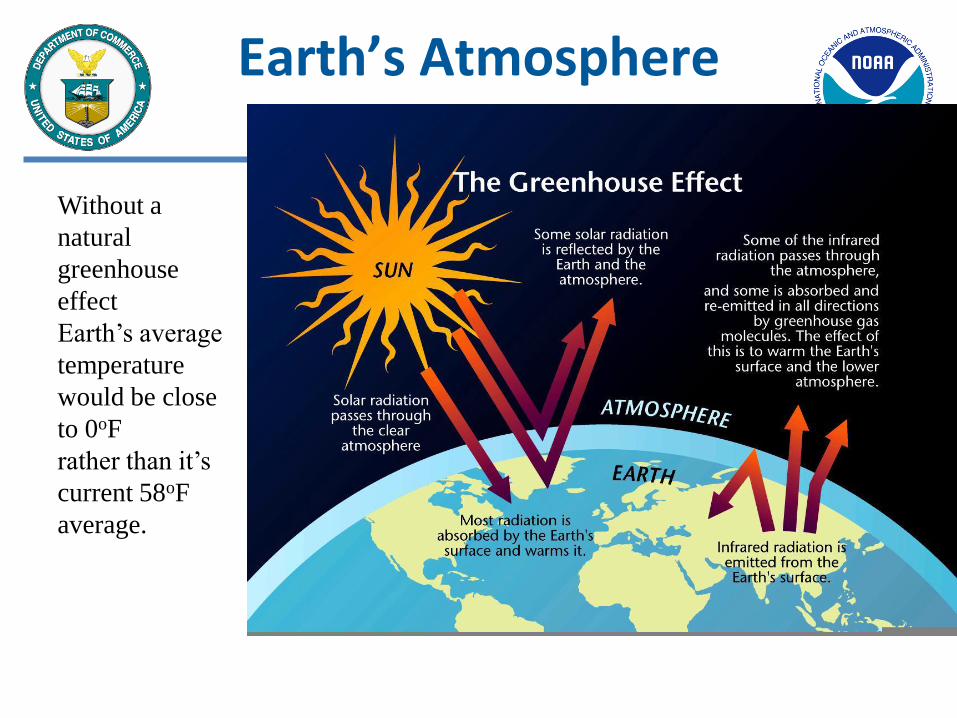
Earth’s Atmosphere
Without a
natural
greenhouse
effect
Earth’s average
temperature
would be close
to 0oF
rather than it’s
current 58oF
average.
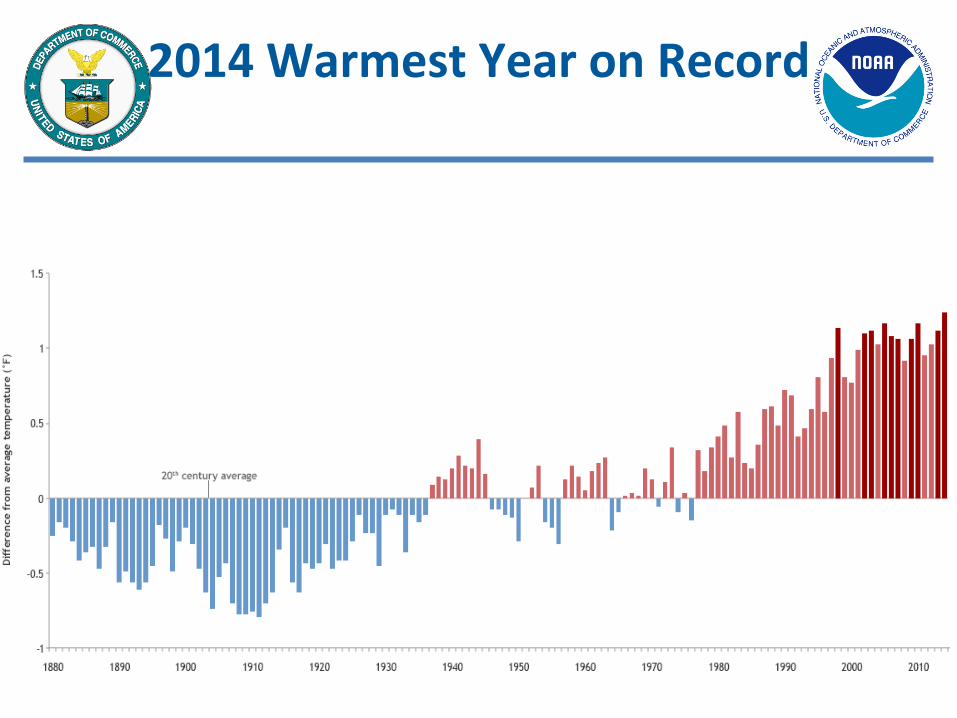
2014 Warmest Year on Record
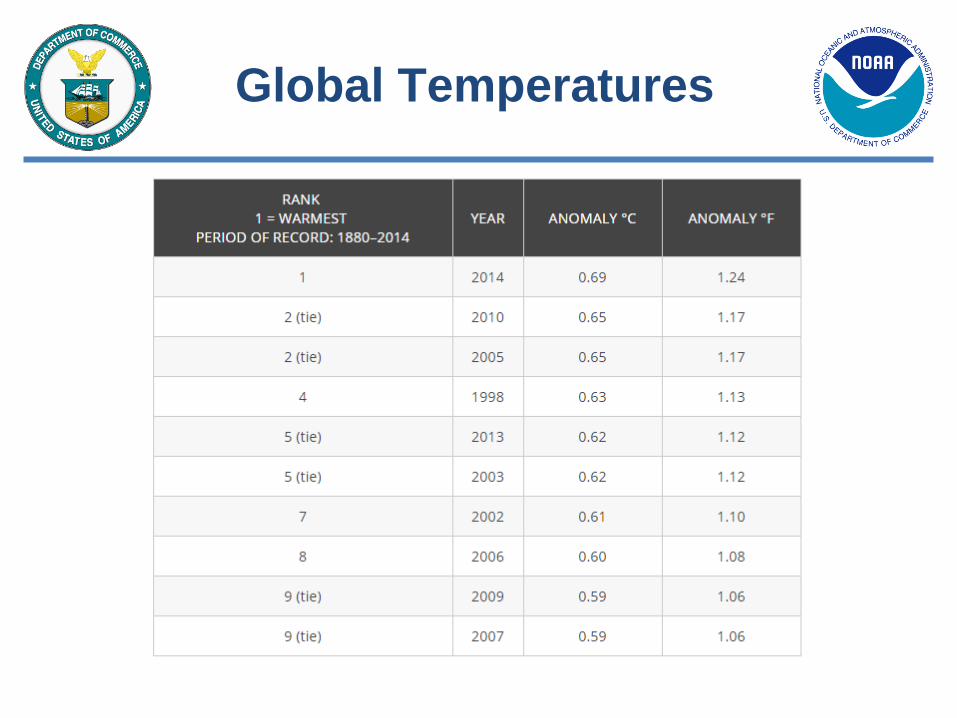
Global Temperatures
Source: http://www.ncdc.noaa.gov/sotc/global/
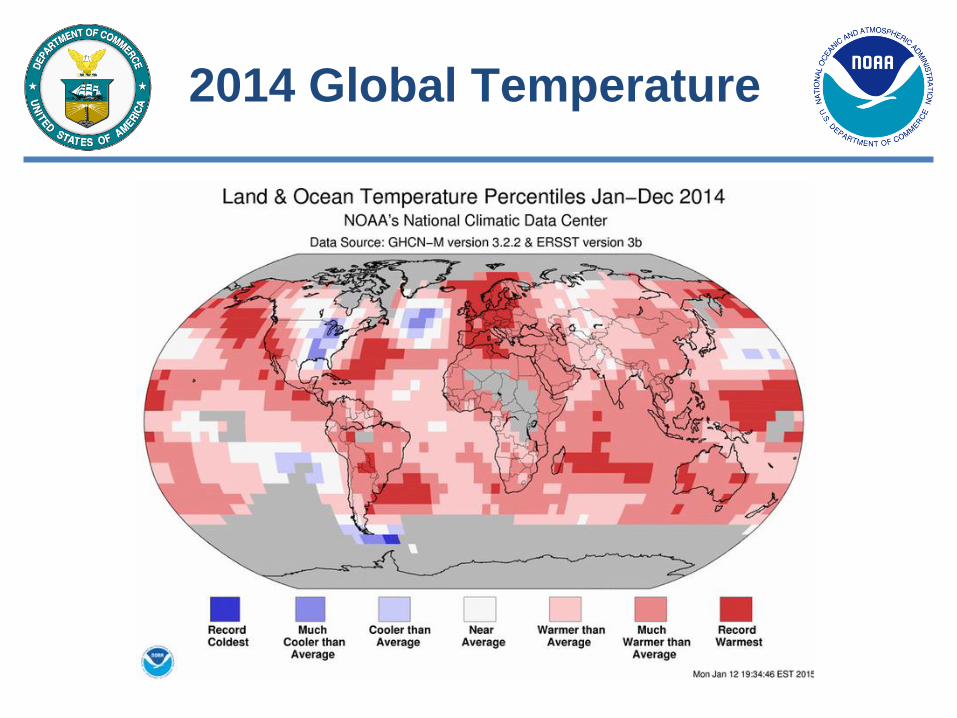
2014 Global Temperature
Source: http://www.ncdc.noaa.gov/sotc/global/
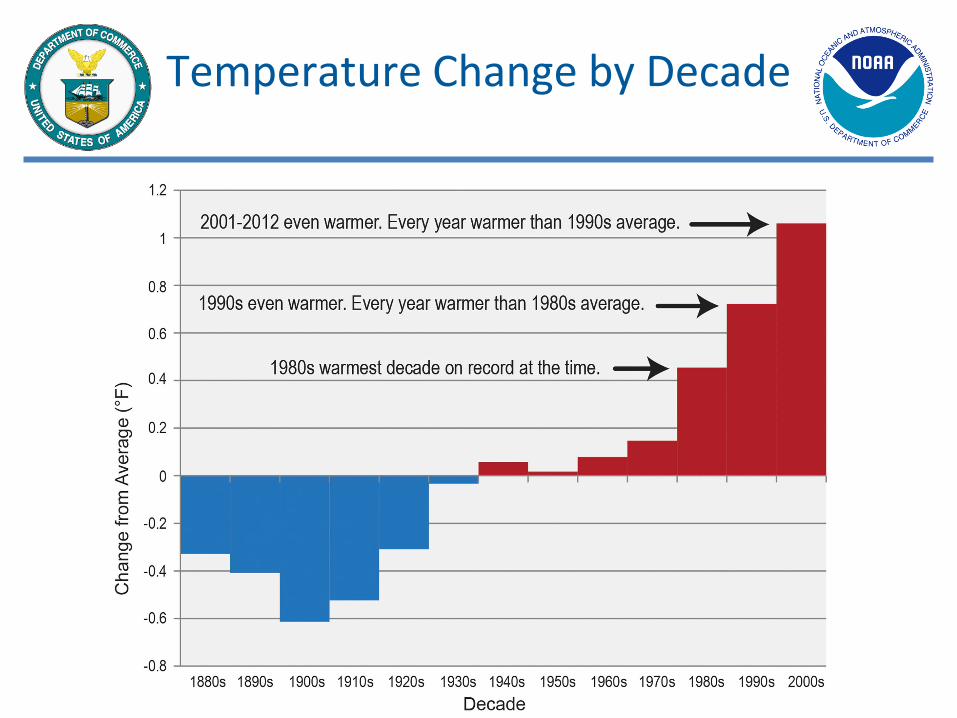
Temperature Change by Decade
Why is it warming? • Possible reasons ➢ The sun
➢ Heat release from earth itself into atmosphere (e.g. volcanos)
➢ Part of longer term variability
➢ Stuff in the atmosphere
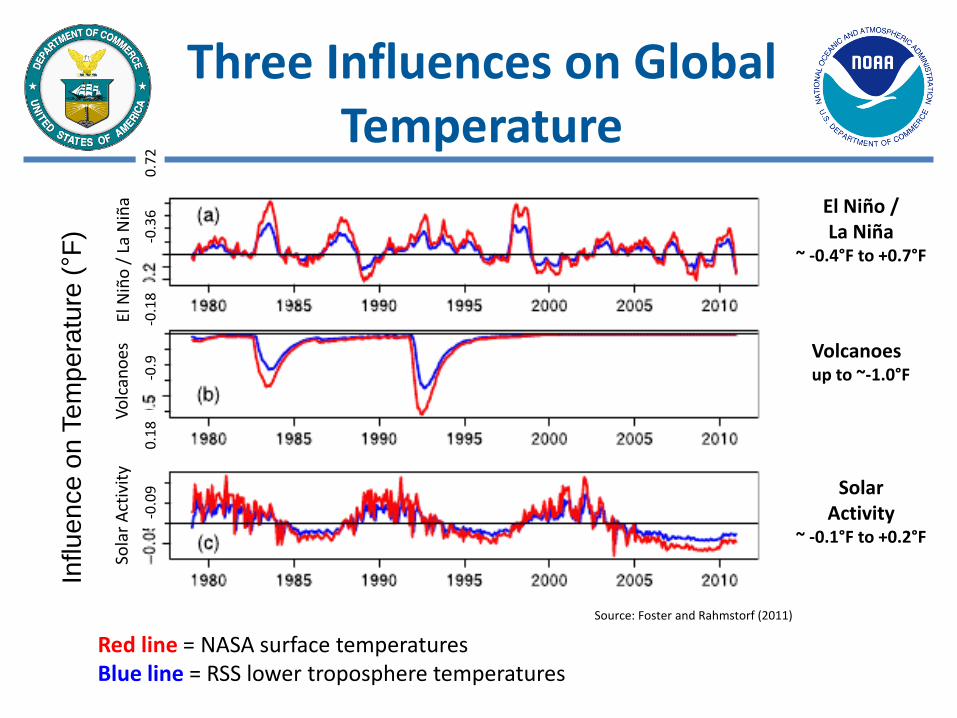
Solar Activity
~ -0.1°F to +0.2°F
Three Influences on Global Temperature
Red line = NASA surface temperatures Blue line = RSS lower troposphere temperatures
El N
iño
/ L
a N
iña
Vo
lcan
oes
So
lar
Act
ivit
y
Influ
en
ce
on
Te
mp
era
ture
(°F
)
Source: Foster and Rahmstorf (2011)
El Niño / La Niña
~ -0.4°F to +0.7°F
Volcanoes up to ~-1.0°F
-0.0
9
0.1
8
-0.3
6
0.7
2
-0.9
-0
.18
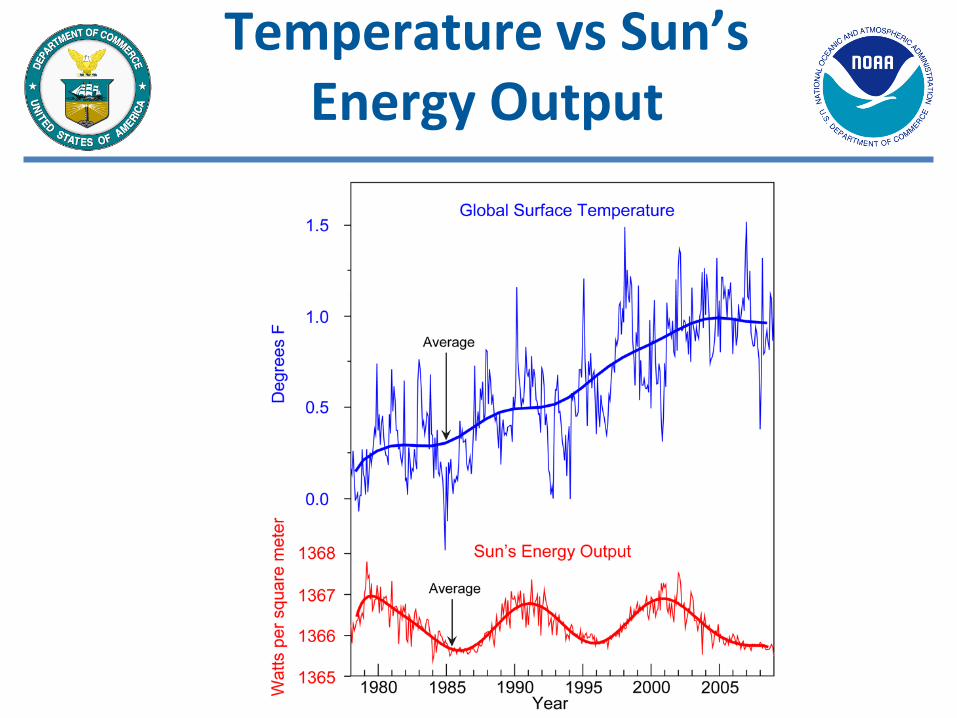
Temperature vs Sun’s Energy Output
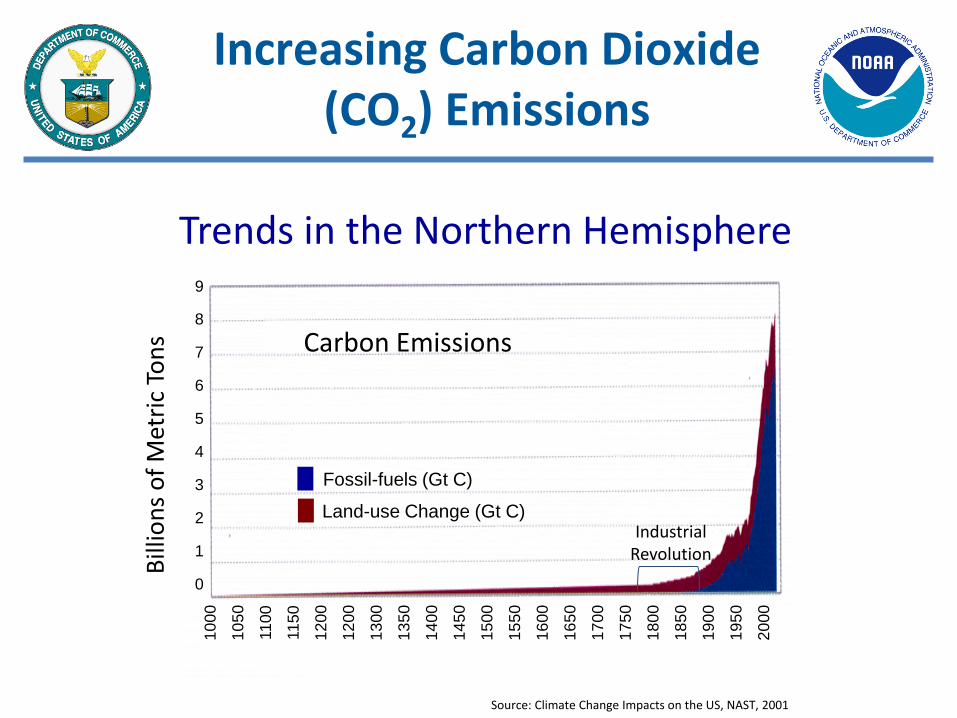
Source: Climate Change Impacts on the US, NAST, 2001
Trends in the Northern Hemisphere
Increasing Carbon Dioxide (CO2) Emissions
Industrial Revolution
Bill
ion
s o
f M
etri
c To
ns
9
8
7
6
5
4
3
2
1
0
Carbon Emissions
10
00
10
50
11
50
12
00
13
00
13
50
14
00
14
50
15
00
15
50
16
00
16
50
17
00
17
50
18
00
18
50
19
00
19
50
20
00
11
00
12
00
Fossil-fuels (Gt C)
Land-use Change (Gt C)
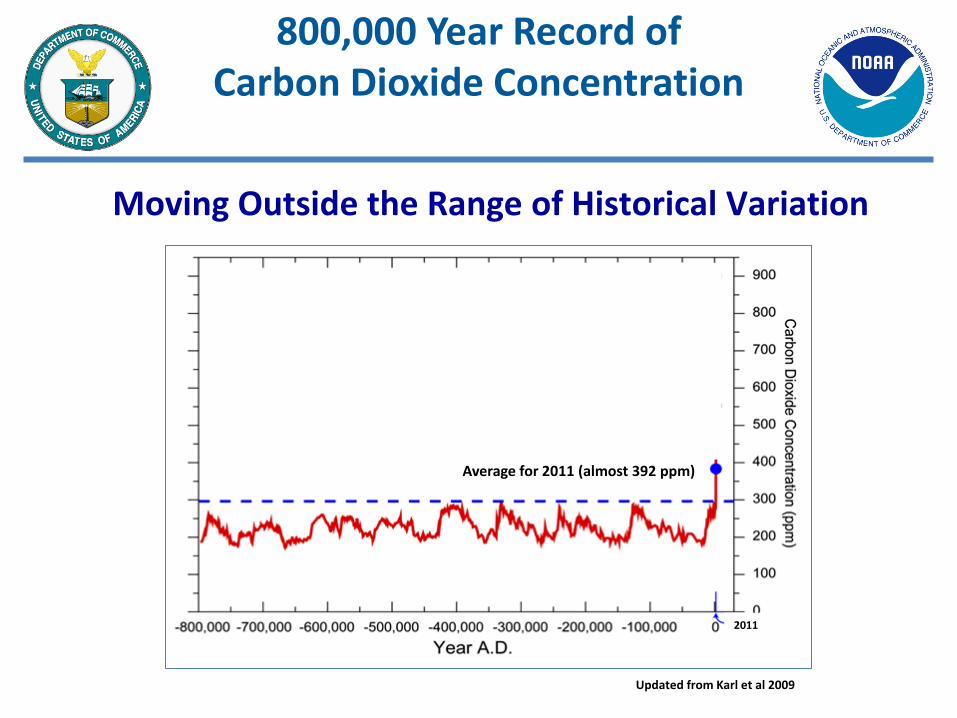
Moving Outside the Range of Historical Variation
800,000 Year Record of Carbon Dioxide Concentration
Average for 2011 (almost 392 ppm)
2011
Updated from Karl et al 2009
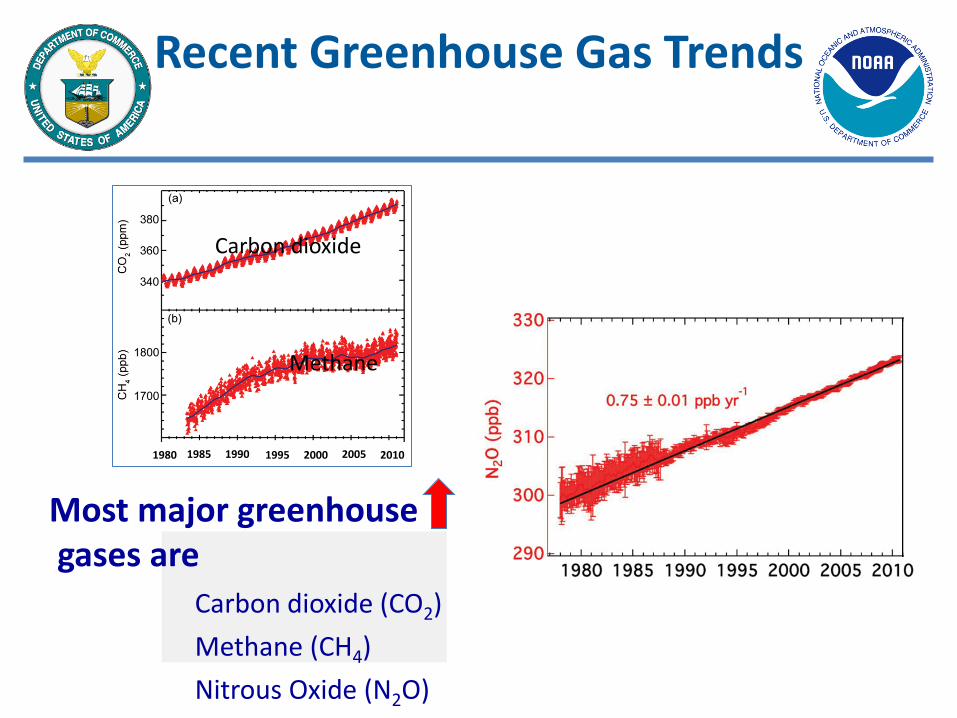
1980 1985 1990 1995 2000 2005 2010
Carbon dioxide (CO2)
Methane (CH4)
Nitrous Oxide (N2O)
Most major greenhouse gases are
Carbon dioxide
Nitrous Oxide Methane
Recent Greenhouse Gas Trends
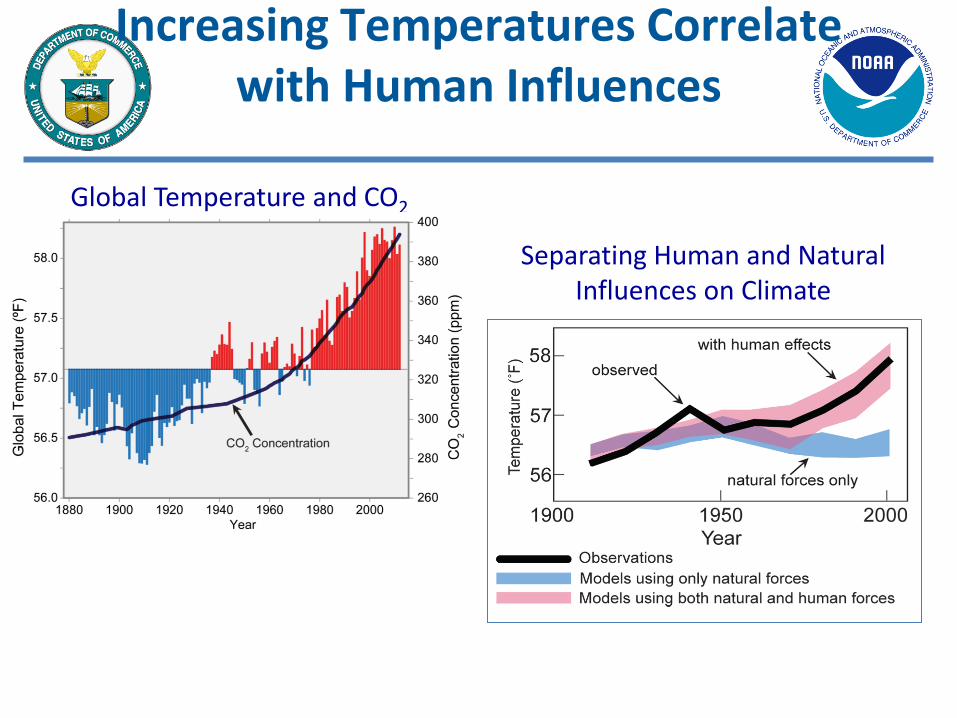
Increasing Temperatures Correlate with Human Influences
Separating Human and Natural Influences on Climate
Global Temperature and CO2
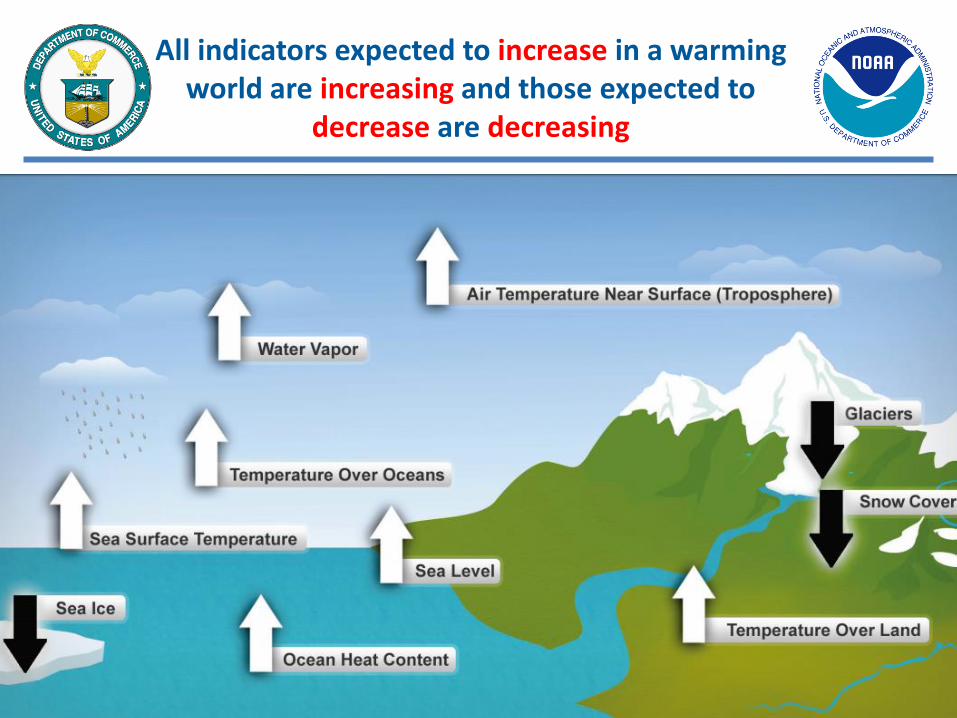
All indicators expected to increase in a warming world are increasing and those expected to
decrease are decreasing
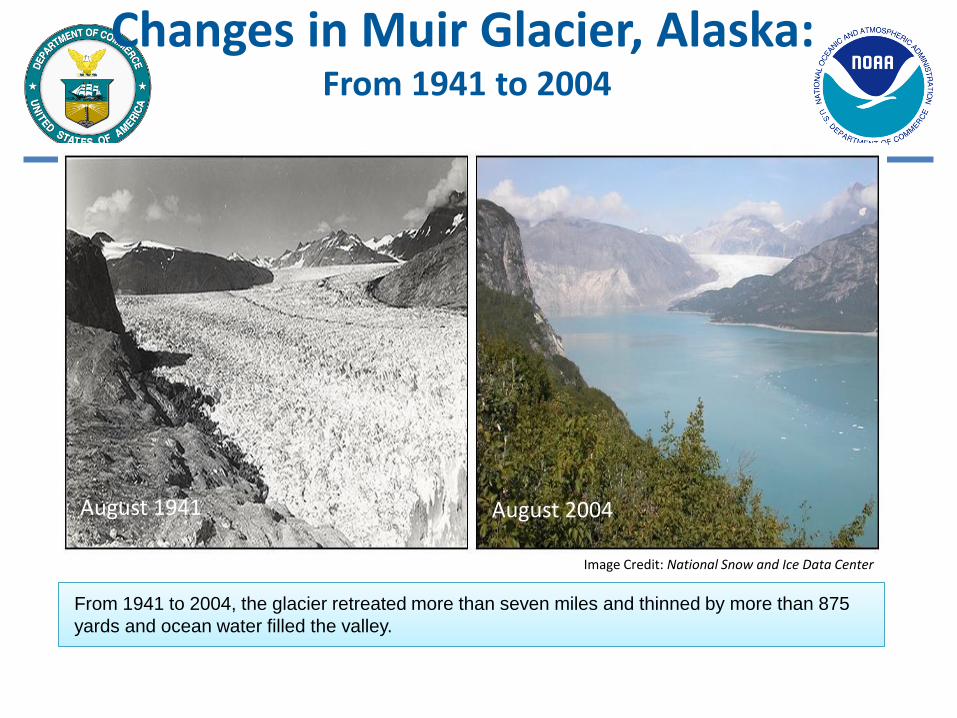
August 1941 August 2004
Changes in Muir Glacier, Alaska: From 1941 to 2004
From 1941 to 2004, the glacier retreated more than seven miles and thinned by more than 875
yards and ocean water filled the valley.
Image Credit: National Snow and Ice Data Center
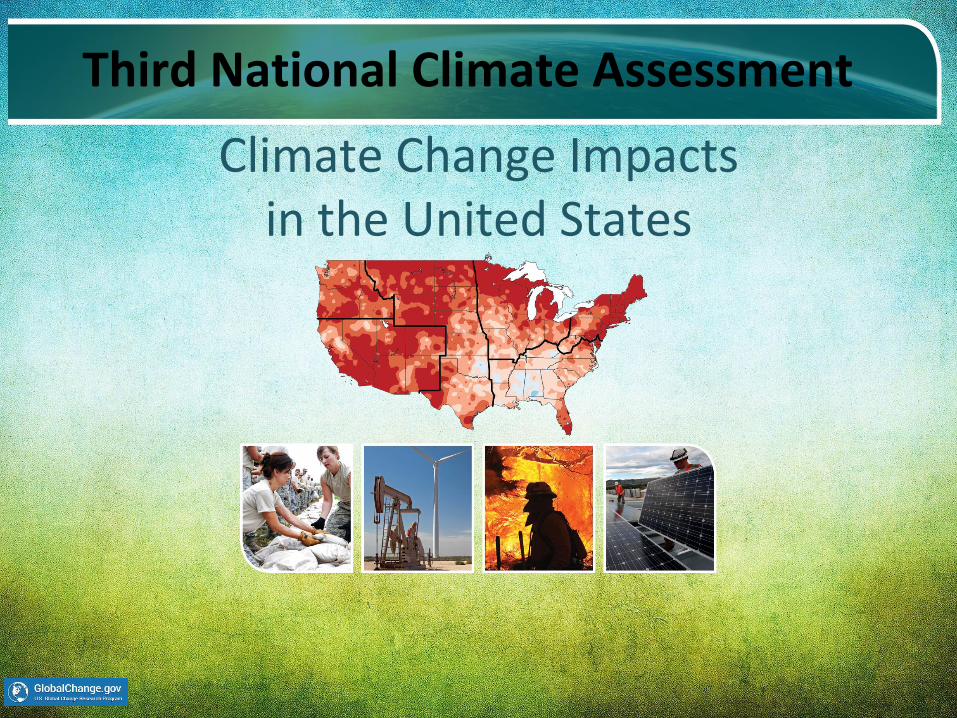
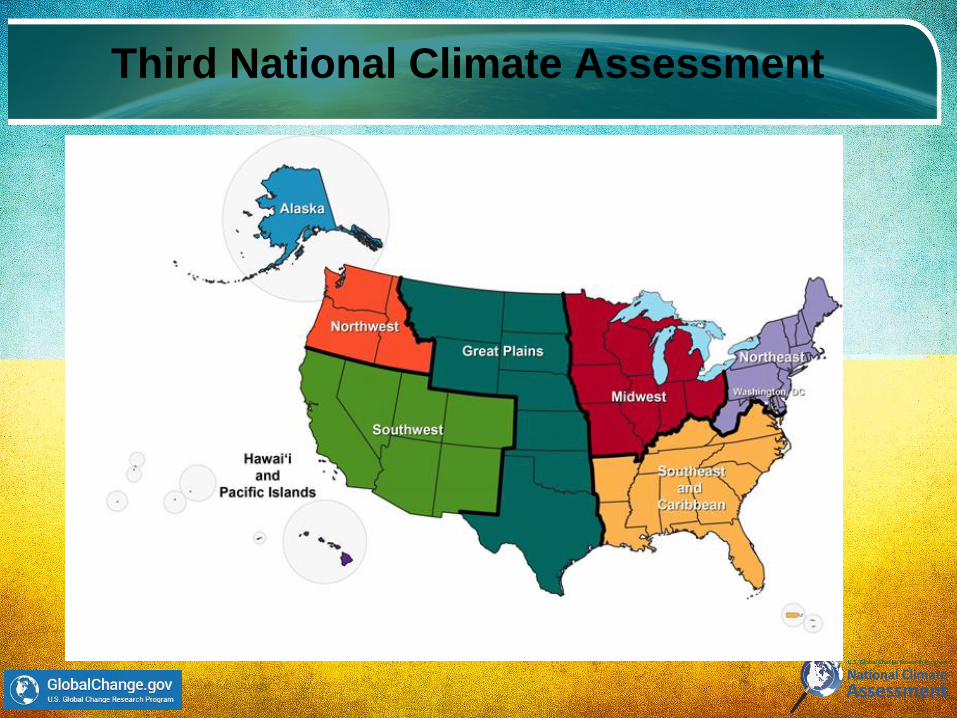
Climate Change Impacts in the United States
Third National Climate Assessment
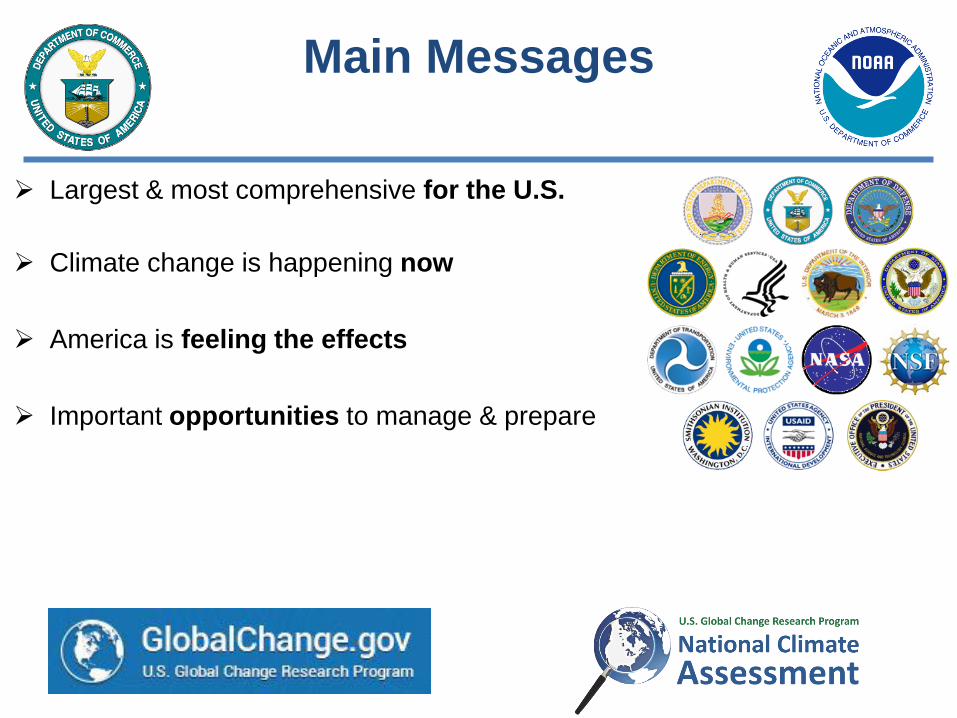
Largest & most comprehensive for the U.S.
Climate change is happening now
America is feeling the effects
Important opportunities to manage & prepare
Main Messages
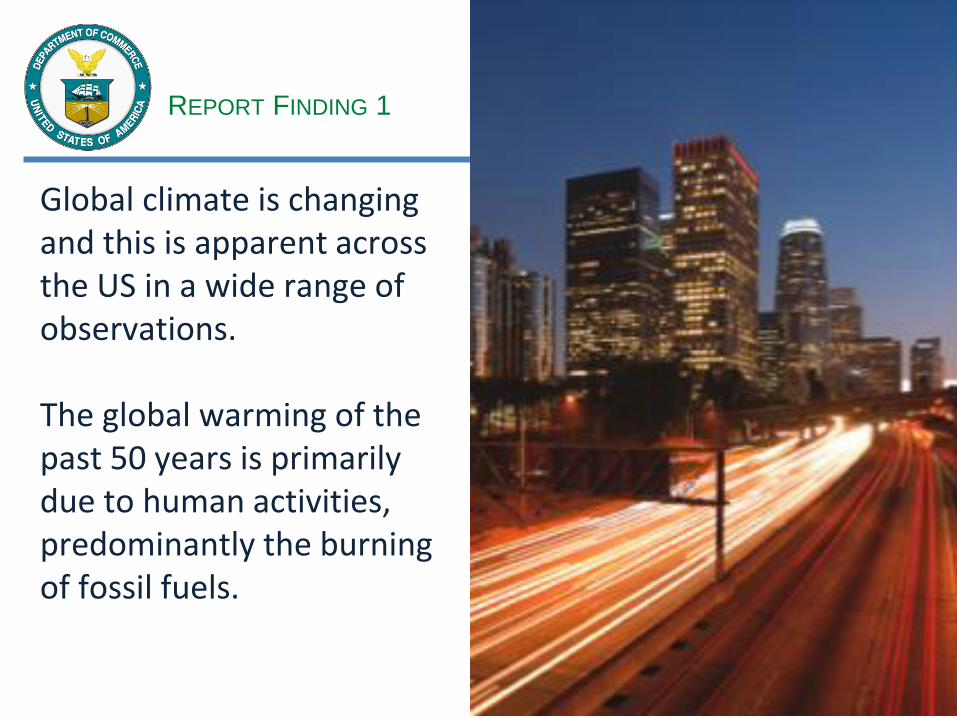
Global climate is changing and this is apparent across the US in a wide range of observations. The global warming of the past 50 years is primarily due to human activities, predominantly the burning of fossil fuels.
REPORT FINDING 1
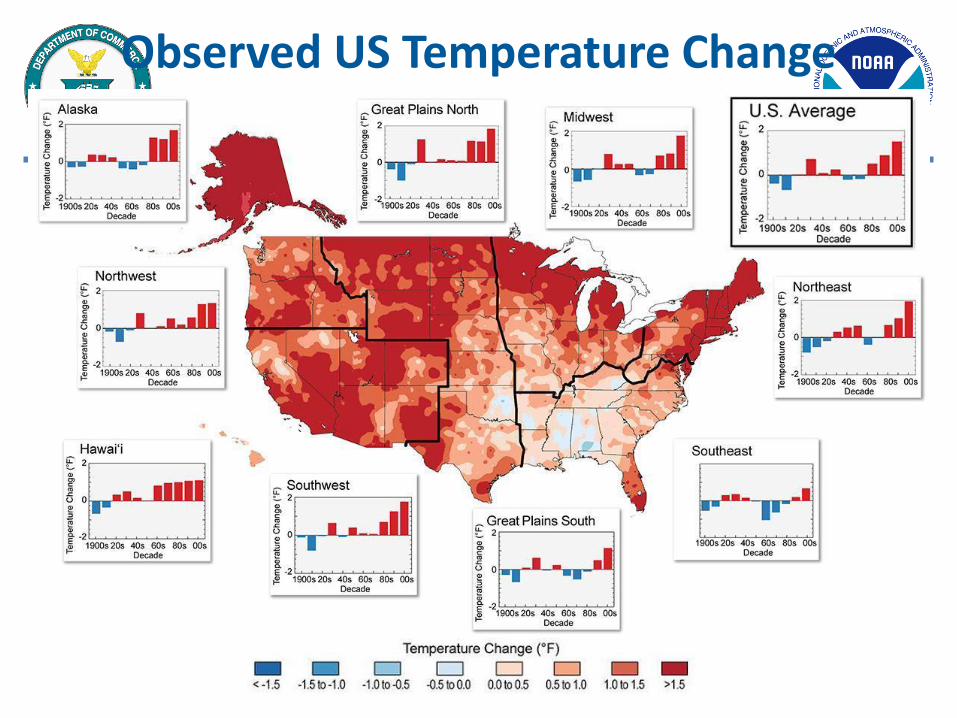
Observed US Temperature Change
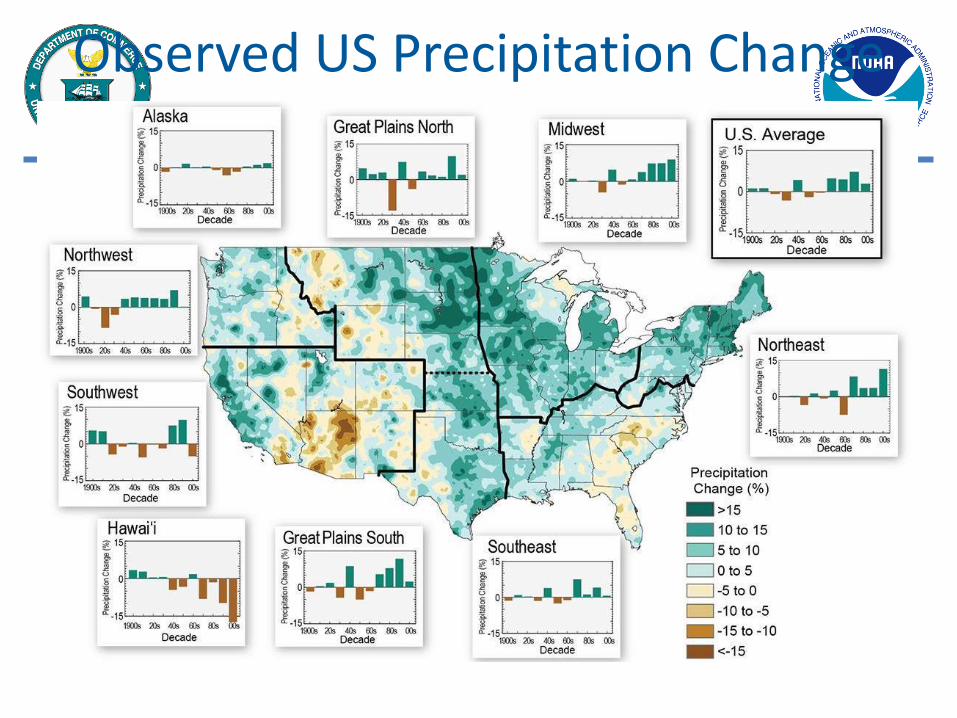
Observed US Precipitation Change
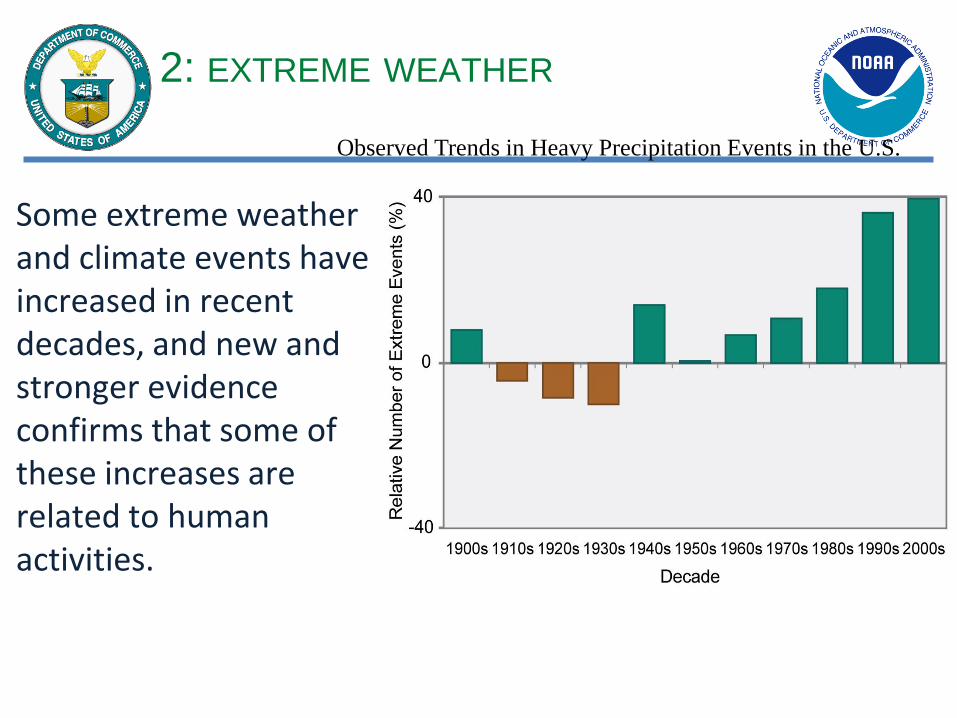
2: EXTREME WEATHER
Some extreme weather and climate events have increased in recent decades, and new and stronger evidence confirms that some of these increases are related to human activities.
Observed Trends in Heavy Precipitation Events in the U.S.
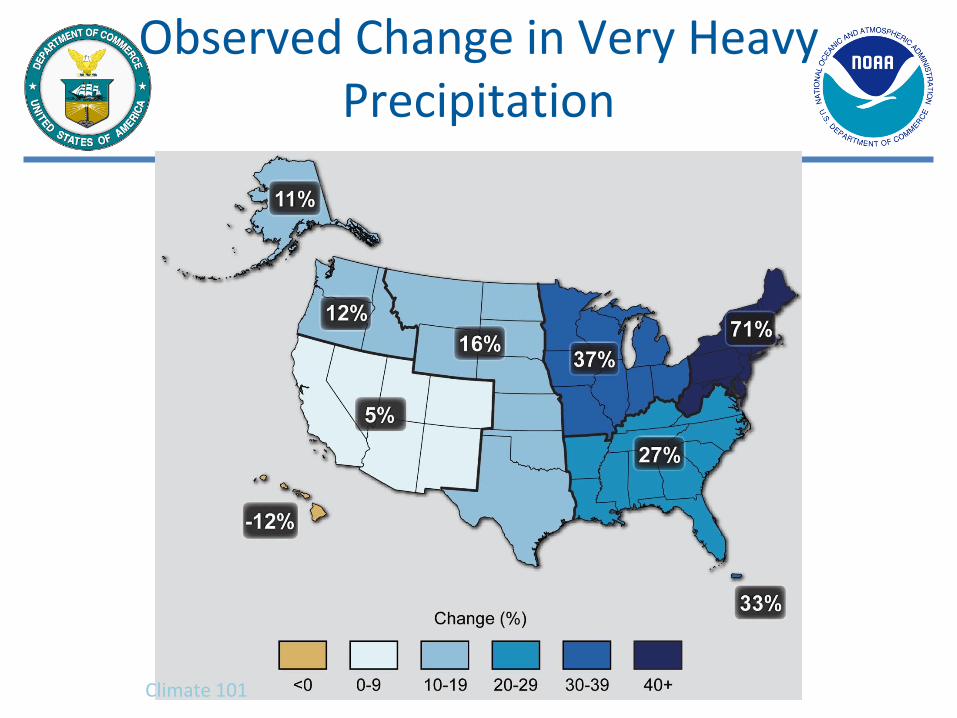
Observed Change in Very Heavy Precipitation
Climate 101
3: FUTURE
CLIMATE
Human-induced climate change is projected to continue, and it will accelerate significantly if emissions of heat-trapping gases continue to increase.
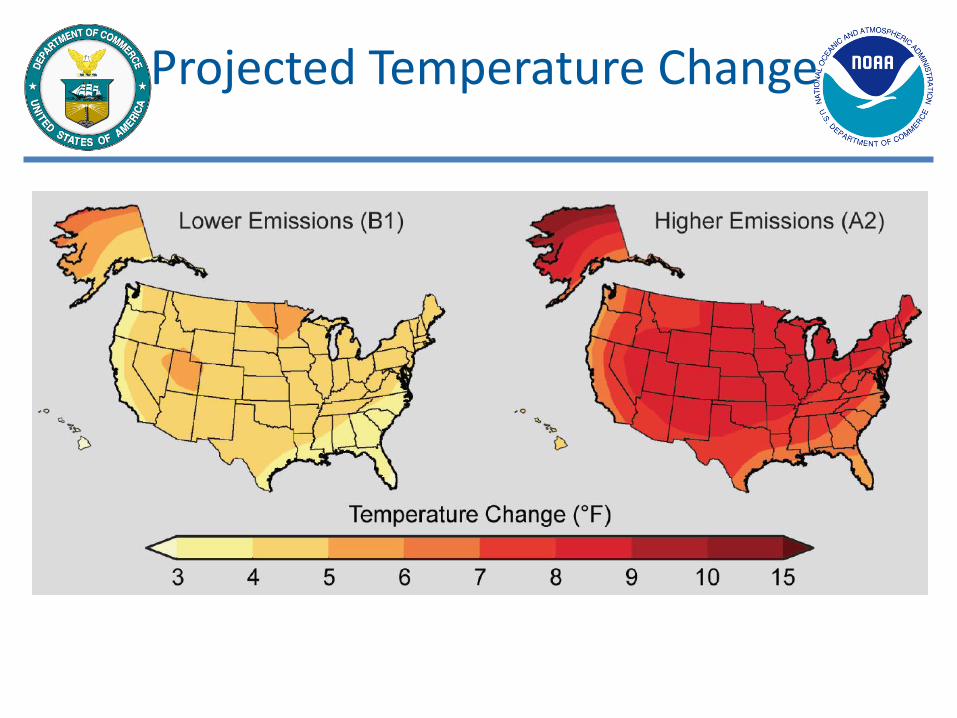
Projected Temperature Change
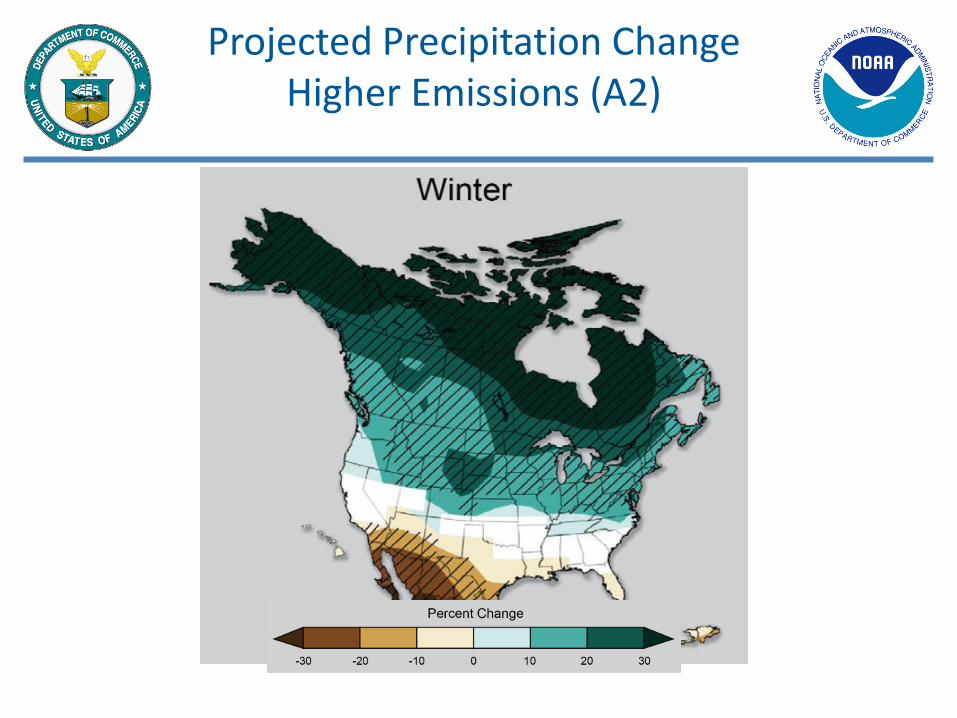
Projected Precipitation Change Higher Emissions (A2)
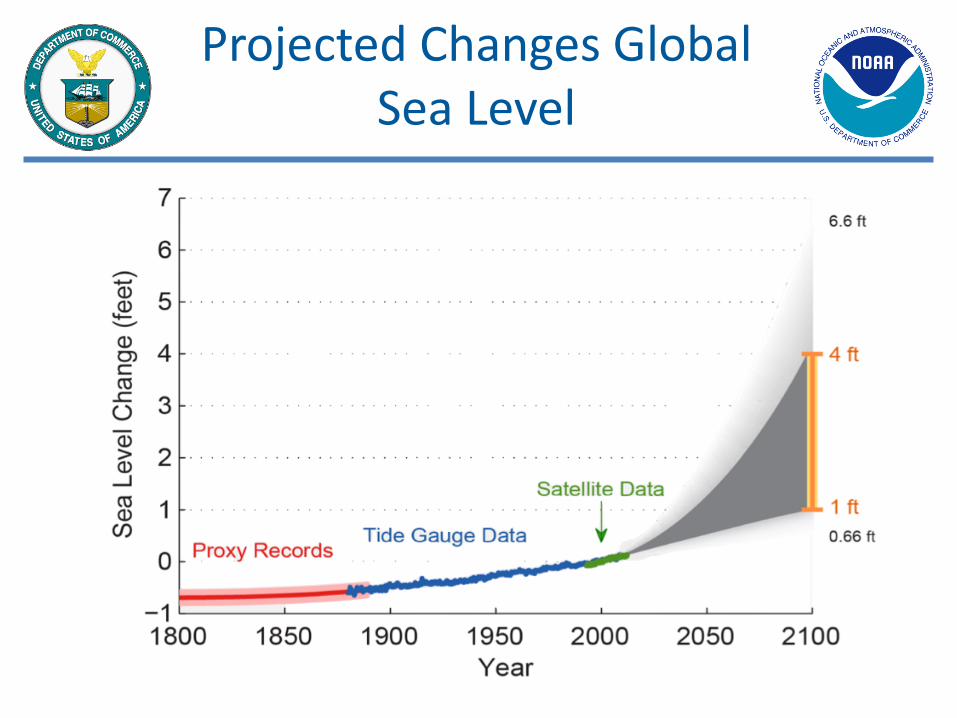
Projected Changes Global Sea Level
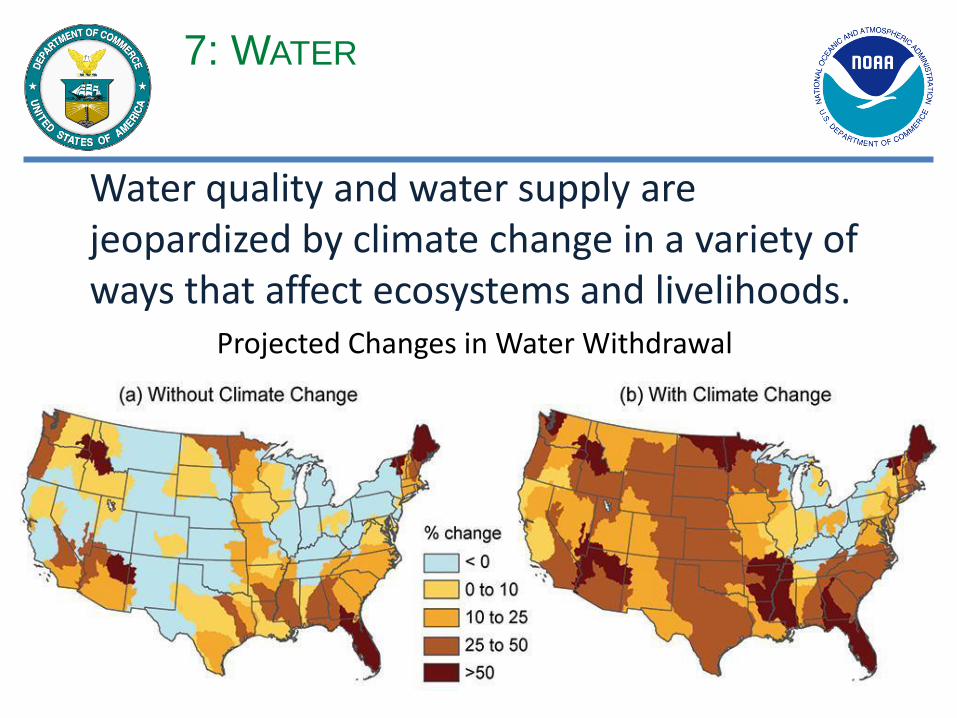
7: WATER
Water quality and water supply are jeopardized by climate change in a variety of ways that affect ecosystems and livelihoods.
Projected Changes in Water Withdrawal
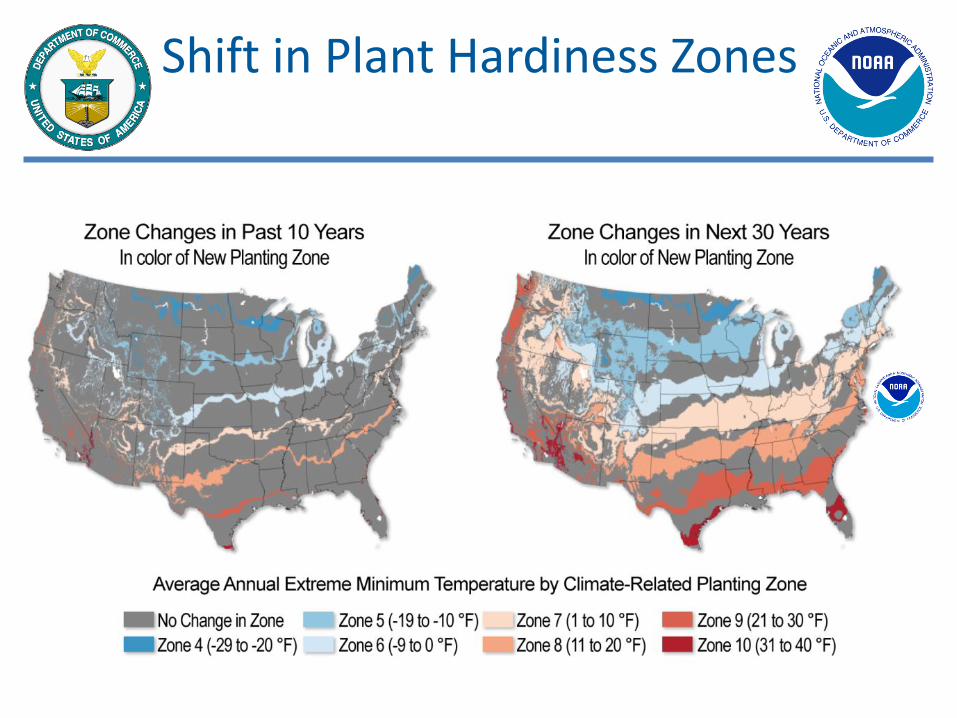
Shift in Plant Hardiness Zones
Climate Change Impacts
in the United States
Third National Climate Assessment
Western USA
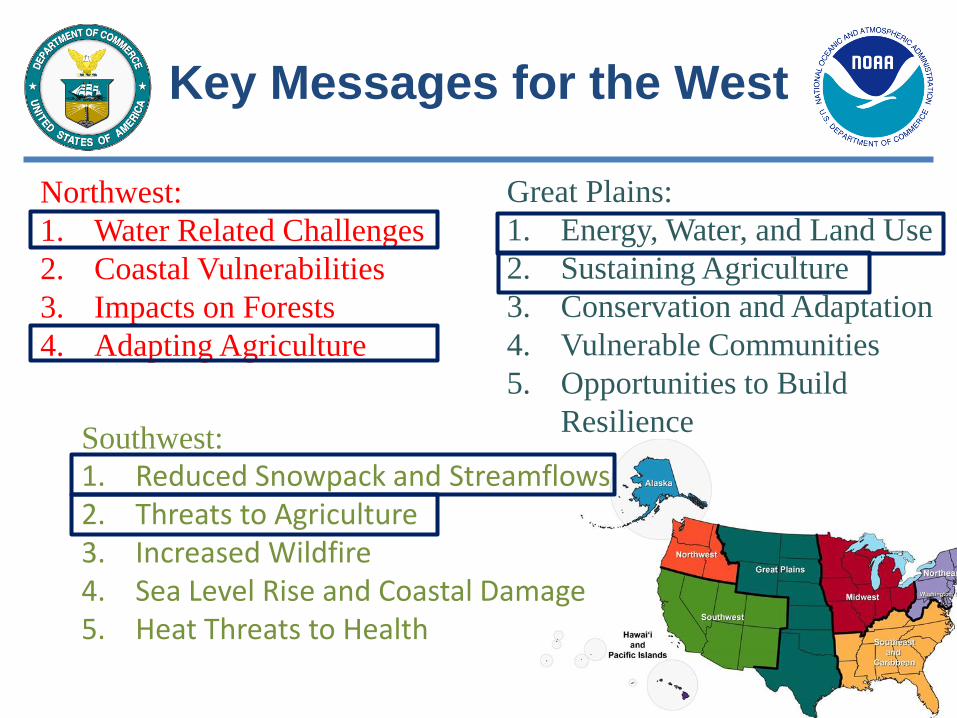
Key Messages for the West
Southwest:
1. Reduced Snowpack and Streamflows 2. Threats to Agriculture 3. Increased Wildfire 4. Sea Level Rise and Coastal Damage 5. Heat Threats to Health
Great Plains:
1. Energy, Water, and Land Use
2. Sustaining Agriculture
3. Conservation and Adaptation
4. Vulnerable Communities
5. Opportunities to Build
Resilience
Northwest:
1. Water Related Challenges
2. Coastal Vulnerabilities
3. Impacts on Forests
4. Adapting Agriculture
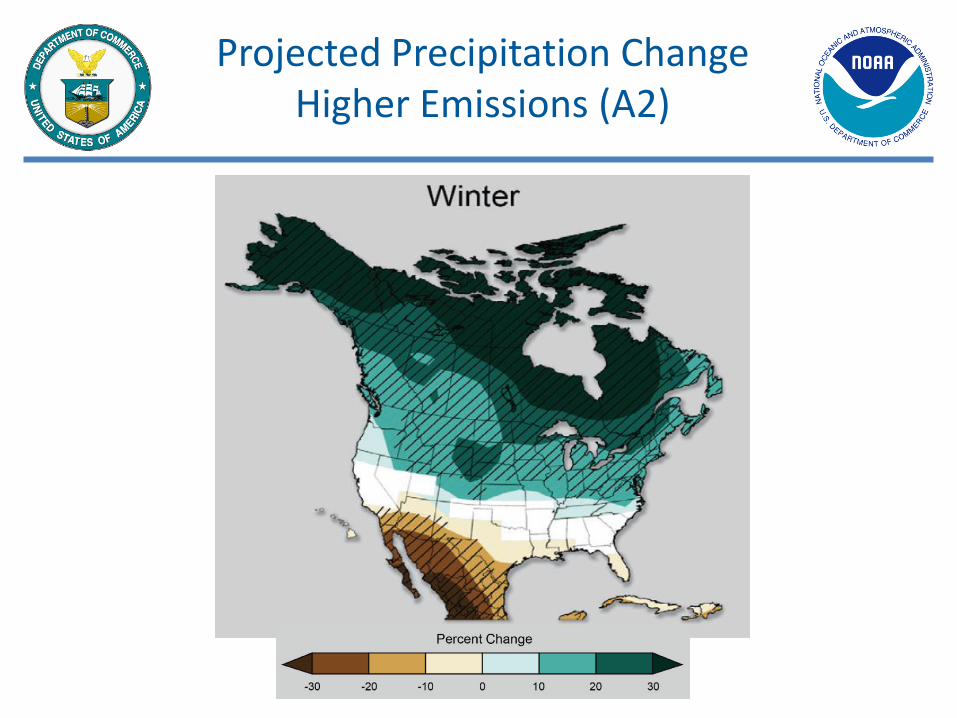
Projected Precipitation Change Higher Emissions (A2)
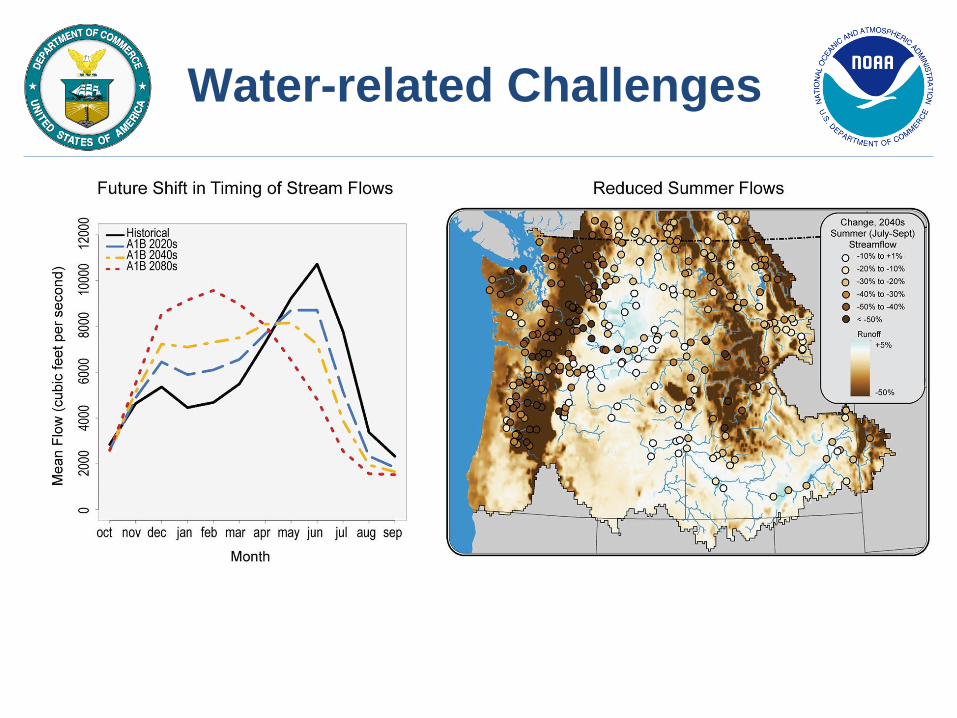
Water-related Challenges
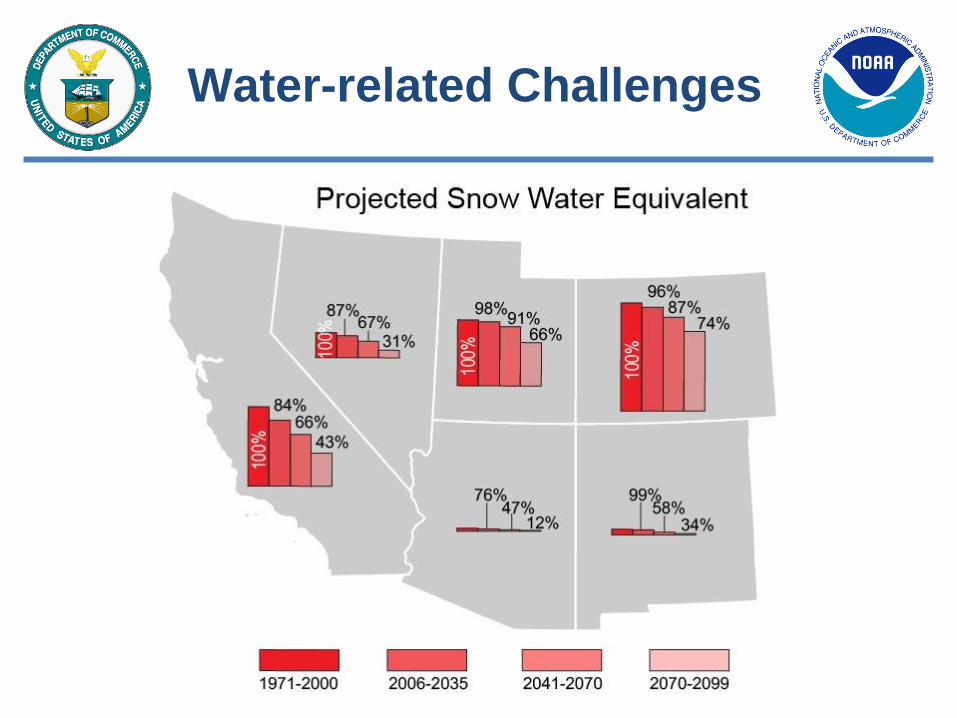
Water-related Challenges
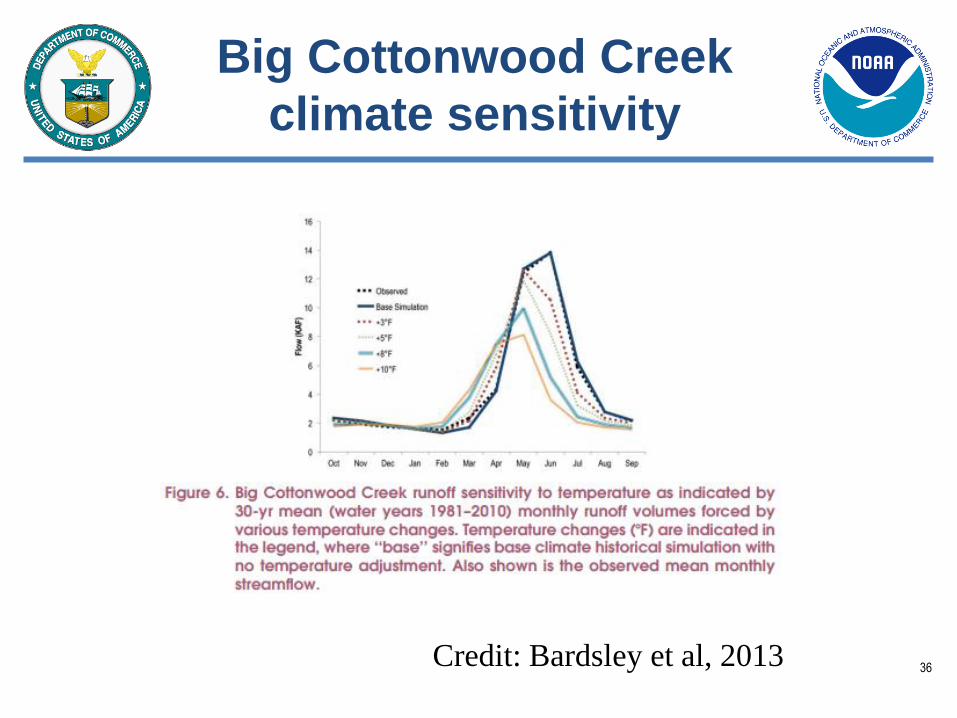
Big Cottonwood Creek
climate sensitivity
36 Credit: Bardsley et al, 2013
Concluding Thoughts
• As the impacts of climate change continue to be realized, resource managers will need to be proactive, innovative, and open to meeting the challenges of a changing future
• Communication and collaboration are essential to being successful and developing future productive and lasting partnerships
• We have exactly enough time to address the impacts of climate change, starting NOW
Regional Reports
Southwest:
nca2014.globalchange.gov/report/regions/southwest
Northwest:
nca2014.globalchange.gov/report/regions/northwest
Regional Resources
• NOAA – Regional Climate Service Director (me!)
– NOAA River Forecast Centers: Colorado Basin River Forecast Center
– NOAA Regional Integrated Climate Assessments: Western Water Assessment
– Regional Climate Centers: Western Regional Climate Center
– State Climatologists: Utah State Climate Office, USU
• DOI – Landscape Conservation Cooperatives
– DOI Climate Science Centers
• USDA Agriculture Hubs
• And more
nca2014.globalchange.gov
http://toolkit.climate.gov/
Questions?
Kevin Werner
Western Region Climate Service Director Phone: 206.860.3490
Email: [email protected]