Embed Size (px)
Citation preview
Climate change adaptation M&E framework for the National Adaptation Plan of the Republic of Moldova
Ala Druta, Climate Change Office
Ministry of Agriculture,Regional Development and Environment
Republic of Moldova
_______________________________________________________________________Tokyo, Japan, 24-25 July 2018
Workshop on national adaptation goals/indicators and their relationship with the SDGs and the Sendai Framework for DRR
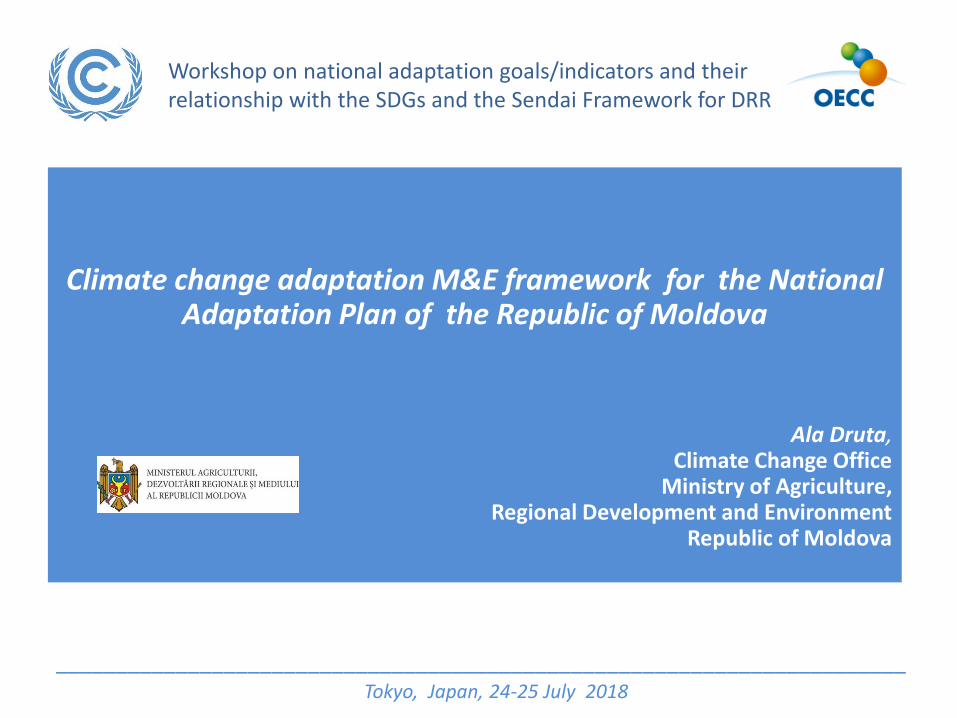
Republic of Moldova Climate Change Adaptation Policyand Institutional Arrangement ________________________________________________________
National Climate Change Adaptation Strategy (2014) provides for an integrated vision on the development opportunities of the Republic of Moldova to react in a resilient manner to the impacts of climate change.
The Climate Change Coordination Mechanism (CCCM) established as a cross-sectoral multi-stakeholder mechanism to maintain a sustainable institutional arrangement.
National Commission on Climate Change
chairs the CCCM and its mandate includes
Monitoring the progress on adaptation.
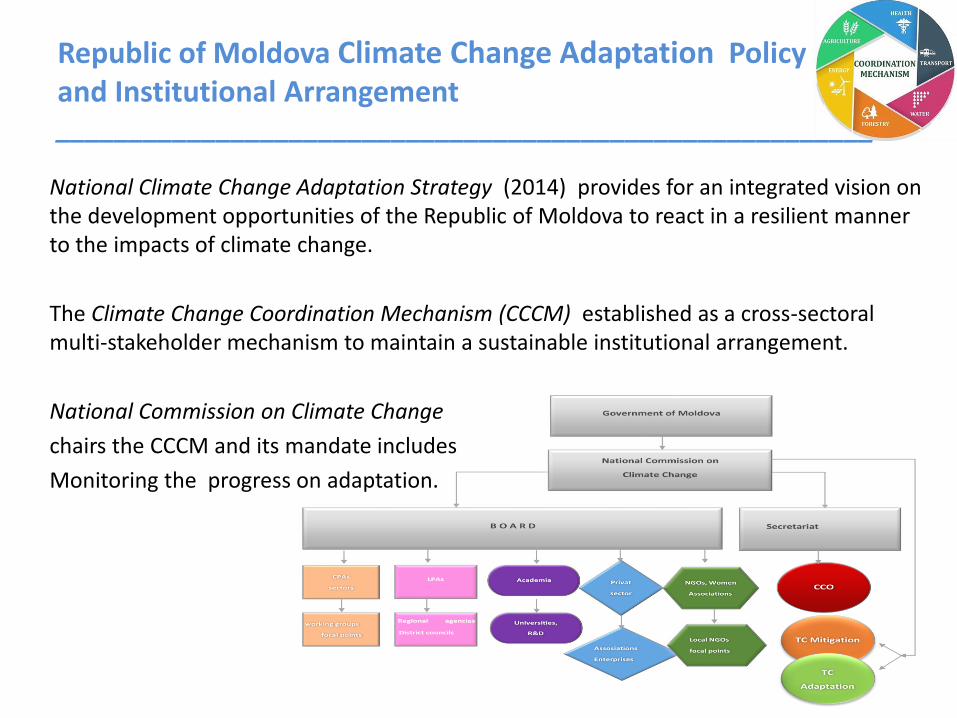
Monitoring and Evaluation System_________________________________________________________
M&E system goal is to ensure the measurability of progress across sectors, geographic scales, time and to be able to determine whether, as a result of its successive plans, Moldova is less vulnerable to the impacts of climate change.
The M&E system assesses and tracks progress under the successive NAPs/SAPs and serve the purposes to:
‒ create a set of overarching adaptation goals to which each sector contributes,
‒ measure and monitor the outcomes and impacts of activities, investments, and programmes, including from gender-responsive perspective,
‒ track and monitor individual sectoral objectives , targets and indicators,
‒ enforce the gradual integration of adaptation priorities in regular development planning,
‒ ensure transparency of adaptation process and data collection,
‒ allow for iterative and continuous, evidence-based adaptation planning.
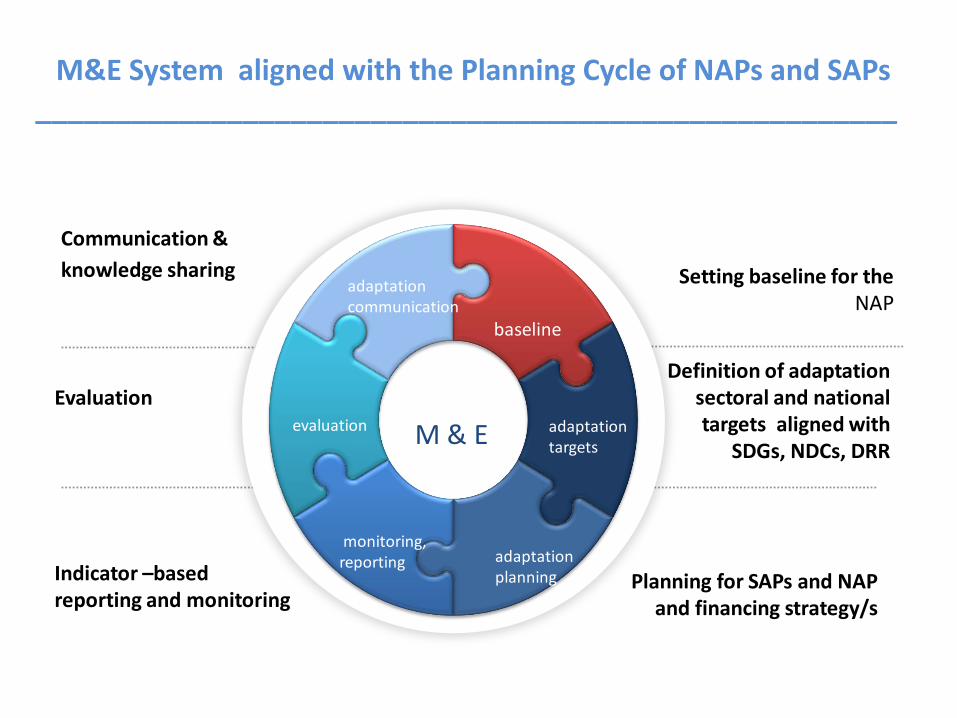
Evaluation
Communication &
knowledge sharing
baseline
Setting baseline for the NAP
Definition of adaptation sectoral and national targets aligned with
SDGs, NDCs, DRR
Planning for SAPs and NAP and financing strategy/s
adaptation targets
adaptation planning
monitoring, reporting
evaluation
adaptation communication
M & E
Indicator –based reporting and monitoring
M&E System aligned with the Planning Cycle of NAPs and SAPs ______________________________________________________
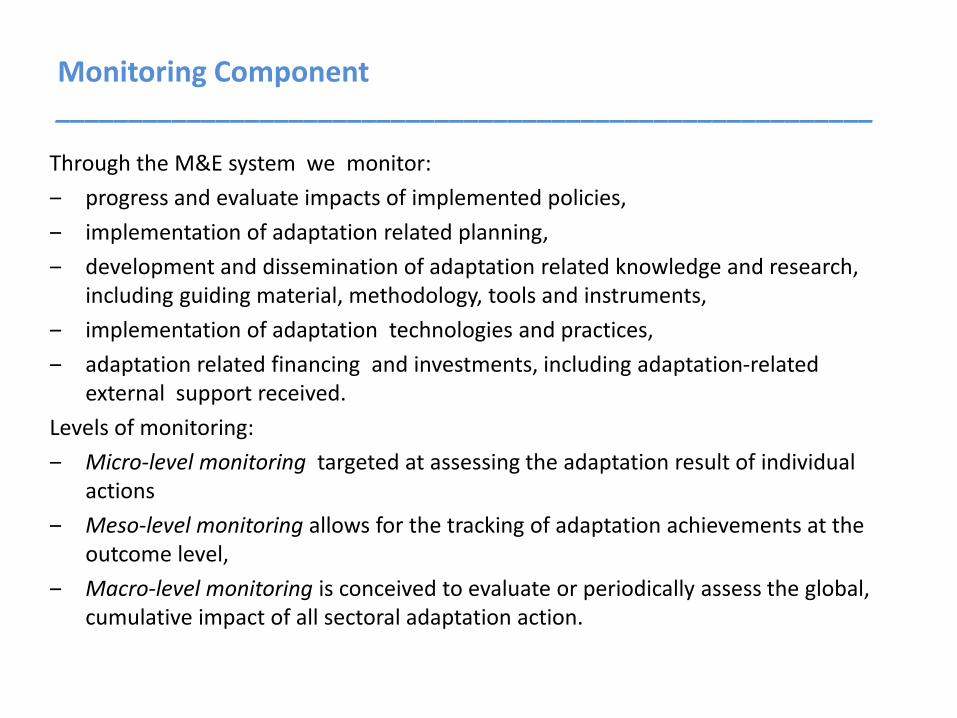
Monitoring Component ________________________________________________________
Through the M&E system we monitor:
‒ progress and evaluate impacts of implemented policies,
‒ implementation of adaptation related planning,
‒ development and dissemination of adaptation related knowledge and research, including guiding material, methodology, tools and instruments,
‒ implementation of adaptation technologies and practices,
‒ adaptation related financing and investments, including adaptation-related external support received.
Levels of monitoring:
‒ Micro-level monitoring targeted at assessing the adaptation result of individual actions
‒ Meso-level monitoring allows for the tracking of adaptation achievements at the outcome level,
‒ Macro-level monitoring is conceived to evaluate or periodically assess the global, cumulative impact of all sectoral adaptation action.
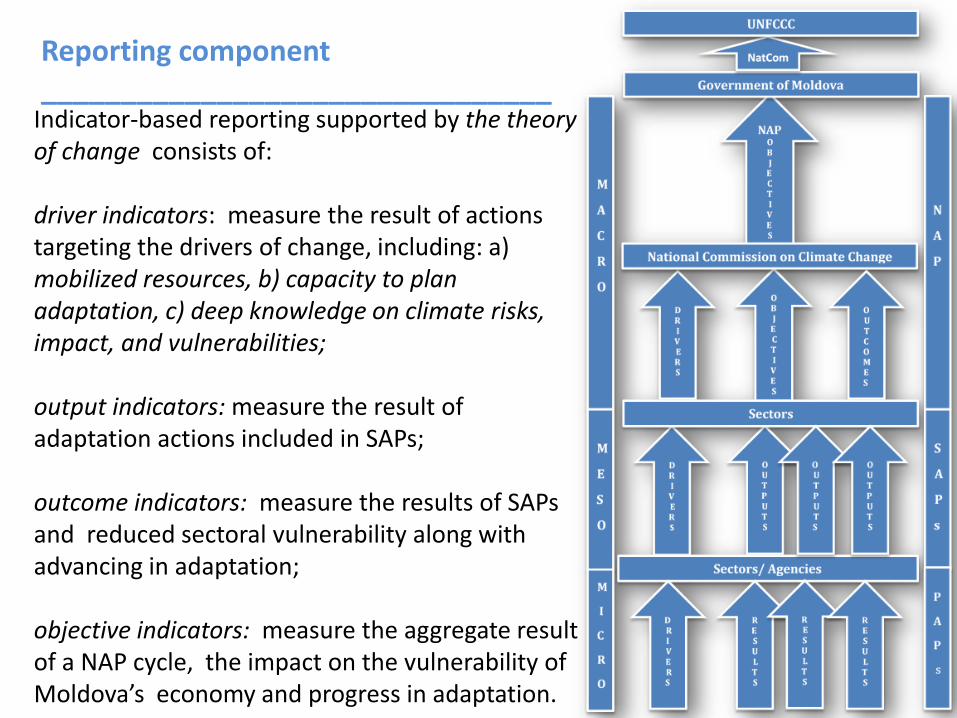
Indicator-based reporting supported by the theory of change consists of:
driver indicators: measure the result of actions targeting the drivers of change, including: a) mobilized resources, b) capacity to plan adaptation, c) deep knowledge on climate risks, impact, and vulnerabilities;
output indicators: measure the result of adaptation actions included in SAPs;
outcome indicators: measure the results of SAPs and reduced sectoral vulnerability along with advancing in adaptation;
objective indicators: measure the aggregate result of a NAP cycle, the impact on the vulnerability of Moldova’s economy and progress in adaptation.
Reporting component________________________________

Number of indicators
Total -95 (25 in work)
Cross-sectoral indicators:objective indicators-3driver indicators-3outcome indicators-5output indicators-4
Sector:agriculture -18water resources -18forestry -13health -10energy -9transport-7budget -4+1
Reporting Templates of Climate Indicators___________________________________________________________________________
Water stress level: The ratio between the amount of withdrawn freshwater and
the available fresh water resourcesData sheet
Indicator code i0070
Sector Water resources
Indicator name Water stress level: The ratio between the amount of freshwater withdrawn and the available fresh water
resources
Indicator type Outcome indicator
Focus area Adaptation
Adaptation
relevance
This indicator reflects the intensity of water withdrawing by all major sectors (agriculture, forestry, industry, electricity
generation, municipalities) of the total freshwater resources from renewable sources, taking into account the water
demand for environment. Water withdrawing below sustainable levels (due to inefficient practices and outdated
infrastructure systems that cause water loss) threatens ecosystems, as well as the security of water supply of society and
various economic uses, indicating a high level of water stress.
Relevant areas Water resources
Development
indicator level
I
Data Providers Ministry of Agriculture, Regional Development and Environment; "Apele Moldovei" agency is responsible for collecting
data and for determining / measuring this indicator
Required data Total renewable freshwater resources (TRWR); Total freshwater withdrawal (TWW) (industrial, agricultural, municipal
water withdrawal); Environmental flow requirements (EFR), all variables are expressed in km3 / year
Methodologies /
calculation formulas
Nominator = Total freshwater withdrawal (TWW); Denominator = [Total renewable freshwater resources (TRWR) -
Environmental flow requirements (EFR)]; Result * 100
Methodologies
references
http://www.fao.org/nr/water/aquastat/water_res/index.stm;
http://www.fao.org/nr/water/aquastat/water_res/index.stm;
http://www.fao.org/nr/water/aquastat/data/wrs/readPdf.html?f=AFG-WRS_eng.pdf
Measurement unit Percentage (%)
Space level National; sub-national (indicator may be disaggregated at district/ municipality level)
Reference period [to be completed]
Frequency of data
collection
Annual
The expected trend
of adaptation
Decreasing
Sub-indicators The indicator can be disaggregated at sector level
Additional
comments
Reporting format
Sector/ Ministry /
Reporting entity
NAP / SAP phase
(reporting year)
Total renewable freshwater
resources (TRWR),
km3/year
Total freshwater
withdrawal (TWW),
km3/year
Environmental flow
requirements (EFR),
km3/year
Water stress
level,
%
…
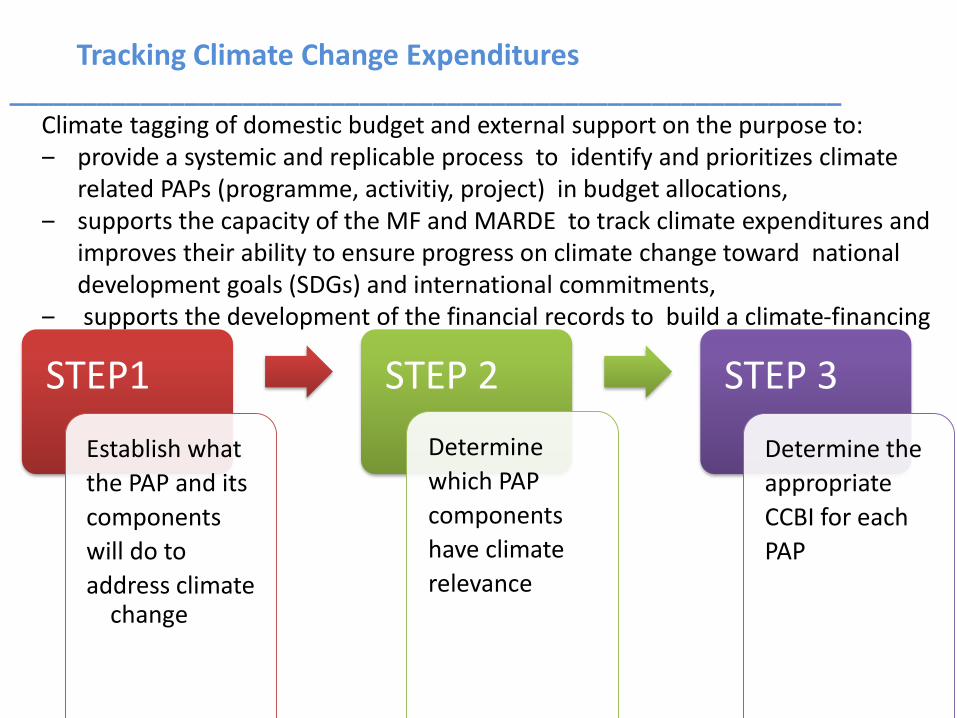
Tracking Climate Change Expenditures_________________________________________________________
Climate tagging of domestic budget and external support on the purpose to:‒ provide a systemic and replicable process to identify and prioritizes climate
related PAPs (programme, activitiy, project) in budget allocations,‒ supports the capacity of the MF and MARDE to track climate expenditures and
improves their ability to ensure progress on climate change toward national development goals (SDGs) and international commitments,
‒ supports the development of the financial records to build a climate-financing framework.
STEP1
Establish what
the PAP and its
components
will do to
address climate change
STEP 2
Determine
which PAP
components
have climate
relevance
STEP 3
Determine the
appropriate
CCBI for each
PAP

Climate Change Budget Indicators and their PAPs_______________________________________________________
• build resilience through a policy and legal framework, implement climate policy, governance into activity and delivery, diversification and strengthening of climate investments
CCBI 1 – Policy Development and
Governance
• build resilience by developing science & technology as a foundation for formulating policies, assessing impacts and identifying measure on CCA
CCBI 2 – Research and Development
• build resilience by improving awareness of climate change and developing community capacity to respond to climate change
CCBI 3 – Knowledge Sharing and Capacity Building
• build resilience to climate risks by supporting the development of a resilient society, ensuring the development of a low-carbon production economy, ensuring the sustainability of natural resources
CCBI 4 – Climate Response and Service Delivery
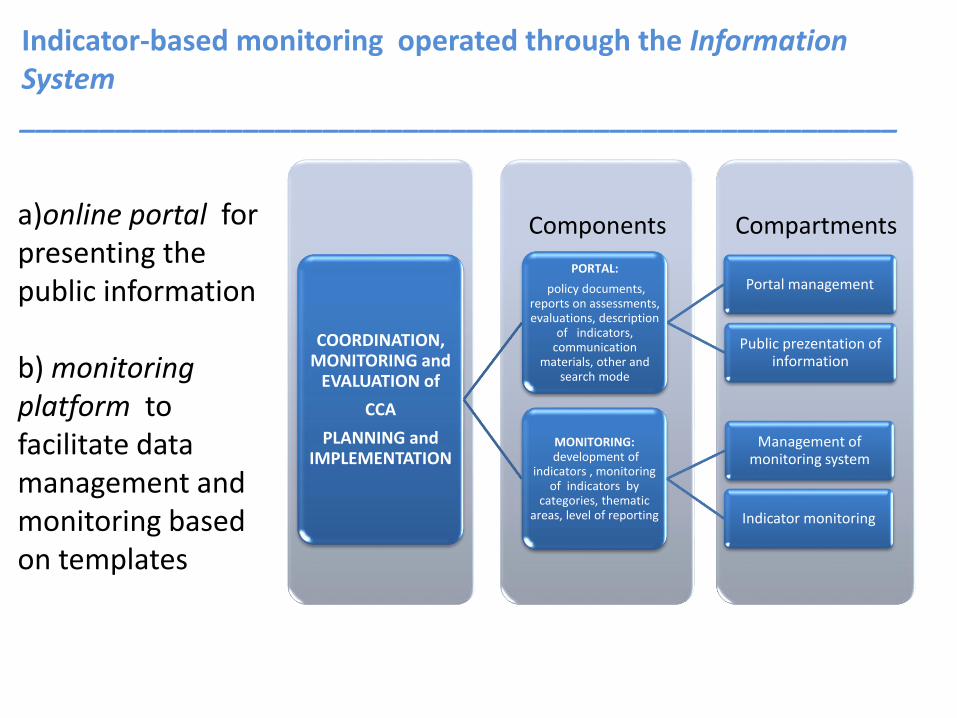
a)online portal for presenting the public information
b) monitoring platform to facilitate data management and monitoring based on templates
Indicator-based monitoring operated through the Information System _______________________________________________________
CompartmentsComponents
COORDINATION, MONITORING and
EVALUATION of
CCA
PLANNING and IMPLEMENTATION
PORTAL:
policy documents, reports on assessments, evaluations, description
of indicators, communication
materials, other and search mode
Portal management
Public prezentation of information
MONITORING:development of
indicators , monitoring of indicators by
categories, thematic areas, level of reporting
Management of monitoring system
Indicator monitoring
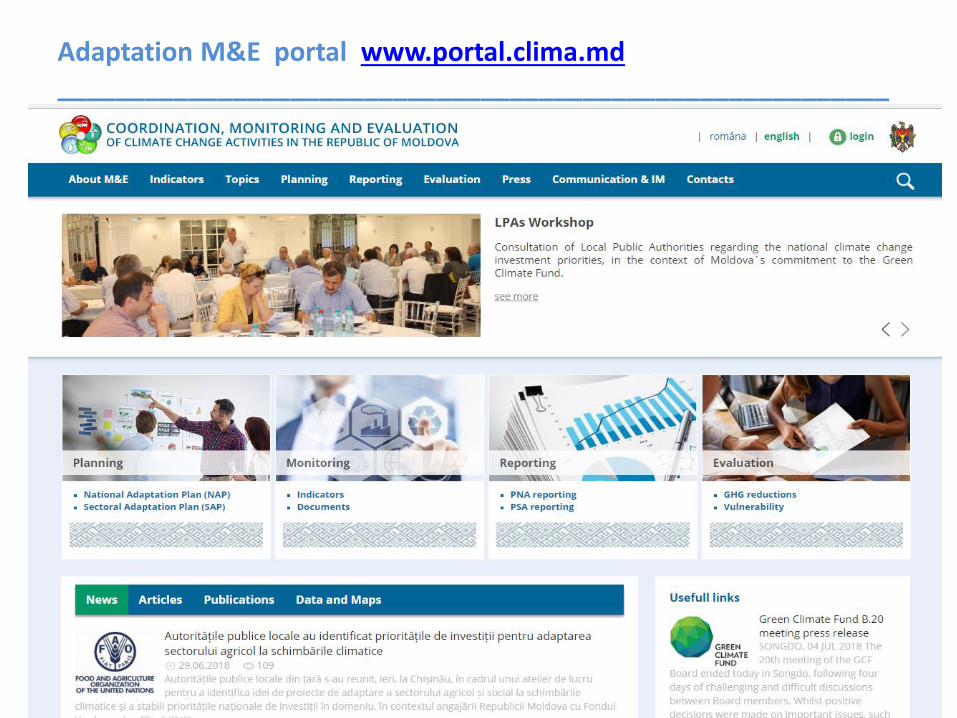
Adaptation M&E portal www.portal.clima.md_________________________________________________________
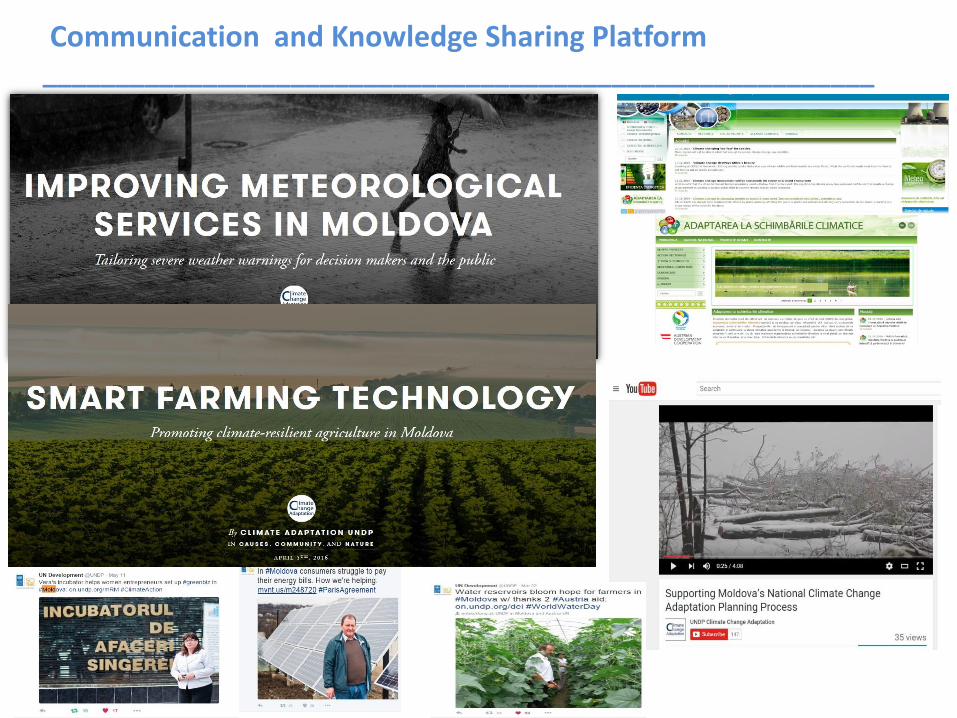
Communication and Knowledge Sharing Platform _________________________________________________________
________________________________________________________
Thank you for attention.
Contacts: www.madrm.gov.md
www.portal.clima.md