Embed Size (px)
Citation preview

Climate change and agriculture
Luigi Mariani
Università degli Studi di Milano
Dipartimento di Produzione Vegetale
CNR Imati, 24-25 february 2011

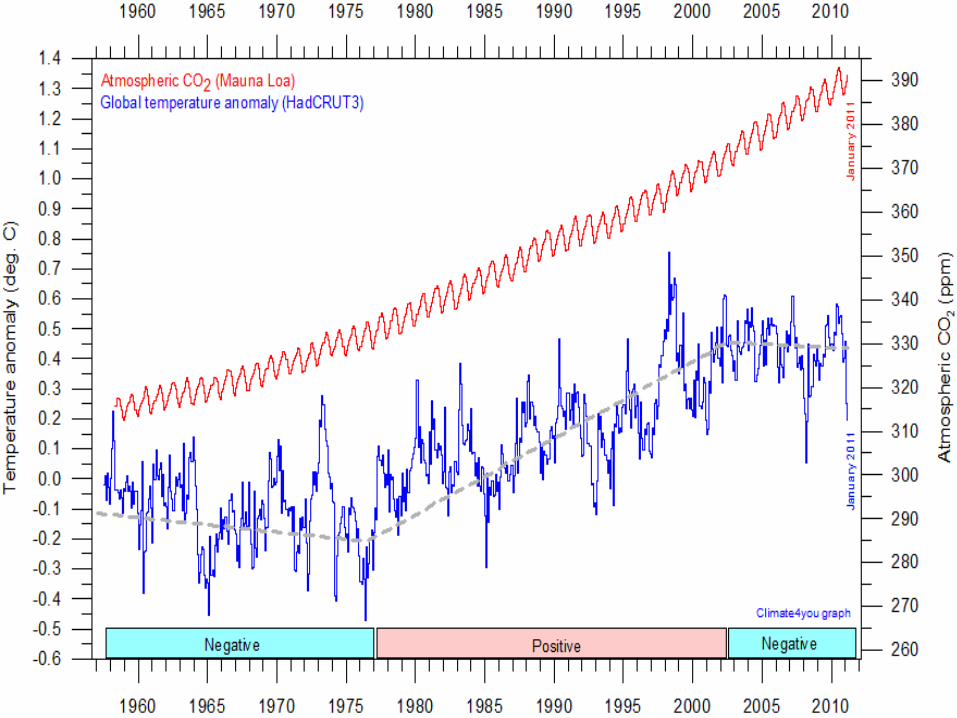
Climate change
climate change is any systematic change in the long-term statistics of climate elements (such as temperature, pressure, or winds) sustained over several decades or longer (source: AMS glossary).
Climate variability is one of the main features of the climate system

Energetic synthesis of the climate system (compact and effective)
Mean value of income and outgoing
energy (1th principle of
th.dyn.)
235 W m-2
Incoming energyOutgoing energy
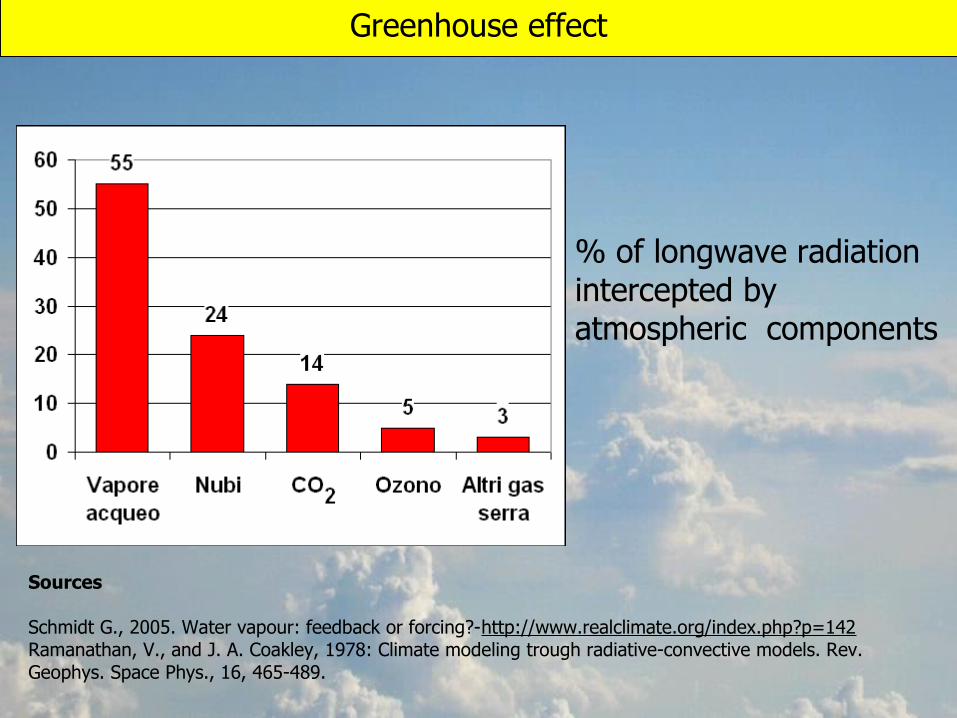
Greenhouse effect
Sources
Schmidt G., 2005. Water vapour: feedback or forcing?-http://www.realclimate.org/index.php?p=142Ramanathan, V., and J. A. Coakley, 1978: Climate modeling trough radiative-convective models. Rev.Geophys. Space Phys., 16, 465-489.
% of longwave radiation intercepted by atmospheric components

Overall scheme of general circulation
Annular circulation (30-60°)
Polar Vortex (60-90°)
Hadley cell (0-30°)

General circulation using clouds as tracers
Tropical area: a very active convective zone near the equatorMid latitudes: frontal systems with a West-East field of motion (annular circulation alias westerlies)
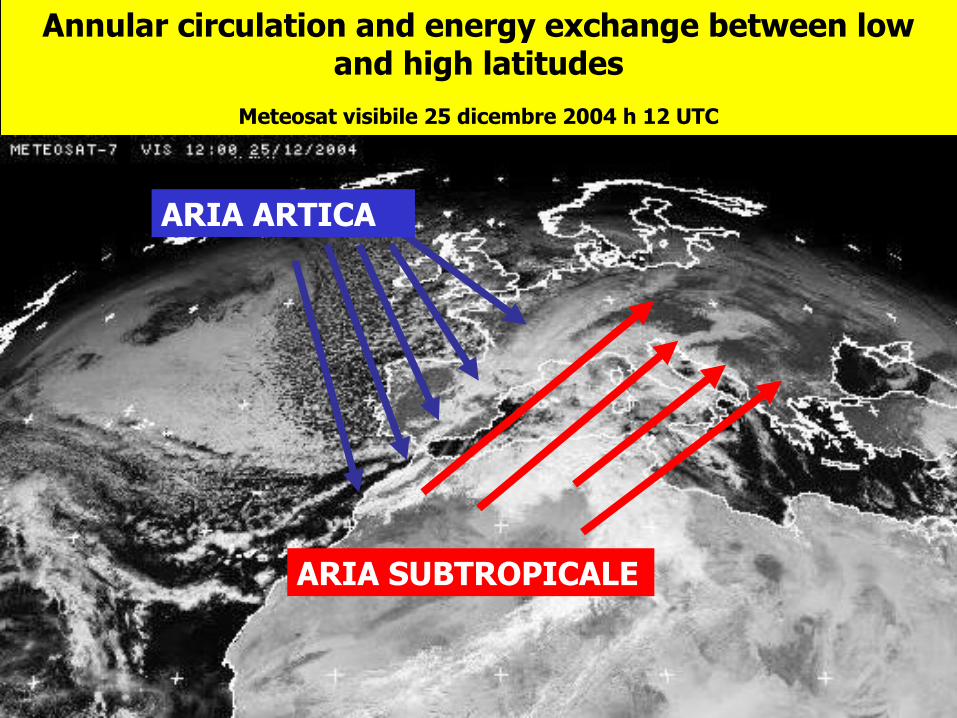
Annular circulation and energy exchange between low and high latitudes
Meteosat visibile 25 dicembre 2004 h 12 UTC
ARIA ARTICA
ARIA SUBTROPICALE

Mean state of annular circulation and blocking
The mean state of mid latitudes annular circulation is zonal (from west to east - slowly ondulated)
Blocking = deviations from this dominant regime due to cyclonic or anticyclonic areas that block the westerly flow,
Blokings can persist for days / weeks /months.

Blocking weather patterns
Omega block Inverse S shaped(Rex block)
Source: Jeff Haby - http://www.theweatherprediction.com/blocking/Cutoff High Cutoff low Split flow
Zonal (mean) regime
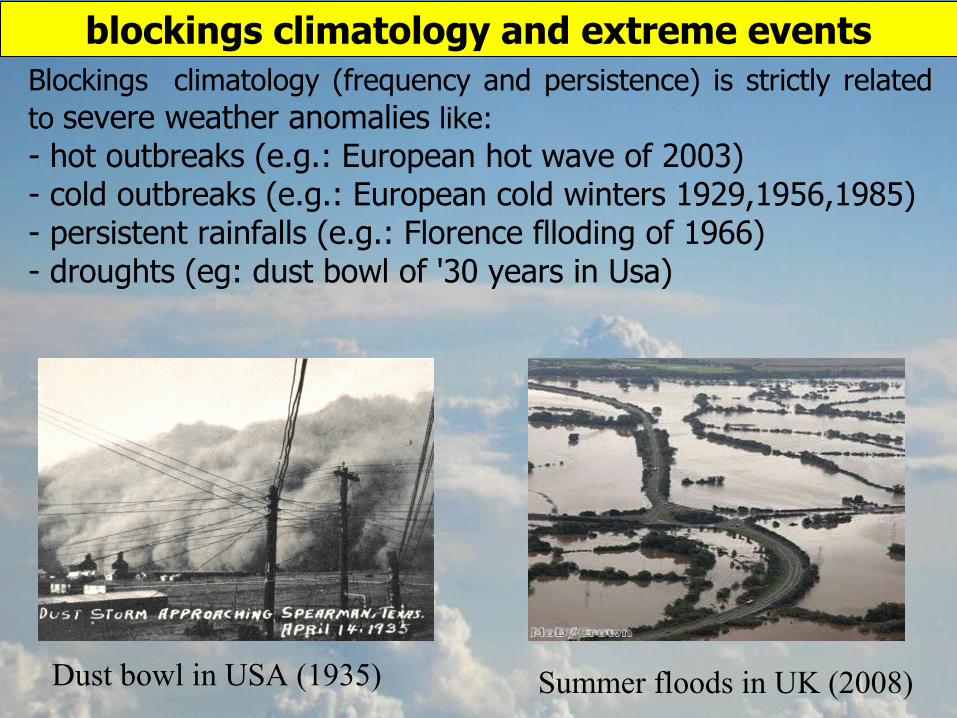
Summer floods in UK (2008)Dust bowl in USA (1935)
blockings climatology and extreme eventsBlockings climatology (frequency and persistence) is strictly related to severe weather anomalies like:- hot outbreaks (e.g.: European hot wave of 2003)- cold outbreaks (e.g.: European cold winters 1929,1956,1985)- persistent rainfalls (e.g.: Florence flloding of 1966)- droughts (eg: dust bowl of '30 years in Usa)

Boreal hemisphere: frequency of blockings
Using the blocking index of Tibaldi and Molteni (1990) we can consider the frequency of "blocked days" for each of the four traditional seasons (DJF, MAM, JJA, SON) for the northern hemisphere for the period 1950 to 2000.
Analysis carried out on NCEP Ncar reanalysissource: http://www.cpc.ncep.noaa.gov/products/precip/CWlink/blocking/seasonal_nh/seasonal_nh.shtml

Long time evolution of zonal regime the abrupt change of '80
Long time behaviour of annular circulation can be described by indexes bases on atmospheric pressure distributions.
AO and Nao: circulation indexes adopted to describe behaviour of zonal circulation in the North hemisphere.An abrupt AO (and Nao) change of phase was observed at the end of the '80 with strengthening of zonal regime.
http://www.jisao.washington.edu/ao/
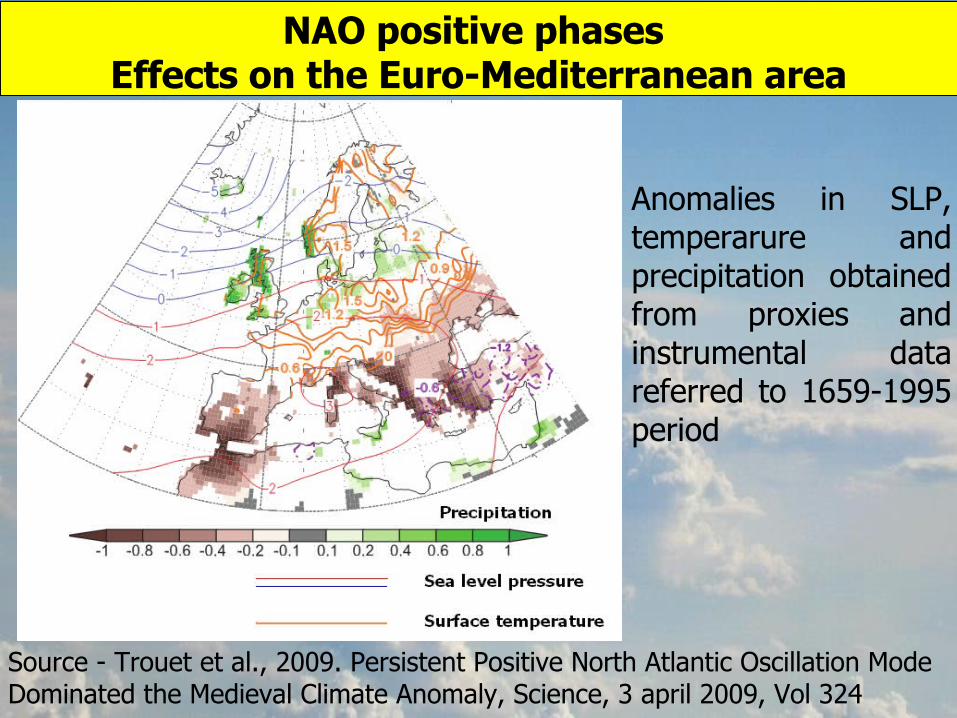
NAO positive phases Effects on the Euro-Mediterranean area
Source - Trouet et al., 2009. Persistent Positive North Atlantic Oscillation Mode Dominated the Medieval Climate Anomaly, Science, 3 april 2009, Vol 324
Anomalies in SLP, temperarure and precipitation obtained from proxies and instrumental data referred to 1659-1995 period

Historical precedents
NAO recostruction from proxy data from Marocco, Alps and Scotland).
Trouet et al., 2009. Persistent Positive North Atlantic Oscillation Mode Dominated the Medieval Climate Anomaly, Science, 3 april 2009, Vol 324

Mean yearly temperature of 18 European stations (1951-2009)(available data: 93%)
With the 99% of confidence the breakpoint drops between 1983 and 1991. Most probable year=1987 (mean 1951-1987=6.9; mean 1988-2009=7.9)
[breakpoint analysis carried out with Struchange library – R cran]
1987

Yearly mean temperature at Valley – UK (1931-2000)(source: dataset ECAD)
Con il 99% di probabilità la discontinuità ricade fra 1974 e 2000. Anno più probabile di discontinuità= 1987 (media 1931-1987=10.0; media 1988-2000=10.5)
[analisi di discontinuità eseguita con la libreria statistica Struchange]
10.0
10.5
1987
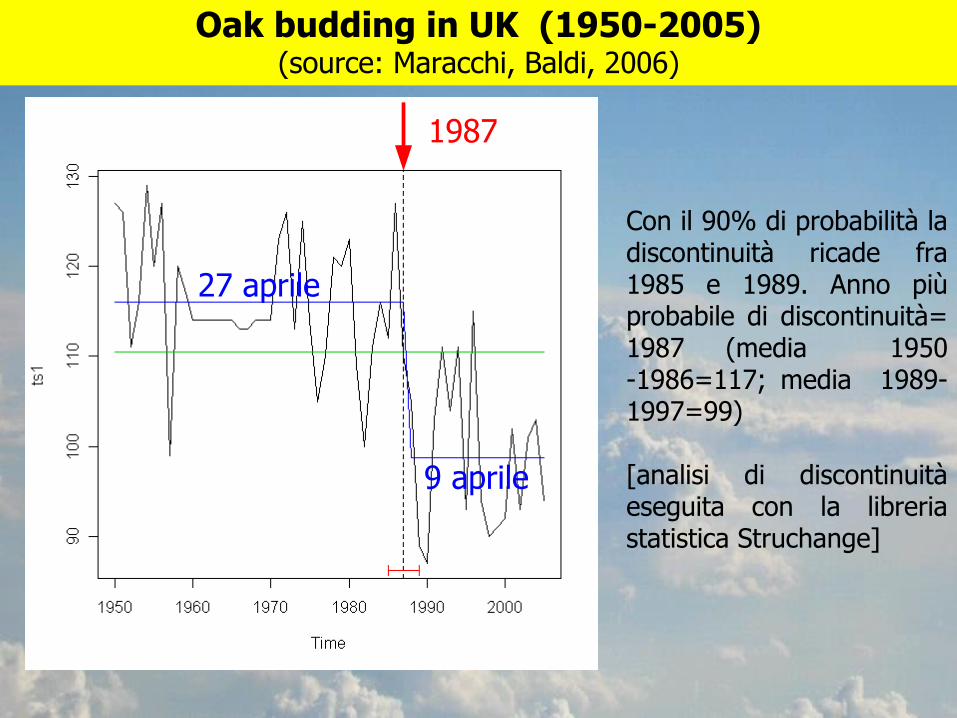
Oak budding in UK (1950-2005)(source: Maracchi, Baldi, 2006)
Con il 90% di probabilità la discontinuità ricade fra 1985 e 1989. Anno più probabile di discontinuità= 1987 (media 1950 -1986=117; media 1989-1997=99)
[analisi di discontinuità eseguita con la libreria statistica Struchange]
27 aprile
9 aprile
1987
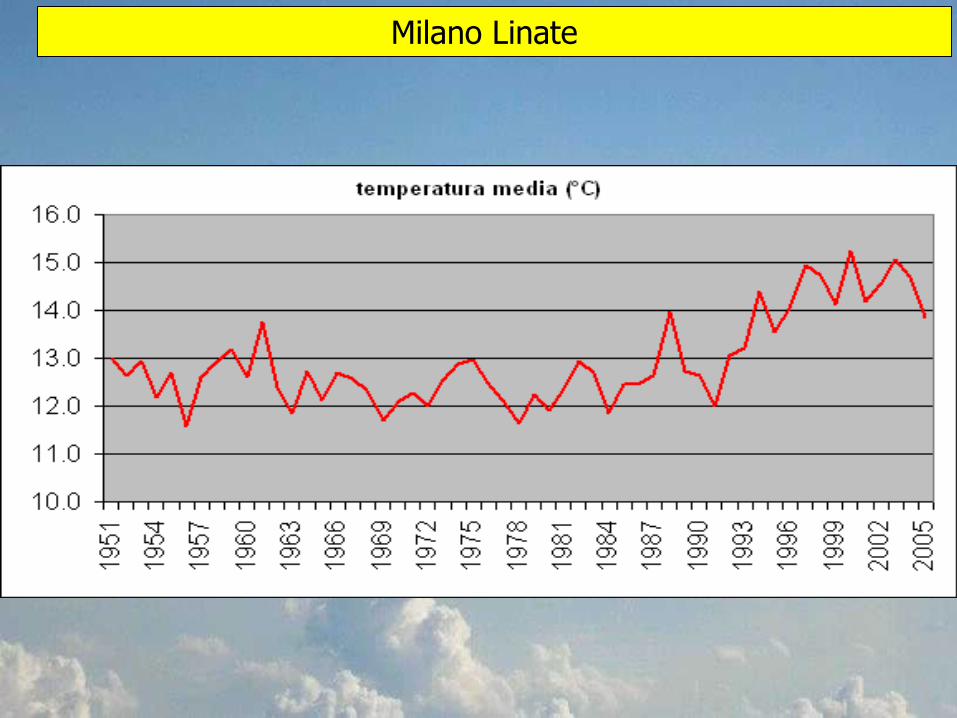
Milano Linate

Precipitazioni 1921-2006 – Bordeaux e Francoforte (fonte: Ecad)
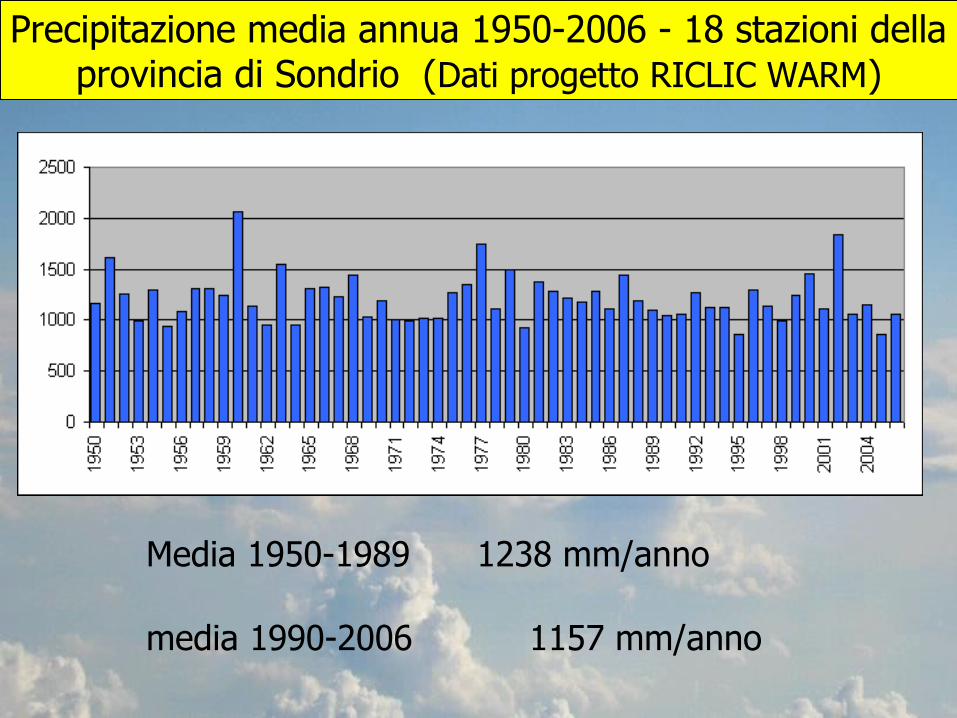
Precipitazione media annua 1950-2006 - 18 stazioni della provincia di Sondrio (Dati progetto RICLIC WARM)
Media 1950-1989 1238 mm/anno
media 1990-2006 1157 mm/anno

Milano Brera - Precipitazione annua 1764-2010 (in evidenza i 5 massimi assoluti)

Milano Brera - Precipitazione annua 1764-2010
Valori medi (mm/anno)
- Media 1764-1800=928 - Media 1801-1850=1053- Media 1851-1900= 1023- Media 1901-1950= 963- Media 1951-2000= 1016- Media 2001-2010= 938
→ Media 1764-2010=998

Temperatures (1979-2009)
Source: University of 'Alabama – Huntsville (satellite data MSU-UAH) numerical data available at: http://vortex.nsstc.uah.edu/public/msu/t2lt/uahncdc.lt


Effects on agriculture
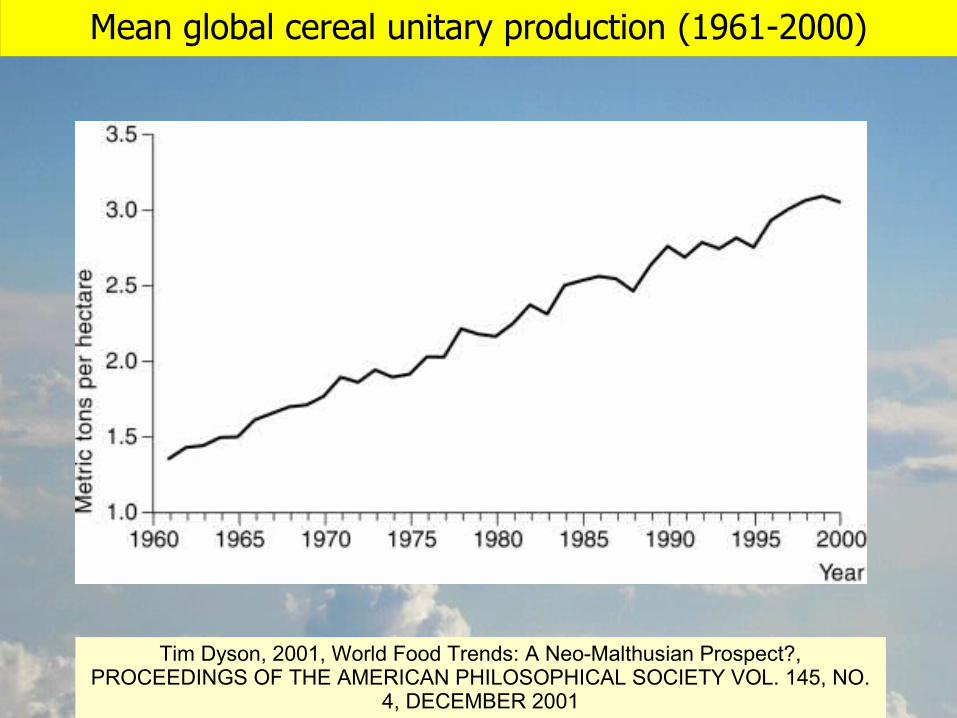
Mean global cereal unitary production (1961-2000)
Tim Dyson, 2001, World Food Trends: A Neo-Malthusian Prospect?, PROCEEDINGS OF THE AMERICAN PHILOSOPHICAL SOCIETY VOL. 145, NO.
4, DECEMBER 2001

Per capita cereal production 1961-2000
Tim Dyson, 2001, World Food Trends: A Neo-Malthusian Prospect?, PROCEEDINGS OF THE AMERICAN PHILOSOPHICAL SOCIETY VOL. 145, NO.
4, DECEMBER 2001

Produzione media mondiale per unità di superficie e per le maggiori colture
Fonte: dati FAO- database, faostat (http://faostat.fao.org/site/567/default.aspx#ancor)

How to interpret these data
In the last 50 years there is an apparent insensitivity of global crop production to climate variability.
Possible reasons:1. global distribution of weather anomalies (each year show some anomalies which compensate on a global scale giving a nearly constant global impact)2. effectiveness of adaptation strategies of farmers (choices in genetics and agro-techniques)3. increasing presence of irrigation (a powerful stabilizer of agricultural production)4. the observed temperature increase is not harmful for crops on a global scale

Some statisticsGlobal arable land: 1.5 Billions of haIrrigated land: 16%Food produced by irrigated lands: 36%(http://12.000.scripts.mit.edu/mission2014/solutions/modernized-irrigation)

Results coherent with the lesson of the past
The civilization can be considered as the system built by the humankind to counteract the dictatorship of the climate (Leroy Ladurie, 2004).
The worst climatic periods for crop production:- cold phases (e.g.: LIA; France, 1740) - rainy periods (e.g. Ireland, 1846)- warm phases with drought (e.g.: 11th century bC - end of Ittite and Micenean civilization)
Warm phases with good water availability are optimal for agriculture and this explain the name of optimum given to such periods (Great Postglacial opt. GPo, micenean opt., ronan opt, medieval opt.). (e.g.: During GPO agricultural technology colonized Europe)

Results coherent with the lesson of the recent past
During the XXth century: - world population increased 4 times (from 1.5 to 6 billions)- agricultural production increased 5-6 times (green revolution)
The green revolution was founded on the intensification of cropping systems carried out by means of strong enhancements genetics (new optimized varieties) and agro-techniques (soil works, weeds, pesticides, fertilizers, food conservation, etc.)
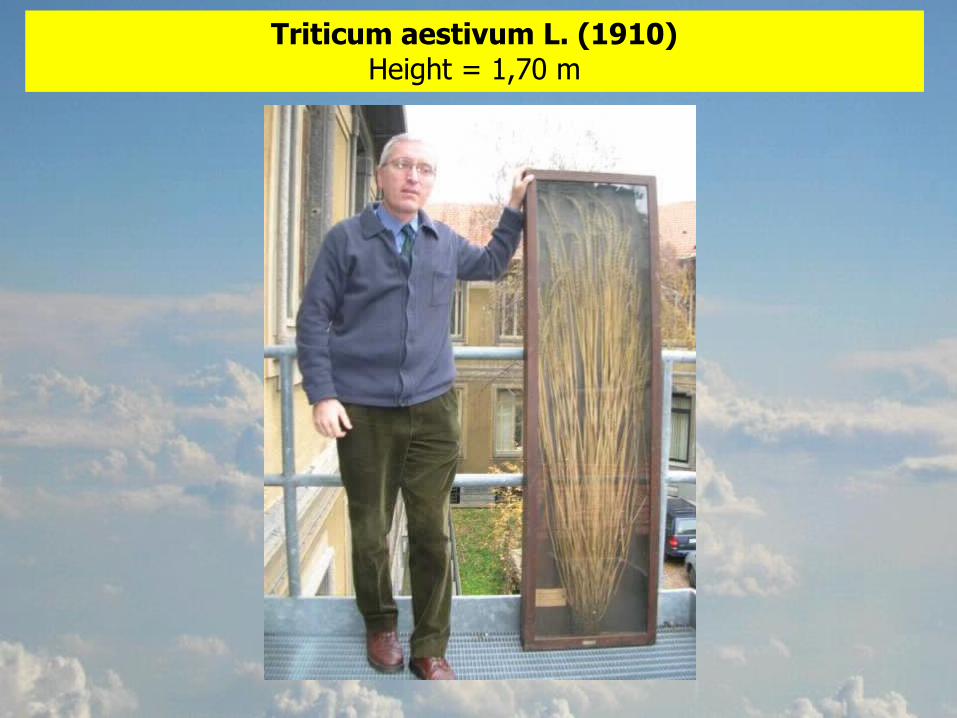
Triticum aestivum L. (1910)Height = 1,70 m
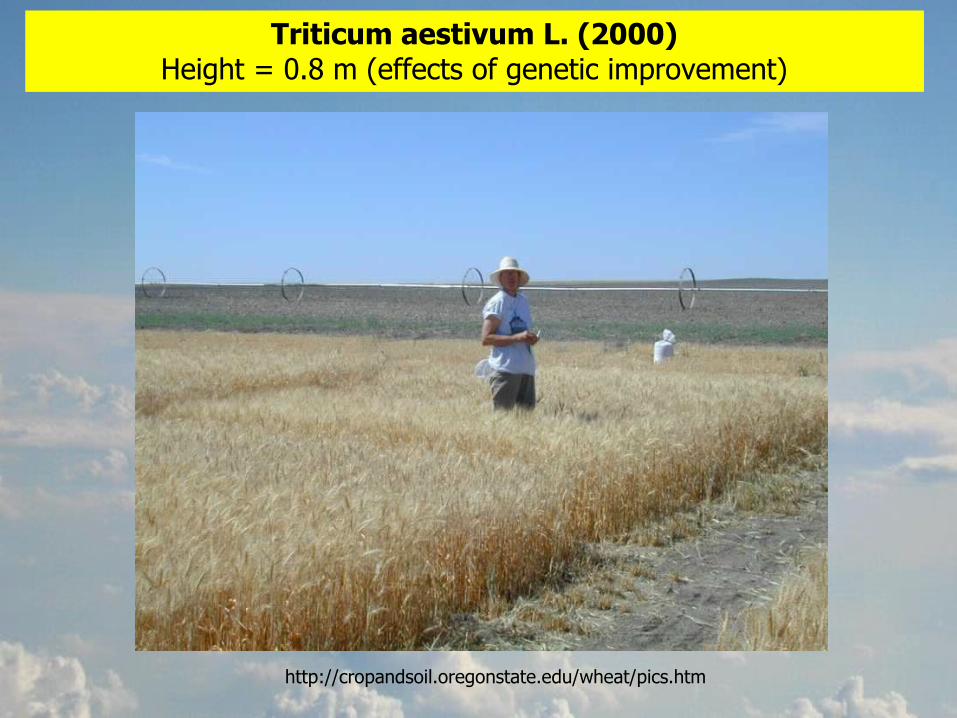
Triticum aestivum L. (2000)Height = 0.8 m (effects of genetic improvement)
http://cropandsoil.oregonstate.edu/wheat/pics.htm

Intensive agriculture and biodiversity
A paradox that should be analyzed:
Intensive agriculture (strong density of a single specie on a limited territory) is the contrary of biodiversity.
Intensive agriculture preserve biodiversity in natural environments

Forest surface in Italy in 2000 (+70%)
Source: Conti G, Fagarazzi L., 2005. Avanzamento del bosco in ecosistemi montani: “sogno degli ambientalisti o incubo per la società”?

The case of Cencenighe (BL)
1900
2004
Fonte: Conti G, Fagarazzi L., 2005. Avanzamento del bosco in ecosistemi montani: “sogno degli ambientalisti o incubo per la società”?

The case of Cortina d'Ampezzo
1903
1958
2004
Fonte: Conti G, Fagarazzi L., 2005. Avanzamento del bosco in ecosistemi montani: “sogno degli ambientalisti o incubo per la società”?

These kinds of mechanisms are in place in other areas too?
(trend NDVI 1982-2003 in areas prone to desertification risk)
source: Ulf Helldén e Christian Tottrup, 2008. Regional desertification: A global synthesis. Global and Planetary Change 64 (2008) 169–176
The future - until 2050
2050: world population will reach 9.5 billions.
How to produce: further intensification (genetics and agro-techniques).
Where to produce: production will be mainly carried out on suitable lands (1.4 billions of ha of arable lands maily at mid latitudes; 3.2 billions of ha of pastures)
Why to produce: for food, for consumables, for durable goods
CO2 could be seen as a fundamental resource for crop production!
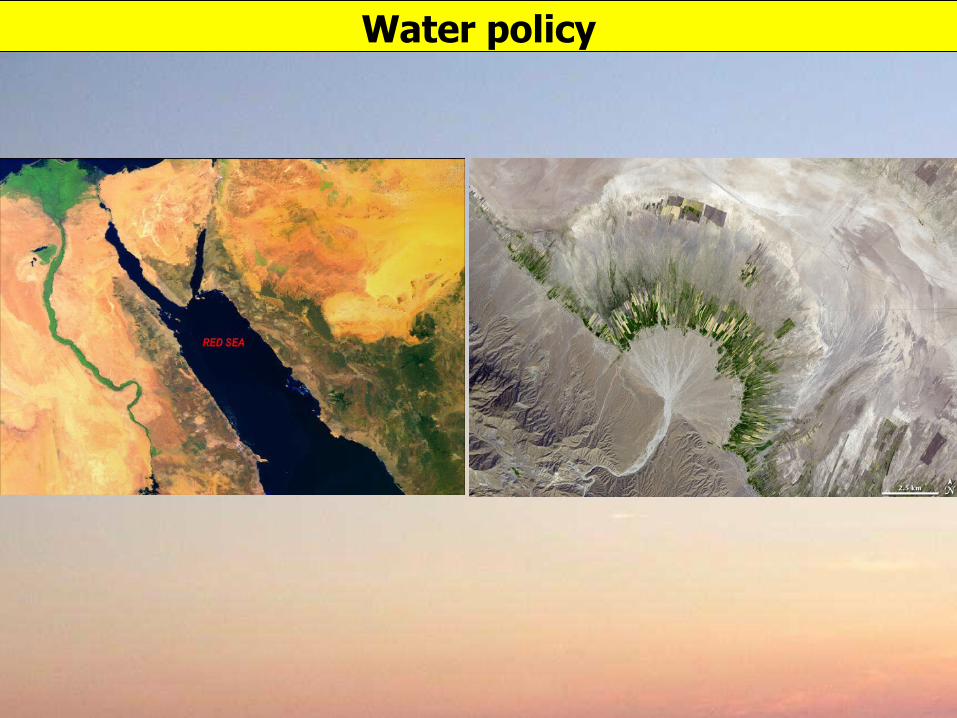
Water policy

Fonte: Agenzia Milanese Mobilità e Ambiente, rapporto sulla qualità dell’aria 2001Fonte: Uruguay - Min. del Turismo
Land policy
Rural Sub-urban Urban

Policy against soil degradation (erosion, salinization, etc.)
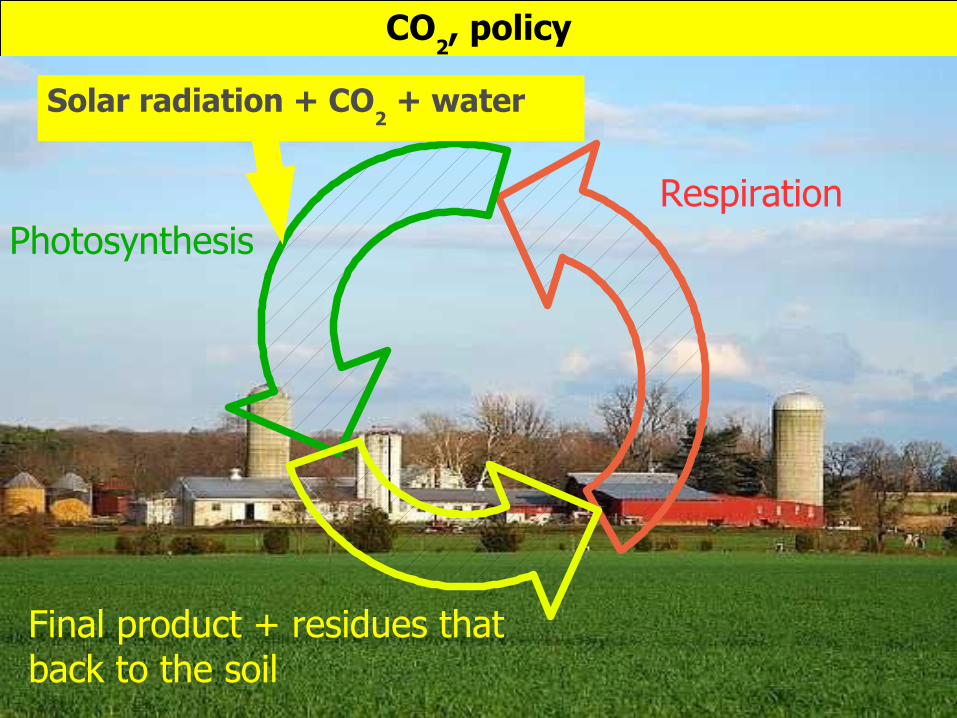
CO2, policy
PhotosynthesisRespiration
Final product + residues that back to the soil
Solar radiation + CO2 + water
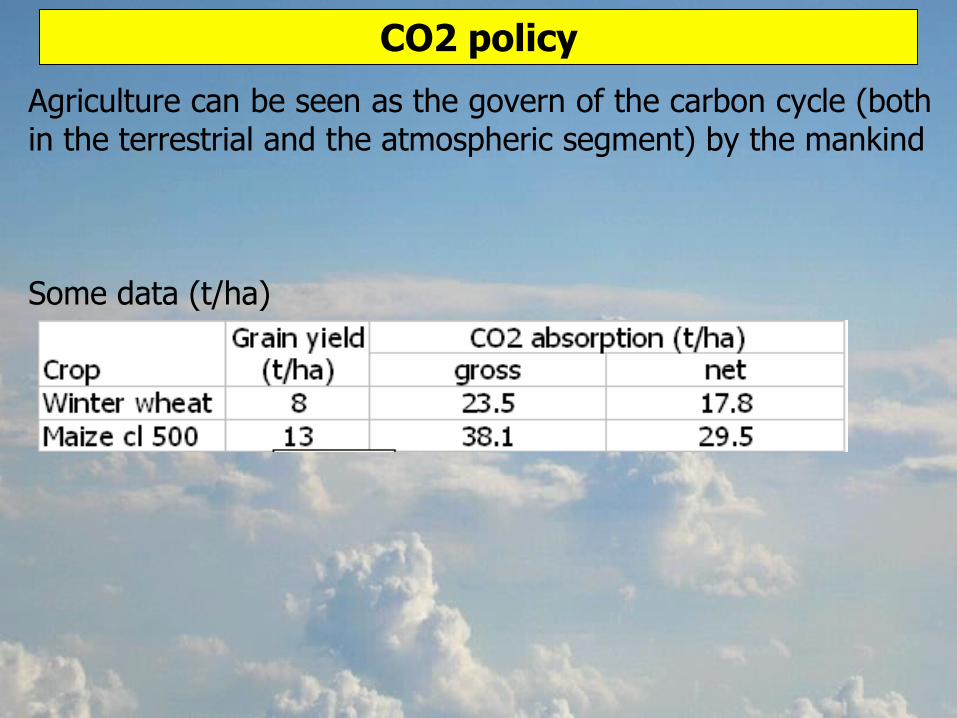
CO2 policy
Agriculture can be seen as the govern of the carbon cycle (both in the terrestrial and the atmospheric segment) by the mankind
Some data (t/ha)

vaso in steatite con corteo di mietitori, (palazzo di Hagia Triada, Tardo minoico, 1500 aC)