Embed Size (px)
Citation preview

Climate Change and Agriculture in California:
Adaptation to Extreme Events November 16, 2011
Daniel A. Sumner
University of California Agricultural Issues Center

Major Points in the Presentation • Previous speakers have documented, climate has been
changing in ways relevant to agriculture – Temperature trends are well documented, higher lows in the
winter and the summer – Climate models suggest more variability, and in some
particularly vulnerable regions --east Africa • Climate shifts outside California affect agriculture
here directly through the demand side in global markets
• Increased climate variability and the frequency and magnitude of extreme weather events affect: – The supply side and the demand size of agricultural markets – Prices and quantities (and recall P x Q = Revenue) – Producers and consumers – Individual farms and industries as a whole
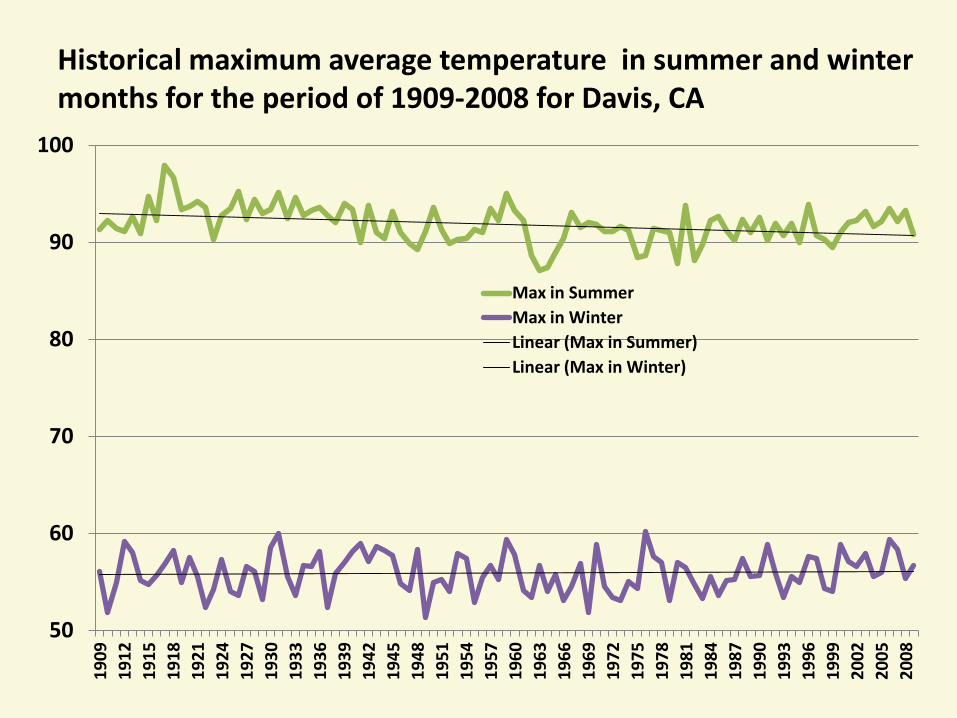
Historical maximum average temperature in summer and winter months for the period of 1909-2008 for Davis, CA
50
60
70
80
90
100
1909
19
12
1915
19
18
1921
19
24
1927
19
30
1933
19
36
1939
19
42
1945
19
48
1951
19
54
1957
19
60
1963
19
66
1969
19
72
1975
19
78
1981
19
84
1987
19
90
1993
19
96
1999
20
02
2005
20
08
Max in Summer Max in Winter Linear (Max in Summer) Linear (Max in Winter)
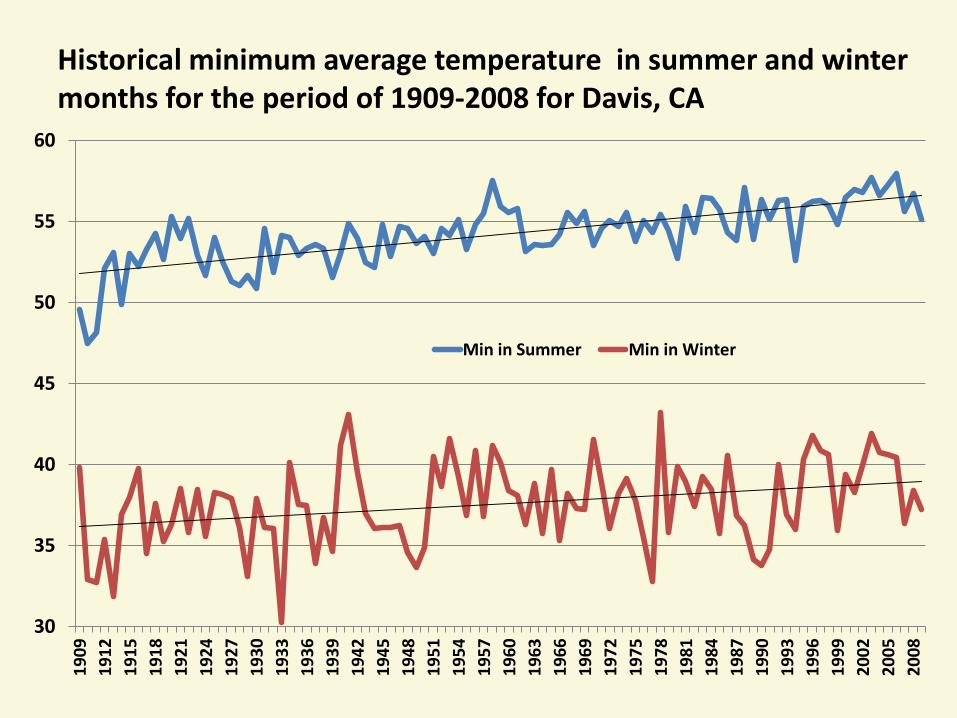
Historical minimum average temperature in summer and winter months for the period of 1909-2008 for Davis, CA
30
35
40
45
50
55
60
1909
19
12
1915
19
18
1921
19
24
1927
19
30
1933
19
36
1939
19
42
1945
19
48
1951
19
54
1957
19
60
1963
19
66
1969
19
72
1975
19
78
1981
19
84
1987
19
90
1993
19
96
1999
20
02
2005
20
08
Min in Summer Min in Winter
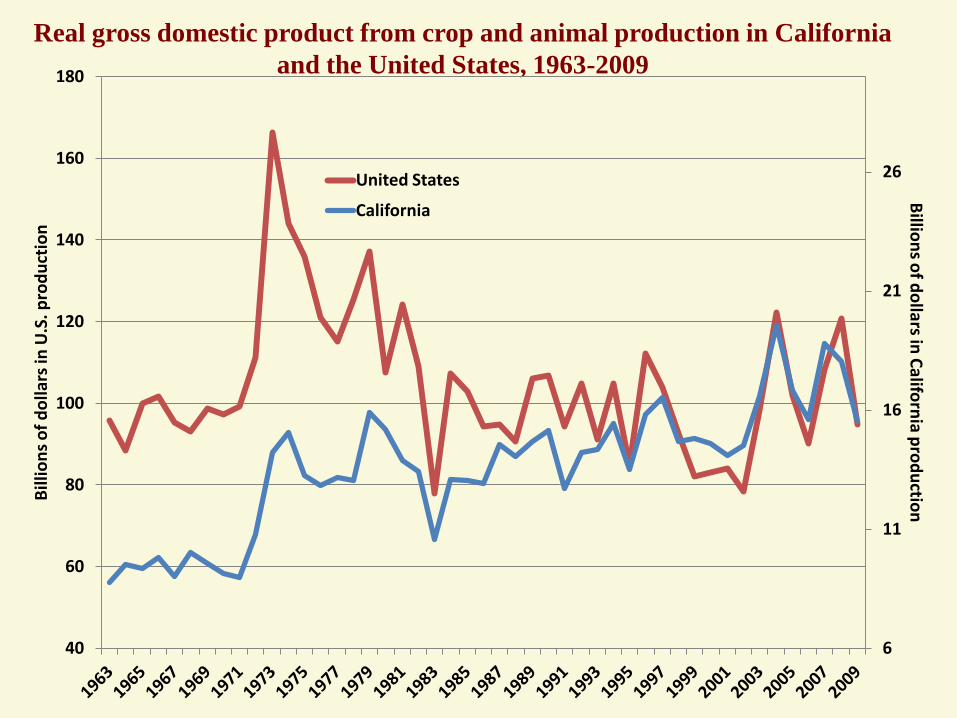
Real gross domestic product from crop and animal production in California and the United States, 1963-2009
6
11
16
21
26
40
60
80
100
120
140
160
180
Billions of dollars in California production Bi
llion
s of d
olla
rs in
U.S
. pro
duct
ion
United States
California
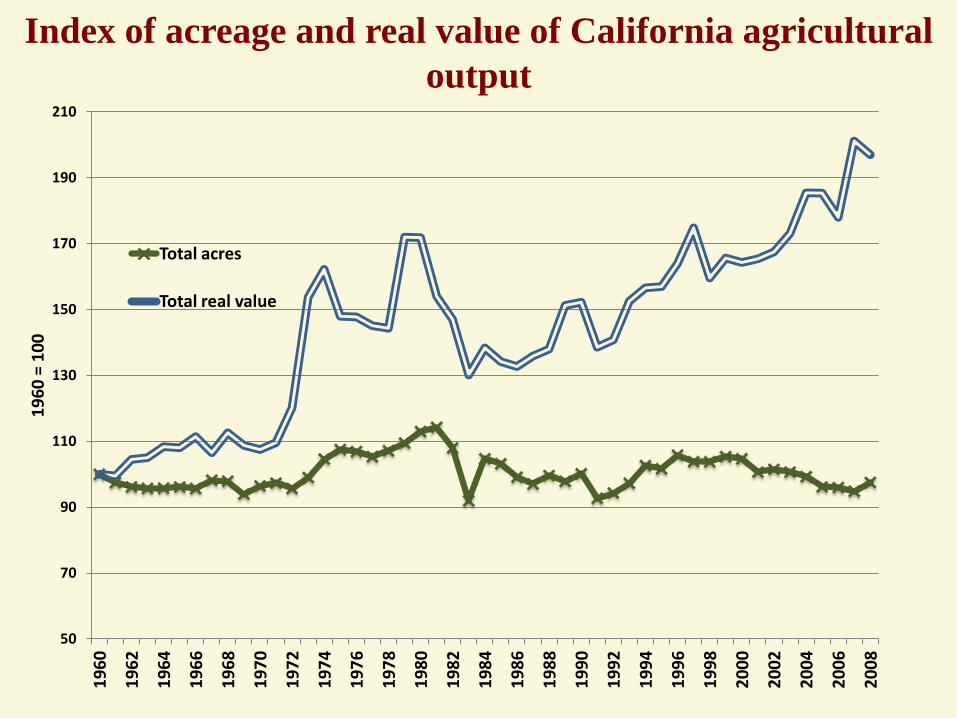
Index of acreage and real value of California agricultural output
50
70
90
110
130
150
170
190
210 19
60
1962
1964
1966
1968
1970
1972
1974
1976
1978
1980
1982
1984
1986
1988
1990
1992
1994
1996
1998
2000
2002
2004
2006
2008
1960
= 1
00
Total acres
Total real value
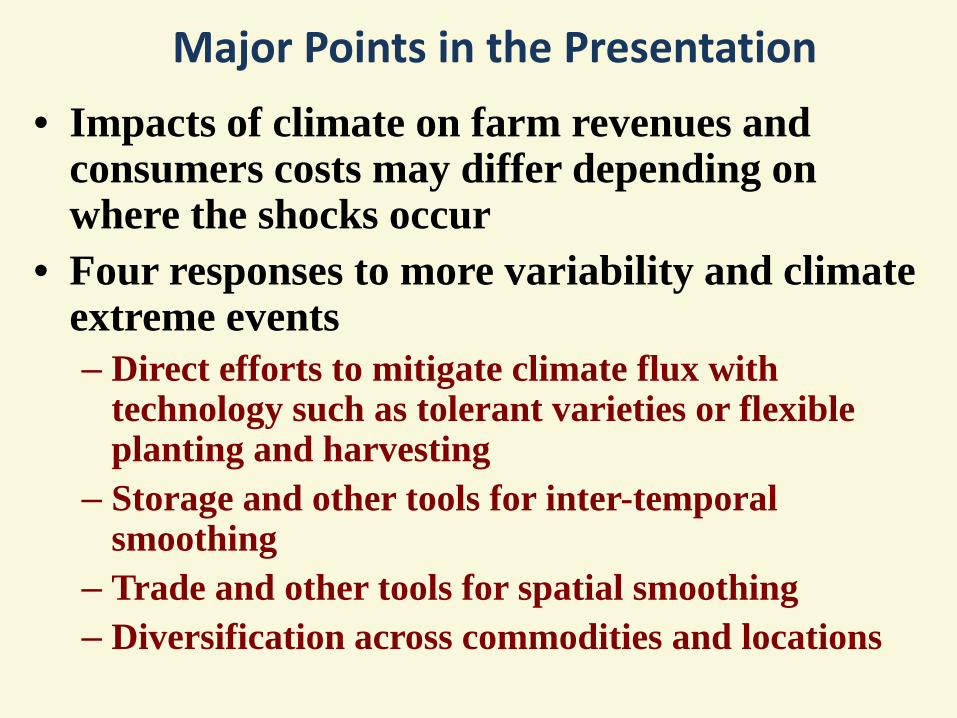
Major Points in the Presentation • Impacts of climate on farm revenues and
consumers costs may differ depending on where the shocks occur
• Four responses to more variability and climate extreme events – Direct efforts to mitigate climate flux with
technology such as tolerant varieties or flexible planting and harvesting
– Storage and other tools for inter-temporal smoothing
– Trade and other tools for spatial smoothing – Diversification across commodities and locations
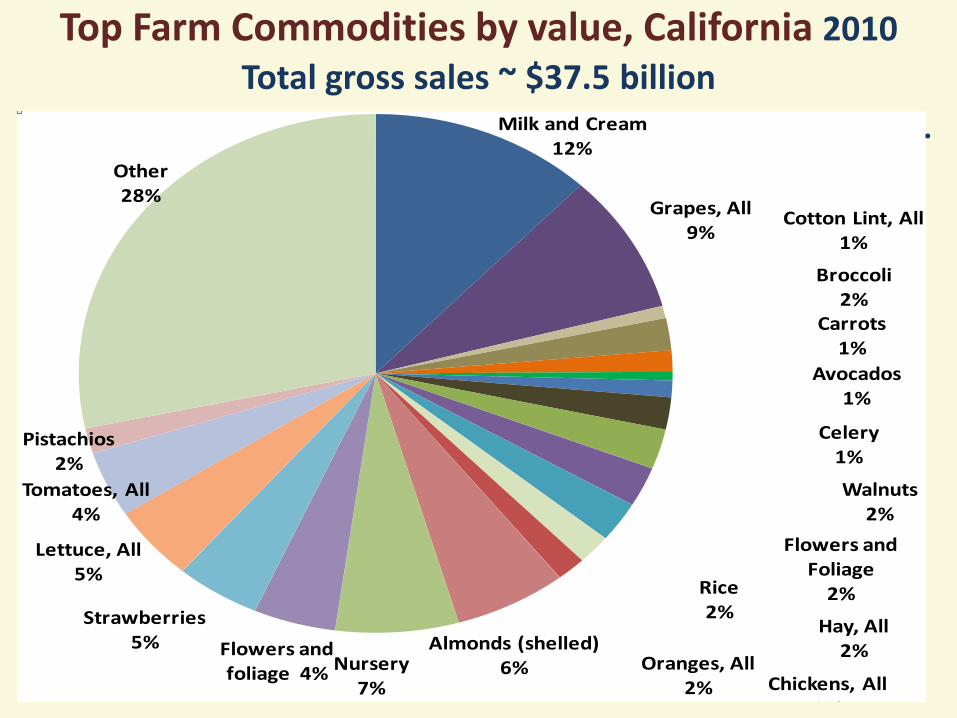
Milk and Cream12%
Grapes, All9%
Cotton Lint, All1%
Broccoli2%
Carrots1%
Avocados1%
Celery1%
Walnuts2%
Flowers and Foliage
2%
Hay, All2%
Rice2%
Chickens, All2%
Oranges, All2%
Almonds (shelled)6%Nursery
7%
Flowers and foliage 4%
Strawberries5%
Lettuce, All5%
Tomatoes, All4%
Pistachios2%
Other28%
Top Farm Commodities by value, California 2010 Total gross sales ~ $37.5 billion
.

Diversification across commodities • California commodity diversification is unlike many
regions, for example the American Midwest
• Commodity diversification means revenue is smoothed when supply or demand shocks occur
• Agriculture as a whole is diversified across crops and individual farms also diversify
• Farms grow several tree crops or several field crops and have rotations that include grains and hay and tomatoes, for example
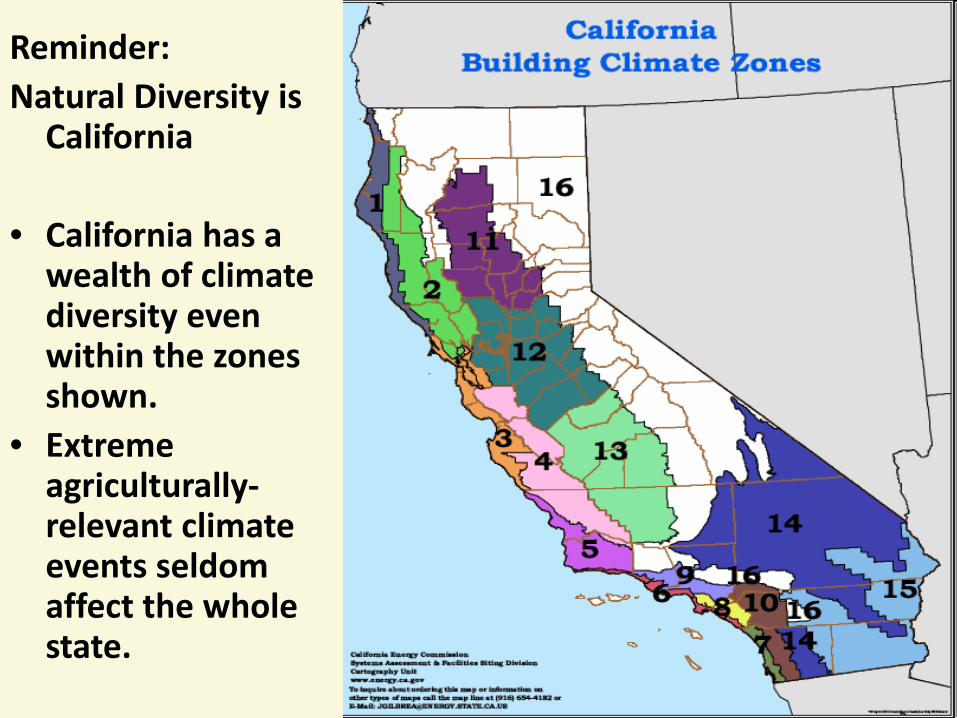
Reminder: Natural Diversity is
California • California has a
wealth of climate diversity even within the zones shown.
• Extreme agriculturally- relevant climate events seldom affect the whole state.
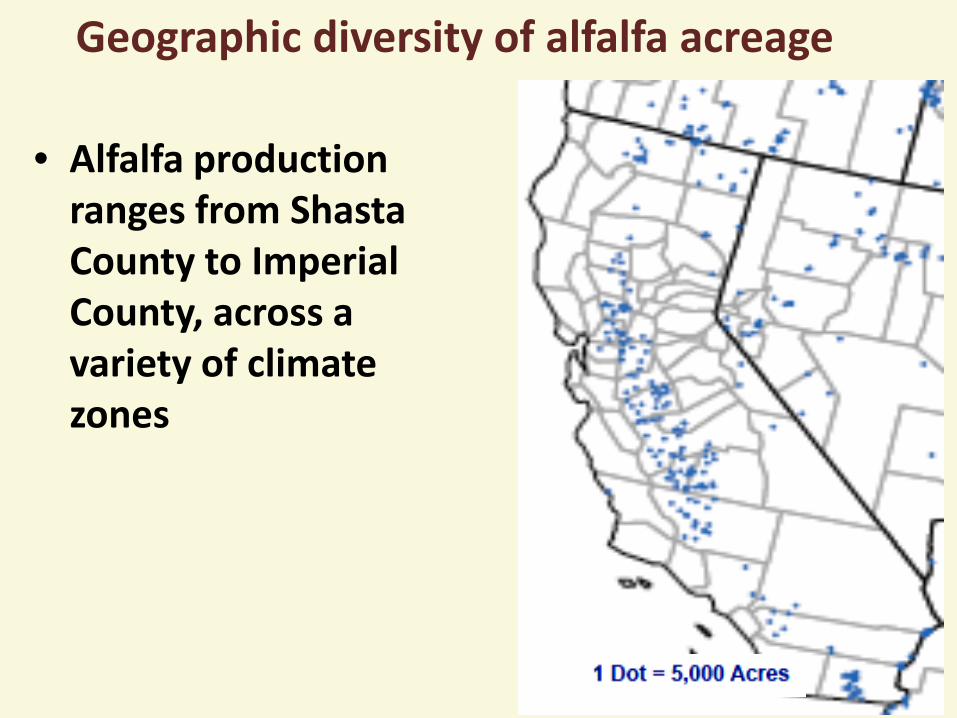
Geographic diversity of alfalfa acreage
• Alfalfa production ranges from Shasta County to Imperial County, across a variety of climate zones

Geographic diversity of tomato acreage
• Most tomato acreage is for processing tomatoes
• Tomato acreage is
mainly in the Central Valley, but from Chico to Bakersfield
• Production takes place in several climate zones
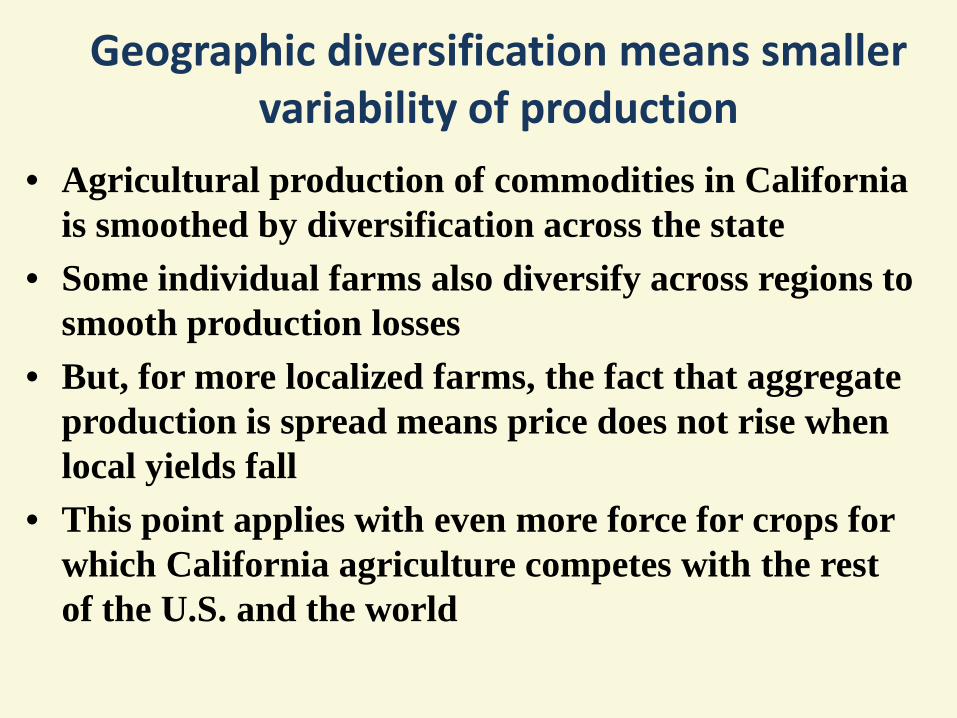
Geographic diversification means smaller variability of production
• Agricultural production of commodities in California is smoothed by diversification across the state
• Some individual farms also diversify across regions to smooth production losses
• But, for more localized farms, the fact that aggregate production is spread means price does not rise when local yields fall
• This point applies with even more force for crops for which California agriculture competes with the rest of the U.S. and the world
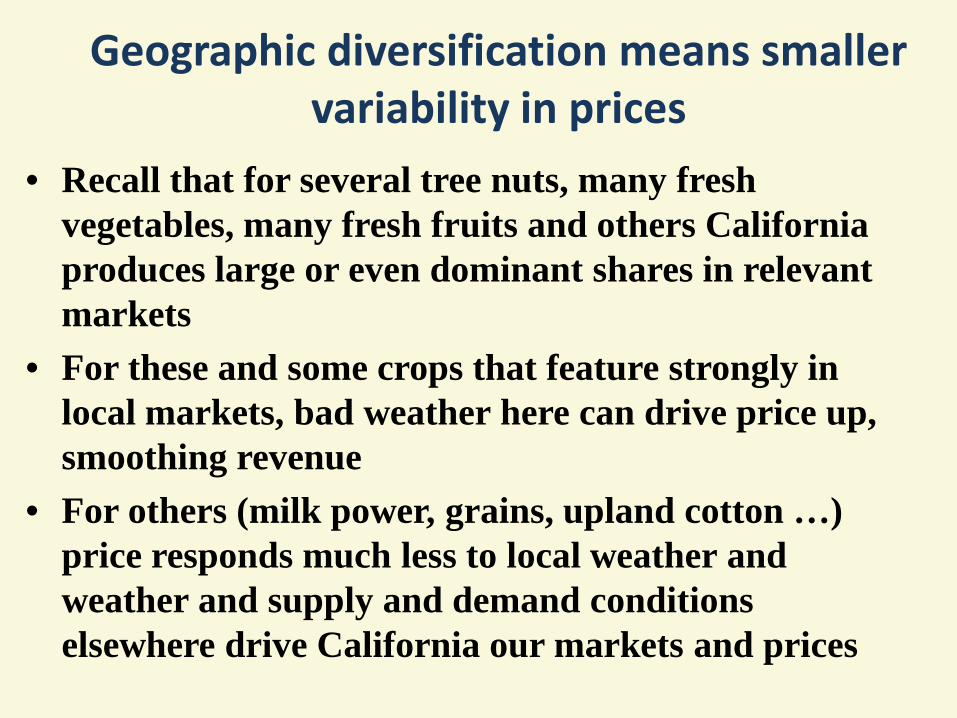
Geographic diversification means smaller variability in prices
• Recall that for several tree nuts, many fresh vegetables, many fresh fruits and others California produces large or even dominant shares in relevant markets
• For these and some crops that feature strongly in local markets, bad weather here can drive price up, smoothing revenue
• For others (milk power, grains, upland cotton …) price responds much less to local weather and weather and supply and demand conditions elsewhere drive California our markets and prices
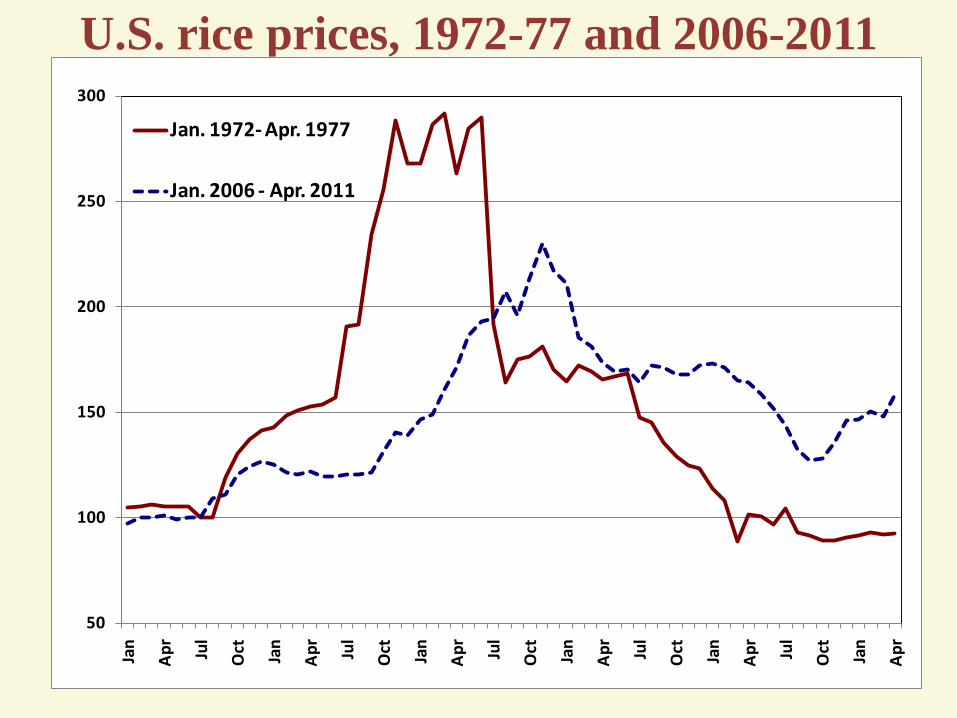
U.S. rice prices, 1972-77 and 2006-2011
50
100
150
200
250
300
Jan
Apr
Jul
Oct Jan
Apr
Jul
Oct Jan
Apr
Jul
Oct Jan
Apr
Jul
Oct Jan
Apr
Jul
Oct Jan
Apr
Jan. 1972- Apr. 1977
Jan. 2006 - Apr. 2011
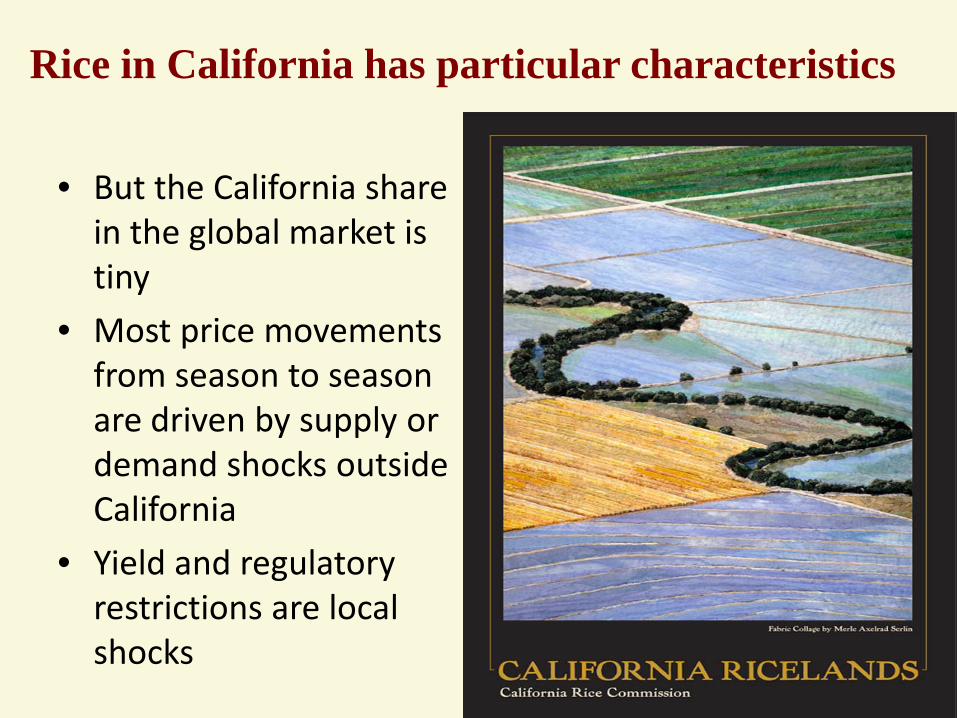
Rice in California has particular characteristics
• But the California share in the global market is tiny
• Most price movements from season to season are driven by supply or demand shocks outside California
• Yield and regulatory restrictions are local shocks
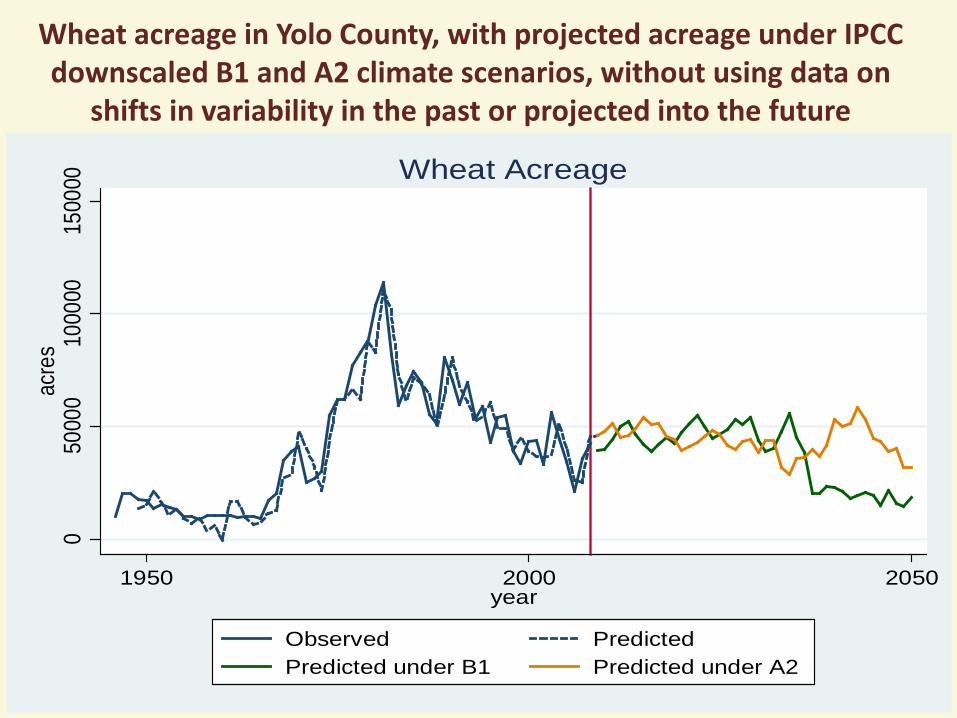
Wheat acreage in Yolo County, with projected acreage under IPCC downscaled B1 and A2 climate scenarios, without using data on
shifts in variability in the past or projected into the future 0
5000
010
0000
1500
00ac
res
1950 2000 2050year
Observed PredictedPredicted under B1 Predicted under A2
Wheat Acreage
Analysis of climate change and potential agricultural responses in Yolo County
Yolo county must take markets as given and thus local climate shocks do little to affect price or consumer availability unless selected demands are focused on local supply
Recent multidisciplinary research lead by Louise Jackson Jackson, L.E., V.R. Haden, A. Hollander, H. Lee, M. Lubell, V.
Mehta, T. O’Geen, M. Niles, J. Perlman, D. Purkey, W. Salas, D. Sumner, M. Tomuta, M. Dempsey, and S. Wheeler. 2011.
“Agricultural Mitigation and Adaptation to Climate Change in Yolo County, CA.”
• In preparation for a CEC California Climate Change Center Report.

Policy and Institutional Principles: what can public and private organization do?
• Enhance information flows, incentives and flexibility
• Improved forecasts with longer horizons (such as of el niño events) will have large payoffs
• Make technology options more accessible
• Adaptation in agriculture is local, but effective policy responses must reflect global impacts and inter-linkages.
• Flexible trade will play a critical role in both mitigation and adaptation, but will itself be shaped importantly by climate change.
• Avoid limiting incentives for private responses, including diversification, storage and trade
Responses to Climate change and especially increased variability in
poor countries
• Lybbert, Travis and Daniel A. Sumner. 2012. “AGRICULTURAL TECHNOLOGIES FOR CLIMATE CHANGE IN DEVELOPING COUNTRIES: POLICY OPTIONS FOR INNOVATION AND TECHNOLOGY DIFFUSION.” Food Policy, forthcoming 2012.
• The lessons also apply in California

Priorities especially relevant for California • Invest in agricultural R&D focused on
adaptation and flexibility
• Encourage development of practices that incorporate rapid response (frost control) or mitigation of impacts (drought tolerant varieties)
• Allow shifts in production patters without removing incentive through subsidies for the status quo (as in government provided insurance)

Thank you. Dan Sumner
www.aic.ucdavis.edu