Embed Size (px)
Citation preview
K. Raja ReddyDept. of Plant and Soil Sciences
Mississippi State UniversityMississippi State, MS, USA
Climate Change and Crop Productivity: What is at Stake?

Outline
Past and future trends in population, food production and climate change perturbations.
Global environmental change and its impact on agriculture production systems.
Role of crop simulation models in addressing future food security and climate change.

Trends That Shape Our Future
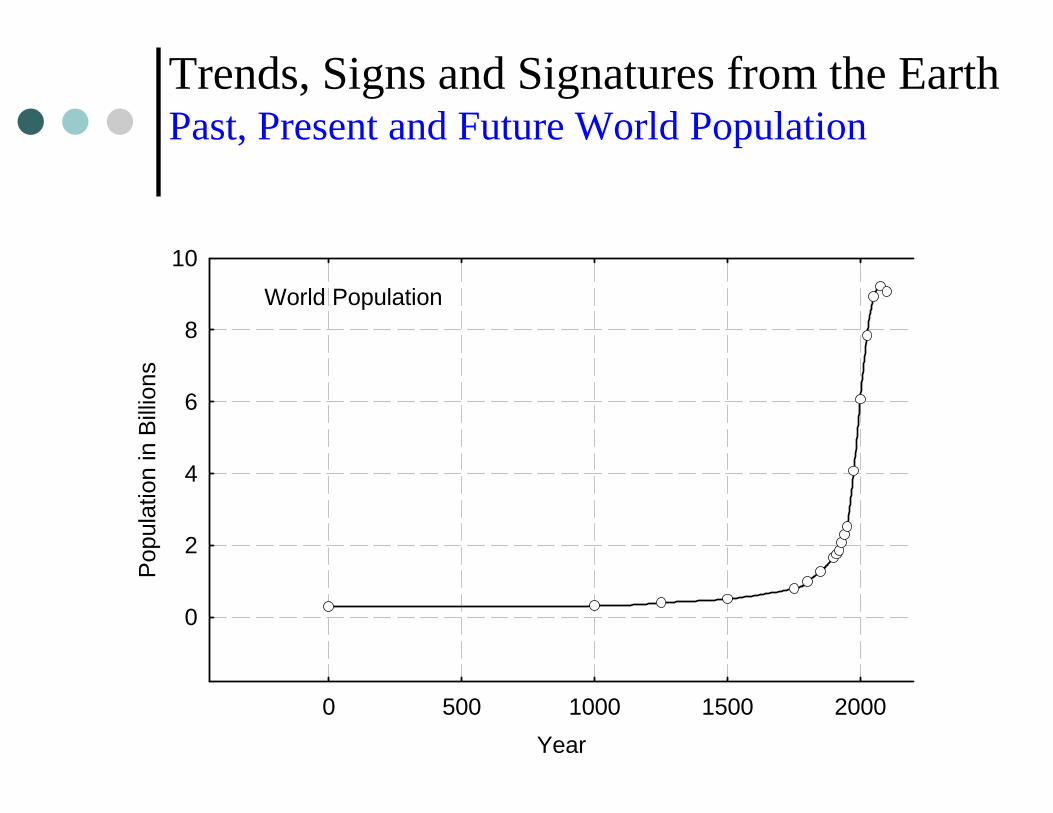
Trends, Signs and Signatures from the Earth Past, Present and Future World Population
Year0 500 1000 1500 2000
Popu
latio
n in
Billi
ons
0
2
4
6
8
10World Population
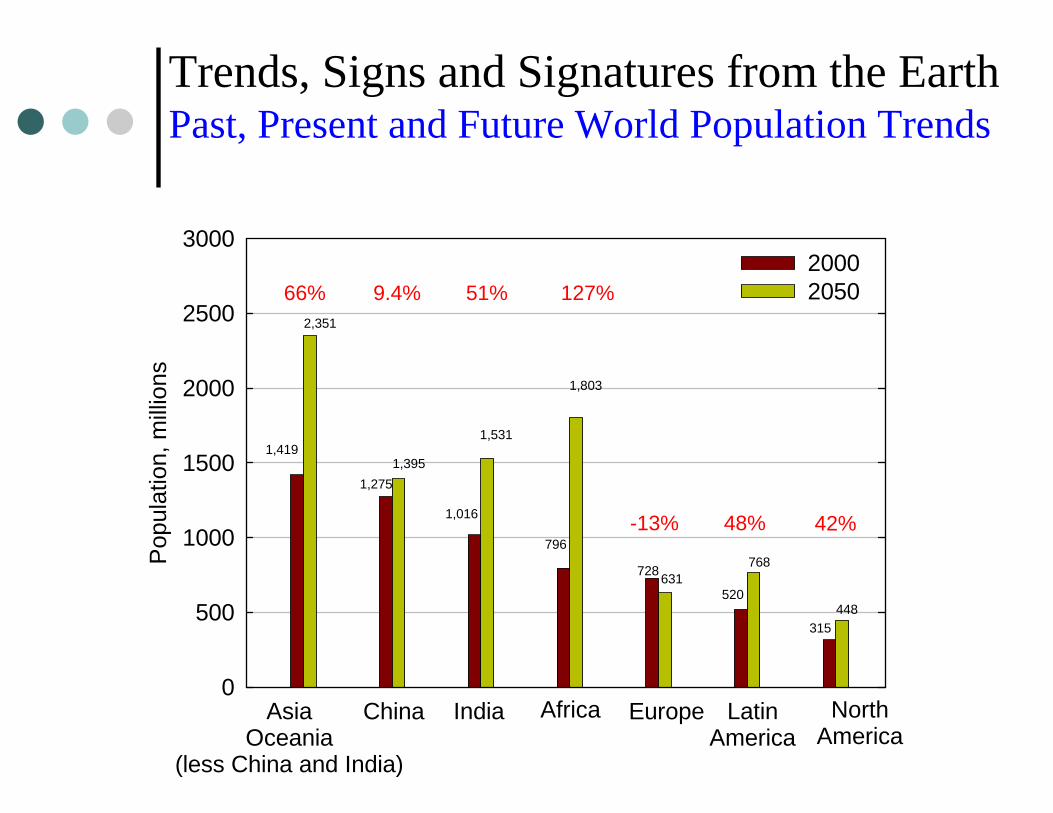
Trends, Signs and Signatures from the Earth Past, Present and Future World Population Trends
Pop
ulat
ion,
milli
ons
0
500
1000
1500
2000
2500
300020002050
AsiaOceania
(less China and India)
China India Africa Europe LatinAmerica
NorthAmerica
2,351
1,395
1,531
1,803
631768
448
1,419
1,275
1,016
796
728
520
315
66% 9.4% 51% 127%
-13% 48% 42%
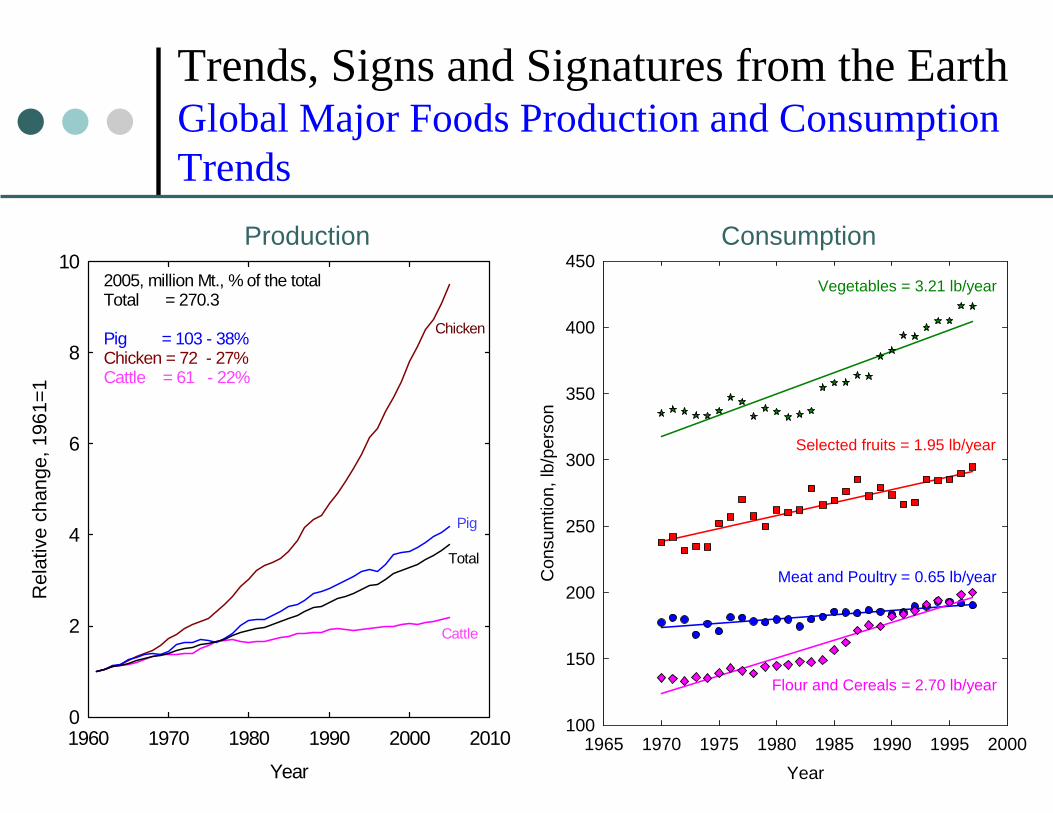
Trends, Signs and Signatures from the Earth Global Major Foods Production and Consumption Trends
Year1965 1970 1975 1980 1985 1990 1995 2000
Con
sum
tion,
lb/p
erso
n
100
150
200
250
300
350
400
450
Selected fruits = 1.95 lb/year
Vegetables = 3.21 lb/year
Flour and Cereals = 2.70 lb/year
Meat and Poultry = 0.65 lb/year
Year
1960 1970 1980 1990 2000 2010
Rel
ativ
e ch
ange
, 196
1=1
0
2
4
6
8
10
Chicken
Pig
Total
Cattle
2005, million Mt., % of the totalTotal = 270.3
Pig = 103 - 38%Chicken = 72 - 27%Cattle = 61 - 22%
Production Consumption
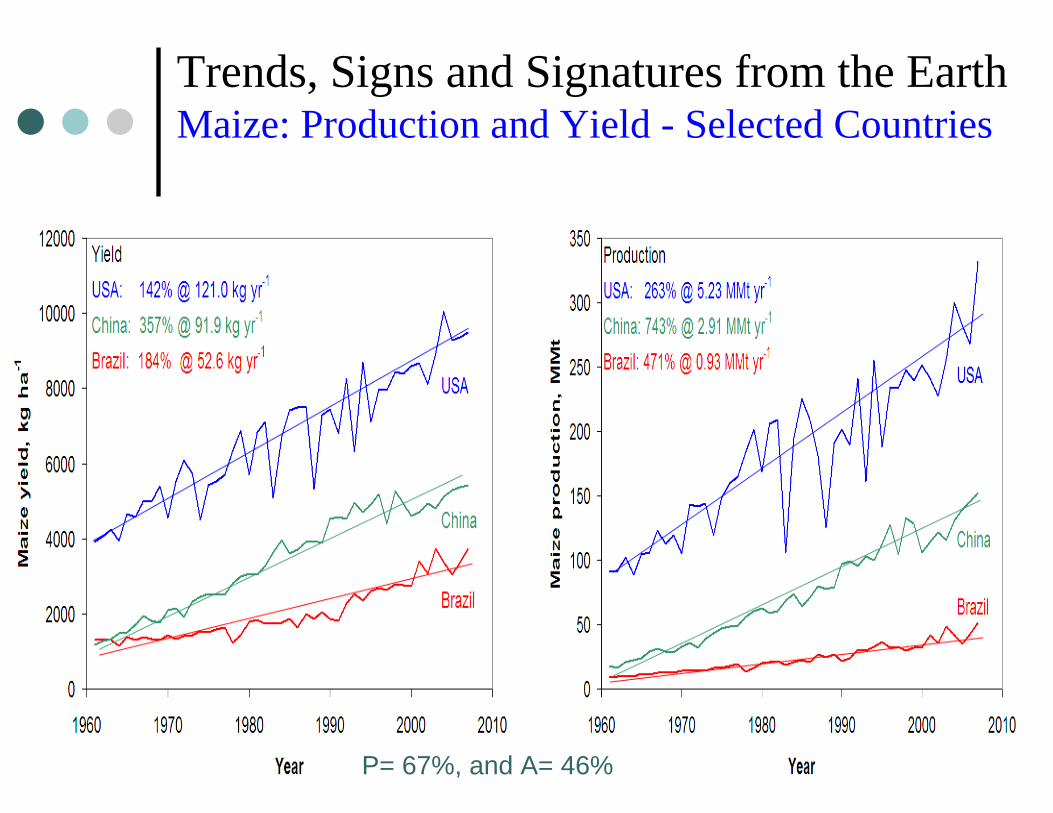
P= 67%, and A= 46%
Trends, Signs and Signatures from the Earth Maize: Production and Yield - Selected Countries
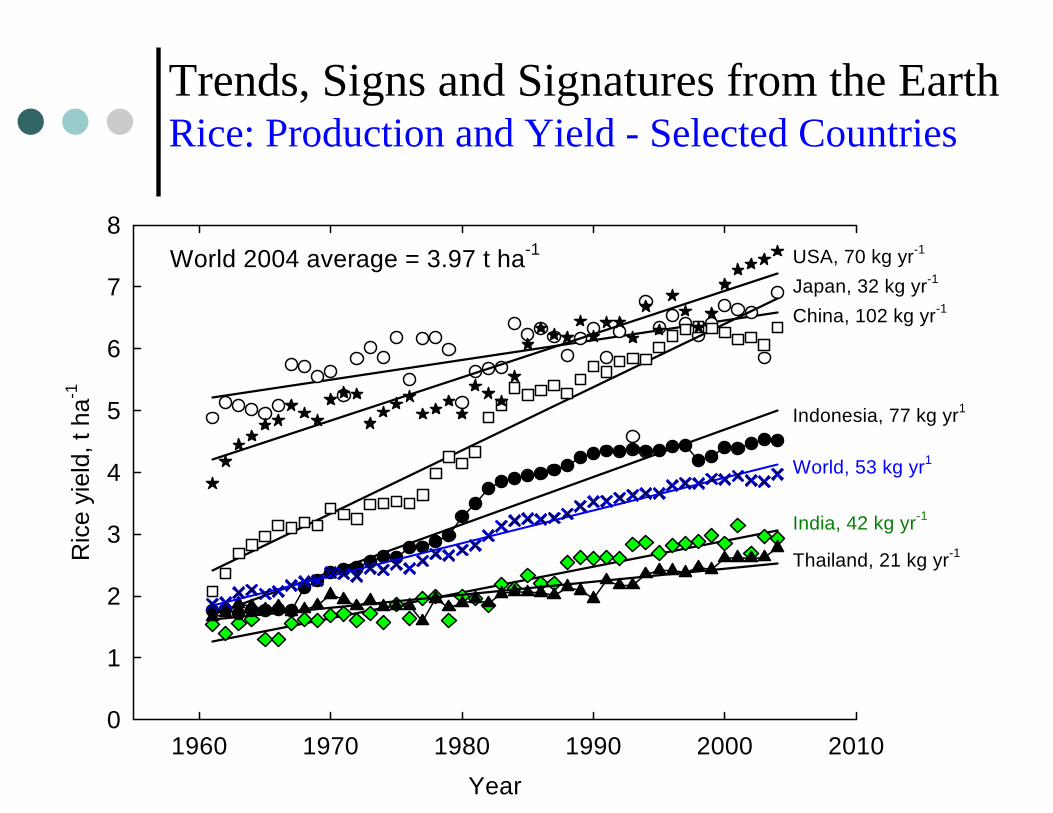
Year1960 1970 1980 1990 2000 2010
Ric
e yi
eld,
t ha
-1
0
1
2
3
4
5
6
7
8USA, 70 kg yr-1
Indonesia, 77 kg yr1
Japan, 32 kg yr-1
India, 42 kg yr-1
Thailand, 21 kg yr-1
China, 102 kg yr-1
World 2004 average = 3.97 t ha-1
World, 53 kg yr1
Trends, Signs and Signatures from the EarthRice: Production and Yield - Selected Countries
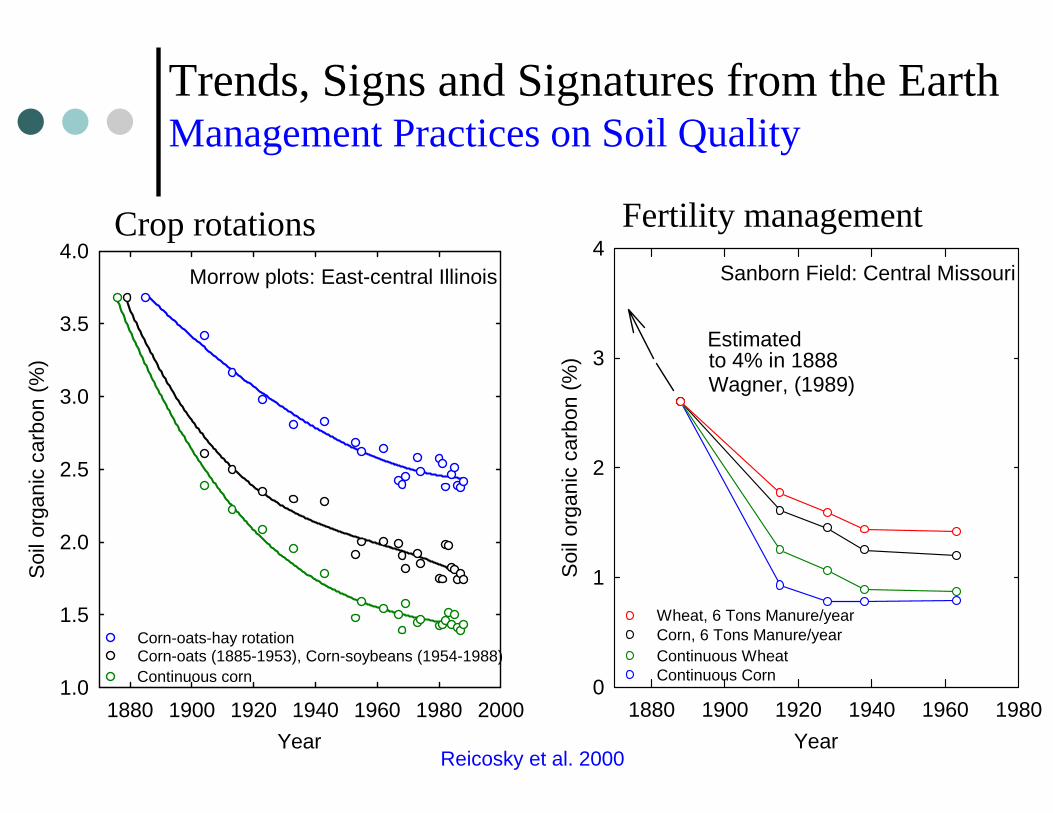
Trends, Signs and Signatures from the EarthManagement Practices on Soil Quality
Year1880 1900 1920 1940 1960 1980 2000
Soil
orga
nic
carb
on (%
)
1.0
1.5
2.0
2.5
3.0
3.5
4.0Morrow plots: East-central Illinois
Corn-oats-hay rotationCorn-oats (1885-1953), Corn-soybeans (1954-1988)Continuous corn
Year1880 1900 1920 1940 1960 1980
Soil
orga
nic
carb
on (%
)
0
1
2
3
4
Wagner, (1989)to 4% in 1888Estimated
Sanborn Field: Central Missouri
Wheat, 6 Tons Manure/yearCorn, 6 Tons Manure/yearContinuous WheatContinuous Corn
Crop rotations Fertility management
Reicosky et al. 2000
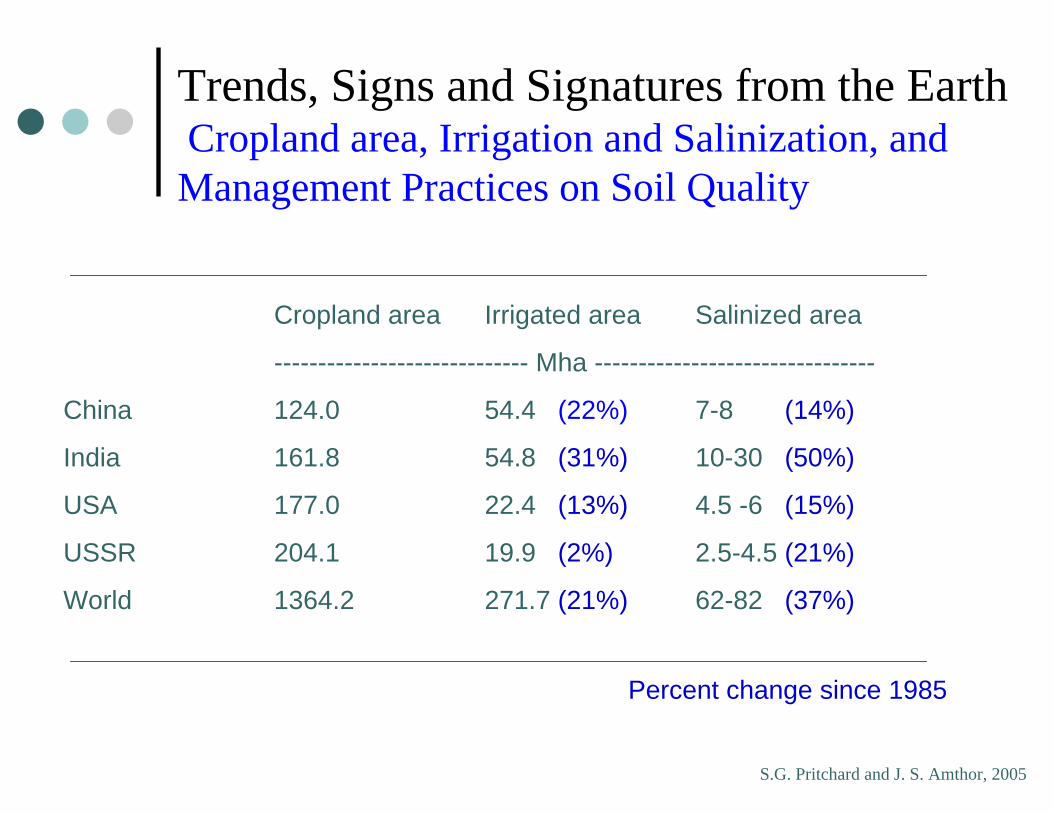
Cropland area Irrigated area Salinized area
----------------------------- Mha --------------------------------
China 124.0 54.4 (22%) 7-8 (14%)
India 161.8 54.8 (31%) 10-30 (50%)
USA 177.0 22.4 (13%) 4.5 -6 (15%)
USSR 204.1 19.9 (2%) 2.5-4.5 (21%)
World 1364.2 271.7 (21%) 62-82 (37%)
Percent change since 1985
Trends, Signs and Signatures from the EarthCropland area, Irrigation and Salinization, and Management Practices on Soil Quality
S.G. Pritchard and J. S. Amthor, 2005
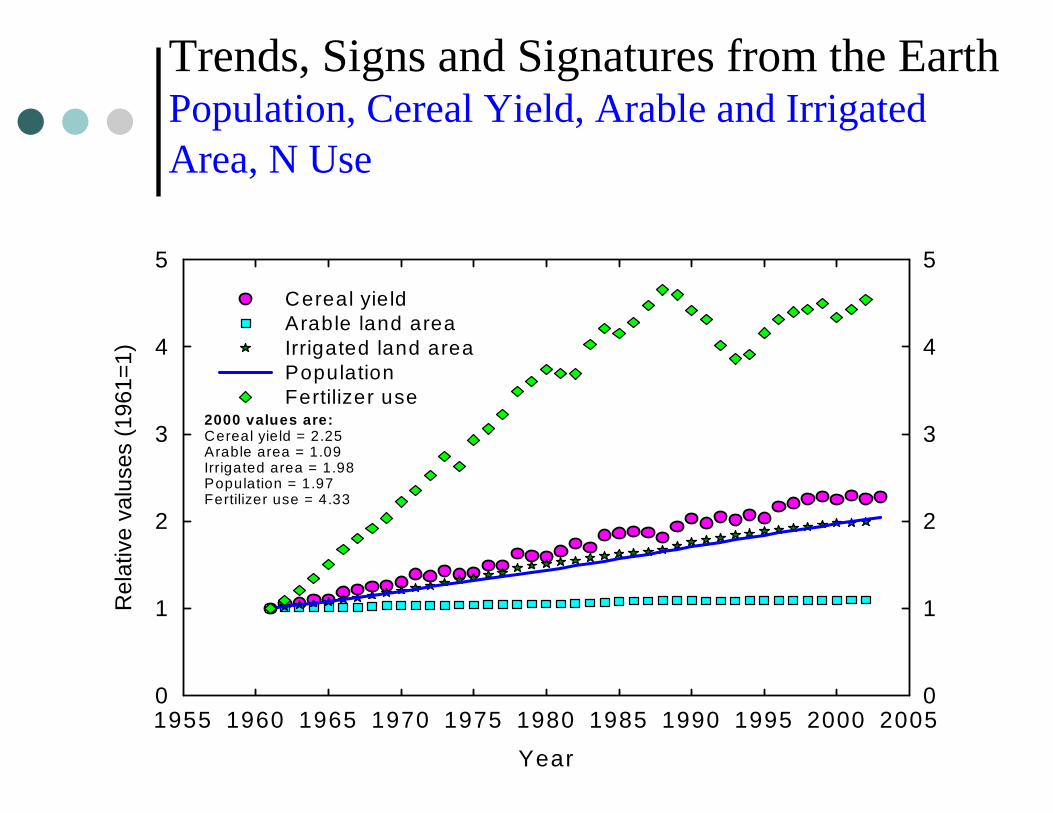
Trends, Signs and Signatures from the EarthPopulation, Cereal Yield, Arable and Irrigated Area, N Use
Year
1955 1960 1965 1970 1975 1980 1985 1990 1995 2000 2005
Rel
ativ
e va
luse
s (1
961=
1)
0
1
2
3
4
5
0
1
2
3
4
5Cereal yieldArable land areaIrrigated land areaPopulationFertilizer use
2000 values are:Cereal yield = 2.25Arable area = 1.09Irrigated area = 1.98Population = 1.97Fertilizer use = 4.33
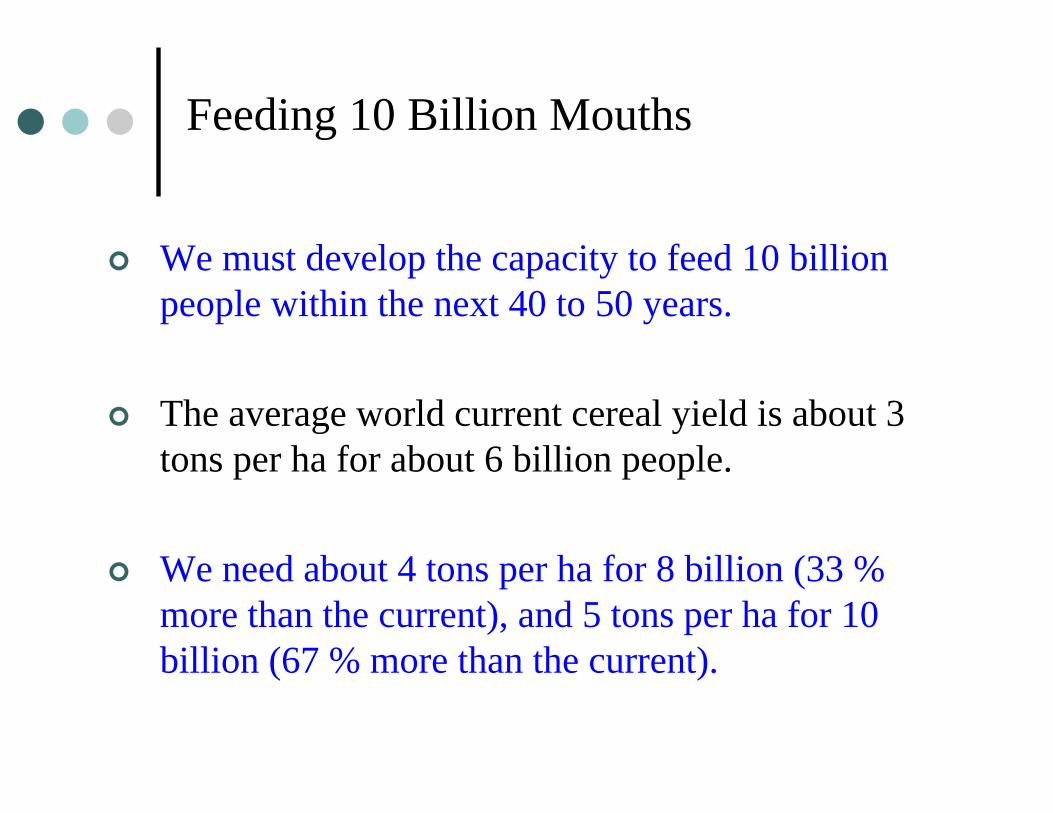
Feeding 10 Billion Mouths
We must develop the capacity to feed 10 billion people within the next 40 to 50 years.
The average world current cereal yield is about 3 tons per ha for about 6 billion people.
We need about 4 tons per ha for 8 billion (33 % more than the current), and 5 tons per ha for 10 billion (67 % more than the current).
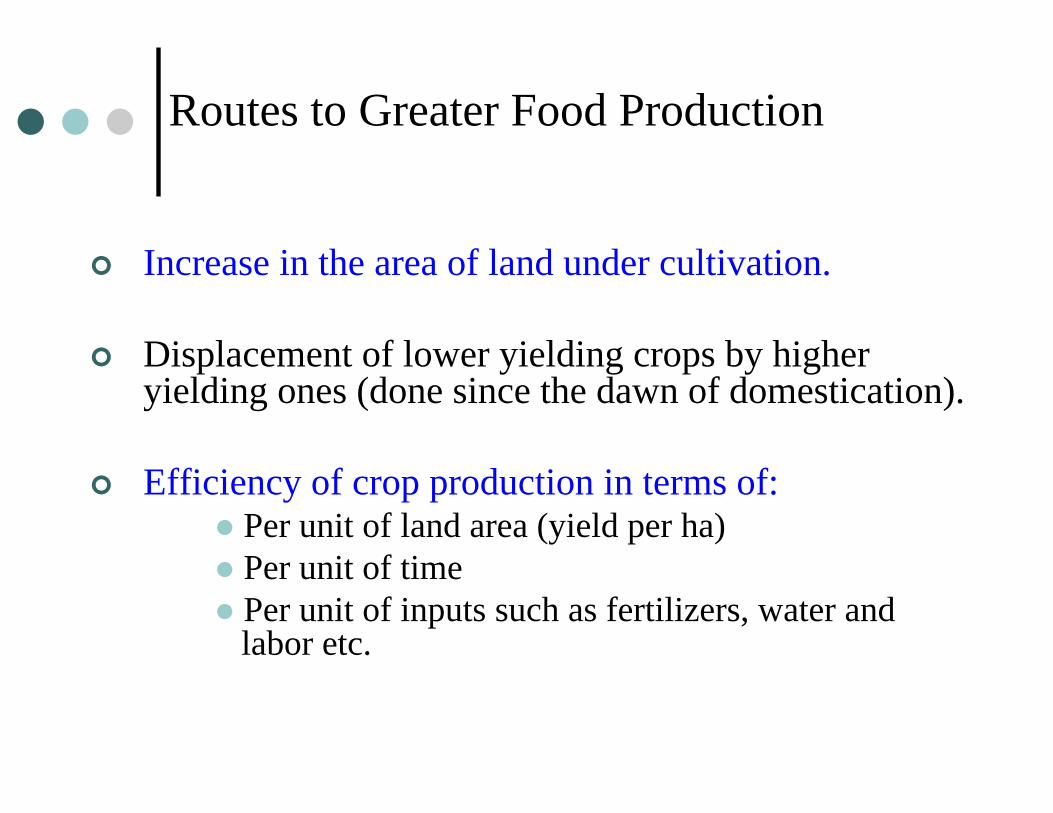
Increase in the area of land under cultivation.
Displacement of lower yielding crops by higher yielding ones (done since the dawn of domestication).
Efficiency of crop production in terms of:Per unit of land area (yield per ha)Per unit of timePer unit of inputs such as fertilizers, water andlabor etc.
Routes to Greater Food Production
Here Comes the Greatest Challenge of our Time,
The Global Climate Change
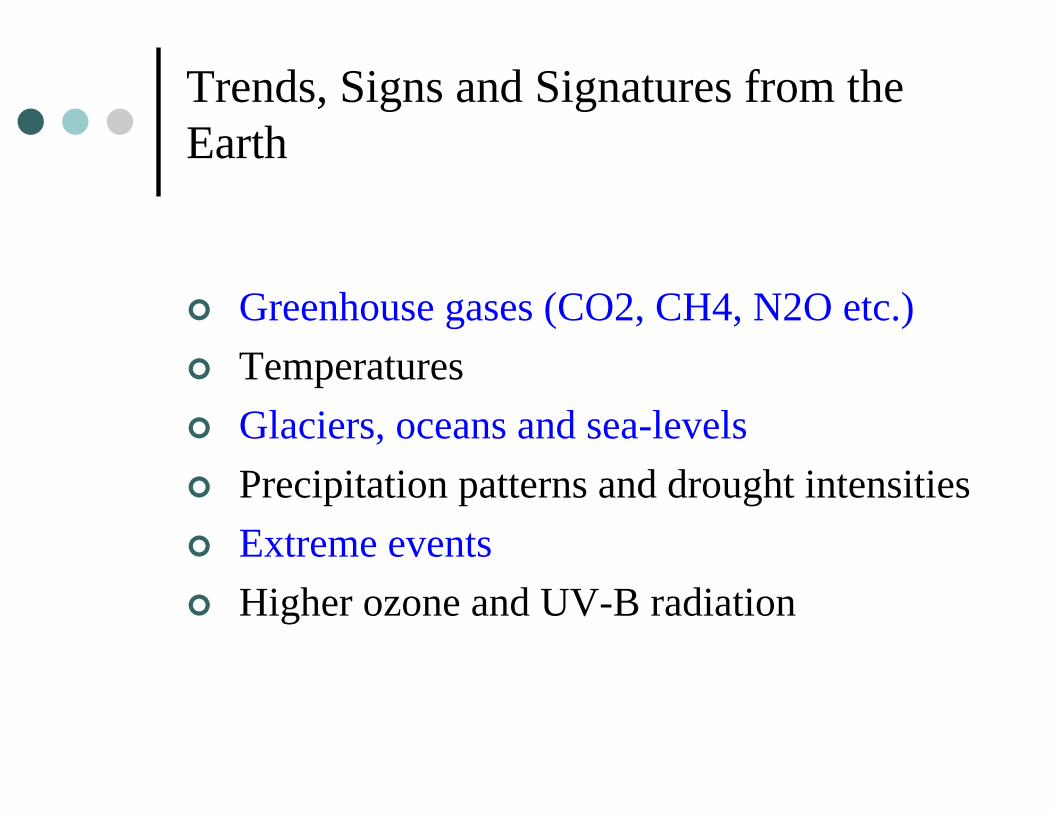
Trends, Signs and Signatures from the Earth
Greenhouse gases (CO2, CH4, N2O etc.)TemperaturesGlaciers, oceans and sea-levelsPrecipitation patterns and drought intensitiesExtreme eventsHigher ozone and UV-B radiation
Year
1700 1750 1800 1850 1900 1950 2000
CO
2 C
once
ntra
tion,
ppm
250
275
300
325
350
375
400
Glo
bal c
arbo
n em
issi
on, b
illio
n M
t. C
0
2
4
6
8
10
12
Annu
al fl
ux o
f car
bon
from
land
-use
cha
nge,
Pg
C
0
1
2
3
4
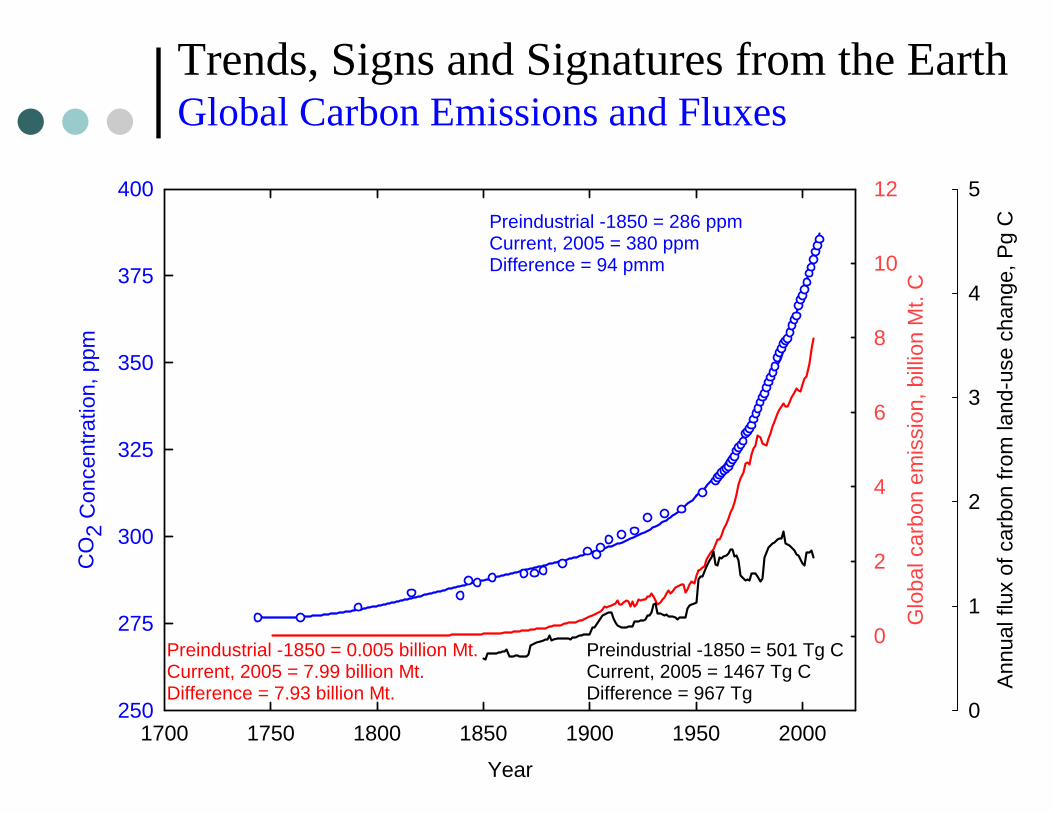
5Preindustrial -1850 = 286 ppmCurrent, 2005 = 380 ppm Difference = 94 pmm
Preindustrial -1850 = 0.005 billion Mt.Current, 2005 = 7.99 billion Mt. Difference = 7.93 billion Mt.
Preindustrial -1850 = 501 Tg CCurrent, 2005 = 1467 Tg C Difference = 967 Tg
Trends, Signs and Signatures from the EarthGlobal Carbon Emissions and Fluxes
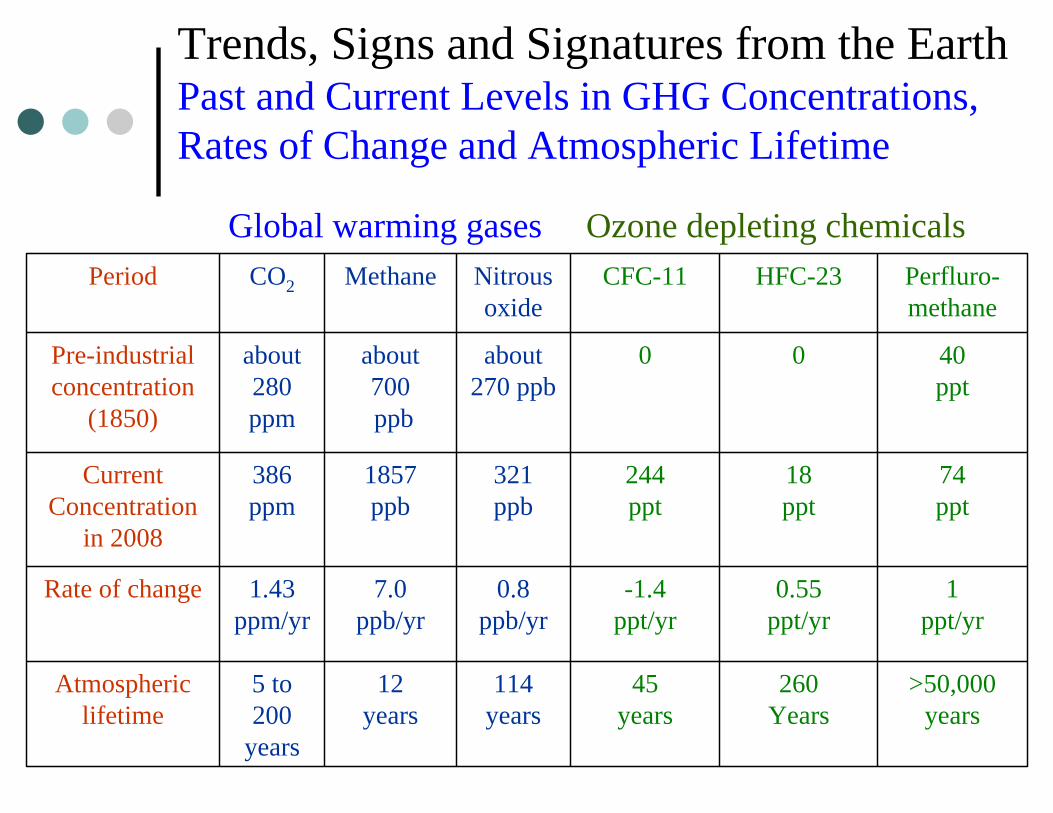
>50,000 years
260Years
45years
114years
12 years
5 to 200
years
Atmospheric lifetime
1 ppt/yr
0.55 ppt/yr
-1.4ppt/yr
0.8ppb/yr
7.0 ppb/yr
1.43ppm/yr
Rate of change
74ppt
18ppt
244ppt
321ppb
1857ppb
386ppm
Current Concentration
in 2008
40ppt
00about 270 ppb
about 700ppb
about 280 ppm
Pre-industrial concentration
(1850)
Perfluro-methane
HFC-23CFC-11Nitrous oxide
MethaneCO2Period
Trends, Signs and Signatures from the EarthPast and Current Levels in GHG Concentrations, Rates of Change and Atmospheric Lifetime
Global warming gases Ozone depleting chemicals
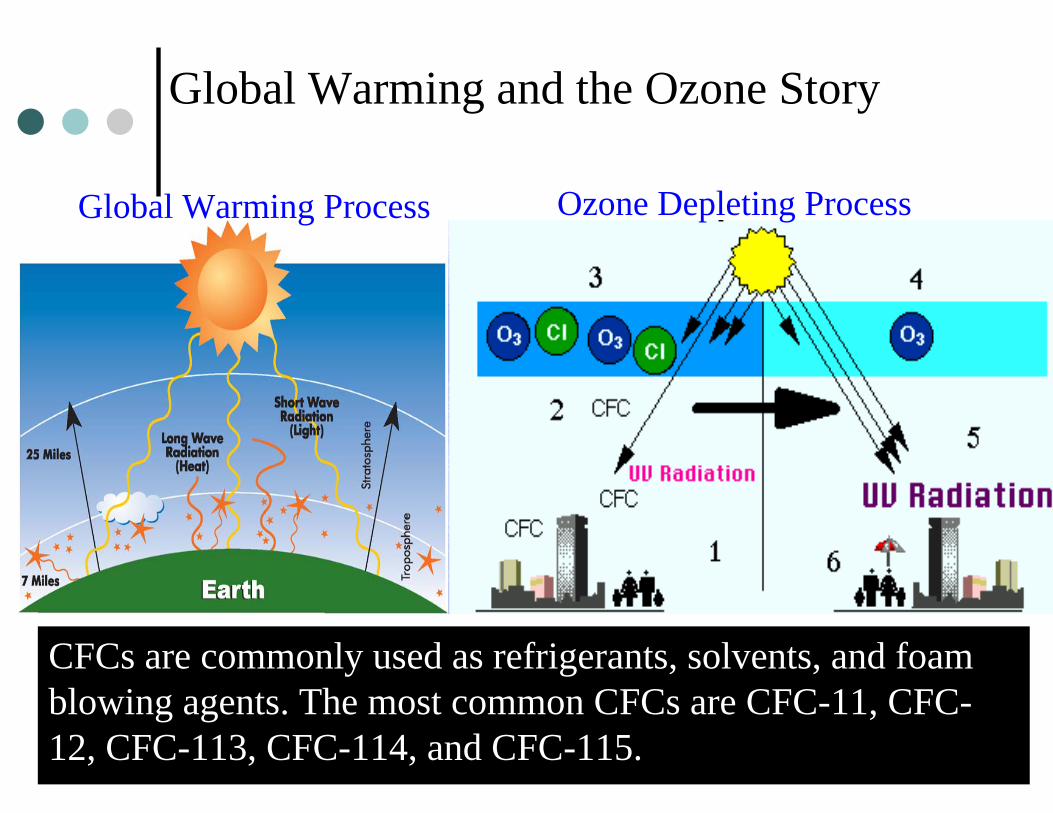
CFCs are commonly used as refrigerants, solvents, and foam blowing agents. The most common CFCs are CFC-11, CFC-12, CFC-113, CFC-114, and CFC-115.
Global Warming and the Ozone Story
Global Warming Process Ozone Depleting Process
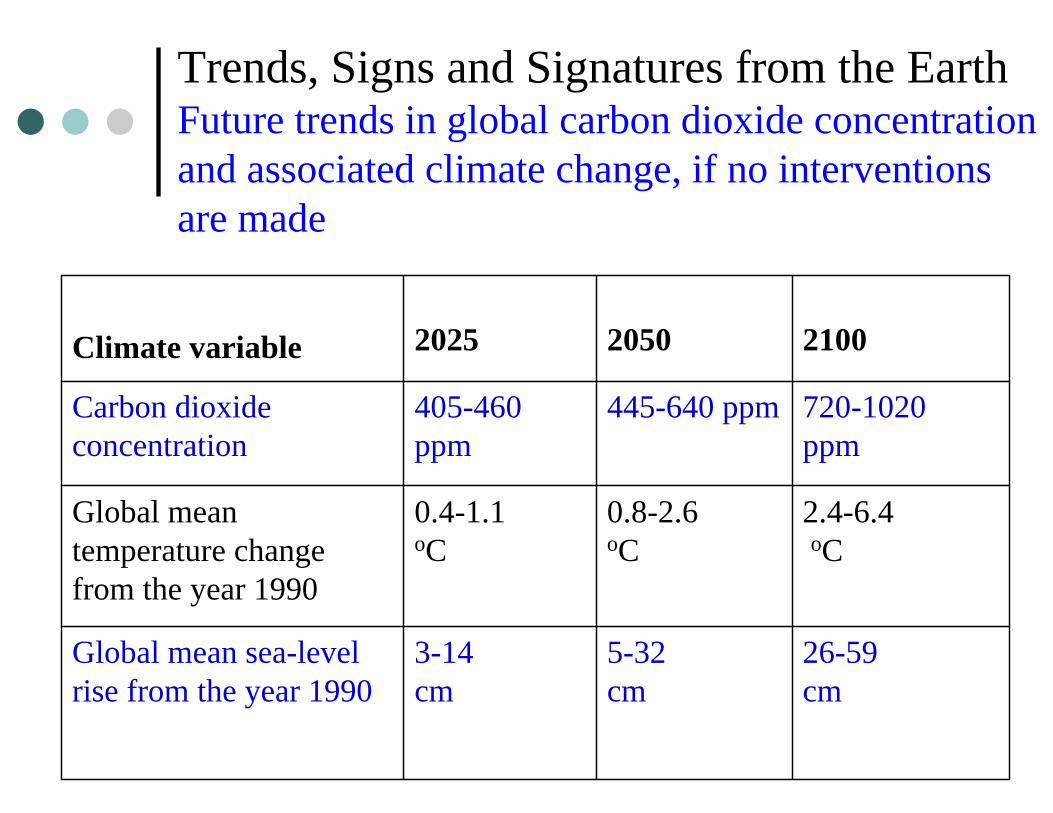
Trends, Signs and Signatures from the EarthFuture trends in global carbon dioxide concentration and associated climate change, if no interventions are made
26-59cm
5-32cm
3-14cm
Global mean sea-level rise from the year 1990
2.4-6.4oC
0.8-2.6oC
0.4-1.1oC
Global mean temperature change from the year 1990
720-1020 ppm
445-640 ppm405-460 ppm
Carbon dioxide concentration
210020502025Climate variable

Climate Change and Crop ProductivityPhotosynthesis - Leaf Water Potential
Midday Leaf Water Potential, MPa-4.0-3.5-3.0-2.5-2.0-1.5-1.0
Phot
osyn
thes
is, m
g C
O2 m
-2 s-1
0
2
4
6
8
10
PPF, 1600 µmol m-2 s-1
350 µl l-1 CO2
700 µl l-1 CO2
Well-watered Water stressed
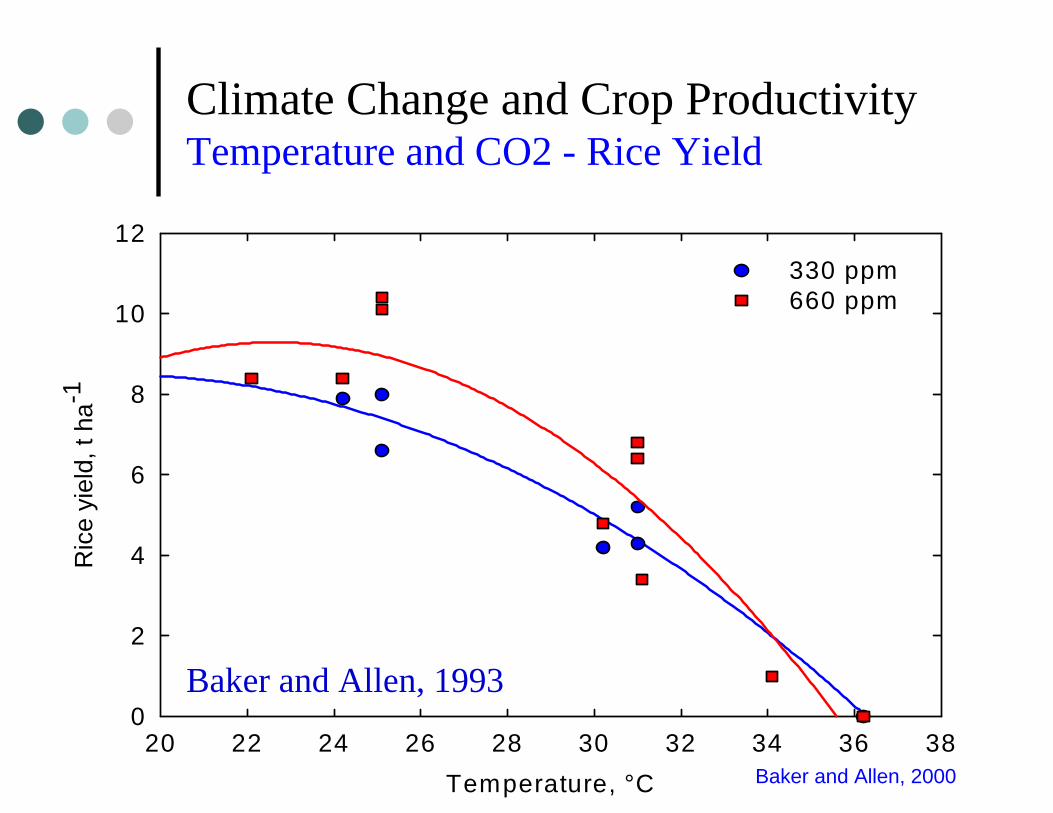
Climate Change and Crop ProductivityTemperature and CO2 - Rice Yield
Temperature, °C20 22 24 26 28 30 32 34 36 38
Ric
e yi
eld,
t ha
-1
0
2
4
6
8
10
12330 ppm660 ppm
Baker and Allen, 1993
Baker and Allen, 2000
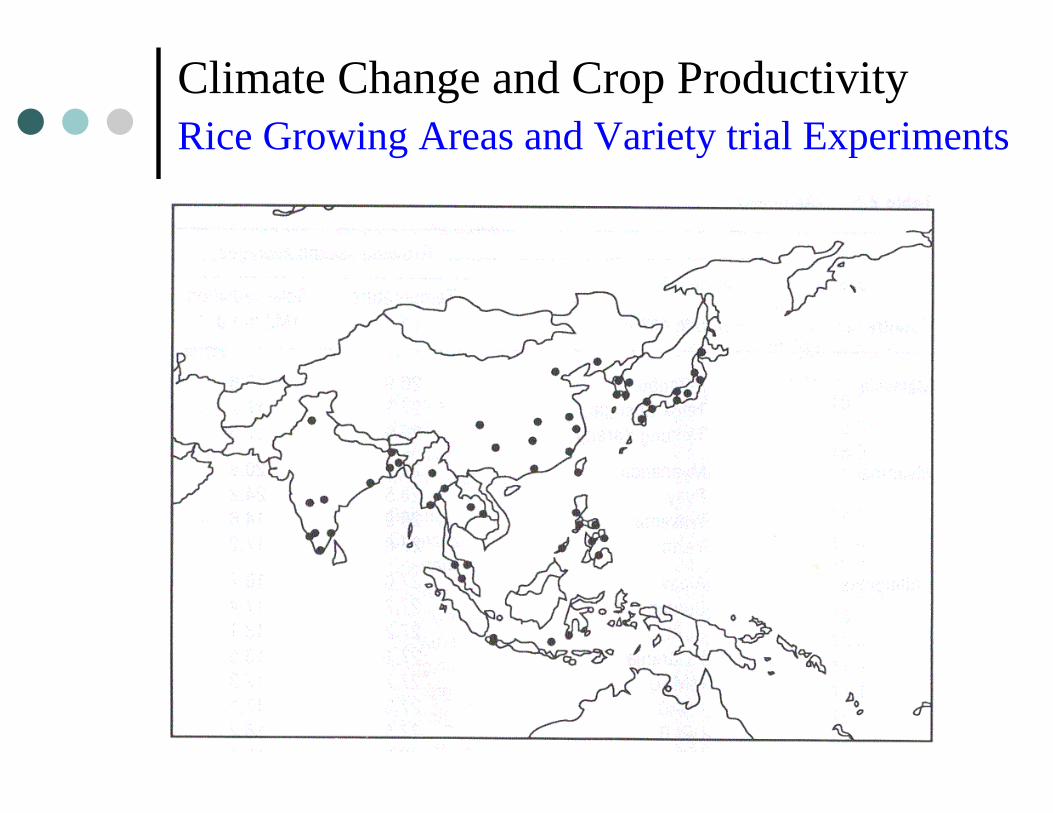
Climate Change and Crop ProductivityRice Growing Areas and Variety trial Experiments
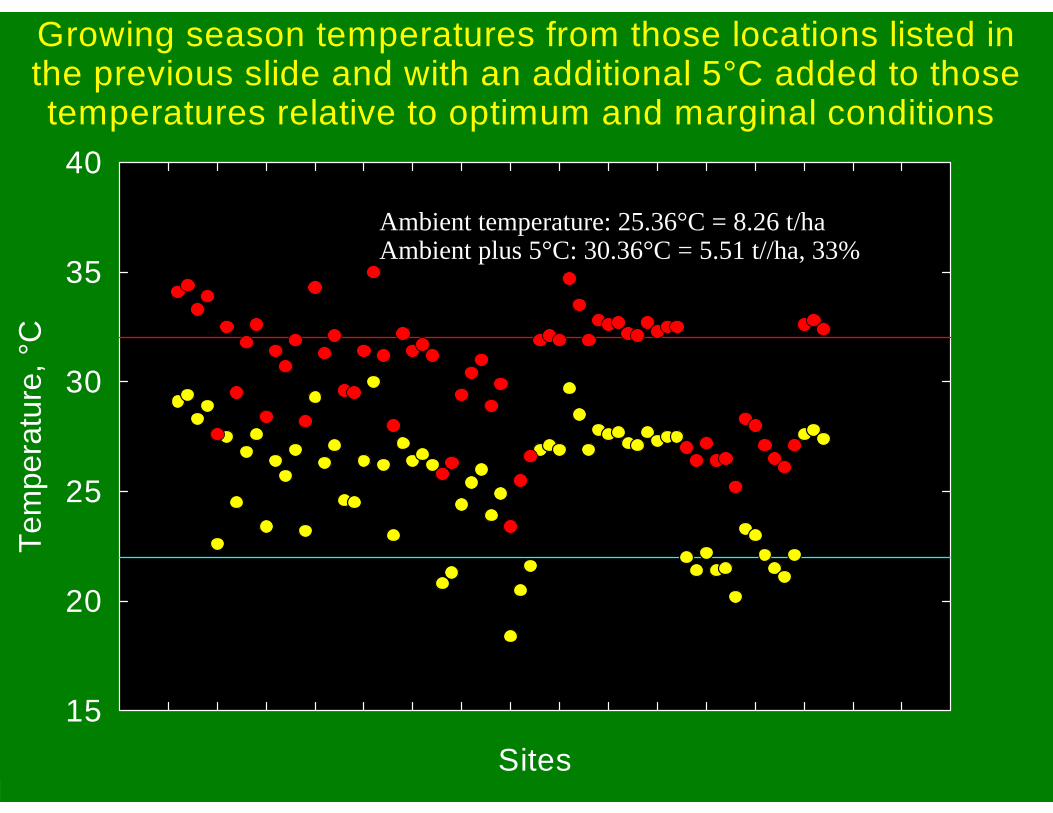
Growing season temperatures from those locations listed inthe previous slide and with an additional 5°C added to thosetemperatures relative to optimum and marginal conditions
Sites
Tem
pera
ture
, °C
15
20
25
30
35
40
Ambient temperature: 25.36°C = 8.26 t/haAmbient plus 5°C: 30.36°C = 5.51 t//ha, 33%
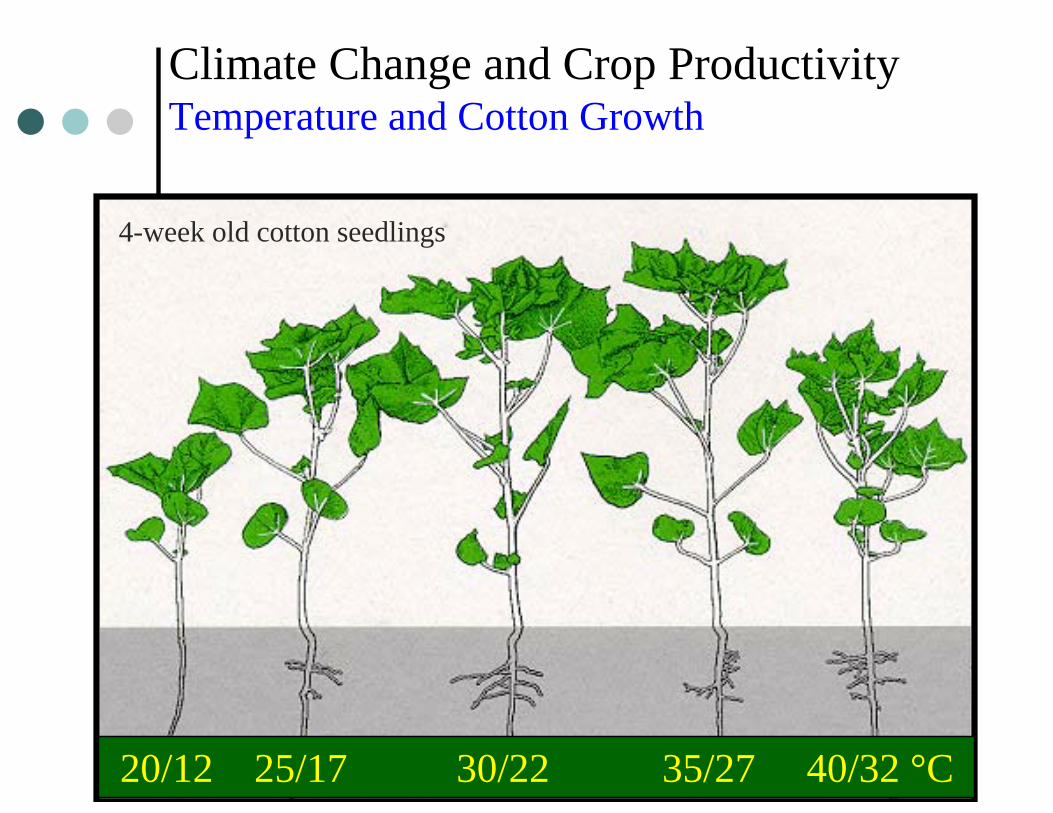
20/12 25/17 30/22 35/27 40/32 °C
4-week old cotton seedlings
Climate Change and Crop ProductivityTemperature and Cotton Growth
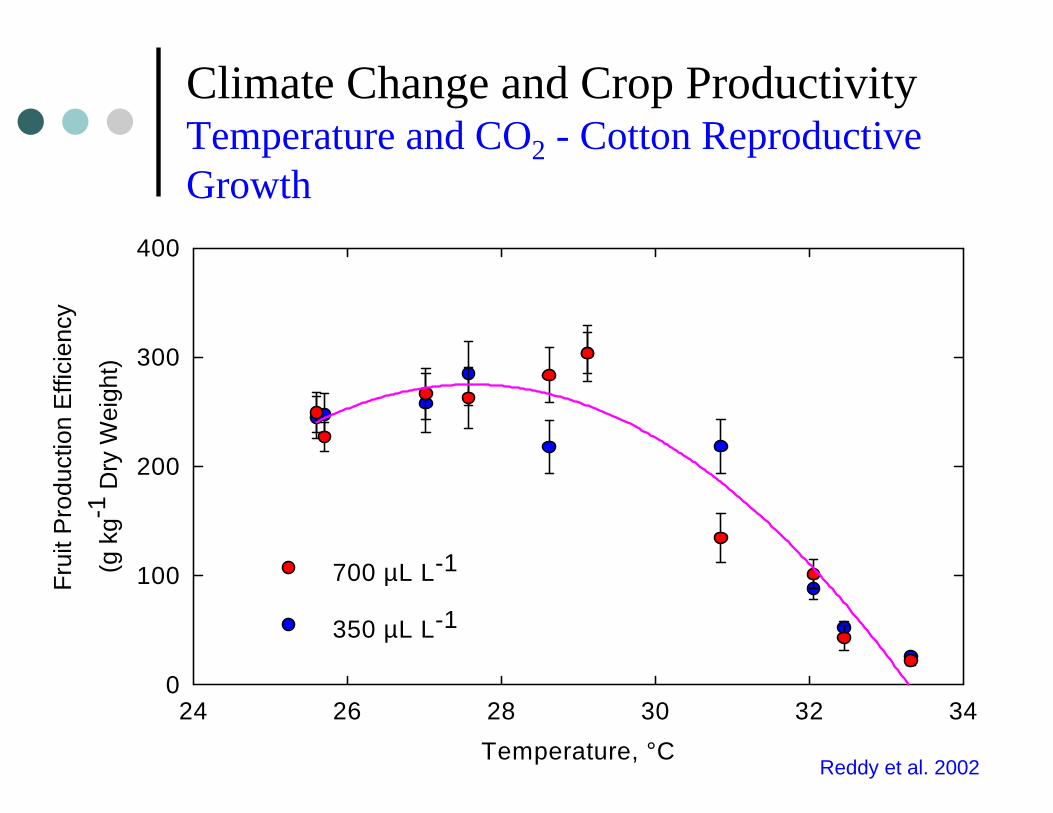
Climate Change and Crop ProductivityTemperature and CO2 - Cotton Reproductive Growth
Temperature, °C24 26 28 30 32 34
(g k
g-1 D
ry W
eigh
t)
0
100
200
300
400
350 µL L-1
700 µL L-1
Frui
t Pro
duct
ion
Effi
cien
cy
Reddy et al. 2002
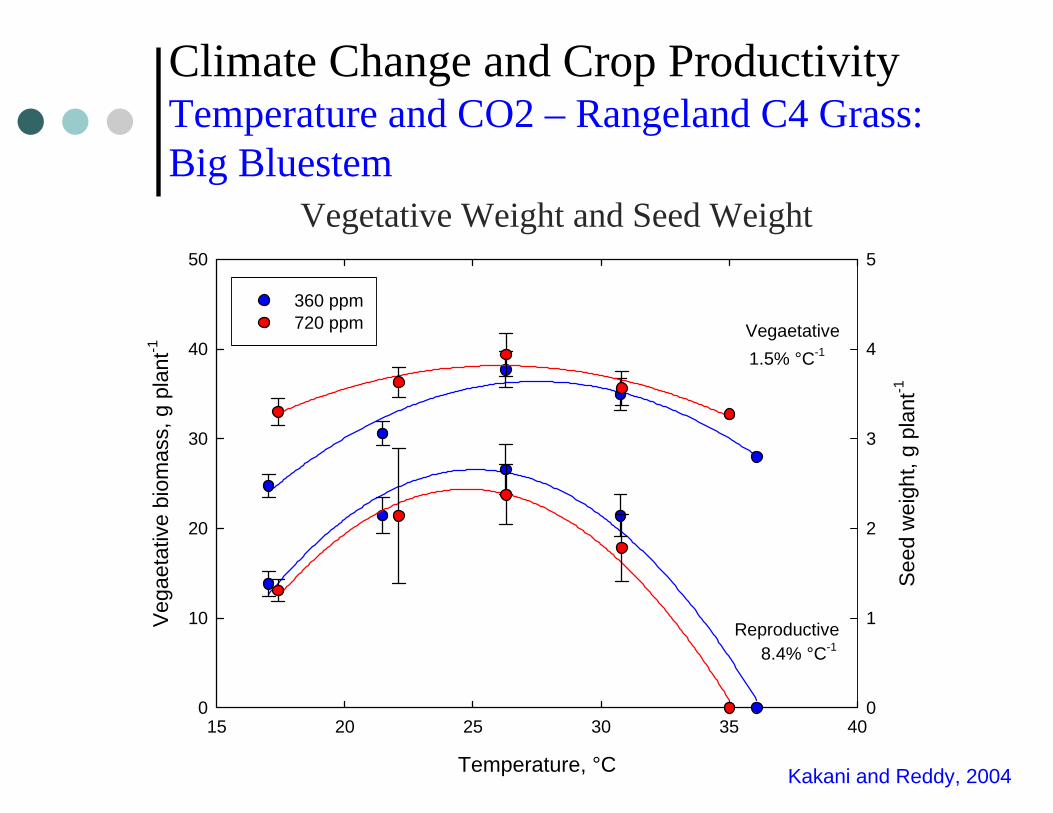
Climate Change and Crop ProductivityTemperature and CO2 – Rangeland C4 Grass: Big Bluestem
Temperature, °C
15 20 25 30 35 40
Veg
aeta
tive
biom
ass,
g p
lant
-1
0
10
20
30
40
50
See
d w
eigh
t, g
plan
t-1
0
1
2
3
4
5
360 ppm720 ppm Vegaetative
Reproductive
1.5% °C-1
8.4% °C-1
Vegetative Weight and Seed Weight
Kakani and Reddy, 2004
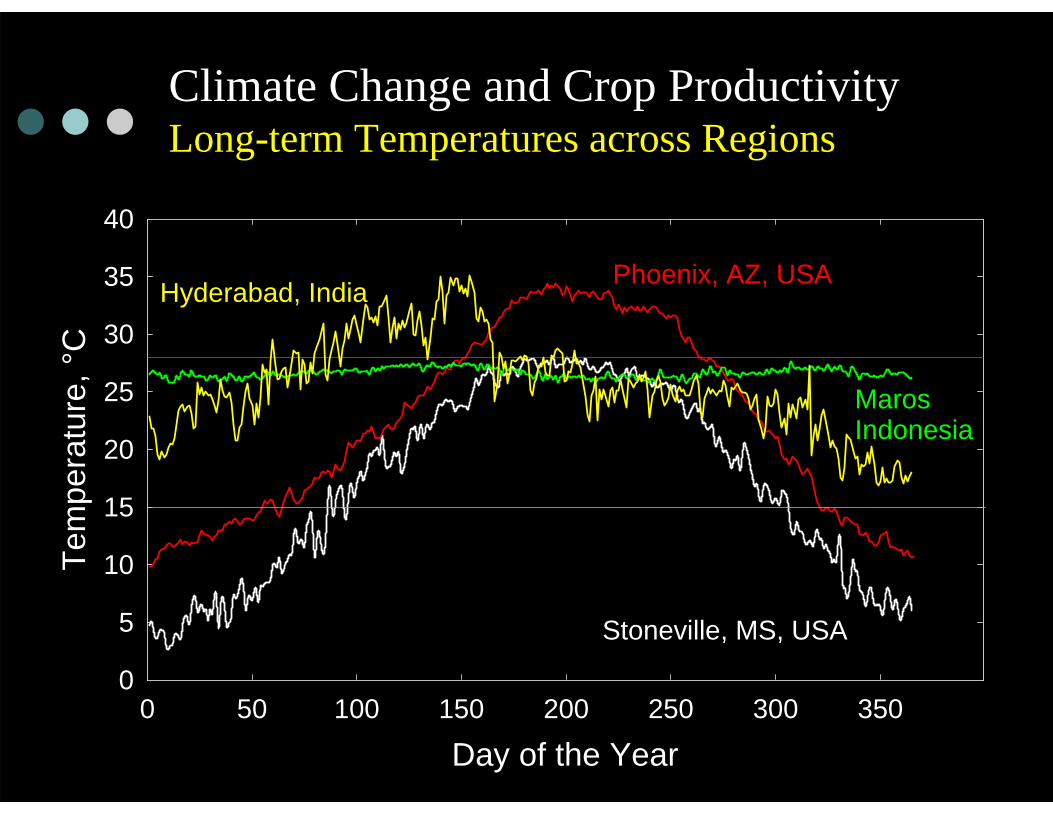
Climate Change and Crop ProductivityLong-term Temperatures across Regions
Day of the Year0 50 100 150 200 250 300 350
Tem
pera
ture
, °C
0
5
10
15
20
25
30
35
40
Phoenix, AZ, USA
Stoneville, MS, USA
MarosIndonesia
Hyderabad, India
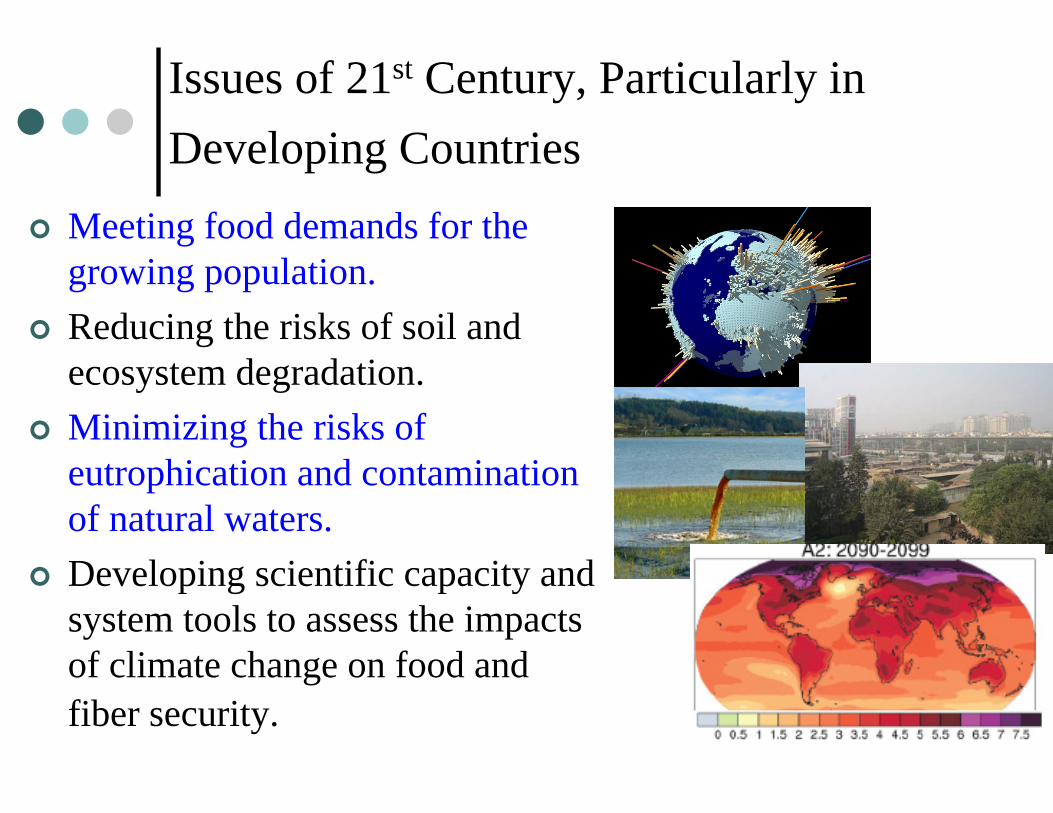
Issues of 21st Century, Particularly in Developing Countries
Meeting food demands for the growing population.Reducing the risks of soil and ecosystem degradation.Minimizing the risks of eutrophication and contamination of natural waters.Developing scientific capacity and system tools to assess the impacts of climate change on food and fiber security.
PMAPCOTPLT
GOSSYM
CLYMAT
SOIL
CHEM
PNET
GROWTH
PLTMAP
OUTPUT
PIX
PREP
RUTGRONITROMATAL
DATESTMPSOL
FRTLIZ
ETUPTAKECAPFLONITRIF
RIMPED
ABSCISE
FREQ
RAINFERT
RUNOFF GRAFLO
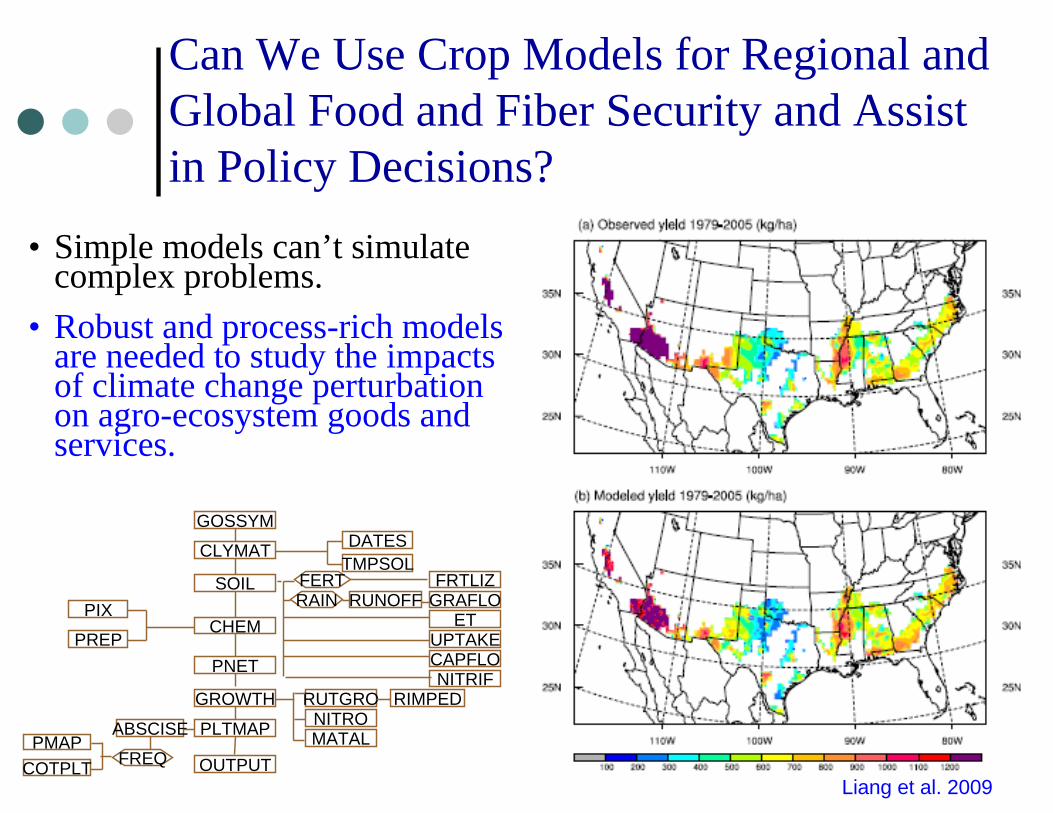
• Simple models can’t simulate complex problems.
• Robust and process-rich models are needed to study the impacts of climate change perturbation on agro-ecosystem goods and services.
Can We Use Crop Models for Regional and Global Food and Fiber Security and Assist in Policy Decisions?
Liang et al. 2009

Farm management (e.g. planting, irrigation, fertilization and harvest scheduling).
Resource management (e.g. several Govt. agencies and private comp. use).
Climate change and policy analysis.
Production forecasts (e.g. global, regional and local forecasts).
Research and development (e.g. research priorities and guide fund allocations).
Turning information into knowledge (e.g. information overflow in every area including agricultural research).
Crop Model Applications for NaturalResource Management
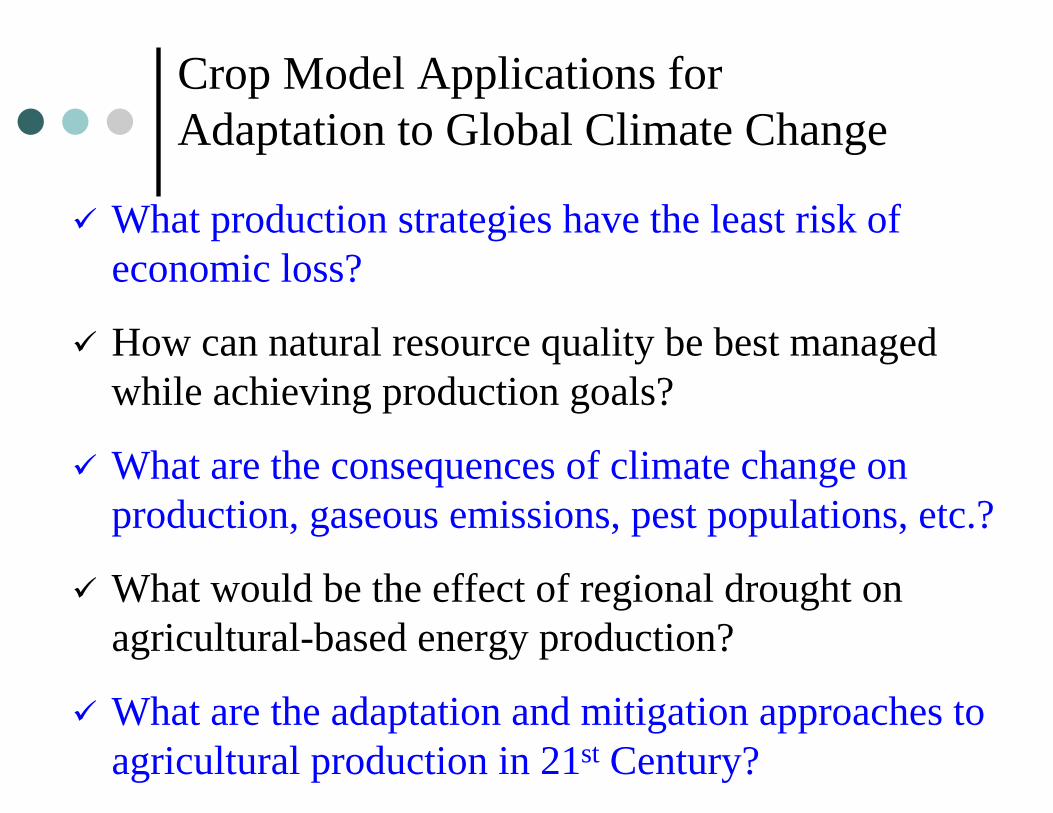
What production strategies have the least risk of economic loss?
How can natural resource quality be best managed while achieving production goals?
What are the consequences of climate change on production, gaseous emissions, pest populations, etc.?
What would be the effect of regional drought on agricultural-based energy production?
What are the adaptation and mitigation approaches to agricultural production in 21st Century?
Crop Model Applications for Adaptation to Global Climate Change
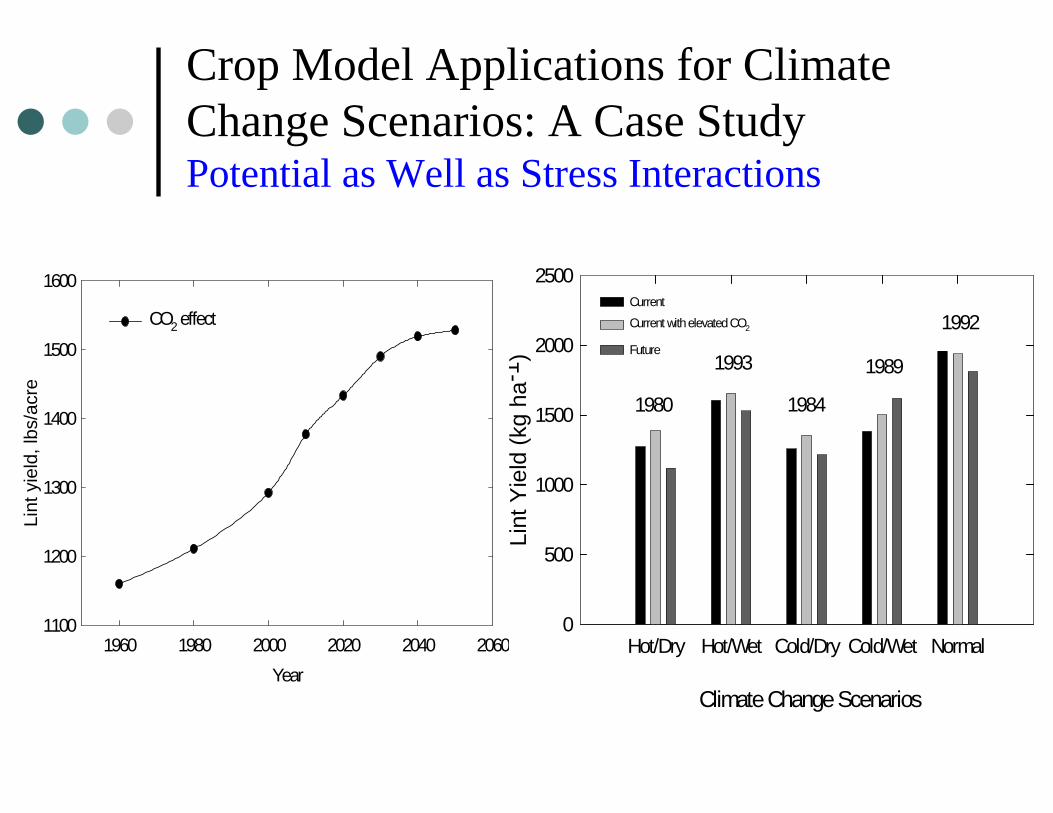
Climate Change Scenarios
Hot/Dry Hot/Wet Cold/Dry Cold/Wet Normal
Lint
Yie
ld (k
g ha
-1)
0
500
1000
1500
2000
2500
1980
1993
1984
1989
1992CurrentCurrent with elevated CO2
Future
Crop Model Applications for Climate Change Scenarios: A Case StudyPotential as Well as Stress Interactions
Year1960 1980 2000 2020 2040 2060
Lint
yie
ld, l
bs/a
cre
1100
1200
1300
1400
1500
1600
CO2 effect
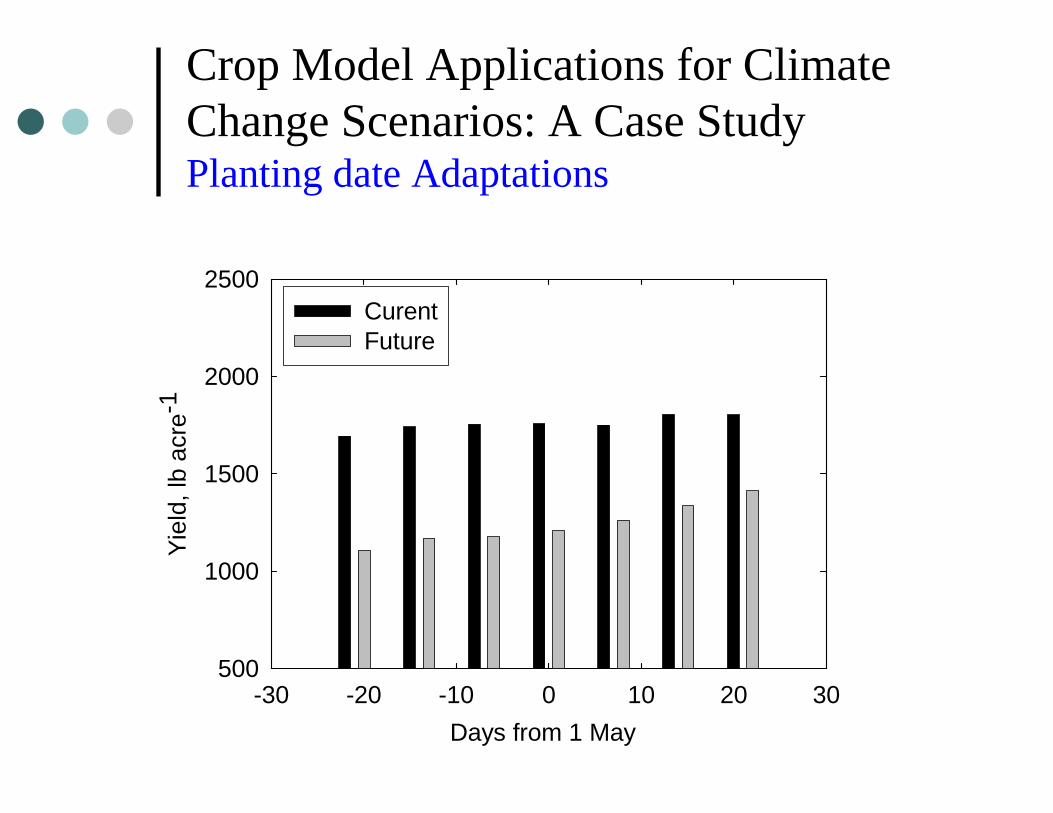
Crop Model Applications for Climate Change Scenarios: A Case StudyPlanting date Adaptations
-30 -20 -10 0 10 20 30
Yiel
d, lb
acr
e-1
500
1000
1500
2000
2500CurentFuture
Days from 1 May
Climate Change and Crop Productivity Some Considerations
• Except limiting the causes of climate change, there are no other long-term strategies
• For a shorter-term, we must develop crop varieties which can withstand changes projected in climate to meet the growing demands for food.
- Cold, heat- and drought-tolerant varieties for temperate- Heat- and drought tolerant varieties for tropics
• We must also develop models that provide adequate warning or guidance for policy makers to act proactively rather than reactively.
• Everybody and every nation should participate in the process, and opportunities are there for everyone.
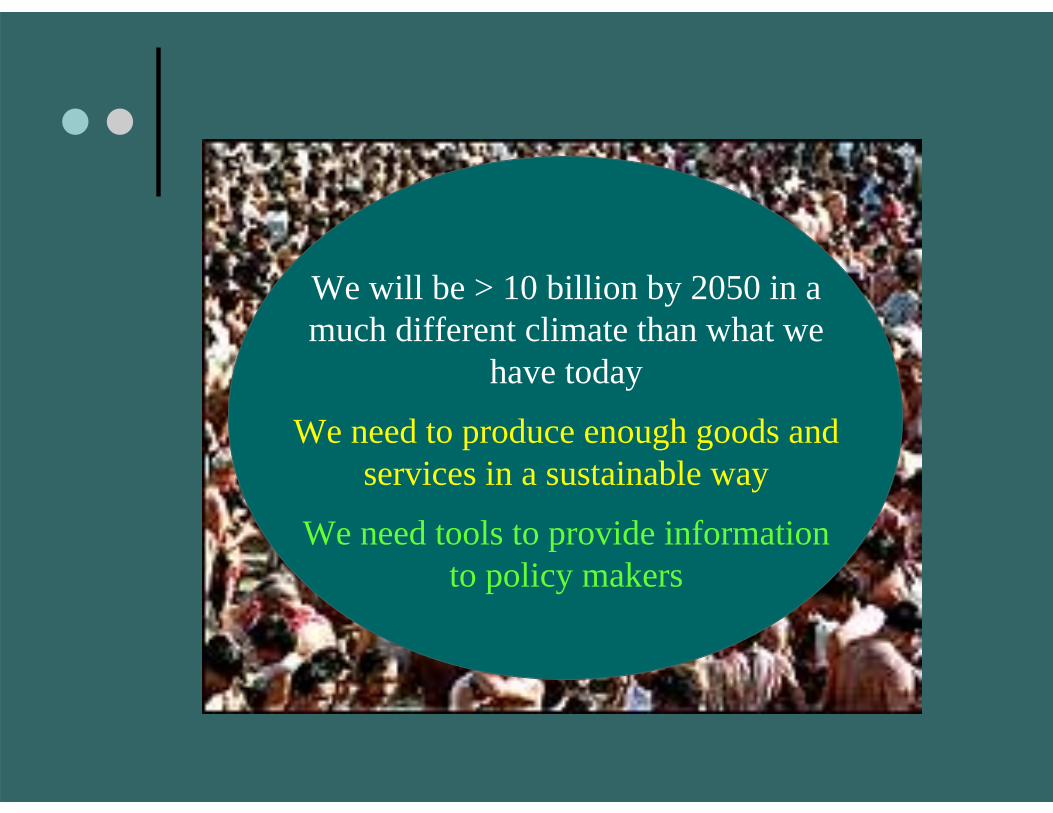
We will be > 10 billion by 2050 in a much different climate than what we
have today
We need to produce enough goods and services in a sustainable way
We need tools to provide information to policy makers
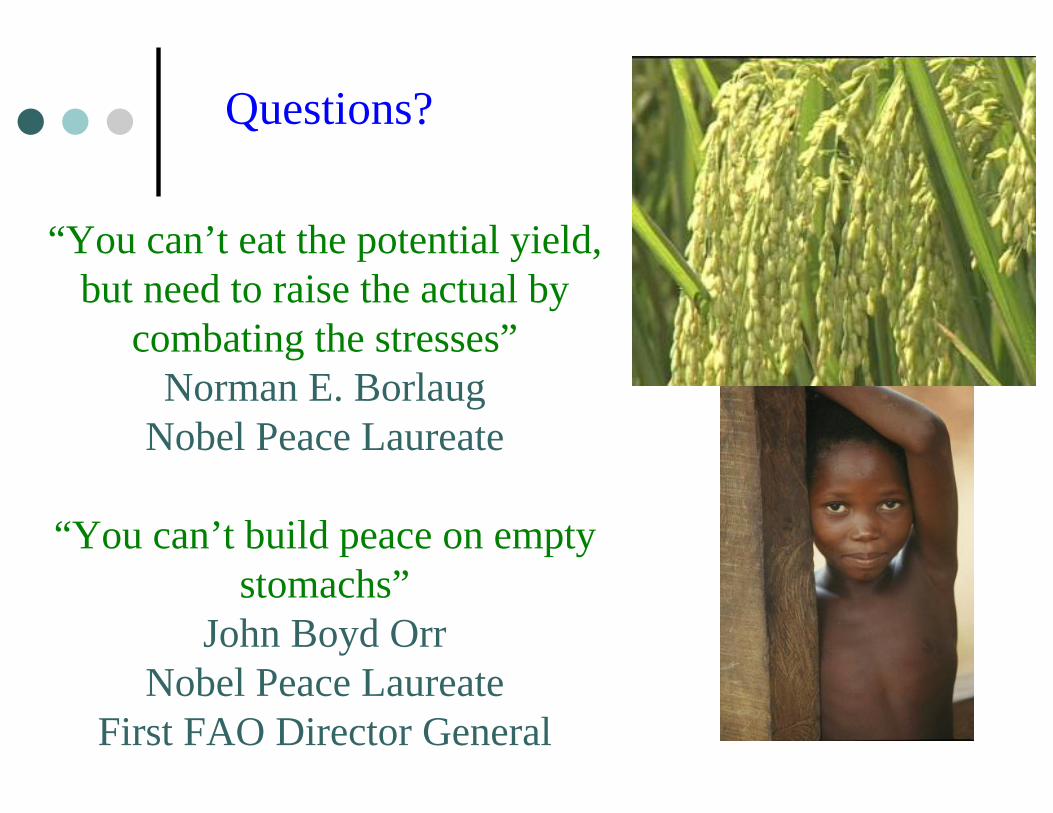
“You can’t eat the potential yield, but need to raise the actual by
combating the stresses”Norman E. Borlaug
Nobel Peace Laureate
“You can’t build peace on empty stomachs”
John Boyd OrrNobel Peace Laureate
First FAO Director General
Questions?