Embed Size (px)
DESCRIPTION
The impacts of Climate change are now being felt at a regional level in cities like Melbourne. The impact of rising temperatures and increasing frequency, duration and intensity of hotspells and heatwaves on Melbourne and its urban heat island poses challenges in how to respond and adapt. There are multiple risks to human health, maintaining urban infrastructure and urban biodiversity. Countering heatwaves and climate change is a major social and political challenge and will require both rapid mitigation of carbon emissions for the long term and widespread adoption of urban climate adaptation strategies and behaviour at personal, business and government levels.
Citation preview

Climate change and heatwaves in Melbourne - a Review
Abstract: The impacts of Climate change are now being felt at a regional level in cities like
Melbourne. The impact of rising temperatures and increasing frequency, duration
and intensity of hotspells and heatwaves on Melbourne and its urban heat island
poses challenges in how to respond and adapt. There are multiple risks to human
health, maintaining urban infrastructure and urban biodiversity. Countering
heatwaves and climate change is a major social and political challenge and will
require both rapid mitigation of carbon emissions for the long term and widespread
adoption of urban climate adaptation strategies and behaviour at personal, business
and government levels.
John Englart 10 February 2015.
IntroductionThis article started during my single subject study
in Academic Research at NMIT (now Melbourne
Polytechnic) during Semester 1 of 2014. The
focus was selected in negotiation with my lecturer.
A slightly abbreviated version was handed in as
my major assessment for the subject. The other
two assessments of the subject were
an annotated bibliography and a formal classroom
presentation, which was also published at
slideshare. I received a high distinction for the
subject overall.
This literature review is structured in two parts: the first on Melbourne temperature and heatwave
impacts from climate change, and the second on risk management, mitigation and adaptation to
rising temperatures, heatwaves, and the urban heat island effect in Melbourne.
I thought limiting my focus to one climate impact - temperature and heatwaves - and one location
- Melbourne - would narrow the field substantially, but as I dug deeper and read more widely I
found a wealth of relevant literature either relevant to heatwave impact or directly to my regional
focus. The bulk of the references are peer reviewed academic studies, but some are academic
working papers and presentations, reports to Government, and news articles including several
by myself published on my blog, Sustainable Fawkner or Climate Action Moreland.
Climate Change and Heatwaves in Melbourne a Review John Englart February 2015
Illustration 1: Electricity transmission towers at Glenroy during Heatwave

Table of ContentsAbstract: ..............................................................................................................................................1Introduction..........................................................................................................................................1RISING TEMPERATURES HEATWAVES AND THEIR IMPACT...................................................3
Urban Heat Island effect and heatwaves..........................................................................................6Heatwave impact on Human Health................................................................................................7
Rising summer night temperatures increasing risk.....................................................................9Heart disease and heatwaves.....................................................................................................11Lower socio-economic groups more vulnerable.......................................................................13Those suffering Mental Health at greater risk...........................................................................13Childhood Asthma made worse................................................................................................13Increase in Foodborne disease..................................................................................................13Association with Urban Suicide................................................................................................14
Cost estimates of Victorian bushfire and heatwave mortality.......................................................14Heatwave impact on Infrastructure................................................................................................14Heatwave impact on biodiversity and ecosystems........................................................................16
COUNTERING THE THREAT OF HEATWAVES AND CLIMATE CHANGE IN MELBOURNE............................................................................................................................................................17
Heatwave Management..................................................................................................................17Mitigation.......................................................................................................................................18Adaptation......................................................................................................................................19
Personal measures.....................................................................................................................19Increase Urban surface albedo (reflectivity).............................................................................20Air-conditioning........................................................................................................................21Urban Forests............................................................................................................................21Water Sensitive Urban Design..................................................................................................23Urban Food Security and building community resilience.........................................................23Mode shift to Public Transport, walking and cycling...............................................................24
CONCLUSION..................................................................................................................................24References.................................................................................................................................25
Climate Change and Heatwaves in Melbourne a Review John Englart February 2015

RISING TEMPERATURES HEATWAVES AND THEIR IMPACTIn Australia we are experiencing rising temperatures with increasing duration, frequency and
intensity of heatwaves.(CSIRO and BOM 2014) In particular, unusual heat events in 2013 and
2014 have been documented by the Bureau of Meteorology in several special climate
statements. This has included Extreme November heat in 2012 across eastern Australia (BOM
2012); followed by extreme heat in January 2013 which the Climate Commission dubbed the
Angry Summer (BOM 2013a, Steffen 2013); a prolonged autumn heatwave for southeast
Australia (BOM 2013b); Australia's warmest September on record (BOM 2013c); and intense
summer heatwaves in January 2014, one of Australia's most significant heatwave events (BOM
2014b, BOM2014c); and an exceptionally prolonged autumn warm spell over much of Australia
in May 2014 (BOM 2014d).
Accurate temperature records have been kept by the Bureau of Meteorology by the Melbourne
Regional Office since 1910. These records show a long term increase in the annual maximum
temperature linear trend of 0.08C per decade and an annual minimum temperature linear trend
of 0.14C per decade. Annual mean temperature for Melbourne has been increasing at a linear
trend of 0.11C per decade between 1910 and 2013.
But the rate of increase also varies with the seasons. Maximum temperatures show a rise of
0.11C per decade for Autumn and Winter and much smaller increases for Spring (0.05C per
decade) and for Summer (0.06C per decade). Minimum temperatures show a much larger rising
trend with 0.19C per decade for Summer, and 0.16C per decade for Spring, and slightly lower
increases in Autumn (0.12C per decade) and Winter (0.08C per decade). The long term
temperature data clearly shows that Melbourne has already had a two degree rise in minimum
temperatures during summer months. What this means in practice is that on average our
summer nights are warming more quickly. This has implications for health and physiological
recovery during heatwaves.(Grunstein 2013)
Climate Change and Heatwaves in Melbourne a Review John Englart February 2015

Summer minimum temperature trend for Melbourne already shows there has been a
rise of two degrees since 1910. Source: Australian Bureau of Meteorology
- Australian climate change site data for Melbourne (086071)
The 2013 summer was particularly noteworthy for the extent and number of temperature records
broken. Lewis and Karoly (2013) in a Risk attribution study did extensive modelling comparing
just natural forcings with model runs with greenhouse forcings and came to the conclusion that
natural climate variations could not explain the record summer temperatures. Even more
extraordinary, these temperatures were achieved in a neutral ENSO year, when high
temperatures are usually recorded in El Nino years. Lewis and Karoly (2014) have also done
preliminary research to show 2013 was the hottest year on record for Australia. Steffen (2015)
draws upon details from no less than five separate studies in the Special Supplement to the
Bulletin of the American Meteorological Society on Extreme weather events for 2013 that dealt
with the contribution of climate change to Australia's record heat in 2013.(Herring 2014)
The term Heatwave has not had a consistent and unambiguous definition. Perkins and
Alexander (2013) set out to codify a scientific definition so that the term can be more accurately
and scientifically applied. The definition they came up with encompasses 'three or more
consecutive days above one of the following: the 90th percentile for maximum temperature, the
Climate Change and Heatwaves in Melbourne a Review John Englart February 2015

90th percentile for minimum temperature, and positive extreme heat factor (EHF) conditions.' By
this definition heatwaves can occur in any season. Dr Sarah Perkins has also developed a
website showing current and historical heatwaves from observation points around Australia.
According to the website, historical data for Melbourne using this definition of 3 or more days of
excessive heat indicates that in 2013 heatwaves occurred in February, March, May, June, July,
August, and September.(Scorcher 2014)
Future temperatures for Australia are projected by CSIRO and BOM (2014) 'to continue to warm,
rising by 0.6 to 1.5°C by 2030 compared with the climate of 1980 to 1999; noting that 1910 to
1990 warmed by 0.6°C. Warming by 2070, compared to 1980 to 1999, is projected to be 1.0 to
2.5°C for low greenhouse gas emissions and 2.2 to 5.0°C for high emissions.' The increase in
temperatures will occur through an increase in the number of hot days and warm nights and a
decline in cool days and cold nights.
On this background of long term increasing temperature trend we also have the imposition of a
greater number of hot days and heatwaves, with the intensity and length of heatwave events
increasing, as well as starting earlier and extending later. (Steffen, Hughes and Perkins 2014)
The CSIRO estimates that the number of days over 35 degrees Celsius and the frequency of
heatwaves experienced by major southern Australian cities will double by 2030 and triple by
2070.(Climate Institute 2013)
For Melbourne the average intensity of a heatwave has increased by 1.5C, with the peak
heatwave day likely to be 2C hotter than the long term heatwave average. Heatwaves in
Melbourne now start on average 17 days earlier.(Steffen, Hughes and Perkins 2014)
Hot weather in Adelaide, Melbourne and Canberra has already reached levels predicted for
2030. (Steffen, Hughes and Perkins 2014) These hot spells and heatwaves are not a freak event
but have been clearly attributed to climate change. (Lewis and Karoly 2013, Lewis and Karoly
2014, Steffen 2015)
Future projections show the number of hot days are only going to increase:
CityLong term
average (1961-1990)
2000-2009 average
2030 projected
2070 projected (low emissions scenario)
2070 projected (high emissions
scenario
Melbourne 9.9 12.6 12 (11-13) 14 (12-17) 20 (15-26)
Sydney 3.4 3.34.4 (4.1-5.1)
5.3 (4.5-6.6) 8 (6-12)
Adelaide 17.5 25.1 23 (21-26) 26 (24-31) 36 (29-47)
Canberra 5.2 9.4 8 (7-10) 10 (8-14) 18 (12-26)
Darwin 8.5 15.7 44 (28-69) 89 (49-153) 227 (141-308)
Hobart 1.2 1.41.7 (1.6-1.8)
1.8 (1.7-2.0) 2.4 (2.0-3.4)
Climate Change and Heatwaves in Melbourne a Review John Englart February 2015

Table 1: The long-term annual average number of hot days (above 35°C) compared
to the 2000 – 2009 average and the projected average number for 2030 and 2070 for
some Australian capital cities. Source: Heatwaves: Hotter, Longer, More Often
(Steffen, Hughes and Perkins 2014)
Urban Heat Island effect and heatwavesLarge cities and even small towns have an urban heat island effect which causes urban areas to
warm up and retain heat during the night more than the surrounding countryside. Torok (2001)
positively correlated the urban-rural temperature difference to population density here in
Australia and compared it to similar correlations to the USA and Europe. Collecting data from a
transect of Melbourne in August 1992 produced a peak UHI warming effect of 7.1C in the CBD
with peaks in the industrial area to the west of Melbourne and in the medium density housing to
the north of Melbourne. Princes Park is clearly shown as a trough indicating the effect park
vegetation has on UHI. There are sharp drops in temperature at the urban-rural boundary.
Heatwaves and hot spells are further amplified by the Urban Heat Island effect according to Li
and Bou-Zeid (2013) "Not only do heat waves increase the ambient temperatures, but they also
intensify the difference between urban and rural temperatures. As a result, the added heat stress
in cities will be even higher than the sum of the background urban heat island effect and the heat
wave effect." say the researchers. This amplification effect has been attributed to the lack of
surface moisture in urban areas and the low wind speed associated with heat waves.
Climate Change and Heatwaves in Melbourne a Review John Englart February 2015

Modelling summer temperatures in Melbourne showed that the urban heat island effect can add
several degrees of warming to local suburban temperatures depending upon the surface albedo
of the built environment, amount of vegetation canopy and open water and wetlands. Increased
housing density also resulted in increased intensity of night time UHI. As Melbourne expands
and fringe land use changes with implementation of the Melbourne 2030 plan, increases in
population density will result particularly in an increased intensity of the night-time Melbourne
UHI, particularly in growth areas and activity centres. (Coutts, Beringer and Tapper 2008)
New residential development and urban expansion on the fringes of cities has been modelled in
Sydney to strongly affect minimum temperature s as part of the urban heat island effect.(Argueso
, Evans, Fita and Bormann 2013) It is likely a similar effect occurs in Melbourne's new housing
developments in the north and west of the city.
Rising temperatures will also add to the number of extreme fire-weather days expected in
southern and eastern Australia and extend the duration of the fire season which can have a large
impact on the peri-urban and urban fringe suburbs and surrounding bushland environments
around Melbourne. (Buxton 2011, Hughes 2013)
There is evidence to suggest an association between heatwaves, crime and social aggression,
including violent crime, rioting, street violence, attacks, homicide, road rage and domestic
violence.(PriceWaterhouseCoopers 2011)
Heatwave impact on Human HealthHeatwaves kill people. More than three times the number of people die in heatwaves as any
other natural disasters, including bushfires, in Australia.(Department of Infrastructure and
Regional Development. 2013) From 1900 to 2011 4,555 deaths were attributed to extreme heat,
or 55.2% of total natural hazard deaths for the period. Only Epidemics exact a greater toll. The
Coates (2014) study concludes: “The dangers from extreme heat within Australia remain
neglected, and fundamental changes will not take place until extreme heat is given the priority it
deserves as Australia’s number one natural hazard killer.”
Climate Change and Heatwaves in Melbourne a Review John Englart February 2015

Those particularly vulnerable in heatwaves include: older people, young children, people with
chronic disease and those living in built-up areas in cities. (Huang et al 2011) Those suffering
heart conditions are also more susceptible to heat stress.(Loughnan et al 2010). Obesity may
also predispose people to heat stress due to the increase in mass to surface area ratio reduces
body heat loss (Green et al 2001)
Often it is extremely difficult to make a diagnosis of a heat related death at time of autopsy
explains Byard (2013) and the numbers of heat related deaths are usually determined as excess
deaths by comparing death statistics in the heat event to a similar time period with average
temperatures.(Department of Human Services 2009)
Most heatwave deaths are avoidable with forewarning and if individuals and communities adapt
their behaviour.
A simple heat alert system was researched for Melbourne in 2007. It was calculated that when
the mean daily temperature is likely to exceed 30 degrees Celsius, average daily mortality of
people aged 65 years or more is about 15–17% greater than usual. The same age group
showed 19 to 21% mortality once overnight temperatures exceeded 24 degrees Celsius.
(Nicholls, Skinner, Loughnan, Tapper 2007) This proto-type Victorian heat health alert system
was tested by the Victorian Government during the 2009 heatwaves, but was only fully
implemented by the 2010/2011 summer.(Tapper 2014)
Climate Change and Heatwaves in Melbourne a Review John Englart February 2015

During the heatwaves in January 2014, there was a 700 per cent rise in Ambulance Service call-
outs for cardiac arrests when temperatures spiked at almost 44C during the heatwave. About
203 deaths were reported to the coroner, more than twice the average. Paramedics treated more
than 500 people for heat exhaustion, and about 60 kids had to be rescued from locked cars.
(ABC News 2014)
In the future heat related deaths are projected to rise, especially in Brisbane and Melbourne
according to a report by PriceWaterhouseCoopers (2011). An additional 6214 deaths (or 402
deaths annually) by 2050 in Victoria alone may also be involved.(Keating and Handmer 2013)
Climate Change and Heatwaves in Melbourne a Review John Englart February 2015

Projections of annual heat related deaths for Australian capital cities for 2030 and
2050. Source: PricewaterhouseCoopers (2011)
Rising summer night temperatures increasing risk
There are clear physiological limits to human heat (Sherwood and Huber 2010). When those
limits are exceeded for extended periods heat stress, heat stroke and ultimately death occurrs.
Reduction in temperatures at night-time allows for physiological recovery during sleep. But with
urban heat island effect increasing urban nocturnal temperatures, loss of sleep results and
recovery is reduced. Above 22C or 23C ambient temperature results in disturbance of sleep
which can reduce thermo-regulation capacity. (Grunstein 2013) In fact, research conducted in
Australia reveals that without adaptive behaviour (such as air-conditioning) for people aged 65
years or older there is a 19 to 21% mortality rate once overnight temperatures exceed 24
degrees Celsius.(Nicholls et al 2007)
The urban heat island (UHI) as primarily a night-time phenomenon has been well known since
1982.(Li and Bou-Zeid 2013) During night time there is a different structure of the atmospheric
boundary layer with less turbulent mixing preventing radiation of excess heat stored in urban
surfaces during the day. (de Munck et al 2013) Night time is also when evapo-transpiration is
Climate Change and Heatwaves in Melbourne a Review John Englart February 2015

close to zero over both urban and rural surfaces. During heatwaves wind is also reduced so that
there is less advective cooling available to reduce temperatures. (Li and Bou-Zeid 2013)
Comparison of the length and intensity of the Melbourne primary heatwave in 2009
and 2014. Source: Victorian Auditor General's Office (2014) Nicholls et al (2007)
identified that for people aged 65 years or older there is a 19 to 21% mortality rate
once overnight temperatures exceed 24 degrees Celsius.
Air-conditioning in urban areas may add up to 2C degrees of ambient night-time street
temperatures in urban areas further increasing the amplitude of the heat island especially near
waste heat releases, according to a study conducted in Paris.(de Munck et al 2013) This
produces a mal-adaptation as a difference of 1-2C degrees in urban heat can mean a doubling
of mortality among the elderly.(Laaidi et al 2011)
Laaidi et al (2011) highlighted the role of high nocturnal temperatures and the duration of heat
using satellite remote sensing of surface temperatures. This temperature data was then
compared to demographic data from the 2003 Paris heatwave for central Paris and two suburbs
with more vegetation. In comparing mortality and morbidity between high density urban area and
suburban areas with vegetation the researchers found that the small 1 to 2 degree difference
made by the urban heat island doubled the mortality rate among the more vulnerable elderly in
high density urban living over an extended heatwave.
The study provided an impetus to mitigate the urban heat island through more vegetation and a
method for public health practitioners to identifying hot spots in the future to target those more
vulnerable much like Loughnan et al (2013) have done in determining a heat vulnerability index
and mapping heat vulnerability for Australian cities.
Climate Change and Heatwaves in Melbourne a Review John Englart February 2015

Thermal stress was identified as a major factor in excess mortality in the 2003 Paris heatwave,
with many people, predominantly poor and elderly, dying alone in poorly ventilated high rise
apartments. Almost 15,000 excess deaths were attributed across France to the heatwave.
(Poumadere et al 2005)
De Munck explained in a AGU 2010 Fall meeting in San Fransisco press conference on urban
heat islands (Youtube Video) that a one per cent increase in vegetation reduces urban heat by
0.2C the surface temperature of Paris on a summer afternoon. She explained further that during
an extensive heatwave it is the nocturnal minimum temperatures that are important for mortality
rates rather than daily maximum temperatures.
Heart disease and heatwaves
Age and socio-economic status are also important determinants according to Loughnan et al
(2010) who investigated hospital cardiac admissions during hot weather and the socio-
demographic and spatial data to help determine public health vulnerability to hot weather. The
study reported Hospital admissions for acute myocardial infarction increased by 37.7% for three-
day average temperatures ≥ 27°C and by 10% for a 24-hour average temperature ≥ 30°C. Twice
as many males admitted than females, and the males were younger, with peak occurrence in the
60–64 years age group.
A study in Germany by Zacharias et al (2015) estimates that more frequent, longer duration heat
waves of greater intensity may kill five times as many people from heart disease by the end of
the century compared to the present if little acclimatization occurrs. If there is 50 per cent
acclimatization, then heart disease related deaths during a heatwave would be two and a half
the current rate. The study indicates "that the future burden of heat will increase considerably.
The obtained results point to public health interventions to reduce the vulnerability of the
population to heat waves." This would include heat health warning systems, heat wave action
plans, enhanced use of air conditioning, and individual behavioral adaptation as have been
adopted in recent years in Australia.
Climate Change and Heatwaves in Melbourne a Review John Englart February 2015

A study by Loughnan et al (2013) assessed environmental, demographic and health
characteristics producing a heat vulnerability index, then mapped the heat vulnerability of
Melbourne and other Australian cities down to the postcode level using Google. The purpose of
the study was to establish a nationally consistent approach to identify threshold temperatures
above which mortality and morbidity increases in each Australian capital city. For Melbourne the
thresholds for increased mortality was a maximum temperature of 39°C, or an overnight
minimum temperature of 26°C or a daily mean temperature of 28°C. These threshholds are
different to Loughnan (2010) and Nicholls (2007) due to differences in the age cohorts and
diagnostic groups of the data sets.
Tong et al (2014) in the study of heat related mortality in Brisbane, Sydney and Melbourne
reported that heatwaves appeared to affect mortality more in Brisbane and Melbourne than in
Sydney and conjectured that this may be due to more extended heat periods in Brisbane and
Melbourne as well as different adaptation and individual behavioural response between the
cities. The data showed a propensity for more deaths in heatwaves later in the summer with the
elderly particularly females more vulnerable. The authors suggest that menopause reducing
thermo-regulation and cardiovascular fitness may be responsible for increased elderly female
vulnerability.
In Victoria the 2009 heatwave and hot spell events highlighted the direct and indirect effect on
mortality through heat-stress related fatalities and indirectly through bushfire fatalities. The
heatwave in 2009 caused 374 excess deaths, while the Black Saturday bushfires exacerbated
by the extreme temperatures, caused 173 deaths. (Department of Human Services 2009) Byard
Climate Change and Heatwaves in Melbourne a Review John Englart February 2015
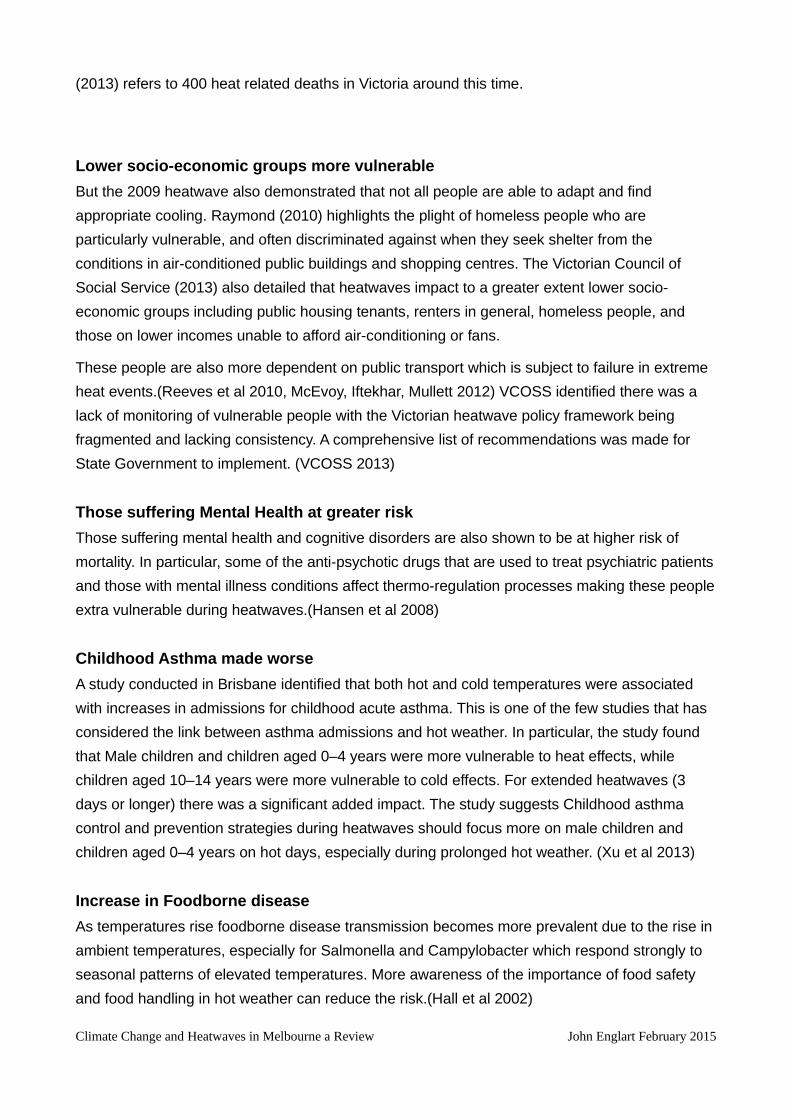
(2013) refers to 400 heat related deaths in Victoria around this time.
Lower socio-economic groups more vulnerable
But the 2009 heatwave also demonstrated that not all people are able to adapt and find
appropriate cooling. Raymond (2010) highlights the plight of homeless people who are
particularly vulnerable, and often discriminated against when they seek shelter from the
conditions in air-conditioned public buildings and shopping centres. The Victorian Council of
Social Service (2013) also detailed that heatwaves impact to a greater extent lower socio-
economic groups including public housing tenants, renters in general, homeless people, and
those on lower incomes unable to afford air-conditioning or fans.
These people are also more dependent on public transport which is subject to failure in extreme
heat events.(Reeves et al 2010, McEvoy, Iftekhar, Mullett 2012) VCOSS identified there was a
lack of monitoring of vulnerable people with the Victorian heatwave policy framework being
fragmented and lacking consistency. A comprehensive list of recommendations was made for
State Government to implement. (VCOSS 2013)
Those suffering Mental Health at greater risk
Those suffering mental health and cognitive disorders are also shown to be at higher risk of
mortality. In particular, some of the anti-psychotic drugs that are used to treat psychiatric patients
and those with mental illness conditions affect thermo-regulation processes making these people
extra vulnerable during heatwaves.(Hansen et al 2008)
Childhood Asthma made worse
A study conducted in Brisbane identified that both hot and cold temperatures were associated
with increases in admissions for childhood acute asthma. This is one of the few studies that has
considered the link between asthma admissions and hot weather. In particular, the study found
that Male children and children aged 0–4 years were more vulnerable to heat effects, while
children aged 10–14 years were more vulnerable to cold effects. For extended heatwaves (3
days or longer) there was a significant added impact. The study suggests Childhood asthma
control and prevention strategies during heatwaves should focus more on male children and
children aged 0–4 years on hot days, especially during prolonged hot weather. (Xu et al 2013)
Increase in Foodborne disease
As temperatures rise foodborne disease transmission becomes more prevalent due to the rise in
ambient temperatures, especially for Salmonella and Campylobacter which respond strongly to
seasonal patterns of elevated temperatures. More awareness of the importance of food safety
and food handling in hot weather can reduce the risk.(Hall et al 2002)
Climate Change and Heatwaves in Melbourne a Review John Englart February 2015

During the last super El Nino year with record hot weather in 1997 there were 1,691 notifications
of salmonellosis reported, a record number, being an 85 per cent increase on the number
reported in 1996. The majority of these outbreaks occurred during and shortly after the hottest
summer then recorded for Melbourne, although other factors such as food handling errors,
mishandling by consumers and higher load of organisms in meat from the abattoirs may also
have been factors.(Human services Victoria 1997)
Association with Urban Suicide
Recent research shows that heatwaves also correlate with an increase in urban suicide rates in
Australian cities. Temperature difference showed a positive association with suicide in Sydney,
Melbourne, Brisbane and Hobart. Temperature and unemployment were significant in Sydney,
Melbourne and Brisbane. The study identifies that research in Britain and Europe shows that this
link is inconclusive on a global level. (Qi 2013)
Cost estimates of Victorian bushfire and heatwave mortalityKeating and Handmer (2013) utilise cost benefit analysis to calculate the cost of climate impacts
to help in decision making of allocation of scarce resources. They provide estimates and
projections on bushfire impact on the Victorian Agriculture and Timber Industries and from
heatwave mortality.
They estimate that by 2050 increases in bushfire due to climate change will cost, with out
adaptation, the Victorian agricultural industry an additional $1.4 billion ($46.6 million per annum
by 2050), and the timber Industry an additional $2.8 billion ($93.4 million per annum by 2050).
In comparison, heatwave mortality due to climate change, without adaptation, would cause an
additional 6214 deaths (402 deaths annually by 2050) translating to a cost of $6.4 billion (or
$218 million per annum by 2050). The Heatwave mortality costs are based on McMichael’s 2003
estimate of current heatwave mortality in Melbourne. Cost estimates are based on statistical
value of life discounted at 5% and 0.1%.
Adaptation is already occurring to reduce heatwave mortality and this is noted by the Victorian
Auditor General's Office (2014) in comparing the reduction in excess deaths from 2009 and 2014
extreme heat events and the contribution of management and adaptation strategies that have
been put into place. It would be an interesting research exercise to estimate the cost-benefit of
this adaptation so far.
Heatwave impact on InfrastructureInfrastructure will increasingly be impacted by climate change as heat tolerances are exceeded.
According to the Climate Institute (2012), the 2008 Garnaut Review conservatively modelled the
annual costs of unmitigated climate change on Australia’s infrastructure and estimated it would
Climate Change and Heatwaves in Melbourne a Review John Englart February 2015

reach 0.5 per cent of GDP (about $9 billion) in 2020 and 1.2 per cent of GDP ($40 billion) in
2050. More frequent and intense heatwaves will likely lead to higher electricity prices, and
possibly grid strain and blackouts.(Climate Institute 2012)
Heatwaves cause failures in infrastructure as temperature tolerances are exceeded. Electricity
and transport sectors are particularly vulnerable which can result in cascading infrastructure
failure with widespread social and economic impacts. (McEvoy, Ahmed and Mullett 2012,
Reeves et al 2010, Nguyen, Wang and Chen 2010)
The electrical generation and transmission system is particularly vulnerable to excessive
temperatures and heatwaves. Higher temperatures reduce the efficiency and effectiveness of
traditional coal fired power generation cooling systems and transmission lines, at the very time
when electrical power is at peak demand. This combination drives up electricity costs and
stresses the system. The likelihood of blackouts is enhanced. During the January 2009
heatwave in Melbourne an estimated half a million homes lost power, the city's rail and tram
network was disrupted, thousands of businesses were forced to close lacking electrical power
and affecting internet services nation-wide.(PriceWaterhouseCoopers 2011, Climate Institute
2012)
Sub-sectorImpact
levelDescription Trigger point/threshold
Electricity High
* Record Demand
* Compromised supply
* Reduced transmission efficiency and faults
* Full operation & distribution capacity
* Heat lowers performance
Gas Minimal Resilient No reported sensitivities
Generator Minimal
* Impaired cooling for thermal stations
* Reduced coal production on high risk days
* Limits on available water for cooling
* Risk of bushfire
Train High* 29 points of buckling lines
* Air-con failure
Signal equipment susceptible to heat
Trams Moderate Some trams failed Engines sensitive to heat
Buses Minimal Buses served as backup to trains Air con struggles above 35CTable 2: Infrastructure impacts of 2009 heatwave in Melbourne. Source: PPT slide
prepared by Climate Institute associated with report: Infrastructure
Interdependencies and Business-level Impacts Report (2013).
The 2009 Melbourne heatwave highlighted the risks and vulnerability to urban infrastructure.
Like McEvoy et al (2012) the Climate Institute (2013) identified that businesses and government
Climate Change and Heatwaves in Melbourne a Review John Englart February 2015

are largely unprepared for extreme heatwave events of any magnitude and substantial duration
and of the danger for system interactions and dependencies breaking down resulting in
cascading system failure. The Climate Institute made specific recommendations for both
business and Government planning, management and coordination of heatwave risks to
infrastructure.
In both Melbourne and Adelaide during the 2009 heatwave the preparedness of emergency,
medical and hospital services was severely tested. The capacity for emergency services such as
ambulances and paramedics to respond to high demand was severely compromised.
(Department of Human Services 2009) This was also shown in the Adelaide morgue needing to
install a refrigerated container to cope with the unexpected surge in dead bodies. (Byard 2013)
The 2009 heatwave across southern Australia was estimated by CSIRO to have resulted in
financial losses of AU $800million, mainly as a result of power outages, transport service
disruptions and response costs.(PriceWaterhouseCoopers 2011)
Heatwaves also inflict an economic cost in reduced productivity which is likely to increase in the
future with the increase in temperatures. (Dunne, Stouffer and John 2013) The Climate Institute
(2013) modelled these costs for Australia under three scenarios of labour supply disruption, with
the estimated costs (due to increased labour costs and/or lost production) ranging from 0.2-1.1
per cent of revenue.
During the heatwave in January 2014 Victorian Premier Denis Napthine warned that 100,000
homes may suffer power loss through strain placed on electricity generation and transmission. It
appears that the more diversified generation capacity from solar PV, even though from a fairly
low base, and wind farms, made a noticeable difference to both peak usage and moving the
peak usage later in the day avoiding the necessity for blackouts.(Englart 2014b)
Heatwave impact on biodiversity and ecosystemsMelbourne's urban forest may contain about one million trees which provide a host of ecosystem
services including shade, carbon storage, water and pollution filtering and habitats for a variety
of native and invasive species. About 60% of trees are native to Australia, but with a higher
proportion of introduced deciduous species like the London Plane tree, American Elm and
Norway Maple in the City of Melbourne and more native Eucalypt and Callistemon in council
areas on the urban fringe.(Kendal 2011)
Eleven taxa, all deciduous, were identified as at risk in a warmer climate. Melbourne has been
characterised as a European city with its broad leafed deciduous trees, but this social sense of
place may need to change as these vegetation types are phased out and replaced by warmer
climate native and exotic species.(Kendal 2011)
During the 2009 heatwave and Millenium drought many exotic street trees suffered severe
stress. City councils in Melbourne have started to review and consider their street tree planting
Climate Change and Heatwaves in Melbourne a Review John Englart February 2015

program. Changing the composition of the urban forest will impact the vegetation amelioration of
the urban heat island to some extent. The impact will be felt differently from suburb to suburb
according to the makeup of the street trees to be replaced.(City of Melbourne 2012)
Increased native tree species may bring more Grey headed flying foxes, rainbow lorikeets and
other native bird species, increasing the functional diversity in the urban forest. The shift may
favour nectivorous birds over insectivourous birds which tend to favour the European exotics.
(Kendal 2011)
But heatwave and rising temperatures will also take it's toll on urban wildlife and flora which may
produce ecosystem changes. Larger bat species like the Grey Headed Flying Fox are a
signature species which have a temperature intolerance to heat at 41-42C which may impact
ecosystem services such as pollination and seed dispersal. (Welbergen, Klose, Markus and Eby
2008) The heatwave in 2014 in southern Queensland took a massive toll on this species
particularly affecting young and lactating females.(Englart 2014a)
Other species will also feel the heat. Increasing urban development on Melbourne’s urban fringe
plus rising temperatures, reducing precipitation and stream flows, and increased evaporation are
reducing stream habitat for species such as the Spotted Marsh frog found along the Merri Creek
catchment.(Wilson et al 2013)
COUNTERING THE THREAT OF HEATWAVES AND CLIMATE CHANGE IN MELBOURNE
Heatwave ManagementThe Victorian Heat Health Alert system, run by the Victorian Department of Health, has been in
operation since 2010. (Tapper 2014) The Victorian Auditor General (2014) found the warning
system was soundly based and accorded with best practice, but the communication of health
messages was not consistent and were not effectively targeted to meet the community needs.
The Victorian Auditor General's Office found that while the Victorian heatwave framework was
soundly based, there had been an abrogation of responsibility and strategic oversight when it
comes to heatwaves and extreme heat events in Victoria, including that the Heatwave plan for
Victoria is not a state wide plan similar to other natural disaster plans. The report identified many
critical gaps including: lack of clear governance arrangements with roles and responsibilities;
variable quality of planning and preparedness; public health messages and warnings not always
being well targeted; activation of heatwave plans was not well understood by agencies and
applied inconsistently. While there were fewer deaths in the 2014 heatwave than in 2009, the
Department of Health were not able to show the framework was responsible for this.(Victorian
Auditor General’s Office 2014)
Climate Change and Heatwaves in Melbourne a Review John Englart February 2015

Lack of governance at the state level was also demonstrated by a Moreland Council resolution at
the Council meeting in October 2014 regarding local heatwave response strategy calling on the
Victorian State government "to activate emergency planning measures when the temperature
reaches the heat health temperature threshold for three days in a row".
Englart (2015) found that in the Emergency Management Manual Victoria, while fire and flood
rate numerous mentions in Part 1 – Emergency Management in Victoria and Part 2 – Emergency
Risk Management and Mitigation in Victoria, there is no mention of heatwave or heat related risk
management, mitigation or adaptation strategies.
Municipal council's are already playing a substantial role in heatwave management, mitigation
and adaptation (Wales 2012, Englart 2014e, Englart 2014f, Englart 2014g), but this could be
improved through better co-ordination and resourcing at the State (Victorian Auditor General’s
Office 2014) and Federal levels(PriceWaterhouseCoopers 2011) and more interaction with the
private sector.(Wales 2012)
MitigationLong term solutions involve stabilising rising temperatures through making substantial and rapid
reductions in carbon emissions this decade.(Climate Commission Secretariat 2011) The Climate
Change Authority analysed comparative international climate action and recommended that
Australia's targets should be lifted from 5 per cent on 2000 levels to 15 percent on 2000 levels by
2020, with the addition of an extra 4 per cent saving that we have already achieved under the
Kyoto Protocol.(Climate Change Authority 2014, Englart 2014d)
In Victoria this means transitioning from coal based energy to solar and wind, and perhaps
ocean energy and geothermal in the future. (CSIRO 2012) Victoria currently produces about 90
per cent of electricity from brown coal which makes Victorians one of the most carbon intensive
Climate Change and Heatwaves in Melbourne a Review John Englart February 2015

on a per capita basis in the world. (Arup 2014) Residential solar photovoltaics are still at a
relatively low level of market installation with, for example, just 6 per cent of Moreland
households and 7.2 per cent of Darebin households with solar panels. (Englart 2013) The
development of wind farms has also been limited due to wind farm planning regulations with
wind contributing less than 3 per cent to Victoria’s electricity generating capacity according to
former Commissioner for Environmental Sustainability Professor Kate Auty. (Green 2013) This
compares with about 27 per cent wind farm capacity in South Australia (AEMO 2013).
Carbon certification in urban planning and urban development may also increase best practice
for reducing carbon intensity in construction practices and provide better integration of walking,
cycling and public transport infrastructure for a more sustainable living and working environment.
(Rauland 2013)
Municipal Councils are also leading the way in cutting greenhouse gas emissions. Melbourne
City Council was certified carbon neutral in 2011/2012 and has set an ambituous target for the
municipality of zero net emissions by 2020. (Wales 2012) Similarly Moreland Council achieved
carbon neutrality, through the purchase of international offset credits, in December 2012.
Moreland Council released it's plan – Zero Carbon Moreland - to cut community emissions by 22
per cent by 2020 in October 2014.(Englart 2014f)
As Council's are noted as having limited resources and are engaged in important mitigation,
adaptation and community resilience building, Wales (2012) recommends that State and Federal
government departments should provide policy guidance, funding and support packages “to plan
and implement a holistic climate change strategy for their communities”, as well as encourage
more collaboration with the private sector to include them in problem solving.
AdaptationWe need to adapt to a warmer climate by using urban planning to improve local climate and
health outcomes, to counteract the urban heat island effect.(Coutts 2008)
We need better heatwave emergency planning and response as recommended by VCOSS
(2013), increase building standards for energy efficiency and insulation, programs to retrofit older
buildings.(Reeves et al 2010).
There are a number of adaptive measures that can be taken to build urban resilience and reduce
the urban heat island effect associated with rising temperatures of global warming. Some of
these are personal and community adaptive measures, some require planning and
implementation by Council or State Government. Already Councils such as Moreland have
adopted climate action plans for reducing Council greenhouse gas emissions and putting in
place climate adaptation measures and emergency response plans (Englart
2014c, Englart2014f) or increasing the urban forest.(City of Melbourne 2012, Englart 2014e)
Climate Change and Heatwaves in Melbourne a Review John Englart February 2015

Personal measures
There is evidence that vulnerable people are already adapting behaviour in response to rising
temperatures and more extreme heatwaves. A qualitative study conducted in Western Sydney of
elderly people indicated that most use air conditioning with an awareness of its extra energy cost
as well as changing activity times to better accommodate the conditions and altering dietary
habits to reduce discomfit and health risks.(Banwell et al 2012)
Increase Urban surface albedo (reflectivity)
Increasing the albedo (reflectivity) of city surfaces can make a large impact in reducing the urban
heat island effect.
A number of proposals have been made for painting roofs white or using high reflectivity paint or
coatings as well as using roof space for vegetation to cool buildings.(Akbari 2009) These are
effective strategies for reducing heat inside buildings and saving energy usage costs.(University
of Melbourne 2011). However, a number of recent studies have shown that increasing albedo on
a citywide basis may have broader impacts. Stanford University civil and Environmental
Engineering Professor Mark Jacobson (2012) even suggested it was more worthwhile to install
solar PV panels than paint roofs white.(Englart 2011)
Jacobson's study used global climate modelling revealing feedbacks of local changes to the
large scale resulted in gross global warming. According to the study the population-weighted air
temperature decrease due to white roofs was ~0.02 K, while the global temperature increase
was ~0.07 K. Georgescu (2012) has also examined the impacts of increased urban albedo
through cool roofs in Arizona and discovered a major unintended consequence of changes to the
regional hydro-climate resulting in a 4 per cent decrease in precipitation. Further research by
Georgescu (2014) found that different adaptive approaches of cool roofs, green roofs and green-
albedo roofs each have their own strengths and weaknesses which can be used for
geographically appropriate strategies, but is far from straight forward as Akbari's orginal
proposal.
Road surfaces cover a substantial proportion of urban areas and are usually black asphalt which
absorbs heat contributing greatly to the urban heat island effect. A trial project in Chippendale,
an inner city suburb of Sydney, found that streets covered 24 per cent of the land surface area of
the suburb. Temperature measurement of two streets, one partially shaded by buildings and a
tree canopy and one exposed to full sunlight found there was a 2 degree difference in
temperature, both day and night. The City of Sydney is currently trialing pale coloured road
surfaces. (City of Sydney 2014, Australian Government 2013).
New cool pavement technologies being researched in the United States show promise, although
there is not one technology for all surfaces, but a complex range depending upon type of surface
and level of surface use, factoring in albedo and permeability properties required. (Levine 2011,
United States Environment Protection Agency 2012)
Climate Change and Heatwaves in Melbourne a Review John Englart February 2015

Sustainability campaigner Michael Mobbs said in an interview for ABC Lateline in 2014, “It
reduces the temperatures by two to four degrees on a hot day. During heatwaves, you're going
to find that there'll be maybe six to eight degrees difference. At the moment, it's about 10 to 15
per cent more expensive, but as it becomes more common, the price will drop down.” (Alberici
2014)
We are also seeing increasing use of artificial grass in inner urban environments used for
sporting fields and occasionally for residential gardens. As artificial grass does not use evapo-
transpiration, the air temperature above the grass warms up more than natural grass,
anecdotally by up to 20 degrees C. Artificial turf has a low albedo reducing it's direct warming
effect on surrounding building walls resulting in a 17% lower design cooling load, although the air
temperature canopy heating may add up to 60% increase in the cooling load for ventilation and
conduction. An unexpected result of the study due to artificial grass not require watering, is that
there is a total energy use saving in comparison to maintaining manicured lawn surfaces.
(Yaghoobian 2010)
Air-conditioning
Air-conditioning is now becoming widely used as a personal adaptation to increasing summer
temperatures and heatwaves. It is relatively easy to do, although increasing use of air-
conditioning is more like a maladaptation.
A number of studies have examined air-conditioning use which actually results in a warming
feedback to the urban environment. de Munck et al (2013) investigated the contribution of air
conditioning to air temperatures in the city of Paris using a coupled mesoscale meteorological
model and an urban energy balance model which resulted in up to 2 degrees extra warming in
the local urban environment. This study confirmed similar results from Taipei and Tokyo.(Hsieh
2007, Ohashi 2007) The Taipei study in particular focussed on an urban area with a high rate of
window airconditioning and the impact on nocturnal temperatures concluding, “The feedback
(penalty) of heat rejection to cooling load was found 10.7% during 19:01 to 02:00 h on the
following day.” (Hsieh 2007)
Increased use of air conditioning has implications for the electricity grid peak energy demand
which also suffers reductions in efficiency during extreme periods of heat. Excessive demand
may result in loss of power for thousands of people with cascading systemic effects.(McEvoy
2012)
So air conditioning is great if you own your own home but not so good if you are poor, rent or are
homeless. (Raymond 2010, VCOSS 2013)
Urban Forests
One of the primary ways to moderate urban heat island temperatures is through large scale use
Climate Change and Heatwaves in Melbourne a Review John Englart February 2015

of vegetation – urban forests to provide shade and evapotranspiration cooling down ambient
temperatures. There are significant cost-savings and benefits of increasing forest vegetation in
the urban environment including an increase in carbon sequestration, reduce rainfall runoff,
reduce local temperatures and the micro-climate, absorb pollution, reduce urban noise, reduce
building energy use, increase urban wildlife and biodiversity. It provides individual and
community benefits, including increase in real estate value, although it may also bring an
increase in pest problems and increase in fire risk. (Nowak and Dwyer 2007). Shading buildings
can substantially reduce inside building temperatures reducing the need for air conditioned
cooling and energy use.(Moore 2013)
One study of the economic worth of a street tree in Adelaide conservatively estimated its
economic benefit to be $200 per year as against the cost of maintenance of $20 per year, a 10
fold economic benefit.(Moore 2013)
But with rising temperatures and changing rainfall patterns – for Melbourne rainfall is projected to
reduce (Wilson 2013, Nicholls 2010) – at least 11 tree species may need to be phased out and
replaced with species more tolerant of higher temperatures and drought conditions.(Kendal
2013)
Socio-economic factors are significant in establishment of urban vegetation. Housing density,
income, education and immigrant status all influence vegetation cover as neighborhoods
develop over time. Education level is a strong predictor of canopy extent. This means there is an
important role for public funding and local government policy in establishment and maintenance
of urban forest as part of urban planning particularly for new developments and disadvantaged
neighbourhoods.(Luck, Smallbone O'Brien 2009).
Councils are already proactive in support of urban forestry and vegetation for the substantial
community, environmental, and climate benefits. Current Melbourne Local Government area
canopy cover is estimated at 11% with tree canopy covering about 22% of public streets and
parks while canopy cover on private land is only 3%. Melbourne's current urban forest is
vulnerable due to it's lack of diversity, reduced tree health due to lack of rainfall, water
restrictions, extreme heat, and urban development expansion, along with a large proportion of
trees approaching the end of their useful life expectancy.
In 2012 the City of Melbourne published it's Urban Forestry Strategy in which they recognised
the need to increase vegetation across the Melbourne CBD by setting an ambitious target of
doubling the canopy cover by 2040. Other goals include increasing forest diversity by a much
broader range of tree species and limiting the extent of any one species, improving vegetation
health, improving soil moisture and water quality, and increase in urban ecology and urban
wildlife diversity, and engaging with the community over greening the city and the urban forestry
program. This program is very much driven by a need to build greater urban resilience in
response to rising temperatures, the urban heat island effect and climate change.(City of
Climate Change and Heatwaves in Melbourne a Review John Englart February 2015

Melbourne 2012)
City of Moreland Council have also embarked upon increasing the tree canopy to combat high
temperatures and the urban heat island effect, with the northern suburbs of the municipality
being assessed by Loughnan (2013) as high on the heat vulnerability index. (Englart 2014e)
Map showing the heat vulnerability index for the postcode regions of Moreland
showing Coburg, North Coburg, Hadfield and Glenroy as high on the vulnerability
index. Source: Mapping Heatwave Vulnerability website
Water Sensitive Urban Design
The development of cities has involved building elaborate sewerage and storm-water systems.
By there very nature cities have large areas impervious to water so that during heavy rain flash
flooding often results when the stormwater and drainage systems are overwhelmed.
Research on urban heat island shows that retaining water in urban environments in open water
and wetlands systems reduces temperatures through evaporation and in particular through the
Lake effect and Park Cool Island Effect. Retaining water is also essential in fostering soil
moisture levels and urban forestry which also contribute to decreasing temperatures through
evapotranspiration. (Coutts 2012)
A 2006 survey of urban water professionals in Australia revealed that the greatest impediments
aren't technological but are social with institutional arrangements impeding efforts at better
stormwater use and management in the urban environment. (Brown and Farrelly 2009)
Climate Change and Heatwaves in Melbourne a Review John Englart February 2015
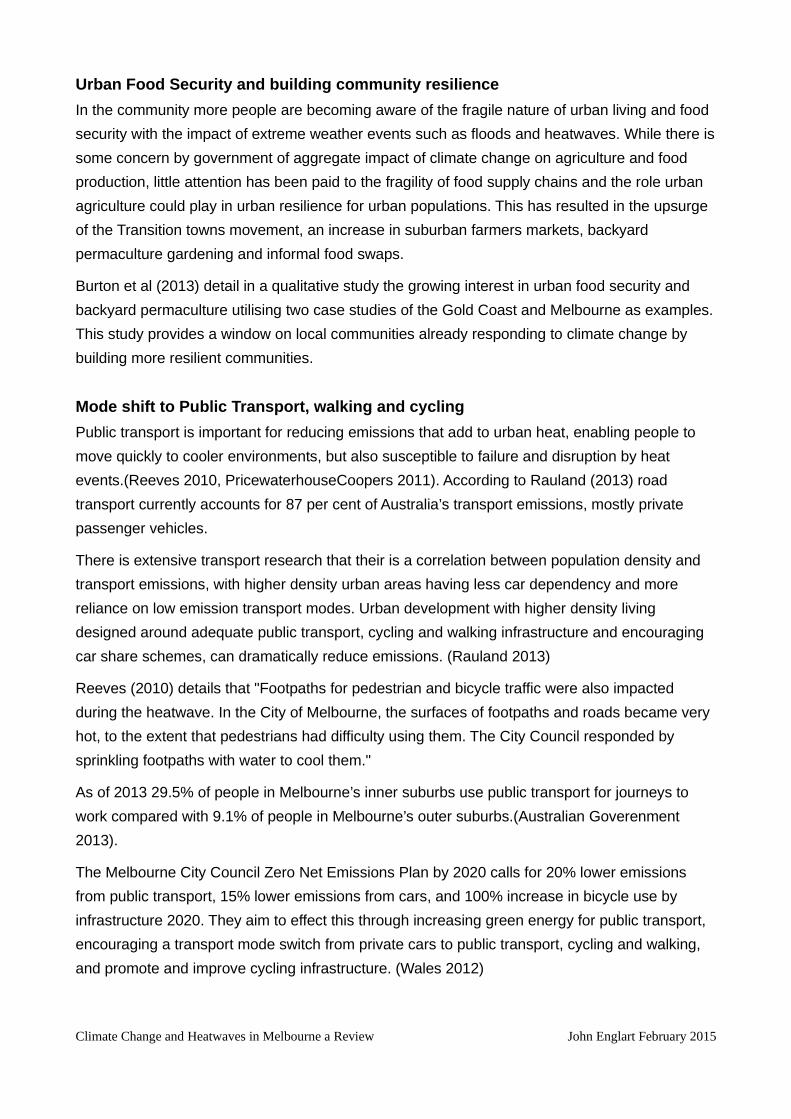
Urban Food Security and building community resilience
In the community more people are becoming aware of the fragile nature of urban living and food
security with the impact of extreme weather events such as floods and heatwaves. While there is
some concern by government of aggregate impact of climate change on agriculture and food
production, little attention has been paid to the fragility of food supply chains and the role urban
agriculture could play in urban resilience for urban populations. This has resulted in the upsurge
of the Transition towns movement, an increase in suburban farmers markets, backyard
permaculture gardening and informal food swaps.
Burton et al (2013) detail in a qualitative study the growing interest in urban food security and
backyard permaculture utilising two case studies of the Gold Coast and Melbourne as examples.
This study provides a window on local communities already responding to climate change by
building more resilient communities.
Mode shift to Public Transport, walking and cycling
Public transport is important for reducing emissions that add to urban heat, enabling people to
move quickly to cooler environments, but also susceptible to failure and disruption by heat
events.(Reeves 2010, PricewaterhouseCoopers 2011). According to Rauland (2013) road
transport currently accounts for 87 per cent of Australia’s transport emissions, mostly private
passenger vehicles.
There is extensive transport research that their is a correlation between population density and
transport emissions, with higher density urban areas having less car dependency and more
reliance on low emission transport modes. Urban development with higher density living
designed around adequate public transport, cycling and walking infrastructure and encouraging
car share schemes, can dramatically reduce emissions. (Rauland 2013)
Reeves (2010) details that "Footpaths for pedestrian and bicycle traffic were also impacted
during the heatwave. In the City of Melbourne, the surfaces of footpaths and roads became very
hot, to the extent that pedestrians had difficulty using them. The City Council responded by
sprinkling footpaths with water to cool them."
As of 2013 29.5% of people in Melbourne’s inner suburbs use public transport for journeys to
work compared with 9.1% of people in Melbourne’s outer suburbs.(Australian Goverenment
2013).
The Melbourne City Council Zero Net Emissions Plan by 2020 calls for 20% lower emissions
from public transport, 15% lower emissions from cars, and 100% increase in bicycle use by
infrastructure 2020. They aim to effect this through increasing green energy for public transport,
encouraging a transport mode switch from private cars to public transport, cycling and walking,
and promote and improve cycling infrastructure. (Wales 2012)
Climate Change and Heatwaves in Melbourne a Review John Englart February 2015

CONCLUSIONMitigating against rising temperatures and extreme heatwaves will require long term action by
government to regulate and reduce greenhouse gases to eventually stabilise temperatures. In
the meantime climate adaptation measures need to be implemented to reduce the risks to
health, urban infrastructure and urban biodiversity. Many of these changes are political or
regulatory requiring decisions based at the State Government level who are responsible for land
management, regulation of electricity production, planning, public transport, building regulations
and many more areas of responsibility. Local Government has a strong role to play in both urban
planning and adaptation strategies and emergency preparedness response.
All of these areas could be significant in reducing emissions or changing carbon footprint
behaviours and in adaptation strategies. PriceWaterhouseCoopers (2011) also identified a need
for greater national consistency in key elements underpinning planning and response
arrangements for heat events indicating a role for the Federal Government.
To reduce greenhouse gas emissions and stabilise temperature will require behavioural change
by individuals, action by business and all three tiers of government. To not do so will result in a
more onerous climate with greater costs amassing a huge climate debt for our later life and
those who come after us as we progress through this century.
References
ABC News (23 January 2014) Heatwave blamed for large spike in the number of deaths in
Victoria last week http://www.abc.net.au/news/2014-01-23/heatwave-death-toll-expected-
to-top-almost-400/5214496 Viewed 6 June 2014
AEMO (2013) South Australian Wind Study Report
http://www.aemo.com.au/Electricity/Planning/South-Australian-Advisory-Functions/Wind-
Study-Report
Akbari, H., S. Menon, and A. Rosenfeld (2009) Global cooling: Increasing world-wide urban
albedos to offset CO2, Climatic Change, 95, 3-4, 275-286, doi:10.1007/s10584-008-9515-
9.
http://link.springer.com/article/10.1007%2Fs10584-008-9515-9
Akompab, D.A., Peng Bi, Susan Williams, Janet Grant, Iain A. Walker and Martha Augoustinos
(2013) Heat Waves and Climate Change: Applying the Health Belief Model to Identify
Predictors of Risk Perception and Adaptive Behaviours in Adelaide, Australia. International
Journal of Environmental Research and Public Health 2013, 10(6), 2164-2184;
doi:10.3390/ijerph10062164
http://www.mdpi.com/1660-4601/10/6/2164
Climate Change and Heatwaves in Melbourne a Review John Englart February 2015

Alberici, E. (Presenter), & O'Neill, M (Reporter). (2014, June 2) Cities need adapt to deadly
heatwaves: Lateline, [video podcast and transcript] Retrieved
fromhttp://www.abc.net.au/lateline/content/2014/s4017438.htm
Argüeso, D., Jason P. Evans, Lluís Fita, Kathryn J. Bormann, (2013) Temperature response to
future urbanization and climate change. Climate Dynamics May 2013 DOI
10.1007/s00382-013-1789-6
http://link.springer.com/article/10.1007%2Fs00382-013-1789-6
Arup, Tom. Fire at Morwell reignites brown-coal debate.The Age (9 March 2014) Visited 25
March 2014 http://www.theage.com.au/victoria/fire-at-morwell-reignites-browncoal-debate-
20140308-34e3n.html
Australian Goverenment (2013) Australian State of the Cities 2013 report Chapter 4 on
Sustainability http://www.infrastructure.gov.au/infrastructure/pab/soac/
Banwell, C., Jane Dixon, Hilary Bambrick, Ferne Edwards, and Tord Kjellström (2012) Socio-
cultural reflections on heat in Australia with implications for health and climate change
adaptation. Global Health Action. 2012; 5: 10.3402/gha.v5i0.19277
http://www.globalhealthaction.net/index.php/gha/article/view/19277
Brown, R.R. and M.A. Farrelly (2009) Challenges ahead: social and institutional factors
influencing sustainable urban stormwater management in Australia . Water Science and
Technology. 59 (4), pp653-660
https://www.researchgate.net/publication/24035430_Challenges_ahead_social_and_institu
tional_factors_influencing_sustainable_urban_stormwater_management_in_Australia
Bureau of Meteorology (2012) Special Climate Statement 41 - Extreme November heat in
eastern Australia, issued 4 December 2012.
http://www.bom.gov.au/climate/current/statements/scs41.pdf
Bureau of Meteorology (2013a) Special Climate Statement 43 - Extreme heat in January 2013,
updated 1 February 2013. http://www.bom.gov.au/climate/current/statements/scs43e.pdf
Bureau of Meteorology (2013b) Special Climate Statement 45 – a prolonged Autumn heatwave
for southeast Australia, issued 15 March 2013.
http://www.bom.gov.au/climate/current/statements/scs45.pdf
Bureau of Meteorology (2013c) Special Climate Statement 46 – Australia's warmest September
on record, issued 2 October 2013.
http://www.bom.gov.au/climate/current/statements/scs46.pdf
Bureau of Meteorology (2014a) Annual climate statement 2013. Bureau of Meteorology website,
viewed 21 March 2014. http://www.bom.gov.au/climate/current/annual/aus/2013/
Bureau of Meteorology (2014b) Special Climate Statement 47 – an intense heatwave in central
Climate Change and Heatwaves in Melbourne a Review John Englart February 2015

and eastern Australia, issued 21 January 2014.
http://www.bom.gov.au/climate/current/statements/scs47.pdf
Bureau of Meteorology (2014c) Special Climate Statement 48 – one of southeast Australia's
most significant heatwaves, updated 21 January
2014.http://www.bom.gov.au/climate/current/statements/scs48.pdf
Bureau of Meteorology (2014d) Special Climate Statement 49 – an exceptionally prolonged
autumn warm spell over much of Australia, issued 29 May 2014.
http://www.bom.gov.au/climate/current/statements/scs48.pdf
Burton, P, Lyons, K, Richards, C, Amati, M, Rose, N, Desfours, L, Pires, V, Barclay, R, (2013),
Urban food security, urban resilience and climate change, National Climate Change
Adaptation Research Facility, Gold Coast,
pp.160. http://www.nccarf.edu.au/publications/urban-food-security-resilience-climate-
change
Buxton, M., Rachel Haynes, David Mercer, Andrew Butt, (2011) Vulnerability to Bushfire Risk at
Melbourne’s Urban Fringe: The Failure of Regulatory Land Use Planning. Geographical
Research. Vol. 49 Issue 1, p1-12. DOI: 10.1111/j.1745-5871.2010.00670.x.
http://onlinelibrary.wiley.com/doi/10.1111/j.1745-5871.2010.00670.x/abstract
Byard, R.W. (2013) Heat-related deaths. Forensic Sci Med Pathol. DOI 10.1007/s12024-013-
9413-y https://www.researchgate.net/publication/236057201_Heat-related_deaths
City of Melbourne Council (2012) Urban Forest Strategy. Making a great city greener 2012-
2032http://melbourne.vic.gov.au/urbanforest
City of Sydney (2014). Urban Heat Island Effect. Measuring the effect in Sydney.
http://www.cityofsydney.nsw.gov.au/vision/towards-2030/sustainability/carbon-
reduction/urban-heat-island2
Climate Change Authority (2014) Reducing Australia’s Greenhouse Gas Emissions: Targets and
Progress Review - Final Report. Australian
Government.http://www.climatechangeauthority.gov.au/reviews/targets-and-progress-
review-3
Climate Commission Secretariat (2011) The Critical Decade: Climate science, risks and
responses. Australian Government, Department of Climate Change and Energy Efficiency
https://climatecommission.files.wordpress.com/2013/09/the-critical-decade_july-
revision_low-res.pdf
Climate Institute (2012) Coming Ready or Not: Managing climate risks to Australia’s
infrastructure. The Climate Institute, 2012.
http://www.climateinstitute.org.au/coming-ready-or-not.html
Climate Change and Heatwaves in Melbourne a Review John Englart February 2015

Climate Institute (2013) Infrastructure Interdependencies and Business-Level Impacts Report.
The Climate Institute, 2013.
http://www.climateinstitute.org.au/articles/publications/infrastructure-interdependencies-
and-business-level-impacts.html
Coates, L., Katharine Haynes, James O’Brien, John McAneney, Felipe Dimer de Oliveira, (2014)
Exploring 167 years of vulnerability: An examination of extreme heat events in Australia
1844–2010. Environmental Science and Policy. Volume 42, October 2014, Pages 33–44
http://www.sciencedirect.com/science/article/pii/S1462901114000999
Coutts, A.M., Jason Beringer, Nigel J. Tapper, 2008: Investigating the climatic impact of urban
planning strategies through the use of regional climate modelling: a case study for
Melbourne, Australia. International Journal of Climatology. DOI: 10.1002/joc.1680
http://onlinelibrary.wiley.com/doi/10.1002/joc.1680/abstract
Coutts, A.M., Nigel J. Tapper, Jason Beringer, Margaret Loughnan, Matthias Demuzere (2012)
Watering our cities: The capacity for Water Sensitive Urban Design to support urban
cooling and improve human thermal comfort in the Australian context. Progress in Physical
Geography 37(1) 2–28 DOI: 10.1177/0309133312461032
http://ppg.sagepub.com/content/early/2012/11/06/0309133312461032
CSIRO (2012). Ocean renewable energy: 2012-2050. http://www.csiro.au/Organisation-
Structure/Flagships/Energy-Flagship/Ocean-renewable-energy.aspx
CSIRO and BOM (2014) State of the Climate Report
2014.http://www.csiro.au/Outcomes/Climate/Understanding/State-of-the-Climate-
2014.aspx
de Munck, C., Pigeon, G., Masson, V., Meunier, F., Bousquet, P., Tréméac, B., Merchat, M.,
Poeuf, P. and Marchadier, C. (2013) How much can air conditioning increase air
temperatures for a city like Paris, France?. International Journal of Climatology, 33: 210–
227.
http://onlinelibrary.wiley.com/doi/10.1002/joc.3415/abstract
Department of Human Services, (2009), January 2009 Heatwave in Victoria: an Assessment of
Health Impacts, Victorian Government www.health.vic.gov.au
http://docs.health.vic.gov.au/docs/doc/F7EEA4050981101ACA257AD80074AE8B/
$FILE/heat_health_impact_rpt_Vic2009.pdf
Department of Infrastructure and Regional Development (2013) Australian State of the Cities
2013. Chapter 4 Sustainability Australian Government
http://www.infrastructure.gov.au/infrastructure/pab/soac/
Dunne John P., Ronald J. Stouffer, & Jasmin G. John (2013) Reductions in labour capacity from
heat stress under climate warming. Nature Climate Change doi:10.1038/nclimate1827
Climate Change and Heatwaves in Melbourne a Review John Englart February 2015

http://www.nature.com/nclimate/journal/v3/n6/full/nclimate1827.html
Englart, John (2011) Engineering Professor: Install solar panels to combat Global Warming
rather than paint roofs white. (October 2011) Climate Citizen blog, viewed 6 June
2014http://takvera.blogspot.com.au/2011/10/engineering-professor-install-solar.html
Englart, John (2013) Solar PV Panel installations in Fawkner exceed 5 per cent of dwellings. (12
December 2013) Sustainable Fawkner website. Viewed 22 March
2014http://fawkner.org/2013/12/12/solar-pv-panel-installations-in-fawkner-exceed-5-per-
cent-of-dwellings/
Englart, John (2014a) Mass bat deaths in record setting Queensland heatwave. (7 January
2014) Climate Citizen blog.
http://takvera.blogspot.com.au/2014/01/mass-bat-deaths-in-record-setting.html
Englart, John (2014b) Victorian Premier warns 100,000 premises may lose power in extreme
heatwave. (16 January 2014) Climate Citizen blog, viewed 6 June 2014.
http://takvera.blogspot.com.au/2014/01/victorian-premier-warns-100000-premises.html
Englart, John. (2014c) Moreland Council calling for greater heatwave emergency planning for
Victoria. (14 February 2014) Climate Citizen blog, viewed 23 March 2014
http://takvera.blogspot.com.au/2014/02/moreland-council-calls-for-greater.html
Englart, John. (2014d) Climate Change Authority recommended Emissions reduction targets. (2
March 2014) Climate Citizen blog, viewed 23 March 2014
http://takvera.blogspot.com.au/2014/03/reduce-greenhouse-gas-emissions-by-19.html
Englart, John (2014e) Moreland increasing tree canopy to combat urban heat island effect. (12
September 2014) Climate Action Moreland blog. viewed 9 February 2015.
http://climateactionmoreland.org/2014/09/12/moreland-increasing-tree-canopy-to-combat-
urban-heat-island-effect/
Englart, John (2014f) Moreland Council plan to cut community emissions 22 per cent by 2020. (5
October 2014) Climate Action Moreland blog. viewed 9 February 2015.
http://climateactionmoreland.org/2014/10/05/moreland-council-plan-to-cut-community-
emissions-22-per-cent-by-2020/
Englart, John (2014g) Moreland Council increases Heatwave response strategy. (24 October
2014) Climate Action Moreland blog. viewed 9 February
2015.http://climateactionmoreland.org/2014/10/24/moreland-council-increases-heatwave-
response-strategy/
Englart, John (2015) Heatwaves and Victoria's Heat Health Alert Warning System. (4 January
2015) Climate Action Moreland blog, viewed 9 February 2015.
http://climateactionmoreland.org/2015/01/04/heatwaves-and-victorias-heat-health-alert-
Climate Change and Heatwaves in Melbourne a Review John Englart February 2015
warning-system/
Georgescu, M., A. Mahalov and M Moustau (2012) Seasonal hydroclimatic impacts of Sun
Corridor Expansion. Environ. Res. Lett. 7 034026 doi:10.1088/1748-9326/7/3/034026
http://iopscience.iop.org/1748-9326/7/3/034026
Georgescu, M., Philip E. Morefield, Britta G. Bierwagen, and Christopher P. Weaver (2014)
Urban adaptation can roll back warming of emerging megapolitan regions. PNAS February
25, 2014, 111(8), 2909-2914
http://www.pnas.org/content/111/8/2909.abstract
Green, H., John Gilbert, Ross James, Roger Byard (2001) An analysis of factors contributing to
a series of deaths caused by exposure to high environmental temperatures. Am J Forensic
Med Pathol. 2001 Jun;22(2):196-9.
http://journals.lww.com/amjforensicmedicine/Fulltext/2001/06000/An_Analysis_of_Factors_
Contributing_to_a_Series_of.18.aspx
Grunstein, Ron. 2013. Too hot to sleep? Here’s why. The Conversation (8 January 2013) Viewed
23 March 2014.
http://theconversation.com/too-hot-to-sleep-heres-why-11492
Hall, G.V., Rennie M D'Souza and Martyn D Kirk (2002) Foodborne disease in the new
millennium: out of the frying pan and into the fire? Med J Aust 2002; 177 (11): 614-618.
https://www.mja.com.au/journal/2002/177/11/foodborne-disease-new-millennium-out-
frying-pan-and-fire
Hansen, A., P. Bi, M. Nitschke, P. Ryan, D. Pisaniello, G. Tucker (2008) The effect of heat waves
on mental health in a temperate Australian city. Environmental Health Perspectives,
116(10), 1369-1375.
http://www.ncbi.nlm.nih.gov/pmc/articles/PMC2569097/
Herring, S. C., M. P. Hoerling, T. C. Peterson, and P. A. Stott, Eds., 2014: Explaining Extreme
Events of 2013 from a Climate Perspective. Bull. Amer. Meteor. Soc., 95 (9), S1–S96.
http://www2.ametsoc.org/ams/index.cfm/publications/bulletin-of-the-american-
meteorological-society-bams/explaining-extreme-events-of-2013-from-a-climate-
perspective/
Hsieh C-M, Aramaki T, Hanaki K. (2007) The feedback of heat rejection to air conditioning load
during the nighttime in subtropical climate. Energy and Building 39: 1175–1182.
http://www.sciencedirect.com/science/article/pii/S0378778807000175
Huang, C., Adrian Gerard Barnett, Xiaoming Wang, Pavla Vaneckova, Gerard FitzGerald, Shilu
Tong (2011) Projecting Future Heat-Related Mortality under Climate Change Scenarios: A
Systematic Review. Environmental Health Perspectives 119 (12) pp 1681-1690
http://www.sciencedirect.com/science/article/pii/S0378778807000175
Climate Change and Heatwaves in Melbourne a Review John Englart February 2015

Huang C., Barnett A.G., Xu Z., Chu C., Wang X., Turner L.R. and Tong S. (2013) Managing the
health effects of temperature in response to climate change: challenges ahead.
Environmental Health Perspectives. 2013 Apr;121(4):415-9. doi: 10.1289/ehp.1206025.
http://www.ncbi.nlm.nih.gov/pmc/articles/PMC3620746/
Hughes, L and Will Steffen. (2013) Be Prepared: Climate Change and the Australian Bushfire
Threat. Climate Council report http://www.climatecouncil.org.au/be-prepared
Human services Victoria (1997) Surveillance of Notifiable Diseases in Victoria 1997. Disease
Control Section, Public Health and Development Division of the Victorian Government
Department of Human Services. ISBN 1037-1532
Jacobson, M.Z., John E. Ten Hoeve (2012) Effects of Urban Surfaces and White Roofs on
Global and Regional Climate. Journal of Climate, 25 (3), p1028-1044
http://www.stanford.edu/group/efmh/jacobson/Articles/Others/HeatIsland+WhiteRfs0911.p
df
Keating, A. and Handmer J. (2013) Future potential losses from extremes under climate change:
the case of Victoria, Australia. VCCCAR Project: Framing Adaptation in the Victorian
Context, Working Paper Victorian Centre for Climate Change Adaptation Research,
Melbourne.
http://www.vcccar.org.au/framing-multi-level-and-multi-actor-adaptation-responses-in-
victorian-context
Kendal, D. (2011) Potential effects of climate change on Melbourne’s street trees and some
implications for human and non-human animals . State of Australian Cities Report 2011.
http://soac.fbe.unsw.edu.au/2011/papers/SOAC2011_0112_final.pdf
Laaidi, K., Abdelkrim Zeghnoun, Bénédicte Dousset, Philippe Bretin, Stéphanie Vandentorren,
Emmanuel Giraudet, Pascal Beaudeau (2011) The Impact of Heat Islands on Mortality in
Paris during the August 2003 Heat Wave. Environ Health Perspect 120:254-259 (2012).
http://dx.doi.org/10.1289/ehp.1103532 [online 01 September 2011]
http://ehp.niehs.nih.gov/1103532/
Lewis, S.C., David J. Karoly (2013) Anthropogenic contributions to Australia’s record summer
temperatures of 2013. Geophysical Research Letters, VOL. 40, 3705–3709,
doi:10.1002/grl.50673 http://onlinelibrary.wiley.com/doi/10.1002/grl.50673/abstract
Lewis, S. C., and D. J. Karoly (2014) Australia’s hottest year was no freak event: humans
caused it. The Conversation, viewed 23 March
2014 https://theconversation.com/australias-hottest-year-was-no-freak-event-humans-
caused-it-21734
Li, D., Elie Bou-Zeid (2013) Synergistic Interactions between Urban Heat Islands and Heat
Waves: the Impact in Cities is Larger than the Sum of its Parts. Journal of Applied
Climate Change and Heatwaves in Melbourne a Review John Englart February 2015

Meteorology and Climatology Vol 52, pp 2051-2064, doi:
http://dx.doi.org/10.1175/JAMC-D-13-02.1
Loughnan, M.E., Neville Nicholls, Nigel J. Tapper (2010) The effects of summer temperature,
age and socioeconomic circumstance on Acute Myocardial Infarction admissions in
Melbourne, Australia. International Journal of Health Geographics 2010, 9:41
http://www.ncbi.nlm.nih.gov/pmc/articles/PMC2924270/
Loughnan, M.E., Tapper, NJ, Phan, T, Lynch, K, McInnes, JA (2013), A spatial vulnerability
analysis of urban populations during extreme heat events in Australian capital cities,
National Climate Change Adaptation Research Facility, Gold Coast, 128 pp.
http://www.nccarf.edu.au/publications/spatial-vulnerability-urban-extreme-heat-events
Luck, G.W., Lisa T. Smallbone, Rachel O’Brien (2009) Socio-Economics and Vegetation Change
in Urban Ecosystems: Patterns in Space and Time, Ecosystems 12: 604–620 DOI:
10.1007/s10021-009-9244-6
http://link.springer.com/article/10.1007/s10021-009-9244-6
McEvoy, D., Iftekhar Ahmed, Jane Mullett (2012) The impact of the 2009 heatwave on
Melbourne’s critical infrastructure. Local Environment 17(8), 783-796
http://www.tandfonline.com/doi/abs/10.1080/13549839.2012.678320#.VNcp-B93P0o
Moore, G.M. (2013) Valuing and Maintaining the Urban Forest. University of Melbourne.
http://robertsday.com.au/wp-content/uploads/2014/01/Valuing-the-Urban-Forest-AGHS-
2013.pdf
National Research Council. 2013 Abrupt Impacts of Climate Change: Anticipating Surprises.
Washington, DC: The National Academies Press. Viewed 23 March 2014
http://www.nap.edu/catalog.php?record_id=18373
NCCARF and Monash University. 2013. Mapping Heatwave Vulnerability. Viewed 2 March
2014.http://www.mappingvulnerabilityindex.com/
Nguyen, M., Xiaoming Wang and Dong Chen (2010), An Investigation of Extreme Heatwave
Events and Their Effects on Building & Infrastructure, CSIRO National Flagships Climate
Adaptation
http://www.csiro.au/Organisation-Structure/Flagships/Climate-Adaptation-Flagship/CAF-
working-papers/CAF-working-paper-9.aspx
Nicholls, N. (2010) Local and remote causes of the southern Australian autumn-winter rainfall
decline, 1958–2007 . Climate Dynamics 34:835–845 DOI 10.1007/s00382-009-0527-6
http://link.springer.com/article/10.1007%2Fs00382-009-0527-6
Nicholls, N., Carol Skinner, Margaret Loughnan, Nigel Tapper, 2007: A simple heat alert system
for Melbourne, Australia. International Journal of Biometeorology, DOI 10.1007/s00484-
Climate Change and Heatwaves in Melbourne a Review John Englart February 2015

007-0132-5
http://link.springer.com/article/10.1007%2Fs00484-007-0132-5
Nowak, D.J. and John F. Dwyer (2007), Chapter 2 – Understanding the Benefits and costs of
urban forest Ecosystems, from Urban and Community Forestry in the Northeast, 2nd ed.,
edited by, J. E. Kuser. ISBN 978-1-4020-4289-8
http://link.springer.com/chapter/10.1007%2F978-1-4020-4289-8_2
Ohashi Y, Genshi Y, Kondo H, Kikegawa Y, Yoshikado H, Hirano Y. (2007) Influence of air-
conditioning waste heat on air temperature in Tokyo during summer: numerical
experiments using an urban canopy model coupled with a building energy model. Journal
of Applied Meteorology and Climatology 46: 66–81.
http://journals.ametsoc.org/doi/abs/10.1175/JAM2441.1
Perkins, S.E., L.V. Alexander (2013) On the Measurement of Heat Waves. Journal of Climate Vol
26 pp4500-4517 DOI: 10.1175/JCLI-D-12-00383.1
http://journals.ametsoc.org/doi/abs/10.1175/JCLI-D-12-00383.1
Poumadere, M. Claire Mays, Sophie Le Mer, Russell Blong (2005) The 2003 Heat Wave in
France: Dangerous Climate Change Here and Now. Risk Analysis, Vol. 25, No. 6, 2005
http://onlinelibrary.wiley.com/doi/10.1111/j.1539-6924.2005.00694.x/abstract
PriceWaterhouseCoopers, (November 2011), Protecting human health and safety during severe
and extreme heat events. A national framework. Report for Australian Government
Department of Climate Change and Energy and Efficiency
http://www.pwc.com.au/industry/government/publications/extreme-heat-events.htm
Qi, X. (2013) Assessment of socio-environmental drivers of suicide in Australia. (PhD thesis)
School of Public Health and Social Work, Queensland University of Technology
http://eprints.qut.edu.au/63966/
Rauland, Vanessa. 2013. Decarbonising cities: certifying carbon reduction in urban development
(PhD thesis) Curtin University, Faculty of Humanities, Curtin University Sustainability
Policy Institute
http://espace.library.curtin.edu.au/R?func=dbin-jump-full&local_base=gen01-
era02&object_id=194386
Raymond, M. (2010), Hot and Homeless in Melbourne, Health Issues Summer 2009 issue 101.
http://search.informit.com.au/documentSummary;dn=655346899926307;res=IELHEA
Reeves, J., Colleen Foelz, Peter Grace, Peter Best, Torben Marcussen, Shahbaz Mushtaq,
Roger Stone, Margaret Loughnan, Darryn McEvoy, Ifte Ahmed, Jane Mullett, Katharine
Haynes, Deanne Bird, Lucinda Coates, Megan Ling, (2010), Impacts and adaptation
response of infrastructure and communities to heatwaves: the southern Australian
experience of 2009, NCCARF – National Climate Change Adaptation Research Facility.
Climate Change and Heatwaves in Melbourne a Review John Englart February 2015

http://www.nccarf.edu.au/publications/impacts-and-adaptation-responses-infrastructure-
and-communities-heatwaves
Scorcher (2013) Retrieved June 6, 2014, from http://www.scorcher.org.au
Sherwood, S.C., Matthew Huber (2010) An adaptability limit to climate change due to heat
stress. Proceedings of the National Academy of Science. 107 (21) 9552–9555
doi/10.1073/pnas.0913352107
http://www.pnas.org/content/107/21/9552.abstract
Steffen, W. (2013) The Angry Summer. Climate
Councilhttps://climatecommission.files.wordpress.com/2013/09/130408-angry-summer-
report.pdf
Steffen, W., and Lesley Hughes (2013) Off the Charts. Record Breaking October Heat and
Climate Change . Climate Council http://www.climatecouncil.org.au/record-breaking-
october
Steffen, W. (2014) Off the Charts: 2013 was Australia's hottest year. Climate
Council.http://www.climatecouncil.org.au/offthecharts
Steffen, W., Lesley Hughes, Sarah Perkins (2014) Heatwaves: Hotter, Longer, More Often –
Climate Council http://www.climatecouncil.org.au/heatwaves-report
Steffen, W. (2014) Climate Council Seasonal Update: Abnormal Autumn 2014. Climate
Councilhttp://www.climatecouncil.org.au/abnormalautumn
Steffen, W. (2015) Quantifying the Impact of Climate Change on Extreme Heat in Australia.
Climate Council http://www.climatecouncil.org.au/quantifying-extreme-heat
Tapper, N. (2014) Tackling Urban Heat. Professor Nigel Tapper's presentation at the City of
Moreland (25 june 2014) on urban heat island effects. NAGA website
http://www.naga.org.au/online-library/cat_view/59-climate-change-science-and-
adaptation.html
Tong S., Xiao Yu Wang, Weiwei Yu, Dong Chen, and Xiaoming Wang (2014) The impact of
heatwaves on mortality in Australia: a multicity study. BMJ Open 2014;4:e003579
doi:10.1136/bmjopen-2013-003579
http://bmjopen.bmj.com/content/4/2/e003579.full
Torok, S.J., Christopher Morris, Carol Skinner, and Neil Plummer (2001) Urban heat island
features of southeast Australian towns. Aust. Meteor. Mag., 50, 1–13.
http://citeseerx.ist.psu.edu/viewdoc/download?doi=10.1.1.222.5894&rep=rep1&type=pdf
United States Environment Protection Agency (2012) Cool Pavements Chapter from 'EPA’s
Reducing Urban Heat Islands: Compendium of Strategies'
http://www.epa.gov/heatisland/mitigation/pavements.htm
Climate Change and Heatwaves in Melbourne a Review John Englart February 2015

University of Melbourne (2011) Cool Roofs: City of Melbourne Research Report
http://www.melbourne.vic.gov.au/Sustainability/CouncilActions/Documents/Cool_Roofs_Re
port.pdf
Victorian Auditor General’s Office (2014) Heatwave Management: Reducing the Risk to Public
Health. Report tabled in State Parliament 14 October 2014
http://www.audit.vic.gov.au/reports_and_publications/latest_reports/2014-15/20141014-
heatwave-management.aspx
Victorian Council of Social Service (2013), Feeling the heat: heat waves and social vulnerability
in Victoria
http://vcoss.org.au/feeling-the-heat-heat-waves-and-social-vulnerability-in-victoria/
Wales, N., Isara Khanjanasthiti, Sarah Savage, George Earl (2012) Climate Change Resilience
of Melbourne. Mirvac School of Sustainable Development. Paper 185.
http://epublications.bond.edu.au/sustainable_development/185
Welbergen, J.A., Stefan M Klose, Nicola Markus, Peggy Eby, 2008: Climate change and the
effects of temperature extremes on Australian flying-foxes. Proceedings of the Royal
Society B Biological Sciences, doi: 10.1098/rspb.2007.1385
http://rspb.royalsocietypublishing.org/content/275/1633/419.full.pdf+html?frame=header
Wilson, J.N., Sarah Bekessy, Kirsten M. Parris, Ascelin Gordon, Geoffrey W. Heard and Brendan
A. Wintle (2013) Impacts of climate change and urban development on the spotted marsh
frog (Limnodynastes tasmaniensis). Austral Ecology 38, 11-12
http://onlinelibrary.wiley.com/doi/10.1111/j.1442-9993.2012.02365.x/abstract
Xu, Z., Cunrui Huang, Wenbiao Hu, Lyle R Turner, Hong Su, Shilu Tong (2013) Extreme
temperatures and emergency department admissions for childhood asthma in Brisbane,
Australia . Occupational and Environmental Medicine doi:10.1136/oemed-2013-101538
http://www.ncbi.nlm.nih.gov/pubmed/23884454
Yaghoobian, N., Jan Kleissl, E. Scott Krayenhoff (2010) Modelling the Thermal Effects of
Artificial Turf on the Urban Environment. Journal of Applied Meteorology and Climatology.
Vol 49 332-345
http://journals.ametsoc.org/doi/abs/10.1175/2009JAMC2198.1
Zacharias S., Christina Koppe and Hans-Guido Mücke (2015) Climate Change Effects on Heat
Waves and Future Heat Wave-Associated IHD Mortality in Germany. Climate 2015, 3(1),
100-117; doi:10.3390/cli3010100
http://www.mdpi.com/2225-1154/3/1/100/htm#B21-climate-03-00100
Climate Change and Heatwaves in Melbourne a Review John Englart February 2015