Embed Size (px)
Citation preview

Climate Change and Ozone LossClimate Change and Ozone Loss
G. Tyler Miller’sLiving in the Environment
13th Edition
Chapter 18
G. Tyler Miller’sLiving in the Environment
13th Edition
Chapter 18

Key ConceptsKey Concepts
• How does the EarthHow does the Earth’’s climate s climate fluctuate?fluctuate?
• What factors affect climate?What factors affect climate?• What are the possible affects What are the possible affects
of global warming?of global warming?• How are human activities How are human activities
affecting the ozone layer?affecting the ozone layer?

12
Average temperature over past 900,000 years
Thousands of years ago
Ave
rag
e su
rfac
e te
mp
erat
ure
(°C
)
900 800 700 600 500 400 300 200 100 Present9
10
11
13
14
15
16
17
Past Global TemperaturesPast Global TemperaturesPast Global TemperaturesPast Global Temperatures

Temperature change over past 22,000 yearsTemperature change over past 22,000 years
Years agoYears ago
Tem
per
atu
re c
han
ge
(°C
)T
emp
erat
ure
ch
ang
e (°
C)
20,00020,000 10,00010,000 2,0002,000 1,0001,000 200200 100100 NowNow
-5-5
-4-4
-3-3
-2-2
-1-1
00
11
22
End oflast iceage
Agriculture establishedAgriculture established
Average temperature over pastAverage temperature over past10,000 years = 15°C (59°F)10,000 years = 15°C (59°F)
Past Global TemperaturesPast Global TemperaturesPast Global TemperaturesPast Global Temperatures

Temperature change over past 1,000 years
Year
Tem
per
atu
re c
han
ge
(°C
)
1000 1100 1200 1300 1400 1500 1600 1700 1800 1900 2000 2101
-1.0
-0.5
0.0
0.5
1.0
Recent Trends in Global Temperature
Recent Trends in Global Temperature

Average temperature over past 130 yearsAverage temperature over past 130 years
YearYear
Ave
rag
e su
rfac
e te
mp
erat
ure
(°C
)A
vera
ge
surf
ace
tem
per
atu
re (
°C)
18601860 18801880 19001900 19201920 19401940 19601960 19801980 20002000 20202020
13.613.6
13.813.8
14.014.0
14.214.2
14.414.4
14.614.6
14.814.8
15.015.0
Recent Trends in Global Temperature
Recent Trends in Global Temperature

Climate ChangeClimate Change
Past globaltemperatures
Past globaltemperatures
Recent trends in global temperatures
Recent trends in global temperatures

• Radioisotopes in rocks and fossilsRadioisotopes in rocks and fossils• Plankton and radioisotopes in Plankton and radioisotopes in
ocean sedimentsocean sediments• Pollen from lake bottomsPollen from lake bottoms• Ice cores from ancient glaciersIce cores from ancient glaciers• Tree ringsTree rings• Radioisotopes in coralsRadioisotopes in corals• Historical recordsHistorical records• Temperature measurementsTemperature measurements
How do we know what past temperature changes were?
How do we know what past temperature changes were?

The Natural Greenhouse Effect
(tropospheric heating effect)
The Natural Greenhouse Effect
(tropospheric heating effect)

Moist surface warmed by sun
Flows toward low pressure,picks up moisture and heat
Warm,dry air
Hot, wetair
Falls, is compressed, warms Rises, expands, cools
Heat releasedradiates to space
LOWPRESSURE
HIGHPRESSURE
Cool, dryair
Condensationand
precipitation
HIGHPRESSURE
HIGHPRESSURE
LOWPRESSURE
LOWPRESSURE
Natural Cooling Process

Greenhouse Gases in the Largest Concentration
Greenhouse Gases in the Largest Concentration
•Water VaporWater Vapor•Carbon DioxideCarbon Dioxide

Hydrologic (Water) CycleHydrologic (Water) Cycle

The Carbon Cycle (Terrestrial)The Carbon Cycle (Terrestrial)

The Carbon Cycle (Aquatic)The Carbon Cycle (Aquatic)

Greenhouse Gases from Human Greenhouse Gases from Human ActivitiesActivitiesGreenhouse Gases from Human Greenhouse Gases from Human ActivitiesActivitiesGreenhouse GasGreenhouse Gas Average Time Average Time
in the in the TroposphereTroposphere
Relative Relative Warming Warming Potential (COPotential (CO22))
Carbon DioxideCarbon Dioxide 50-120 years50-120 years 11
MethaneMethane 12-18 years12-18 years 2323
Nitrous OxideNitrous Oxide 114-120 years114-120 years 296296
ChloroflorocarbonsChloroflorocarbons 11-20 years11-20 years 900-8,300900-8,300
Hydrochloro-Hydrochloro-flurocarbonsflurocarbons
9-390 years9-390 years 470-2,000470-2,000
HydroflurocarbonsHydroflurocarbons 15-390 years15-390 years 130-12,700130-12,700
HalonsHalons 65 years65 years 5,5005,500
Carbon Carbon TetrachlorideTetrachloride
42 years42 years 1,4001,400

Climate Change and Human ActivitiesClimate Change and Human Activities
1)1) Increased use of fossil fuels (COIncreased use of fossil fuels (CO2 2 ,, CHCH44))
2)2) Deforestation (CODeforestation (CO2 2 ,, NN22O)O)
3)3) Cultivation of Rice Patties (NCultivation of Rice Patties (N22O)O)
Global warmingGlobal warming = = Enhanced greenhouse Enhanced greenhouse effecteffect
1)1) Melting icecaps and glaciersMelting icecaps and glaciers
2)2) Coral reef bleachingCoral reef bleaching
3)3) OtherOther

14.7
14.6
14.5
14.4
14.3
14.2
14.1
14.0
13.9
13.8
Tem
peratu
re (Cº)
Year
1970 1980 1990 2000 2005
380
375
365
355
345
335
325
CO
2 co
nce
ntr
atio
n (
pp
m)
8.4
8.0
7.6
7.2
6.8
6.4
6.0
4.8
5.6
5.2
Fo
ssil
fuel
s b
urn
(bill
ion
s o
f m
etri
c to
ns
of
oil
equ
ival
ent)
CO2
Temperature
Fossil fuels
ConnectionsConnections

Projecting Future Changes in Earth’s ClimateProjecting Future Changes in Earth’s Climate
Climate models(see Spotlight p. 457)
Climate models(see Spotlight p. 457)
Apparent influence of human activities
Apparent influence of human activities
Could be natural changes
Could be natural changes Fig. 18-11 p. 455Fig. 18-11 p. 455

Factors Affecting Changes in Earth’s Average TemperatureFactors Affecting Changes in Earth’s Average Temperature
Changes in solar output
Changes in solar output
Changes in Earth’s albedo
Changes in Earth’s albedo
Moderating effect of oceans
Moderating effect of oceans
Clouds and water vapor
Clouds and water vapor
Air pollution Air pollution


Some Possible Effects of a Warmer World
Some Possible Effects of a Warmer World
• Water Distribution• Plant and Animal Biodiversity Loss• Ocean Currents and Sea Levels• Extreme Weather• Human Population and Health• Agriculture and Forests

Possible EffectsPossible Effects• Melting ice caps & glaciers
– Evidence = retreating glaciers, shrinking ice sheets • Sea Level Rise
– FROM added volumes of freshwater BUT also from thermal expansion – Coastline threats (resulting in population displacement – LA, NYC, Miami)
• Permafrost Decline in tundra regions (microclimate changes)• Δ in Precipitation Patterns
– Frequent drought, rain, snow, flooding– Increased frequency and intensity of storms over warmed surface waters (Katrina)
• Δ in Biology– Migration patterns disrupted , Food web disturbances, Habitat fragmentation (reduced realized niche)
• Human Health – Heat related illness– Disease spread by organisms now with extended range (mosquitos & malaria)
• Agriculture– Sea level rise will impact farmland by flooding coastal regions – Severe Drought

Some Possible Effects of a Warmer World
Some Possible Effects of a Warmer World
Fig. 18-16p. 461
Fig. 18-16p. 461

Solutions?Solutions?
OptionsOptions
Do nothing Do nothing
Do more research Do more research
Act now to reduce risks
Act now to reduce risks
Act now no-regrets strategy
Act now no-regrets strategy
Fig. 18-20 p. 466
Fig. 18-20 p. 466

Removing CO2 From the AtmosphereRemoving CO2 From the Atmosphere
Fig. 18-21p. 467
Treeplantation
Coalpower plant
Tanker deliversCO2 from plantto rig
Oil rig
Crop field Switchgrassfield
Spent oil reservoir isused for CO2 deposit
CO2 is pumpeddown to reservoir through abandoned oil field
Abandonedoil field
CO2 is pumped downfrom rig for Deep ocean disposal
= CO2 deposit
= CO2 pumping

Reducing Greenhouse Gas EmissionsReducing Greenhouse Gas Emissions
• Rio Earth Summit (1992)Rio Earth Summit (1992)– 106 nations106 nations– Scientific uncertainty must not be Scientific uncertainty must not be
used as justification to do nothing.used as justification to do nothing.– Industrialized nations must take lead Industrialized nations must take lead
in slowing down in slowing down raterate and and degreedegree of of global warming.global warming.
– Developed countries Developed countries voluntarily voluntarily committed to reducing COcommitted to reducing CO22 to 1990 to 1990 levels by the year 2000levels by the year 2000

Reducing Greenhouse Gas EmissionsReducing Greenhouse Gas Emissions
• INTERNATIONAL EFFORT
• 1992 Earth Summit
• GOAL stabilize greenhouse gases at low levels to prevent dangerous human influence on climate BUT NO DETAILS!

Reducing Greenhouse Gas EmissionsReducing Greenhouse Gas Emissions
• Kyoto ProtocolKyoto Protocol (1997) (1997)– 161 nations161 nations– Required 38 developed countries to Required 38 developed countries to
cut greenhouse emissions 5.2% below cut greenhouse emissions 5.2% below 1990 levels by 2012..1990 levels by 2012..
– Did Did notnot require developing countries require developing countries to make cuts.to make cuts.
– Allowed emission trading among Allowed emission trading among participating countries.participating countries.
– Was not ratified until 2005Was not ratified until 2005– Approximately 180 participating Approximately 180 participating
countries.countries.

United States did not ratify United States did not ratify Kyoto ProtocolKyoto ProtocolUnited States did not ratify United States did not ratify Kyoto ProtocolKyoto Protocol
1)1) Treaty fails to require emission Treaty fails to require emission reductions from developing reductions from developing countries (81% of worldcountries (81% of world’’s s population)population)
2)2) Economists predicted it would Economists predicted it would have devastating impact on U.S. have devastating impact on U.S. economy and workerseconomy and workers

1997 Kyoto Protocol1997 Kyoto Protocol• GOAL set specific guidelines on reducing greenhouse
emissions
• US initially ratified in 1998
• BUSH withdrew in 2001 due to unacceptable economic burden
• BUSH alternative: voluntary instead of mandatory emission reductions
• OBAMA not focused on ratifying Kyoto as it expires
• Kyoto may be baby step in dealing with global climate change!

Some U.S. CO2 ReductionsSome U.S. CO2 Reductions
• Concern among leaders of some U.S. companies.
• Several major companies have established targets to reduce greenhouse gas emissions by 10-65% from 1990 levels by 2010.
• Automobile companies investing in hybrid gas-electric and fuel cell engines.
• Local governments established programs to reduce greenhouse gas emissions.
• California first state to require a reduction in CO2
emissions from motor vehicles beginning in 2009.

• MITIGATION = to change current efforts to postpone global warming – Alternative Fuel Development – Increase Energy Efficiency
• Energy pricing taxes • Eliminate energy subsidies
– Plant trees to absorb CO2 to act as carbon sinks
– Carbon Management
• capture and preventative release of CO2 from combustion
• store captured CO2 in underground geologic formations, oceans
• unproven technology – Fertilize Ocean with Iron to:
– increase numbers of phytoplankton
– phytoplankton would remove CO2 from water
– CO2 from atm would replace CO2 in water
– Zoo/phytoplankton then die and sink to bottom! • Ecological Effects?
U.S. CO2 ReductionsU.S. CO2 Reductions

US CO2 Reduction StrategiesUS CO2 Reduction Strategies• ADAPTATION = adapt to changing conditions
– Build dikes/levees for sea level rise
(New Orleans, Army COE)– Switch to more tropical crops for farming
(Do you like bananas?)– Upgrade city systems to deal with possible flooding
(Upgrade Infrastructure $$)

A growing number of A growing number of analysts suggest we analysts suggest we should begin to prepare should begin to prepare for the possible effects of for the possible effects of long-term atmospheric long-term atmospheric warming and climate warming and climate change!change!

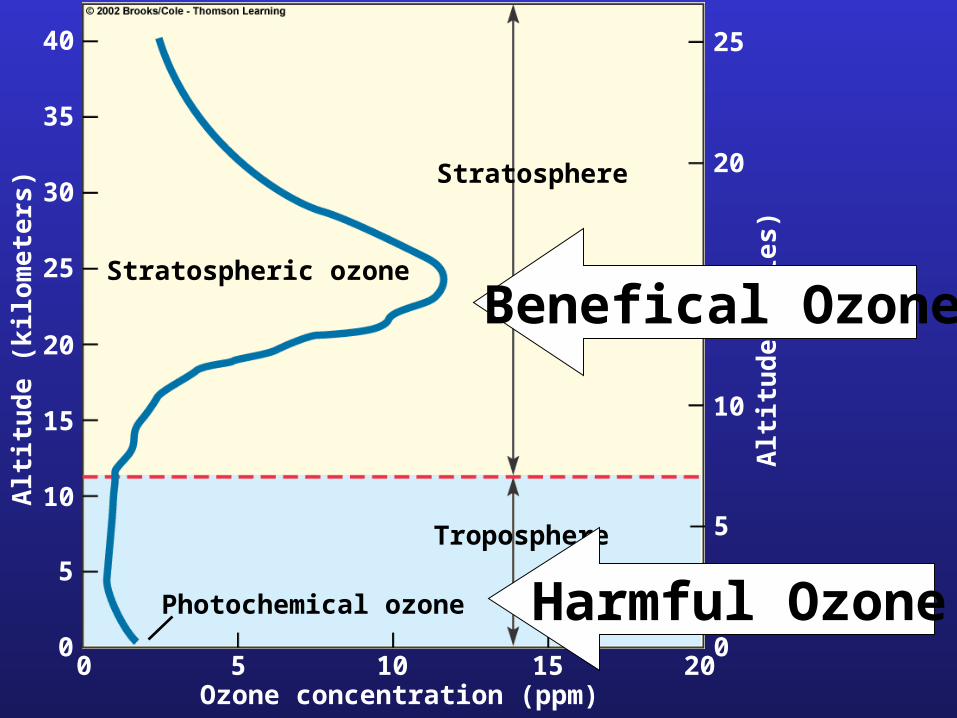
Ozone Depletion in the Ozone Depletion in the StratosphereStratosphere
(the other story)(the other story)
Ozone Depletion in the Ozone Depletion in the StratosphereStratosphere
(the other story)(the other story)
Alt
itu
de
(k
ilom
ete
rs)
Ozone concentration (ppm)
Alt
itu
de
(m
iles)Stratospheric ozone
Stratosphere
Troposphere
40
35
30
25
20
15
10
5
00 5 10 15 20
0
5
10
15
20
25
Photochemical ozone
Benefical Ozone
Harmful Ozone

Ozone Depletion in the StratosphereOzone Depletion in the Stratosphere
Importance of OzoneImportance of Ozone• Essential for terrestrial lifeEssential for terrestrial life• Reduces sunburnReduces sunburn• Prevents tropospheric ozonePrevents tropospheric ozone
Stratospheric Ozone absorbs:
• all UV-C radiation (most energetic, most lethal)
• most UV-B radiation but NO UV-A radiation

Causes of Ozone DepletionCauses of Ozone Depletion• O3 destroyed by CFCs (chloroflourocarbons)
– CFCs used in aerosol propellants, coolants, solvents, insulation/styrofoam, fire retardants
• CFCs & others released into lower atm (troposphere)
• CFCs move/drift upward into stratosphere
• UV radiation breaks apart CFCs releasing Cl
• Sunlight causes chemical reaction allowing Cl to attack O3 O2
• THUS reducing O3 levels

Ozone Depletion in the StratosphereOzone Depletion in the Stratosphere
Fig. 18-26 p. 473Fig. 18-26 p. 473

SunOnce free, the chlorine atom is off to attack another ozone moleculeand begin the cycle again.
A free oxygen atom pulls the oxygen atom off the chlorine monoxide molecule to form O2.
The chlorine atom and the oxygen atom join to form a chlorine monoxide molecule (ClO).
UV radiation
Cl Cl
ClC
F
The chlorine atom attacks an ozone (O3) molecule, pulling an oxygen atom off it and leaving an oxygen molecule (O2).
Cl
Cl
OO
O
Cl
ClO
ClO
OO
OO
Ultraviolet light hits a chlorofluorocarbon (CFC) molecule, such as CFCl3, breaking off a chlorine atom and leaving CFCl2.
O
Fig. 20-18, p. 486
Stepped Art

Ozone Depleting ChemicalsOzone Depleting Chemicals
Chlorofluorocarbons (CFCs)Methyl bromide (fumigant)Halons (fire extinguishers)Carbon tetrachloride (solvent)Methyl chloroform (cleaning
solvent and propellant)N-propyl bromide (solvent)

Effects of Ozone DepletionEffects of Ozone Depletion
EFFECTS of O3 DEPLETION 1. UV radiation reaches surface of Earth 2. Health Problems including skin cancer, cataracts, weak immune systems3. Disrupts ecosystems: phytoplankton production, DNA mutations

OZONE DEPLETION IN THE STRATOSPHEREOZONE DEPLETION IN THE STRATOSPHERE
• During four months of each year up to half of the ozone in the stratosphere over Antarctica and a smaller amount over the Artic is depleted.

Seasonal Thinning at the PolesSeasonal Thinning at the PolesOzone thinning
(hole)Ozone thinning
(hole)Polar vortexPolar vortex
Fig. 18-30 p. 475Fig. 18-30 p. 475

Reasons for ConcernReasons for Concern
Increased incidence and severity of sunburn Increased incidence and severity of sunburn
Increase in eye cataracts Increase in eye cataracts
Increased incidence of skin cancer Increased incidence of skin cancer
Immune system suppression Immune system suppression
Increase in acid deposition Increase in acid deposition
Lower crop yields and decline in productivity Lower crop yields and decline in productivity

Fig. 20-22, p. 489
This long-wavelength(low-energy) form of UV radiation causes aging of the skin, tanning, and sometimes sunburn. It penetrates deeply and may contribute to skin cancer.
This shorter-wavelength (high-energy) formof UV radiation causes sunburn, prematureaging, and wrinkling. It is largely responsiblefor basal and squamous cell carcinomasand plays a role in malignant melanoma.
Epidermis
Squamous Cell Carcinoma
Basal Cell Carcinoma
Melanoma
Sweatgland
Dermis
Squamous cells
Thin layer ofdead cells
Basal layer
Melanocyte cells
Bloodvessels
UltravioletB
UltravioletA
Hair
Basalcell

Reducing Ozone DepletionReducing Ozone Depletion
1987 Montreal Protocol Goals1. 50% reduction in CFC production by 19982. Phase out use of CFCs in developed countries by 19963. Phase out use of CFCs in developing countries by 2005

Solutions: Protecting the Ozone LayerSolutions: Protecting the Ozone Layer
Use CFC substitutes Use CFC substitutes
Montreal Protocol (1987)only CFCs
Montreal Protocol (1987)only CFCs

Characteristics of Global Warming and Ozone Depletion
Characteristics of Global Warming and Ozone Depletion
Global Warming
COCO22, CH, CH44, NO, NOxx (greenhouse gases)(greenhouse gases)
Absorbs infrared (IR) Absorbs infrared (IR) radiationradiation
Raising the earthRaising the earth’’s s surface surface temperaturetemperature
Decrease burning of Decrease burning of fossil fuelsfossil fuels
Ozone Depletion
OO33, O, O22, and CFCs, and CFCs
Absorbs ultraviolet (UV) Absorbs ultraviolet (UV) radiationradiation
Decreasing ODecreasing O33 concentration in the concentration in the stratospherestratosphere
Eliminate CFCsEliminate CFCs

2007 FRQ #3 2007 FRQ #3