Embed Size (px)
Citation preview
Climate Change and Pastoralism: Traditional Coping Mechanisms and Conflict in
the Horn of Africa
Edited by Mulugeta Gebrehiwot Berhe and Jean-‐Bosco Butera
AAU Logo
Institute for Peace and Security Studies, Addis Ababa University and
University for Peace, Africa Programme Addis Ababa, Ethiopia
Cover photo: © Above: Flickr by Hello Hillary; Below: UNEP NEWS CENTRE
Copyright © 2012 Institute for Peace and Security Studies and University for Peace Design by: View Graphics //www.viewgraphicsandprinting.com All rights reserved. The views expressed in this book are those of the authors. They do not necessarily reflect the views of the Institute for Peace and Security or the University for Peace.
ISBN 978 9977 925 769
To order copies of this book please contact: [email protected]
Printed@Eclipse 011 850 12 64
Preface
The countries in the Horn of Africa, a region known for being a conflict hotspot, are actively engaged in finding lasting solutions to regional conflict and fostering sustainable development, as a fundamental part of human security. The causes of these conflicts range from governance constraints, colonial legacy, post-election violence, over ethnic- and clan conflict to competition for resources. These are just some of the challenges pertaining to the region. Conflict stands in the way of development and progress to take root in the region and it must be addressed in order for the region to prosper, and for the nurturing of human security and development and secure rights for its peoples.
The Institute for Peace and Security Studies (IPSS) was established in 2007 to augment better understanding of conflict in the Horn of Africa, in particular, and the continent, in general. The objectives of IPSS are to enhance excellence in research and the teaching and learning of peace and conflict issues, to educate society about peace, and to serve as a think tank for actors keen to promote peace and security in the region. The Royal Embassy of Denmark to Ethiopia has been a partner of IPSS from the beginning, both financially and, equally importantly, in spirit, and has commended the work of IPSS as an Institute and as a focal point for peace and security work in the region.
The Institute has already achieved significant outcomes in its short life. It has graduated four cohorts of graduate students and conducted a series of short courses for participants from various sectors of Ethiopian society. And recently IPSS launched a PhD programme, further strengthening and consolidating its research base. IPSS also cooperates with a range of institutions to strengthen networks and its ability to act as a centre of excellence on issues of peace and security in the region. The Embassy hopes that the work of IPSS will contribute towards the development of a research community, which will work to better understand the cause of conflict and ways to prevent it.
This book is a step in this direction. The adverse impacts of climate change are predicted to severely constrain the lives and livelihoods of Africans. Pastoralists are among the most vulnerable population groups. Considering the fact that the Horn of Africa has a large concentration of pastoral communities and that pastoralist conflicts are rife in the region, many fear that climate change-induced scarcity will increase the incidence and severity of pastoral conflicts during the coming decades.
V
Research into this phenomenon will assist all actors, for example, policymakers, academics, and civil society organisations, to make better, more informed decisions on how to approach the enhancement of peace and security in the Horn of Africa. We hope that this book will contribute to this goal.
Pernille Dahler KardelAmbassador, Royal Danish Embassy in Addis Ababa, Ethiopia
Vi
Ambassador, Royal Danish Embassy in Addis Ababa, Ethiopia
Acknowledgements
The idea of engaging in this research project was conceived during our visit at the Danish Institute for International Studies (DIIS) in November 2010. The visit aimed to establish a scientific partnership with the DIIS. Our thanks go to Professor Moller (currently a Professor at Aalborg University) for his valuable insights during the inception of the research project. The financial support of the Royal Danish Embassy in Addis Ababa was crucial to the undertaking of the research, the organization of the international conference and publication of this book.
We also want to specifically acknowledge the support of Ambassador Pernille for sharing with us her insights on the research topic, both during the inception of the project and later during the international conference. This is over and above the flexible and responsive financial administration her staff provided to the project. We also thank the Inter-Governmental Authority on Development (IGAD) for honouring us by its presence during the international conference.
The project was undertaken in two phases: the first commenced with desk research and culminated in a three-day international conference conducted at the Desalegn Hotel, Addis Ababa, 1-3 September 2011; the second phase consisted of efforts to select the best papers for publication in this volume from the 22 presented during the conference.
The role played by Dr. Asnake Kefale and Mr. Fana Gebresenbet in the first phase was crucial for the success of the project. They conducted the desk research, solicited papers from a wide network of researchers and established a panel that selected abstracts for presentation, not to mention their contribution to the flawless organization of the conference.
Asnake and Fana were assisted by a number of individuals during the organization and running of the conference. We would like to thank the following individuals for their support (in alphabetical order): Mr. Bealem Amdissa, Mrs. Rahel Getachew, Mrs. Samrawit Tesfaye, Ms. Seble Mulugeta, Mr. Tewodros Assefa, and Ms. Tsega Desta. The conference report was prepared by Mr. Fana Gebresenbet, Ms. Grace Atim and Ms. Tsega Desta.
Dr. Mesfin Gebremichael and Mr. Fana Gebresenbet coordinated tasks pertaining to the second phase. Each paper was reviewed by two academics with relevant research experience. We used inputs from these anonymous reviewers to select the 15 papers included in this edited volume.
We thank Miss Judy Wall for her excellent language editing and for making the papers easily readable. Fana undertook the scientific and desktop editing of all the contributions.
Vii
We would also like to take this opportunity to thank the authors of the papers for bearing patiently with us during the long editorial process and responding to our, sometimes hair-splitting, comments and corrections. We hope that their and our efforts have paid off and that you will find this book interesting, informative and useful in your future engagements.
Editors
Mulugeta Gebrehiwot Berhe and Jean-Bosco Butera
Viii
Xi
Table of Contents
Preface ...........................................................................................................v
Acknowledgments ......................................................................................... vii
List of Acronyms ........................................................................................... ix
Introduction Mulugeta Gebrehiwot Berhe and Jean-Bosco Butera ..............................................................................................1
Theme 1: Evidence for and Vulnerability to Climate Change in the Horn of Africa
Historical Review of Pastoralism and Climate Change in the Horn of Africa, with special Emphasis on Ethiopia Mohammed Umer and Agazi Negash ......................................................................................................................11
Potential Tool to Support Climate Change Research in Karamoja, Uganda: Historical Month Names and MeaningsSagal Joshua Mark and Jean T. Gradé ............................................................................. 34
Climate Security and East Africa: A GIS-Based Analysis of Vulnerability Joshua W. Busby, Todd G. Smith, and Kaiba L. White ...........................................................................................56
Pastoralist Cultural Responses to Climate Variations Potentially Contributing to Drought Conditions in Northern KenyaRussell F. Schimmer, Roland A. Geerken, and Yancey A. Orr ................................................................................88
Theme 2: Coping with the Adverse Impacts of Climate Change through Traditional Means
Discrepancies between Traditional Coping Mechanisms to Climate Change and Government Intervention in South Omo, EthiopiaAsnake Kefale and Fana Gebresenbet .....................................................................................................................123
A Traditional Coping Mechanism towards Climate ChangeJean T. Gradé ............................................................................................................................................................153
Averting the Tragedy of Commons in Visage of Climatic Change: Forest Resources Management in Western Kenya in Facade of Mounting Pastoral MigrationsFredrick Kisekka-Ntale ............................................................................................ 177
Xii
Theme 3: Government Intervention and Adaptation to Climate Change in the Horn of Africa
Unexpected Consequences of Formal Education in Pastoralist Society: Loss of Traditional Knowledge and Practices for Coping with Climate ChangeMartha Wagar Wright ...............................................................................................................................................207
Pastoralism and Climate Change in the Horn of Africa: Comparative Review of Policies and National Adaptation Programs of ActionYohannes Aberra Ayele ............................................................................................................................................231
Aspects of Climate Change, Adaptation Strategies and Information Sharing in the Nile BasinTesfaye Tafesse ..................................................................................................... 251
Fighting in the Rain: Monthly Rainfall Extremes and Social Unrest in AfricaTodd G. Smith ..........................................................................................................................................................271
Wario R. Adano .................................................................................................... 307
Paul Omondi ............................................................................................................................................................328
Inter-Ateker Discord: The Case of the Nyangatom and the TurkanaGebre Yntiso ....................................................................................................... 351
of Africa: The Case of IGAD/CEWARN Yonas Ashine ............................................................................................................................................................375
Preparing for adverse impacts of climate change in pastoral areas: The way forwardJean-Bosco Butera and Mulugeta Gebrehiwot Berhe ..............................................................................................399
Short Biographies of Authors ........................................................................ 403
Index ............................................................................................................. 407

Climate Change and Pastoralism
56
Climate Security and East Africa: A GIS-Based Analysis of Vulnerability
Joshua W. Busby, Todd G. Smith, and Kaiba L. White
Abstract
The 2011 famine in Somalia and the broader drought in the region raised challenging questions about what made the region vulnerable to climate-related hazards and whether climate change was responsible for the underlying drought affecting the region. By drawing on an on-going research project to map chronic climate security vulnerability in Africa, this paper seeks to contribute to the first question, about understanding the sources of vulnerability. This paper develops the idea of climate security vulnerability; the potential for large numbers of people to be put at risk of death from exposure to climate-related hazards. This paper applies a continent-wide model of climate security vulnerability to East Africa and identifies the hot spots of concern, based on the confluence of physical exposure, population, household and community resilience, and governance and political violence. We found that large parts of South Sudan, notably in Warrap and Jonglei states, and southern Somalia, the area affected by famine in 2011, are the most vulnerable. Other smaller pockets of high vulnerability are also noticeable in western Ethiopia, Eritrea, Burundi, and the Karamoja triangle area of Uganda, Sudan, Kenya and Ethiopia. Our maps of water scarcity, based largely on data of past droughts and precipitation variability, are compared to preliminary findings of a mid-21st century climate projection. Most notably, we find parts of southern Somalia are projected to be vulnerable in the future and have historically faced severe droughts and water scarcity. Finally, we discuss the policy implications of our findings and include an overlay of World Bank and African Development Bank active projects in the region on our vulnerability maps. These suggest that foreign assistance dollars from these institutions have been directed to areas with better governance and lower overall vulnerability, rather than highly vulnerable areas like Somalia and South Sudan.
1. Introduction
In summer 2011, in the wake of a crippling drought, the world witnessed the worst humanitarian crisis to affect the Horn of Africa in two decades. Failed rains across two agricultural cycles in late 2010 and early 2011 led to crop failures, loss of grazing areas, and constricted drinking water supplies. Together with rising food prices, agro-pastoralist communities across the arid Horn ran down their food reserves and lacked the resources to purchase sufficient food to feed their families. Pastoralists faced significant loss of livestock.
Fighting in the Rain: Monthly Rainfall Extremes and Social Unrest in Africa
Todd G. Smith1
Abstract
Over the past two decades, studies in the environmental security literature have examined the relationship between rainfall variation and conflict outcomes in an attempt to better understand potential future consequences of climate change on political stability. The literature, however, has yet to converge on a consensus about the nature of the relationship or the causal pathways involved. Case-based studies have presented several potential mechanisms but lacked generalizability while empirical studies have focused almost exclusively on international or civil war onset as the dependent variable to the exclusion of other types of conflict. In this paper I advance the literature in two significant ways. First, using the newly released Social Conflict in Africa Dataset (SCAD), I broaden the commonly used definition of conflict to include strikes, riots, demonstrations and communal conflict, both violent and non-violent. Second, I use deviations in monthly rainfall patterns as the independent variable rather than annual aggregates as used by earlier empirical studies. This is more appropriate because: (1) climate scientists predict increased intra-annual rainfall variability and more frequent extreme events – droughts and floods; and (2) changes in historically established rainfall patterns can negatively affect agricultural productivity in African countries reliant on rain-fed agriculture. I find that, on the continental scale, receiving overly abundant rainfall in a given month significantly and substantially increases the likelihood of social conflict, but receiving too little rain does not seem to have such an effect, at least in the short-term. When the analysis is limited to the nine countries of IGAD and EAC, the significant effect of too much rain disappears and receiving too little rain actually reduces the likelihood of unrest. I argue that receiving too much or too little rain leads to conflict through distinctly different causal mechanisms. Additional research using this approach complemented by case study investigations is needed to illuminate causal mechanisms between rainfall variability and conflict.
1. Introduction
The dramatic political tumult in Tunisia, Egypt and Libya in early 2011 has quite clearly demonstrated how social or political unrest can be politically destabilizing and can quickly spread throughout an entire region. While decades of political repression undoubtedly created conditions ripe for revolution, worsening economic conditions in the recent past clearly played an important role in triggering the
1 This material is based upon work supported by, or in part by, the U. S. Army Research Laboratory and the U. S. Army Research Office under contract/grant number W911NF-09-1-0077. *
*
Evidence for and vulnerability to climate change
57
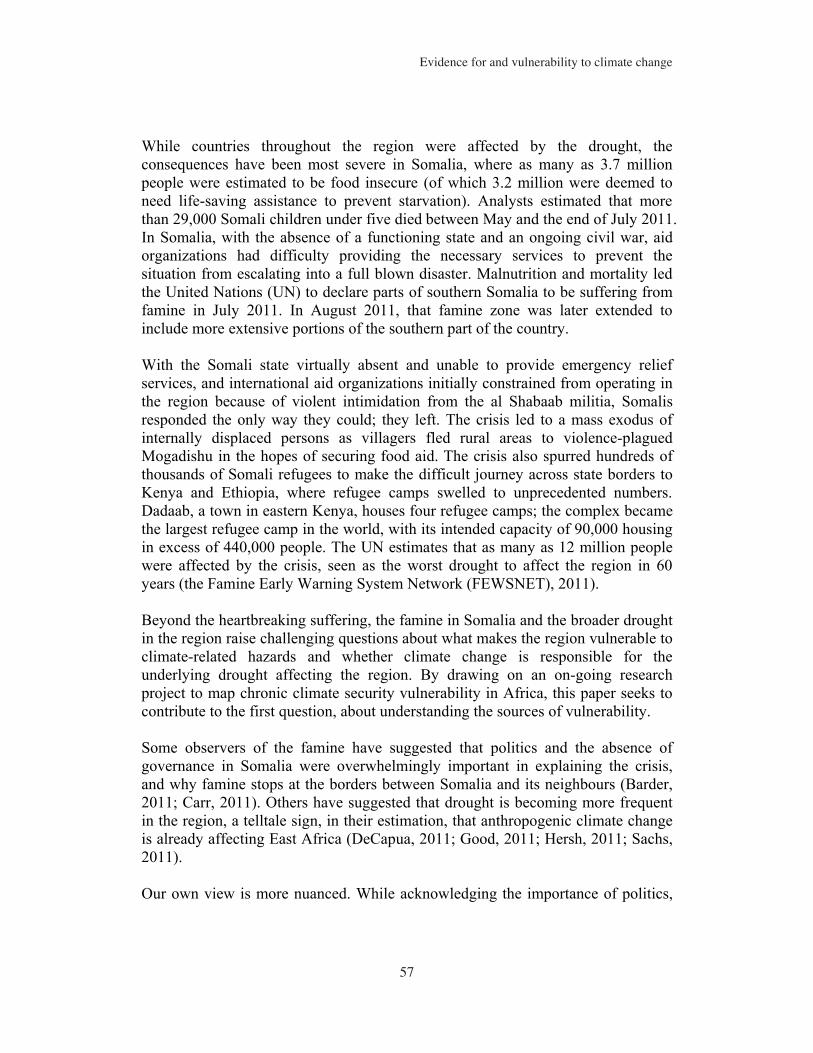
While countries throughout the region were affected by the drought, the consequences have been most severe in Somalia, where as many as 3.7 million people were estimated to be food insecure (of which 3.2 million were deemed to need life-saving assistance to prevent starvation). Analysts estimated that more than 29,000 Somali children under five died between May and the end of July 2011. In Somalia, with the absence of a functioning state and an ongoing civil war, aid organizations had difficulty providing the necessary services to prevent the situation from escalating into a full blown disaster. Malnutrition and mortality led the United Nations (UN) to declare parts of southern Somalia to be suffering from famine in July 2011. In August 2011, that famine zone was later extended to include more extensive portions of the southern part of the country.
With the Somali state virtually absent and unable to provide emergency relief services, and international aid organizations initially constrained from operating in the region because of violent intimidation from the al Shabaab militia, Somalis responded the only way they could; they left. The crisis led to a mass exodus of internally displaced persons as villagers fled rural areas to violence-plagued Mogadishu in the hopes of securing food aid. The crisis also spurred hundreds of thousands of Somali refugees to make the difficult journey across state borders to Kenya and Ethiopia, where refugee camps swelled to unprecedented numbers. Dadaab, a town in eastern Kenya, houses four refugee camps; the complex became the largest refugee camp in the world, with its intended capacity of 90,000 housing in excess of 440,000 people. The UN estimates that as many as 12 million people were affected by the crisis, seen as the worst drought to affect the region in 60 years (the Famine Early Warning System Network (FEWSNET), 2011).
Beyond the heartbreaking suffering, the famine in Somalia and the broader drought in the region raise challenging questions about what makes the region vulnerable to climate-related hazards and whether climate change is responsible for the underlying drought affecting the region. By drawing on an on-going research project to map chronic climate security vulnerability in Africa, this paper seeks to contribute to the first question, about understanding the sources of vulnerability.
Some observers of the famine have suggested that politics and the absence of governance in Somalia were overwhelmingly important in explaining the crisis, and why famine stops at the borders between Somalia and its neighbours (Barder, 2011; Carr, 2011). Others have suggested that drought is becoming more frequent in the region, a telltale sign, in their estimation, that anthropogenic climate change is already affecting East Africa (DeCapua, 2011; Good, 2011; Hersh, 2011; Sachs, 2011).
Our own view is more nuanced. While acknowledging the importance of politics,
Fighting in the Rain: Monthly Rainfall Extremes and Social Unrest in Africa
Todd G. Smith1
Abstract
Over the past two decades, studies in the environmental security literature have examined the relationship between rainfall variation and conflict outcomes in an attempt to better understand potential future consequences of climate change on political stability. The literature, however, has yet to converge on a consensus about the nature of the relationship or the causal pathways involved. Case-based studies have presented several potential mechanisms but lacked generalizability while empirical studies have focused almost exclusively on international or civil war onset as the dependent variable to the exclusion of other types of conflict. In this paper I advance the literature in two significant ways. First, using the newly released Social Conflict in Africa Dataset (SCAD), I broaden the commonly used definition of conflict to include strikes, riots, demonstrations and communal conflict, both violent and non-violent. Second, I use deviations in monthly rainfall patterns as the independent variable rather than annual aggregates as used by earlier empirical studies. This is more appropriate because: (1) climate scientists predict increased intra-annual rainfall variability and more frequent extreme events – droughts and floods; and (2) changes in historically established rainfall patterns can negatively affect agricultural productivity in African countries reliant on rain-fed agriculture. I find that, on the continental scale, receiving overly abundant rainfall in a given month significantly and substantially increases the likelihood of social conflict, but receiving too little rain does not seem to have such an effect, at least in the short-term. When the analysis is limited to the nine countries of IGAD and EAC, the significant effect of too much rain disappears and receiving too little rain actually reduces the likelihood of unrest. I argue that receiving too much or too little rain leads to conflict through distinctly different causal mechanisms. Additional research using this approach complemented by case study investigations is needed to illuminate causal mechanisms between rainfall variability and conflict.
1. Introduction
The dramatic political tumult in Tunisia, Egypt and Libya in early 2011 has quite clearly demonstrated how social or political unrest can be politically destabilizing and can quickly spread throughout an entire region. While decades of political repression undoubtedly created conditions ripe for revolution, worsening economic conditions in the recent past clearly played an important role in triggering the
1 This material is based upon work supported by, or in part by, the U. S. Army Research Laboratory and the U. S. Army Research Office under contract/grant number W911NF-09-1-0077.
Climate Change and Pastoralism
58
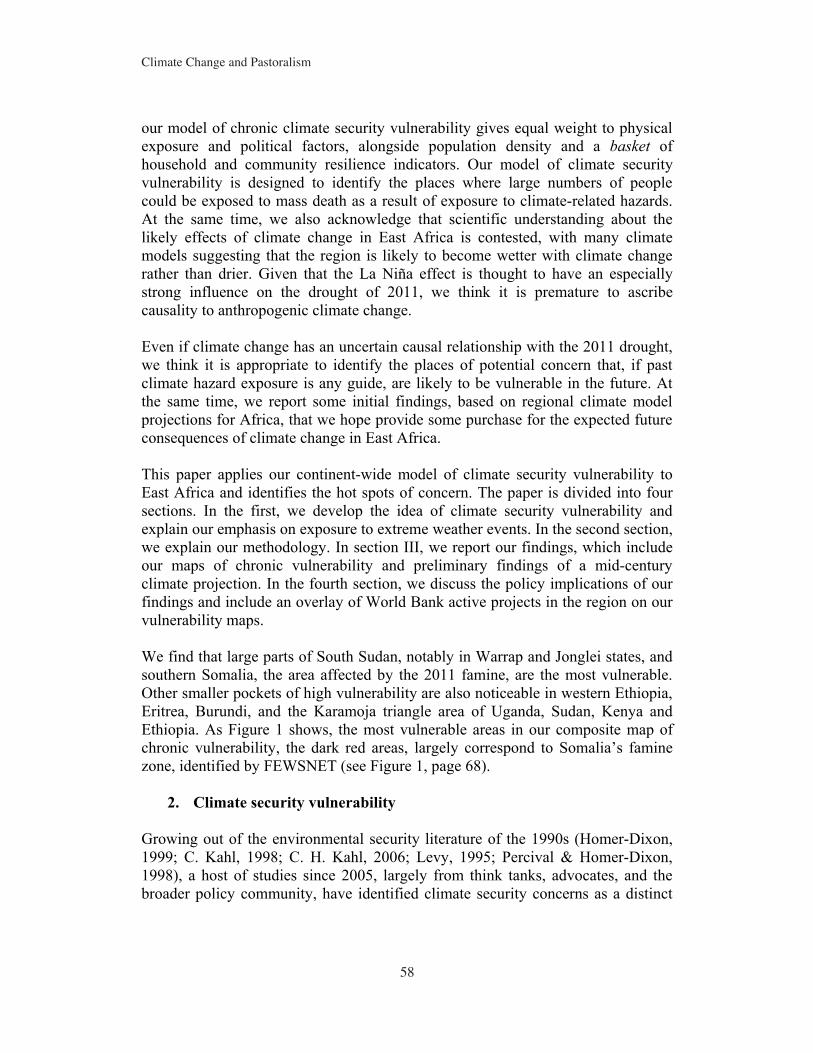
our model of chronic climate security vulnerability gives equal weight to physical exposure and political factors, alongside population density and a basket of household and community resilience indicators. Our model of climate security vulnerability is designed to identify the places where large numbers of people could be exposed to mass death as a result of exposure to climate-related hazards. At the same time, we also acknowledge that scientific understanding about the likely effects of climate change in East Africa is contested, with many climate models suggesting that the region is likely to become wetter with climate change rather than drier. Given that the La Niña effect is thought to have an especially strong influence on the drought of 2011, we think it is premature to ascribe causality to anthropogenic climate change.
Even if climate change has an uncertain causal relationship with the 2011 drought, we think it is appropriate to identify the places of potential concern that, if past climate hazard exposure is any guide, are likely to be vulnerable in the future. At the same time, we report some initial findings, based on regional climate model projections for Africa, that we hope provide some purchase for the expected future consequences of climate change in East Africa.
This paper applies our continent-wide model of climate security vulnerability to East Africa and identifies the hot spots of concern. The paper is divided into four sections. In the first, we develop the idea of climate security vulnerability and explain our emphasis on exposure to extreme weather events. In the second section, we explain our methodology. In section III, we report our findings, which include our maps of chronic vulnerability and preliminary findings of a mid-century climate projection. In the fourth section, we discuss the policy implications of our findings and include an overlay of World Bank active projects in the region on our vulnerability maps.
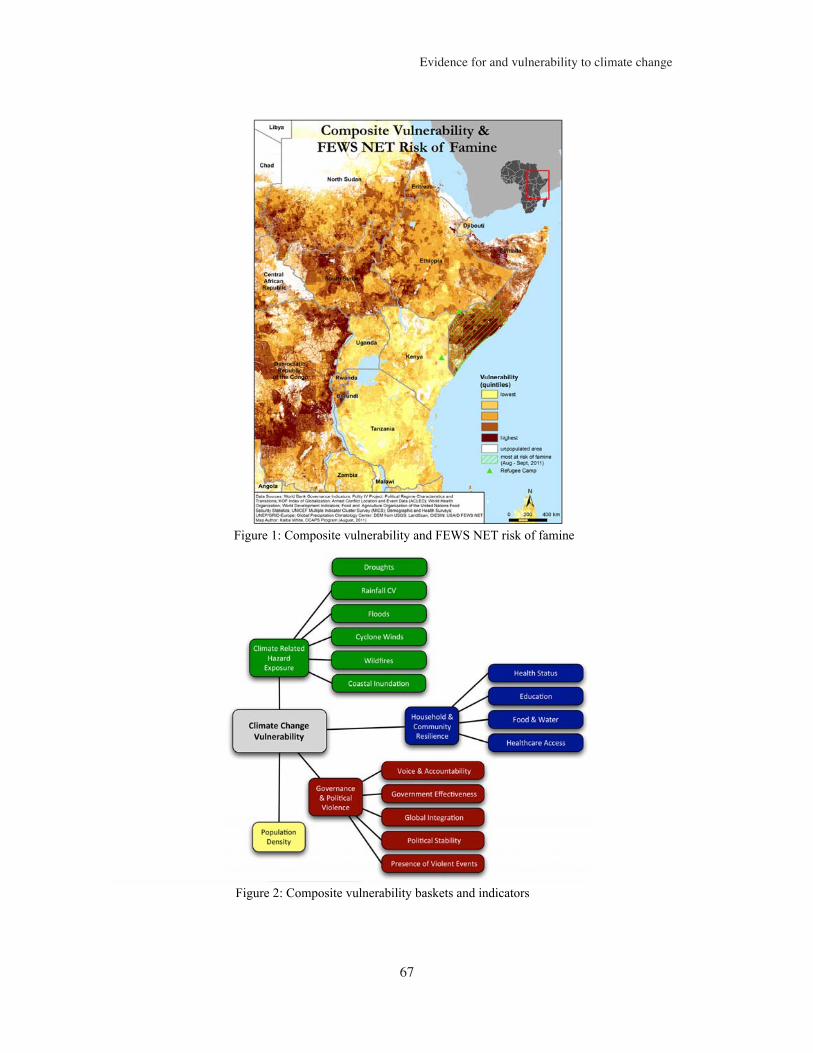
We find that large parts of South Sudan, notably in Warrap and Jonglei states, and southern Somalia, the area affected by the 2011 famine, are the most vulnerable. Other smaller pockets of high vulnerability are also noticeable in western Ethiopia, Eritrea, Burundi, and the Karamoja triangle area of Uganda, Sudan, Kenya and Ethiopia. As Figure 1 shows, the most vulnerable areas in our composite map of chronic vulnerability, the dark red areas, largely correspond to Somalia’s famine zone, identified by FEWSNET (see Figure 1, page 68).
2. Climate security vulnerability
Growing out of the environmental security literature of the 1990s (Homer-Dixon, 1999; C. Kahl, 1998; C. H. Kahl, 2006; Levy, 1995; Percival & Homer-Dixon, 1998), a host of studies since 2005, largely from think tanks, advocates, and the broader policy community, have identified climate security concerns as a distinct
Evidence for and vulnerability to climate change
59
issue, with weather-related effects of climate change—droughts, floods, storms, and cyclones—contributing to dislocation and migration, competition over scarce resources, and, in turn, functioning as a “threat multiplier,” that could increase the risks of conflict and even state failure. This grey literature has run ahead of academia with recommendations, (Campbell et al., 2007; CNA Corporation, 2007; Fingar, 2008; Herman & Treverton, 2009; High Representative and the European Commission to the European Council, 2008; Podesta & Ogden, 2008; Solana, 2008; UN Security Council, 2007; WBGU, 2007) even as the scholarly community has questioned whether or not climate change is associated with the increased likelihood of civil conflict (Gleditsch, Nordås, & Salehyan, 2007; Nordås & Gleditsch, 2009; Raleigh, Jordan, & Salehyan, 2008; Salehyan, 2008).
Most of the scholarly work in this arena relies on quantitative data on historic rainfall, drought, or storm patterns and seeks to ascertain whether climate phenomena are correlated with the increased frequency or onset of violent conflict, controlling for other factors (Buhaug, 2010; Buhaug, et al., 2008a; Burke, et al., 2009; Hendrix & Glaser, 2007; Levy, et al., 2005). To date, the findings of this literature have been mixed and somewhat disappointing, in part because of the lack of adequate data (Buhaug, et al., 2008b; Busby, 2009a, 2009b). More importantly, by focusing on the links between climate change and conflict, the academic community has narrowed its conception of security to lose sight of more pressing and imminent threats posed by extreme weather events like the on-going drought in East Africa. Extreme weather events already pose a security challenge for which both national governments and the international community need to prepare. Extreme weather events—such as Hurricane Katrina, cyclone Nargis, Pakistan’s floods of 2010, and Australia’s of 2011—require the mobilisation of militaries for humanitarian relief.1 If scientists are right that climate change will deliver more numerous and/or more severe events like these, (Intergovernmental Panel on Climate change (IPCC), 2007a) then governments will increasingly need to divert attention from urgent war-fighting efforts or from protecting the homeland to address these sorts of events (Busby, 2007, 2008).
Can scholars of security studies, who typically seek to explain past patterns of conflict and violence, offer any insight on how to identify areas of potentialconcern? By coupling innovative geospatial mapping techniques with insight about governance and political violence, we have developed an approach to map sub-
1 Scientists continue to debate whether anthropogenic climate change had anything to do with these particular events. Large concentrations of people and infrastructure concentrated on coasts or along rivers in environmentally degraded locations indubitably transformed such weather episodes into human disasters. Even if the science of attribution of specific events remains unproven, and the likely regional consequences of climate change remain uncertain, the expectations in the aggregate are clear: climate change should yield a world of more extreme weather events (Ananthaswamy, 2010; Curry, 2011; Lehmann, 2011; Pielke Jr., 2011; Tebaldi, 2010).
Climate Change and Pastoralism
60
national security vulnerability to climate change, defined as situations in which large numbers of people are put at risk of mass death as a result of climate related phenomena. Our approach is based on the recognition that security vulnerability is about more than physical exposure to climate hazards. It is a function of other contributing factors, including demographics, household and community resilience, and governance and political violence. This approach offers a way to identify “hot spots” of concern at a sub-national level, enabling scholars to focus on these areas for further case study investigation and for national governments and the international community to prioritise resources accordingly (Friedman, 2010).
We emphasise the potential security consequences of climate change, including but not limited to conflict, to encompass situations where weather-related phenomena put large numbers of people at risk of mass death. The security focus makes our work different than the United Nations International Strategy for Disaster Reduction (UNISDR), which focuses on mortality and economic losses from disasters (UNISDR, 2009). We are especially interested in the impact of climate related hazards where physical exposure, compounded by other sources of vulnerability, will likely put large numbers of people at risk of death and suffering, which local emergency rescue personnel cannot cope with. In those instances, emergency relief will often require the mobilisation of domestic and foreign militaries. In some cases, such crises will make internal conflict more likely and contribute to other potential security outcomes of interest, including internal and international migration.
Even before the famine of 2011, Africa had been buffeted by a number of climate related weather events over the previous decade that were, in damages and lost lives, severe enough to qualify as disasters. In the period 1999-2010, climate related weather “disasters” in Africa, according to the Emergency Events database (EM-DAT), killed more than 12,500 people, made homeless 2.8 million, and affected in the order of 190 million people (Centre For Research on the Epidemiology of Disasters (CRED), 2011). Of these, a significant share of deaths (30%), people made homeless (36.5%), and affected populations (52.2%), occurred in East Africa, defined for the purposes of this study as the eleven countries comprising the regional groups, the Intergovernmental Authority on Development (IGAD) and the East African Community (EAC). These include Burundi, Djibouti, Eritrea, Ethiopia, Kenya, Rwanda, Somalia, South Sudan, Sudan, Tanzania, and Uganda.
Though a number of high profile “disaster” events of all kinds in the 2000s were located outside Africa—such as the 2004 Asian tsunami, the 2010 Haitian earthquake, the 2010 Pakistani floods—Africa typically received a large percentage of resources from bilateral donors and the international community for disaster assistance. Between fiscal year 2000 and 2009, the U.S. government allocated
Evidence for and vulnerability to climate change
61
more than 58% of its total humanitarian funding for disasters to Africa ($14.6 billion of $25.3 billion in constant 2009 dollars), with a significant share of these funds dedicated to East Africa, particularly to Sudan, Ethiopia, and Somalia.2 For example, in fiscal year (FY) 2009, of the more than $2.1bn the U.S. government spent on disaster relief in Africa, nearly 70% was directed to East Africa, with more than 40% of the total directed to Sudan and another 16% to Ethiopia. East Africa also commanded more than 70% of U.S. humanitarian funding in FYs 2005, 2006, 2007, and 2008 (USAID-OFDA, 2010).
Our approach ranks locations within Africa in terms of their relative security vulnerability to climate change. The vulnerability rankings are relative to other African countries rather than the entire globe. Thus, countries and localities exhibiting low relative vulnerability within Africa may still be highly vulnerable to climate change, compared to the world as a whole. The challenges posed by climate change are not uniformly distributed within East Africa. In order to identify areas of security vulnerability and prioritise limited resources, it is not sufficient to say “Ethiopia is vulnerable” without explaining which parts of Ethiopia are particularly vulnerable and for what reasons. In the next section, we explain our methodology more fully.
3. Methodology
The consequences of climate change are likely to emerge based on the confluence of various forms of vulnerabilities.3 We consider four broad processes important in an area’s overall total vulnerability to the security-related consequences of climate change. They are:
Climate Related Hazard Exposure: First, at a minimum, areas must be physically exposed to climate related hazards to be considered vulnerable. Population Density: Second, policymakers are generally more concerned about places where people live. Therefore, all else being equal, more
2 Within that total, 65% of USAID’s Office of Foreign Disaster Assistance (OFDA) funding was spent in Africa (about $2.45 billion of $3.8 billion in constant 2009 dollars). This expenditure included spending on complex emergencies, particularly for Darfur (which may have some relation to historic drought conditions). Exclusively climate related disasters accounted for about 12% of OFDA’s total (excluding complex emergencies but including floods, droughts, fires, winter emergencies, typhoons and food security). The Department of Defense (DoD) assists in about 10% of the overseas’ disaster emergencies. Between FY 2005 and 2010, the Joint Staff in the DoD estimated the DoD assisted in 30 disasters, 21 of which were weather related, though only one was in Africa (the Algerian floods of FY 2006). This estimate does not, however, include additional efforts by the Combatant Commands (Office of Partnership Strategy and Stability Operations (PSO), 2010; USAID-OFDA, 2010). 3 This section builds on our previous research in Busby, et al. (2010).
Climate Change and Pastoralism
62
densely populated areas that are highly exposed to climate related hazards tend to command more attention from decision-makers. Household and Community Resilience. Third, the first line of defence for many people will be what resources they have at the household and community level to protect themselves from physical hazards and enable them to respond in the event of climate related emergencies like floods, droughts, or storms. Communities where many people are sick and have inadequate access to health care and basic amenities are likely to be less resilient than those that are healthier and have greater access to services. Where people are poorly educated, they may have fewer entrepreneurial skills to avoid those hazards or minimize their effects. Governance and Political Violence: Fourth, weather emergencies frequently exceed the ability of local communities and emergency services to respond adequately, requiring national level mobilisation to rescue people from rising waters or from being trapped under rubble and to provide food, water, and shelter for people left homeless or otherwise affected by extreme weather events. Countries with poor or unstable governance, however, may be less able or even unwilling to provide such services, especially in areas with a history of political violence. Venal and incompetent governments can transform even small physical effects, like the modest drought in Somalia in the early 1990s, into major humanitarian disasters. Failing a national response, the international community—i.e. foreign militaries, humanitarian relief agencies, and Diaspora communities—may marshal resources to respond. Some countries, however, can be difficult places for these actors to operate. Many international organizations withdrew from Somalia in the 1990s and insecurity in some regions continues to be a challenge for many relief agencies. Foreign journalists have been severely restricted in Eritrea and the international community may be unaware of emerging humanitarian crises in the country. Places with a history of violence may be more difficult to deliver services to and may have additional localised governance challenges.
Our operating assumption is that the most vulnerable places are likely to be those where high physical exposure to climate related hazards conjoins with high population density, low levels of household and community health and education, and poor governance and widespread political violence.
Each of these four baskets—physical exposure, population density, household and community resilience, and governance and political violence—is represented in our maps by observable and measurable indicators. In all but the population density basket, multiple indicators have been selected to represent the basket. We selected these particular indicators based on review of the existing literature, with some
Evidence for and vulnerability to climate change
63
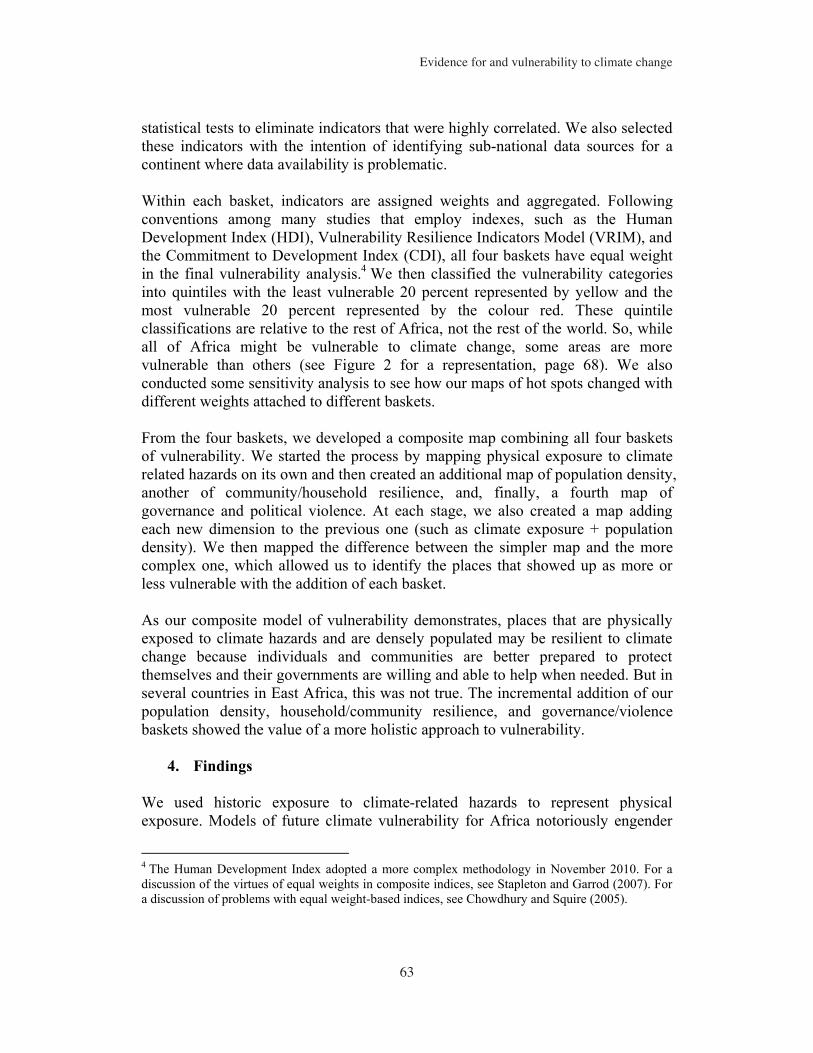
statistical tests to eliminate indicators that were highly correlated. We also selected these indicators with the intention of identifying sub-national data sources for a continent where data availability is problematic.
Within each basket, indicators are assigned weights and aggregated. Following conventions among many studies that employ indexes, such as the Human Development Index (HDI), Vulnerability Resilience Indicators Model (VRIM), and the Commitment to Development Index (CDI), all four baskets have equal weight in the final vulnerability analysis.4 We then classified the vulnerability categories into quintiles with the least vulnerable 20 percent represented by yellow and the most vulnerable 20 percent represented by the colour red. These quintile classifications are relative to the rest of Africa, not the rest of the world. So, while all of Africa might be vulnerable to climate change, some areas are more vulnerable than others (see Figure 2 for a representation, page 68). We also conducted some sensitivity analysis to see how our maps of hot spots changed with different weights attached to different baskets.
From the four baskets, we developed a composite map combining all four baskets of vulnerability. We started the process by mapping physical exposure to climate related hazards on its own and then created an additional map of population density, another of community/household resilience, and, finally, a fourth map of governance and political violence. At each stage, we also created a map adding each new dimension to the previous one (such as climate exposure + population density). We then mapped the difference between the simpler map and the more complex one, which allowed us to identify the places that showed up as more or less vulnerable with the addition of each basket.
As our composite model of vulnerability demonstrates, places that are physically exposed to climate hazards and are densely populated may be resilient to climate change because individuals and communities are better prepared to protect themselves and their governments are willing and able to help when needed. But in several countries in East Africa, this was not true. The incremental addition of our population density, household/community resilience, and governance/violence baskets showed the value of a more holistic approach to vulnerability.
4. Findings
We used historic exposure to climate-related hazards to represent physical exposure. Models of future climate vulnerability for Africa notoriously engender
4 The Human Development Index adopted a more complex methodology in November 2010. For a discussion of the virtues of equal weights in composite indices, see Stapleton and Garrod (2007). For a discussion of problems with equal weight-based indices, see Chowdhury and Squire (2005).
Climate Change and Pastoralism
64
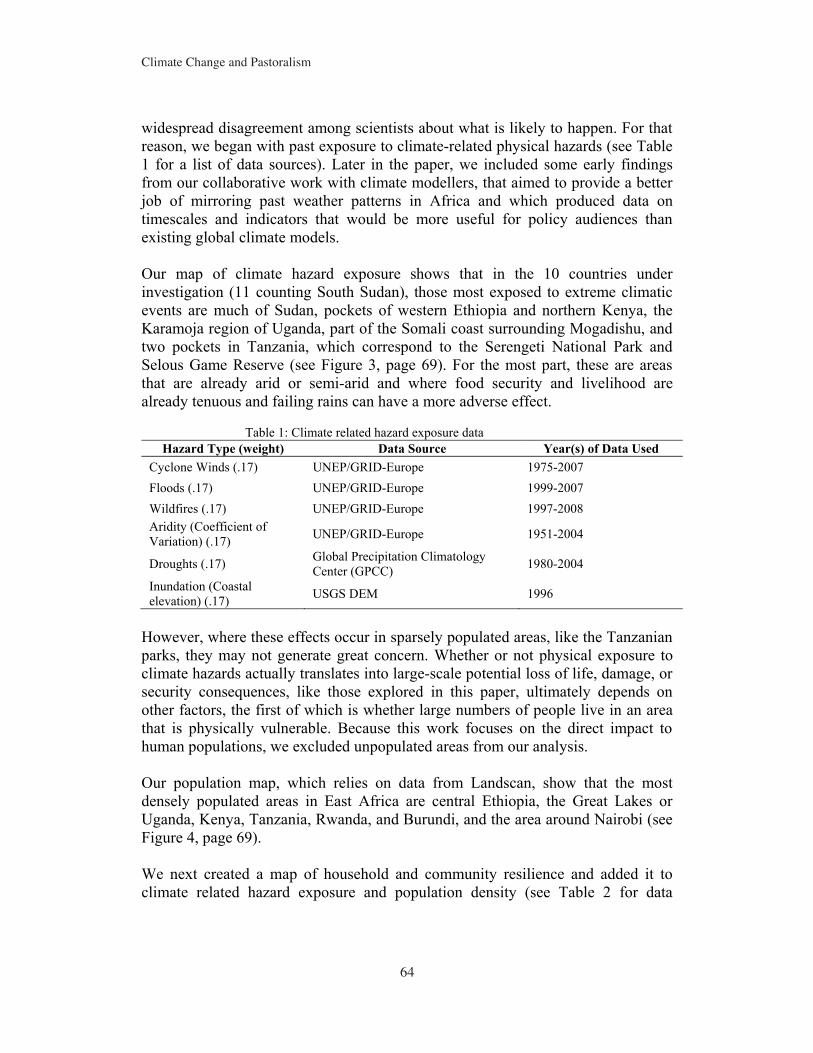
widespread disagreement among scientists about what is likely to happen. For that reason, we began with past exposure to climate-related physical hazards (see Table 1 for a list of data sources). Later in the paper, we included some early findings from our collaborative work with climate modellers, that aimed to provide a better job of mirroring past weather patterns in Africa and which produced data on timescales and indicators that would be more useful for policy audiences than existing global climate models.
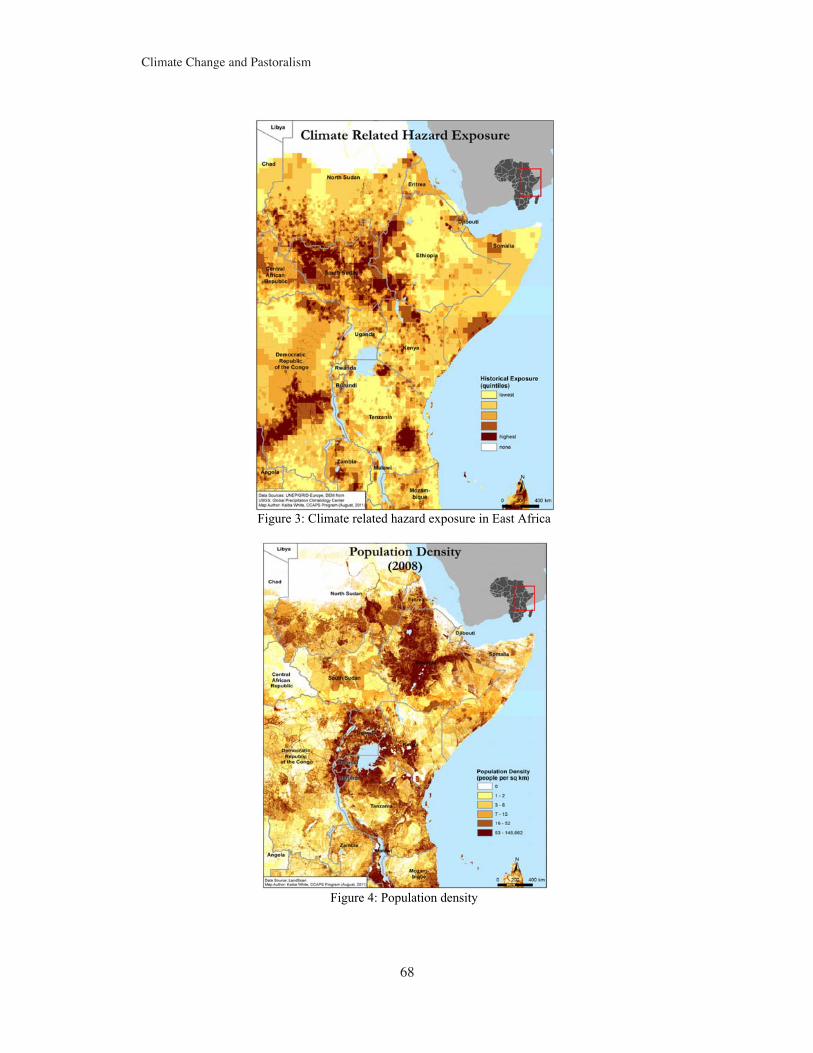
Our map of climate hazard exposure shows that in the 10 countries under investigation (11 counting South Sudan), those most exposed to extreme climatic events are much of Sudan, pockets of western Ethiopia and northern Kenya, the Karamoja region of Uganda, part of the Somali coast surrounding Mogadishu, and two pockets in Tanzania, which correspond to the Serengeti National Park and Selous Game Reserve (see Figure 3, page 69). For the most part, these are areas that are already arid or semi-arid and where food security and livelihood are already tenuous and failing rains can have a more adverse effect.
Table 1: Climate related hazard exposure data Hazard Type (weight) Data Source Year(s) of Data Used
Cyclone Winds (.17) UNEP/GRID-Europe 1975-2007 Floods (.17) UNEP/GRID-Europe 1999-2007 Wildfires (.17) UNEP/GRID-Europe 1997-2008 Aridity (Coefficient of Variation) (.17) UNEP/GRID-Europe 1951-2004
Droughts (.17) Global Precipitation Climatology Center (GPCC) 1980-2004
Inundation (Coastal elevation) (.17) USGS DEM 1996
However, where these effects occur in sparsely populated areas, like the Tanzanian parks, they may not generate great concern. Whether or not physical exposure to climate hazards actually translates into large-scale potential loss of life, damage, or security consequences, like those explored in this paper, ultimately depends on other factors, the first of which is whether large numbers of people live in an area that is physically vulnerable. Because this work focuses on the direct impact to human populations, we excluded unpopulated areas from our analysis.
Our population map, which relies on data from Landscan, show that the most densely populated areas in East Africa are central Ethiopia, the Great Lakes or Uganda, Kenya, Tanzania, Rwanda, and Burundi, and the area around Nairobi (see Figure 4, page 69).
We next created a map of household and community resilience and added it to climate related hazard exposure and population density (see Table 2 for data
Evidence for and vulnerability to climate change
65
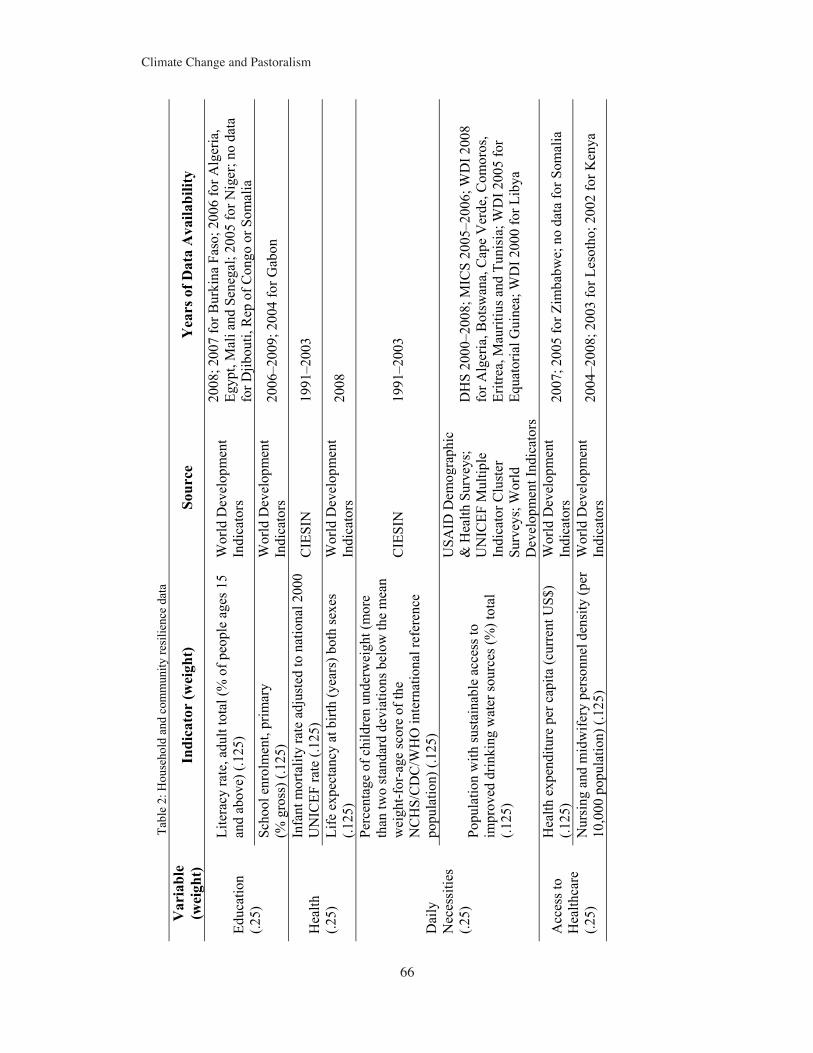
sources). This basket includes eight national level indicators—two in each category. In the education basket are national level indicators for adult literacy rates and primary school enrolment rates. Similarly, we relied on national level indicators for the access to healthcare. These were national health expenditure per capita and nursing and midwifery density. The health basket includes a national level indicator for life expectancy at birth and a more finely tuned sub-national indicator for infant mortality rates. The daily necessities basket is the highest resolution with two sub-national indicators; percentage of underweight children from Center for International Earth Science Information Network (CIESIN) and an indicator of access to improved water sources, at the first-level administrative division that we constructed from USAID, UNICEF, and WHO household survey data.
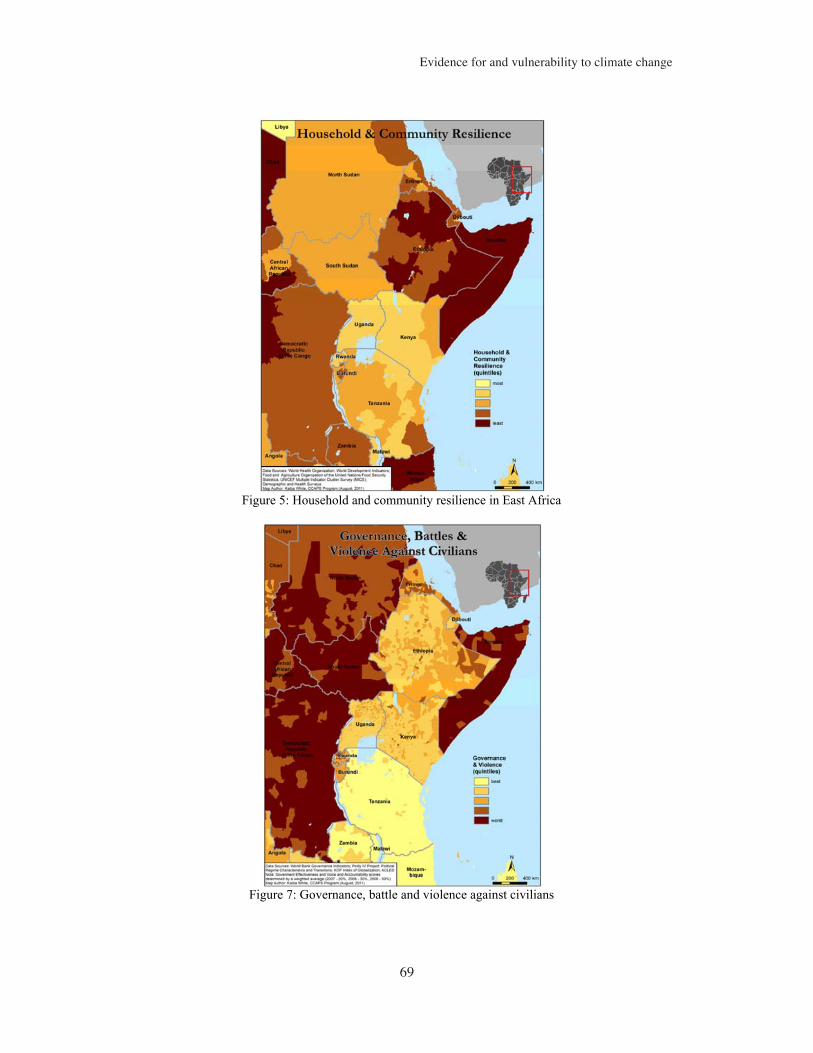
As shown by Figure 5 (page 70), large areas and, in some cases entire countries—for example Sudan and Uganda—in this basket appeared in the same quintile even though there may have been some sub-national variation (see Figure 5). At the regional level, however, there was high variation between the IGAD/EAC countries. Uganda and Kenya are among the most resilient countries in Africa while Somalia and large areas of Ethiopia are some of the least resilient.
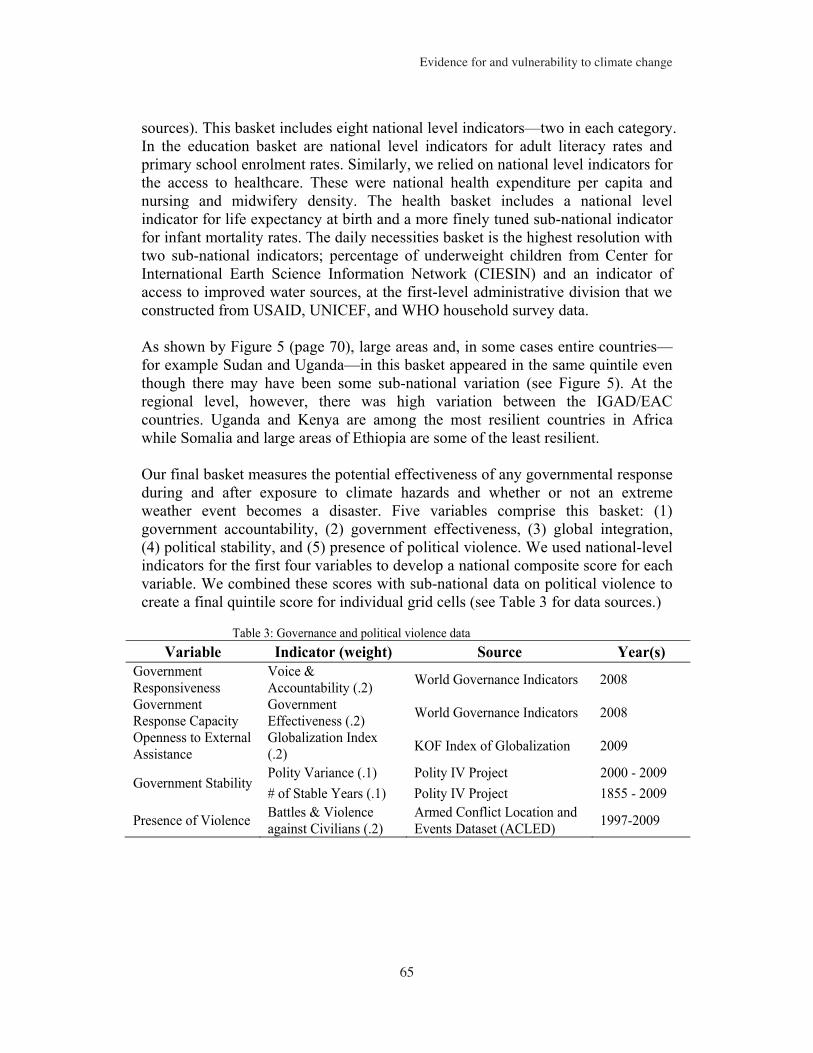
Our final basket measures the potential effectiveness of any governmental response during and after exposure to climate hazards and whether or not an extreme weather event becomes a disaster. Five variables comprise this basket: (1) government accountability, (2) government effectiveness, (3) global integration, (4) political stability, and (5) presence of political violence. We used national-level indicators for the first four variables to develop a national composite score for each variable. We combined these scores with sub-national data on political violence to create a final quintile score for individual grid cells (see Table 3 for data sources.)
Table 3: Governance and political violence data Variable Indicator (weight) Source Year(s)
Government Responsiveness
Voice & Accountability (.2) World Governance Indicators 2008
Government Response Capacity
Government Effectiveness (.2) World Governance Indicators 2008
Openness to External Assistance
Globalization Index (.2) KOF Index of Globalization 2009
Government Stability Polity Variance (.1) Polity IV Project 2000 - 2009 # of Stable Years (.1) Polity IV Project 1855 - 2009
Presence of Violence Battles & Violence against Civilians (.2)
Armed Conflict Location and Events Dataset (ACLED) 1997-2009
sources). This basket includes eight national level indicators—two in each category. In the education basket are national level indicators for adult literacy rates and primary school enrolment rates. Similarly, we relied on national level indicators for the access to healthcare. These were national health expenditure per capita and nursing and midwifery density. The health basket includes a national level indicator for life expectancy at birth and a more finely tuned sub-national indicator for infant mortality rates. The daily necessities basket is the highest resolution with two sub-national indicators; percentage of underweight children from Center for International Earth Science Information Network (CIESIN) and an indicator of access to improved water sources, at the first-level administrative division that we constructed from USAID, UNICEF, and WHO household survey data.
As shown by Figure 5 (page 70), large areas and, in some cases entire countries—for example Sudan and Uganda—in this basket appeared in the same quintile even though there may have been some sub-national variation (see Figure 5). At the regional level, however, there was high variation between the IGAD/EAC countries. Uganda and Kenya are among the most resilient countries in Africa while Somalia and large areas of Ethiopia are some of the least resilient.
Our final basket measures the potential effectiveness of any governmental response during and after exposure to climate hazards and whether or not an extreme weather event becomes a disaster. Five variables comprise this basket: (1) government accountability, (2) government effectiveness, (3) global integration, (4) political stability, and (5) presence of political violence. We used national-level indicators for the first four variables to develop a national composite score for each variable. We combined these scores with sub-national data on political violence to create a final quintile score for individual grid cells (see Table 3 for data sources.)
Table 3: Governance and political violence data Variable Indicator (weight) Source Year(s)
Government Responsiveness
Voice & Accountability (.2) World Governance Indicators 2008
Government Response Capacity
Government Effectiveness (.2) World Governance Indicators 2008
Openness to External Assistance
Globalization Index (.2) KOF Index of Globalization 2009
Government Stability Polity Variance (.1) Polity IV Project 2000 - 2009 # of Stable Years (.1) Polity IV Project 1855 - 2009
Presence of Violence Battles & Violence against Civilians (.2)
Armed Conflict Location and Events Dataset (ACLED) 1997-2009
Climate Change and Pastoralism
66
Tabl
e 2:
Hou
seho
ld a
nd c
omm
unity
resi
lienc
e da
ta
Var
iabl
e(w
eigh
t)In
dica
tor
(wei
ght)
Sour
ceY
ears
of D
ata
Ava
ilabi
lity
Educ
atio
n (.2
5)
Lite
racy
rate
, adu
lt to
tal (
% o
f peo
ple
ages
15
and
abov
e) (.
125)
W
orld
Dev
elop
men
t In
dica
tors
2008
; 200
7 fo
r Bur
kina
Fas
o; 2
006
for A
lger
ia,
Egyp
t, M
ali a
nd S
eneg
al; 2
005
for N
iger
; no
data
fo
r Djib
outi,
Rep
of C
ongo
or S
omal
ia
Scho
ol e
nrol
men
t, pr
imar
y (%
gro
ss) (
.125
) W
orld
Dev
elop
men
t In
dica
tors
20
06–2
009;
200
4 fo
r Gab
on
Hea
lth
(.25)
Infa
nt m
orta
lity
rate
adj
uste
d to
nat
iona
l 200
0 U
NIC
EF ra
te (.
125)
C
IESI
N
1991
–200
3
Life
exp
ecta
ncy
at b
irth
(yea
rs) b
oth
sexe
s (.1
25)
Wor
ld D
evel
opm
ent
Indi
cato
rs
2008
Dai
ly
Nec
essi
ties
(.25)
Perc
enta
ge o
f chi
ldre
n un
derw
eigh
t (m
ore
than
two
stan
dard
dev
iatio
ns b
elow
the
mea
n w
eigh
t-for
-age
scor
e of
the
NC
HS/
CD
C/W
HO
inte
rnat
iona
l ref
eren
ce
popu
latio
n) (.
125)
CIE
SIN
19
91–2
003
Popu
latio
n w
ith su
stai
nabl
e ac
cess
to
impr
oved
drin
king
wat
er so
urce
s (%
) tot
al
(.125
)
USA
ID D
emog
raph
ic
& H
ealth
Sur
veys
; U
NIC
EF M
ultip
le
Indi
cato
r Clu
ster
Su
rvey
s; W
orld
D
evel
opm
ent I
ndic
ator
s
DH
S 20
00–2
008;
MIC
S 20
05–2
006;
WD
I 200
8 fo
r Alg
eria
, Bot
swan
a, C
ape
Ver
de, C
omor
os,
Eritr
ea, M
aurit
ius a
nd T
unis
ia; W
DI 2
005
for
Equa
toria
l Gui
nea;
WD
I 200
0 fo
r Lib
ya
Acc
ess t
o H
ealth
care
(.2
5)
Hea
lth e
xpen
ditu
re p
er c
apita
(cur
rent
US$
) (.1
25)
Wor
ld D
evel
opm
ent
Indi
cato
rs
2007
; 200
5 fo
r Zim
babw
e; n
o da
ta fo
r Som
alia
Nur
sing
and
mid
wife
ry p
erso
nnel
den
sity
(per
10
,000
pop
ulat
ion)
(.12
5)
Wor
ld D
evel
opm
ent
Indi
cato
rs
2004
–200
8; 2
003
for L
esot
ho; 2
002
for K
enya
Evidence for and vulnerability to climate change
67
Figure 1: Composite vulnerability and FEWS NET risk of famine
Figure 2: Composite vulnerability baskets and indicators
Figure 1: Composite vulnerability and FEWS NET risk of famine
Figure 2: Composite vulnerability baskets and indicators
Figure 1: Composite vulnerability and FEWS NET risk of famine
Figure 2: Composite vulnerability baskets and indicators
Climate Change and Pastoralism
68
Figure 3: Climate related hazard exposure in East Africa
Figure 4: Population density
Evidence for and vulnerability to climate change
69
Figure 5: Household and community resilience in East Africa
Figure 7: Governance, battle and violence against civilians
Climate Change and Pastoralism
70
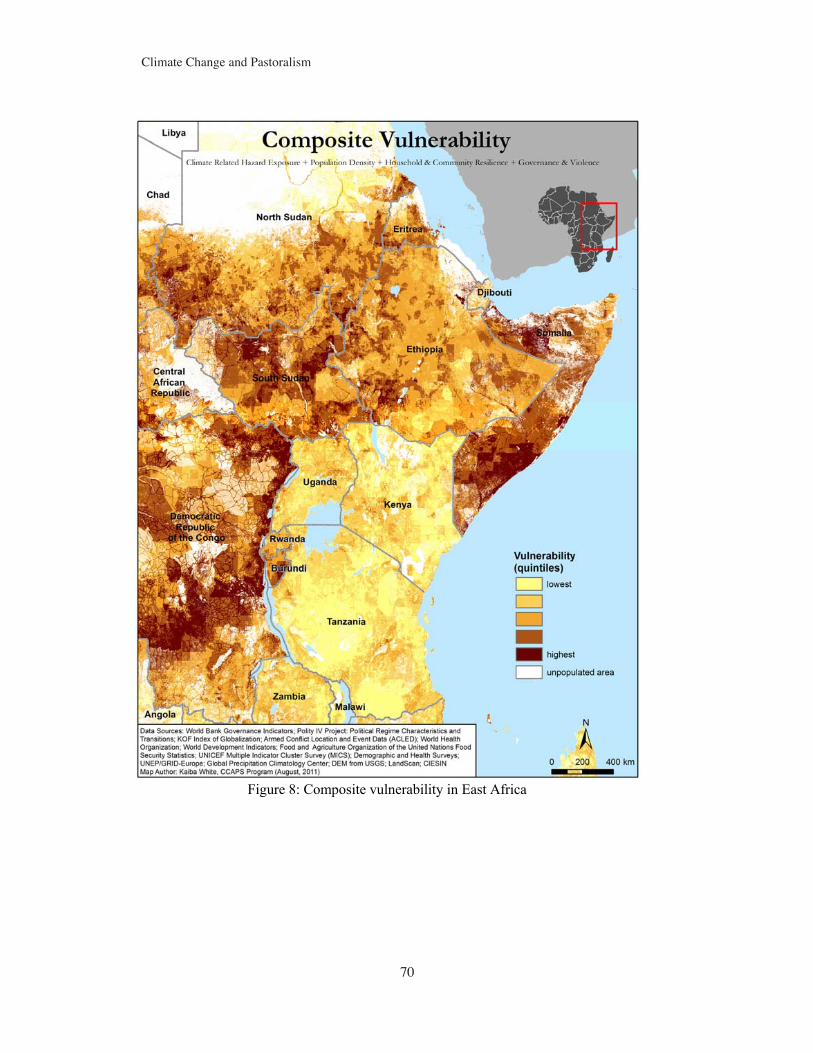
Figure 8: Composite vulnerability in East Africa
Evidence for and vulnerability to climate change
71
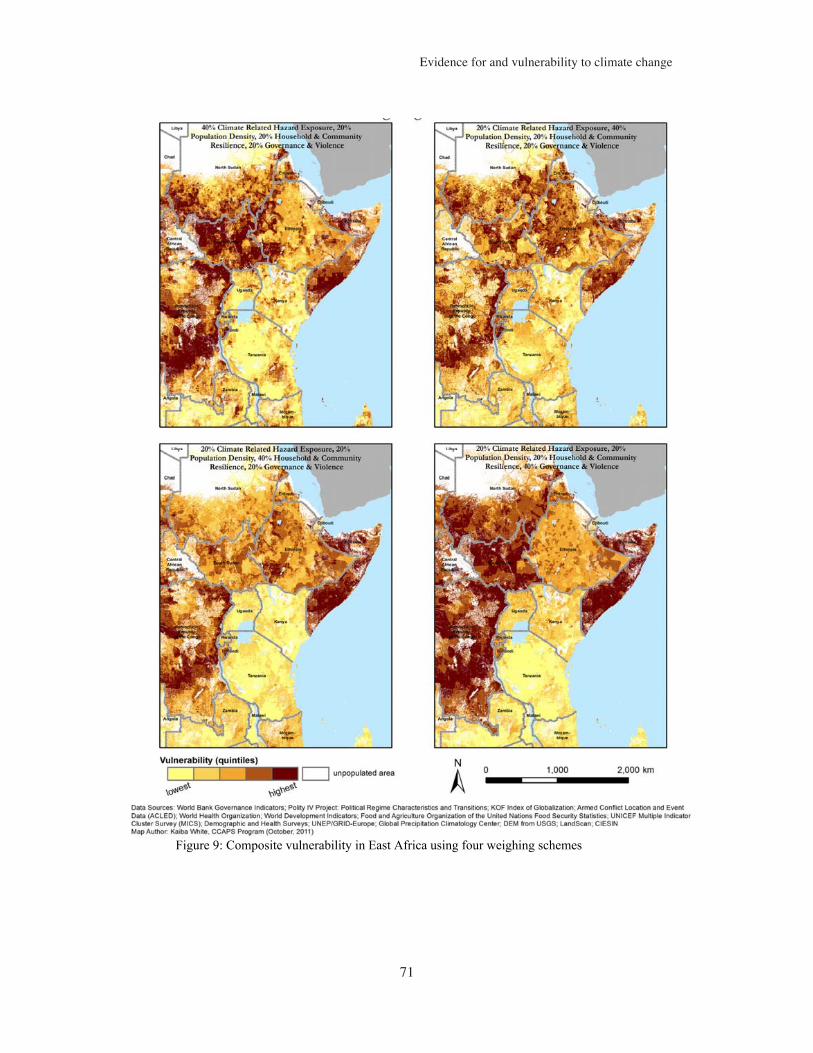
Figure 9: Composite vulnerability in East Africa using four weighing schemes
Climate Change and Pastoralism
72
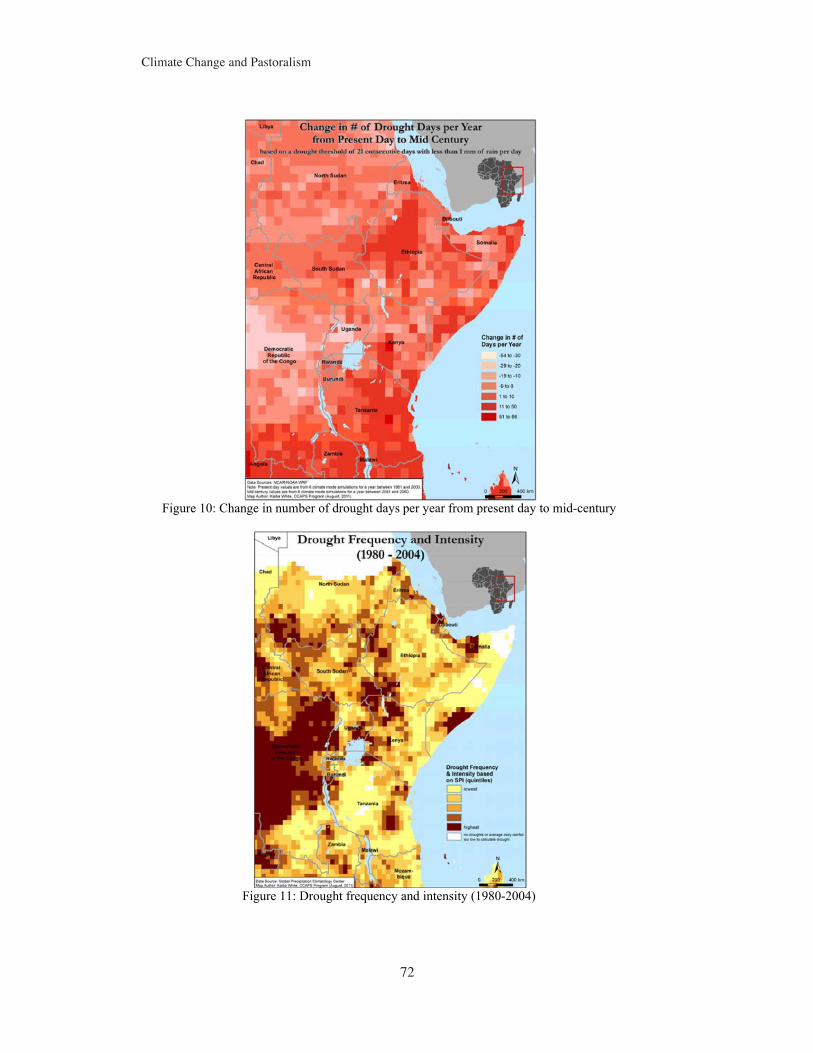
Figure 10: Change in number of drought days per year from present day to mid-century
Figure 11: Drought frequency and intensity (1980-2004)
Evidence for and vulnerability to climate change
73
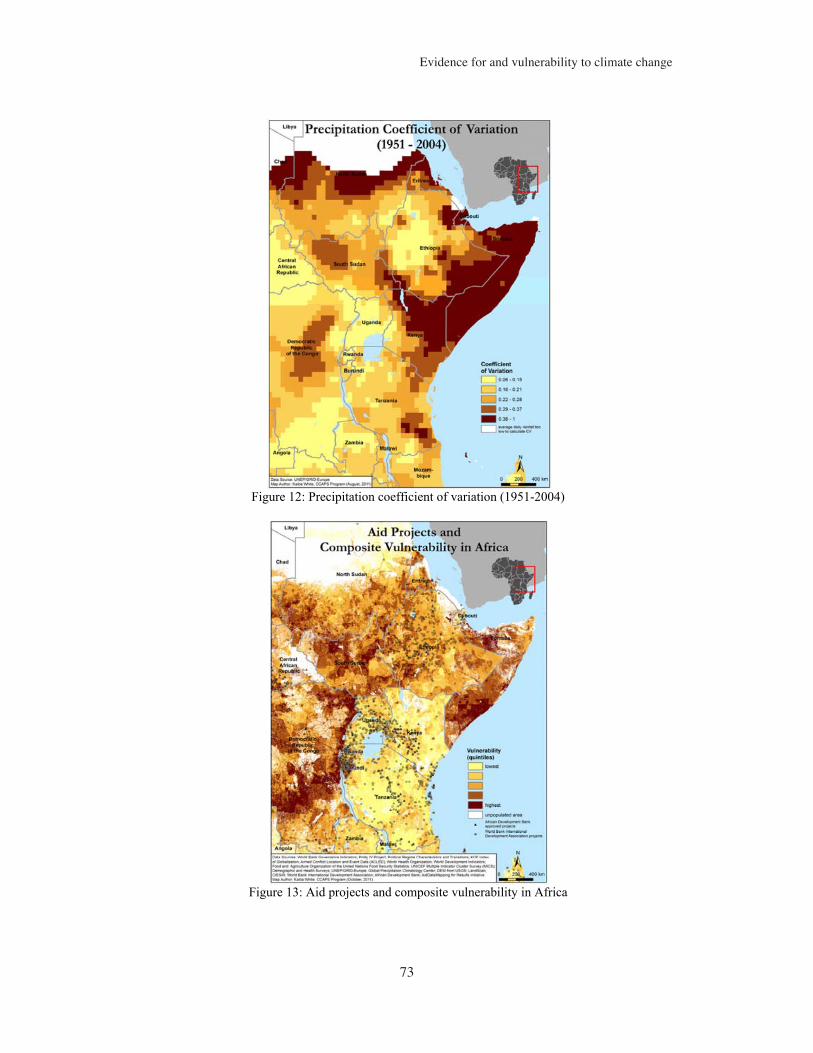
Figure 12: Precipitation coefficient of variation (1951-2004)
Figure 13: Aid projects and composite vulnerability in Africa
Climate Change and Pastoralism
74
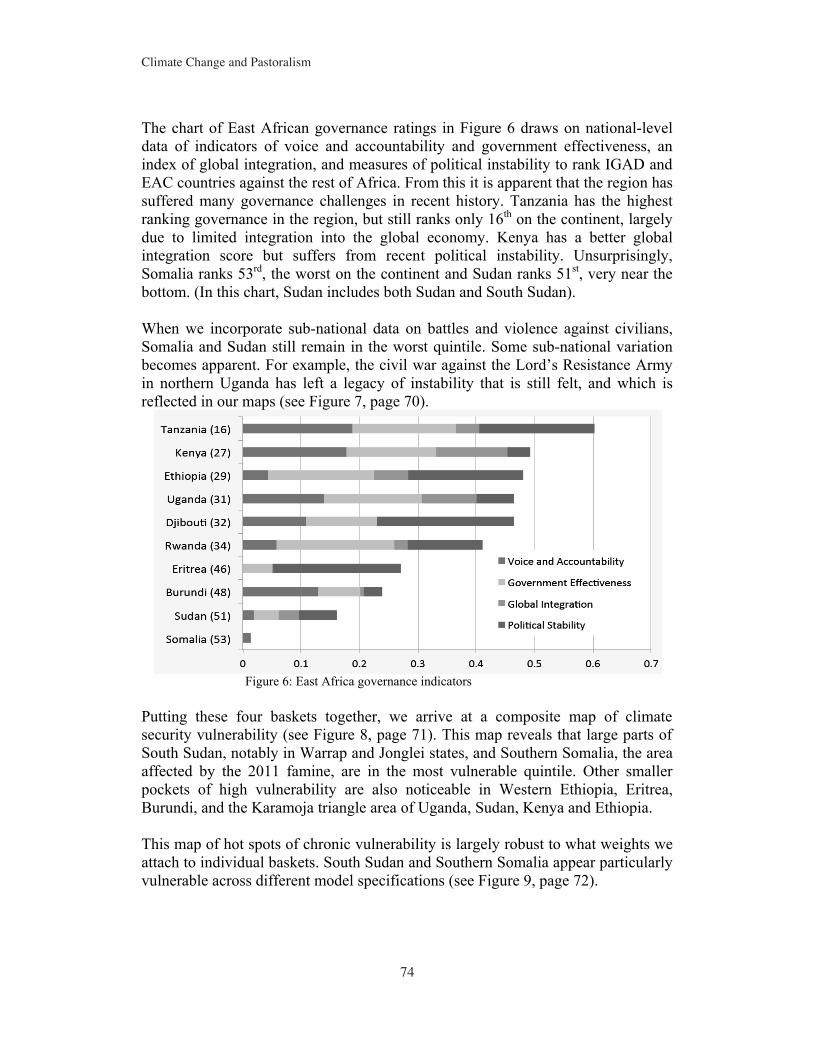
The chart of East African governance ratings in Figure 6 draws on national-level data of indicators of voice and accountability and government effectiveness, an index of global integration, and measures of political instability to rank IGAD and EAC countries against the rest of Africa. From this it is apparent that the region has suffered many governance challenges in recent history. Tanzania has the highest ranking governance in the region, but still ranks only 16th on the continent, largely due to limited integration into the global economy. Kenya has a better global integration score but suffers from recent political instability. Unsurprisingly, Somalia ranks 53rd, the worst on the continent and Sudan ranks 51st, very near the bottom. (In this chart, Sudan includes both Sudan and South Sudan).
When we incorporate sub-national data on battles and violence against civilians, Somalia and Sudan still remain in the worst quintile. Some sub-national variation becomes apparent. For example, the civil war against the Lord’s Resistance Army in northern Uganda has left a legacy of instability that is still felt, and which is reflected in our maps (see Figure 7, page 70).
Figure 6: East Africa governance indicators
Putting these four baskets together, we arrive at a composite map of climate security vulnerability (see Figure 8, page 71). This map reveals that large parts of South Sudan, notably in Warrap and Jonglei states, and Southern Somalia, the area affected by the 2011 famine, are in the most vulnerable quintile. Other smaller pockets of high vulnerability are also noticeable in Western Ethiopia, Eritrea, Burundi, and the Karamoja triangle area of Uganda, Sudan, Kenya and Ethiopia.
This map of hot spots of chronic vulnerability is largely robust to what weights we attach to individual baskets. South Sudan and Southern Somalia appear particularly vulnerable across different model specifications (see Figure 9, page 72).
Evidence for and vulnerability to climate change
75
While these maps of chronic vulnerability provide a point of departure, places that have historically faced intense exposure to floods, droughts, and other climate related hazards might not be affected in the same way by climate change. Existing general circulation or global climate models have shown wide disagreement about the likely effects of climate change on the African continent.
Models agree that Southern and Northern Africa are likely to get drier, but elsewhere, including parts of East Africa, there is less consensus. Based on its review of multiple studies, the 2007 IPCC Fourth Assessment concluded: “There is likely to be an increase in annual mean rainfall in East Africa” (IPCC, 2007b). The A summary of model projections of rainfall by the IPCC report show nearly 20 models projecting higher rainfall over East Africa in most months.
Despite the apparent convergence of climate models, suggesting East Africa will become wetter with climate change, there are some reasons to be sceptical. First, there is less model convergence for all of East Africa. Moreover, the results reported by the IPCC are based primarily on global circulation model (GCM) projections, which may not be well suited to produce regional climate projections in all locations. Third, some studies suggest that East Africa may, in fact experience more episodes of drought in the future, and attribute the 2011 drought conditions to the emergent effects of climate change—rather than an especially strong La Niña episode. Geographer Chris Funk, along with colleagues from the U.S. Geologic Survey (which also advises FEWS NET), has made this argument most persuasively in a number of studies. In a 2011 paper, with A. Park Williams,he suggests drier conditions in East Africa will continue because of climate change (Williams & Funk, 2011). Funk attributed the lack of rain to warming over the eastern Indian Ocean and the extension of the Tropical Warm Pool, which originates in Indonesia:
It’s warmed about a degree over the last 30 or 40 years and maybe about half a degree over the last 20. But the reason that it’s important is that it’s already really, really warm. And so, as far as we can tell, that warming has triggered more rainfall over the central Indian Ocean. And that rainfall basically pulls in moisture from the surrounding area and prevents it from going onshore into Africa.
The sea surface temperatures in the Indian Ocean are really well correlated with global temperatures. So, the past 150 years, as far as we can tell, the Indian Ocean has gone up and down very closely with global temperatures. I’m not sure that we fully understand why that is, but it seems to be an area that as we’re experiencing global warming the Indian Ocean is warming up right in step with that.
Climate Change and Pastoralism
76
His views are a bit more nuanced as he noted that other areas in East Africa might get wetter the closer they are to Lake Victoria (DeCapua, 2011).
Given the problems of global circulation models (GCMs) in validating local climate patterns at more fine-grained resolution, and the lack of model agreement for Africa broadly and East Africa in particular, we have worked to develop a regional climate model (RCM) for application over Africa. This model, which is derived from the National Centre for Atmospheric Research’s Weather Research and Forecasting Model (WRF), aims to validate better than GCMs, meaning that the simulations of historic rainfall and temperature patterns are a closer fit with historic observed data (at least compared to GCMs). A reasonable validation of the historical rainfall and temperature patterns is viewed as a necessary but not a sufficient condition for a confident future prediction. While most GCMs focus on end of the 21st century projections of 2080-2099, our model focuses on mid-century projections; a time frame more relevant to policymakers.
While space forbids a more detailed discussion of the model, we have run a mid-21st century ensemble under the IPCC AR4 mid-line A1B emission scenario (see Cook and Vizy, 2012; Vizy and Cook, 2012 for a full description of the model design). We are currently in the process of developing multi-year simulations in an effort to capture dynamics in the seasonality of rains. Nonetheless, we can present some of the preliminary findings based on the initial ensemble. In terms of drought dynamics, which we define as 21 consecutive days with less than a 1mm of rain, we find a mixed picture in East Africa. Parts of the Somali coast are projected to experience an increase in drought days, as is much of western Ethiopia. However, large swaths of the region, including Central Uganda, Northern Kenya, and Eastern Ethiopia, are all projected to experience a significant decline in the number of drought days (see Figure 10, 73). We expect the next iteration of projections will provide more clarity about changes in the seasonality of rain, in terms of timing, intensity, and total amounts, as well as the mechanisms that affect these dynamics.
How well do these patterns of future drought match historic exposure? Here, two maps of historic rainfall patterns may be relevant: our maps of drought derived from the Standardized Precipitation Index (which captures rainfall anomalies) and our maps of the coefficient of variation, which does a better job at capturing areas of chronic water scarcity (see Figures 11 and 12, pages 73 and 74 respectively).
Both the patterns of historic droughts and chronic water scarcity are different from projections of future drought days. The areas of congruence are along the Somali coast. Of course, these measures of historic drought and water scarcity are based on slightly different indicators. It may be more valuable to have comparable before and after metrics for future analysis. Nonetheless, on the basis of our composite
Evidence for and vulnerability to climate change
77
maps, and the preliminary findings of our climate models, we are confident that Somalia’s Southern coast will likely continue to experience continued exposure to climate hazards and, given its other problems, be particularly vulnerable in the future.
5. Policy implications
In light of these observations, what are the implications for policy? In the midst of an on-going humanitarian emergency in Somalia, there are a number of available short-run interventions that could prevent people from dying. However, a number of these short-run decisions have long-run implications for the recovery of the population and the future of the Somali state, and major implications for the rest of the region. Busby has written elsewhere about the short-run emergency needs of finance and access as well as the larger challenges of fostering a functioning Somali state (Busby, 2011).
Most observers have focused on the need for a longer-term development vision for the region, and indeed, if climate change will have deleterious effect on parts of East Africa, as our maps and models suggest, then long-run finance must be mobilised to help the region adapt. However, when one looks at the geographic location of active projects from the World Bank and the African Development Bank (AfDB) (across all sectors, not just adaptation-specific projects), overlaid on our climate security vulnerability maps, money is flowing to governments in the region—Kenya, Uganda, and Ethiopia—with the most capacity to absorb aid and spend the money well (see Figure 13, page 74).
By and large, multi-lateral donor assistance is not going to countries like Somalia and Sudan that may need it the most, in order to minimise the adverse consequences of climate change. With Somalia lacking a functioning government, and the Khartoum regime still largely an international pariah, these funding patterns are understandable, particularly since the Bank may be constrained to work with state actors rather than channel money directly to civil society, as many bilateral governments do.
Although the fledgling South Sudan is still struggling to build governmental capacity, it will be interesting to see how quickly aid patterns change. Of course, the World Bank and AfDB are just two donors and their actions may not reflect wider bilateral lending and giving patterns, but they are two very important donors and they often reflect broader donor tendencies. It must also be noted that this map may not be fully representative of spending patterns, since each dot represents a project rather than the amount involved. Some of the projects may account for a disproportionate amount of funding and per capita giving may be higher in some countries. Moreover, projects could be stacked in a single location, which is not
Climate Change and Pastoralism
78
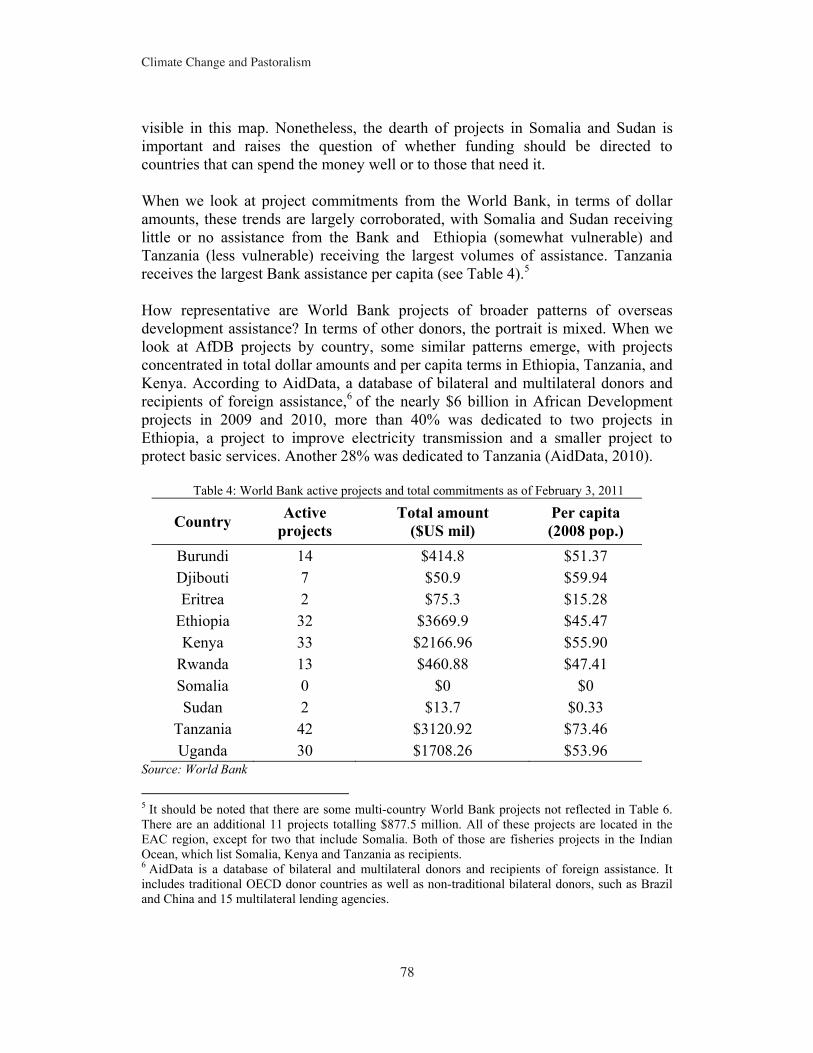
visible in this map. Nonetheless, the dearth of projects in Somalia and Sudan is important and raises the question of whether funding should be directed to countries that can spend the money well or to those that need it.
When we look at project commitments from the World Bank, in terms of dollar amounts, these trends are largely corroborated, with Somalia and Sudan receiving little or no assistance from the Bank and Ethiopia (somewhat vulnerable) and Tanzania (less vulnerable) receiving the largest volumes of assistance. Tanzania receives the largest Bank assistance per capita (see Table 4).5
How representative are World Bank projects of broader patterns of overseas development assistance? In terms of other donors, the portrait is mixed. When we look at AfDB projects by country, some similar patterns emerge, with projects concentrated in total dollar amounts and per capita terms in Ethiopia, Tanzania, and Kenya. According to AidData, a database of bilateral and multilateral donors and recipients of foreign assistance,6 of the nearly $6 billion in African Development projects in 2009 and 2010, more than 40% was dedicated to two projects in Ethiopia, a project to improve electricity transmission and a smaller project to protect basic services. Another 28% was dedicated to Tanzania (AidData, 2010).
Table 4: World Bank active projects and total commitments as of February 3, 2011
Country Activeprojects
Total amount ($US mil)
Per capita (2008 pop.)
Burundi 14 $414.8 $51.37Djibouti 7 $50.9 $59.94Eritrea 2 $75.3 $15.28
Ethiopia 32 $3669.9 $45.47Kenya 33 $2166.96 $55.90
Rwanda 13 $460.88 $47.41Somalia 0 $0 $0Sudan 2 $13.7 $0.33
Tanzania 42 $3120.92 $73.46Uganda 30 $1708.26 $53.96
Source: World Bank
5 It should be noted that there are some multi-country World Bank projects not reflected in Table 6. There are an additional 11 projects totalling $877.5 million. All of these projects are located in the EAC region, except for two that include Somalia. Both of those are fisheries projects in the Indian Ocean, which list Somalia, Kenya and Tanzania as recipients. 6 AidData is a database of bilateral and multilateral donors and recipients of foreign assistance. It includes traditional OECD donor countries as well as non-traditional bilateral donors, such as Brazil and China and 15 multilateral lending agencies.
Evidence for and vulnerability to climate change
79
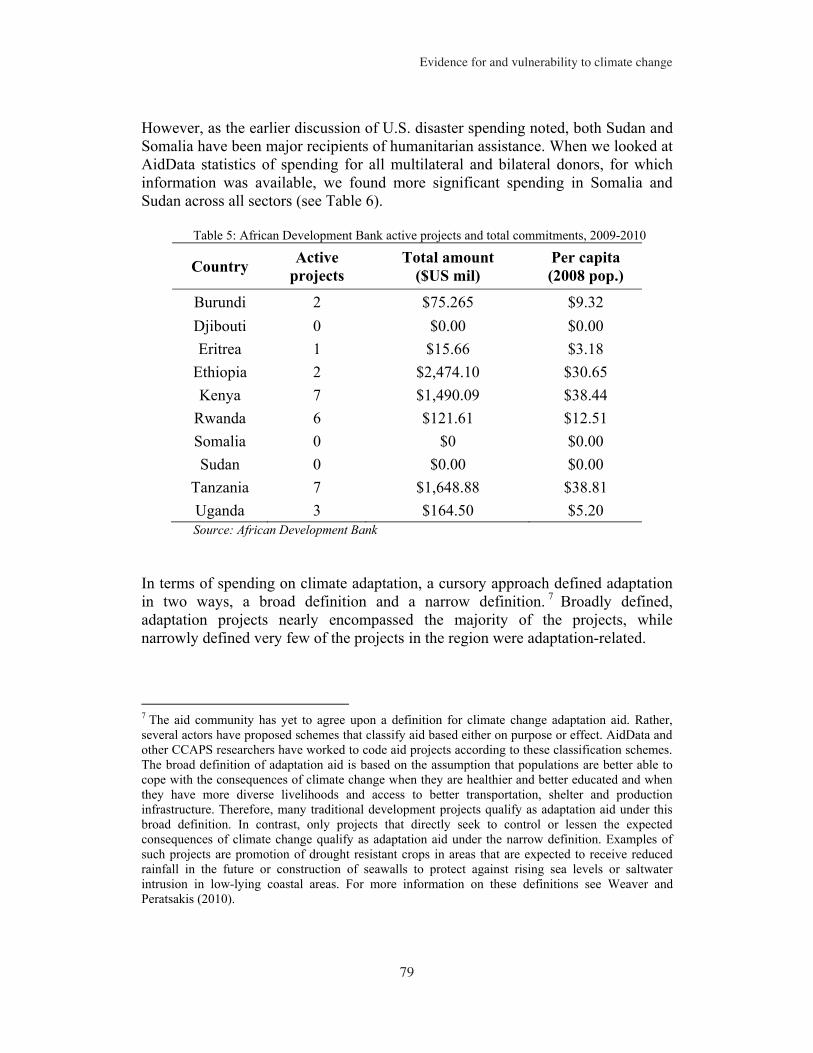
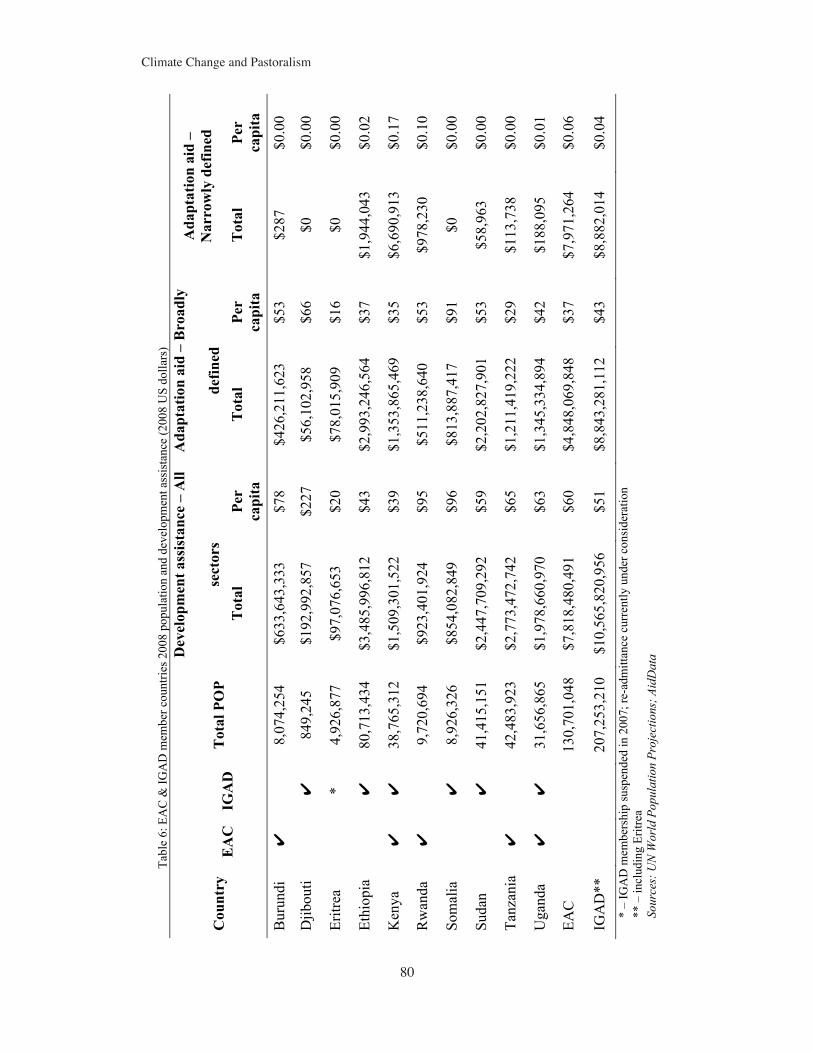
However, as the earlier discussion of U.S. disaster spending noted, both Sudan and Somalia have been major recipients of humanitarian assistance. When we looked at AidData statistics of spending for all multilateral and bilateral donors, for which information was available, we found more significant spending in Somalia and Sudan across all sectors (see Table 6).
Table 5: African Development Bank active projects and total commitments, 2009-2010
Country Activeprojects
Total amount ($US mil)
Per capita (2008 pop.)
Burundi 2 $75.265 $9.32Djibouti 0 $0.00 $0.00Eritrea 1 $15.66 $3.18
Ethiopia 2 $2,474.10 $30.65Kenya 7 $1,490.09 $38.44
Rwanda 6 $121.61 $12.51Somalia 0 $0 $0.00Sudan 0 $0.00 $0.00
Tanzania 7 $1,648.88 $38.81Uganda 3 $164.50 $5.20Source: African Development Bank
In terms of spending on climate adaptation, a cursory approach defined adaptation in two ways, a broad definition and a narrow definition. 7 Broadly defined, adaptation projects nearly encompassed the majority of the projects, while narrowly defined very few of the projects in the region were adaptation-related.
7 The aid community has yet to agree upon a definition for climate change adaptation aid. Rather, several actors have proposed schemes that classify aid based either on purpose or effect. AidData and other CCAPS researchers have worked to code aid projects according to these classification schemes. The broad definition of adaptation aid is based on the assumption that populations are better able to cope with the consequences of climate change when they are healthier and better educated and when they have more diverse livelihoods and access to better transportation, shelter and production infrastructure. Therefore, many traditional development projects qualify as adaptation aid under this broad definition. In contrast, only projects that directly seek to control or lessen the expected consequences of climate change qualify as adaptation aid under the narrow definition. Examples of such projects are promotion of drought resistant crops in areas that are expected to receive reduced rainfall in the future or construction of seawalls to protect against rising sea levels or saltwater intrusion in low-lying coastal areas. For more information on these definitions see Weaver and Peratsakis (2010).
Climate Change and Pastoralism
80
Tabl
e 6:
EA
C &
IGA
D m
embe
r cou
ntrie
s 200
8 po
pula
tion
and
deve
lopm
ent a
ssis
tanc
e (2
008
US
dolla
rs)
Cou
ntry
EAC
IGA
DT
otal
PO
P
Dev
elop
men
t ass
ista
nce
– A
ll
sect
ors
Ada
ptat
ion
aid
– B
road
ly
defin
ed
Ada
ptat
ion
aid
– N
arro
wly
def
ined
Tot
alPe
rca
pita
Tot
alPe
rca
pita
Tot
alPe
rca
pita
Bur
undi
俶8,
074,
254
$633
,643
,333
$7
8$4
26,2
11,6
23
$53
$287
$0
.00
Djib
outi
俶84
9,24
5$1
92,9
92,8
57
$227
$5
6,10
2,95
8 $6
6$0
$0.0
0
Eritr
ea*
4,92
6,87
7$9
7,07
6,65
3 $2
0$7
8,01
5,90
9 $1
6$0
$0.0
0
Ethi
opia
俶80
,713
,434
$3,4
85,9
96,8
12
$43
$2,9
93,2
46,5
64
$37
$1,9
44,0
43
$0.0
2
Ken
ya俶
俶38
,765
,312
$1,5
09,3
01,5
22
$39
$1,3
53,8
65,4
69
$35
$6,6
90,9
13
$0.1
7
Rw
anda
俶9,
720,
694
$923
,401
,924
$9
5$5
11,2
38,6
40
$53
$978
,230
$0
.10
Som
alia
俶8,
926,
326
$854
,082
,849
$9
6$8
13,8
87,4
17
$91
$0$0
.00
Suda
n俶
41,4
15,1
51$2
,447
,709
,292
$5
9$2
,202
,827
,901
$5
3$5
8,96
3 $0
.00
Tanz
ania
俶42
,483
,923
$2,7
73,4
72,7
42
$65
$1,2
11,4
19,2
22
$29
$113
,738
$0
.00
Uga
nda
俶俶
31,6
56,8
65$1
,978
,660
,970
$6
3$1
,345
,334
,894
$4
2$1
88,0
95
$0.0
1
EAC
130,
701,
048
$7,8
18,4
80,4
91
$60
$4,8
48,0
69,8
48
$37
$7,9
71,2
64
$0.0
6
IGA
D**
207,
253,
210
$10,
565,
820,
956
$51
$8,8
43,2
81,1
12
$43
$8,8
82,0
14
$0.0
4 *
– IG
AD
mem
bers
hip
susp
ende
d in
200
7; re
-adm
ittan
ce c
urre
ntly
und
er c
onsi
dera
tion
** –
incl
udin
g Er
itrea
So
urce
s: U
N W
orld
Pop
ulat
ion
Proj
ectio
ns; A
idD
ata
Evidence for and vulnerability to climate change
81
6. Conclusion
Space prevents a more detailed examination of donor giving trends in foreign assistance, but it is fair to say that support for the most vulnerable countries in the region, such as Somalia and Sudan, has been directed towards emergency crisis response rather than long-term developmental needs. Because these countries, especially their conflict-ridden southern regions, are subject to recurrent problems, including exposure to climate related hazards, and the absence of investment in long-term development programs to enhance their resilience, emergency relief efforts every few years is required on a massive scale. The neighbouring countries in the region, including Ethiopia, Uganda and Kenya, have created relatively better social safety nets, food for work schemes, income support, investment in agriculture, and income diversification programs, which meant that the 2011 drought had a less severe impact on affected communities. Still, these countries continue to suffer detrimental spill-over effects from their less developed neighbours, such as a large influx of refugees. The maps of chronic vulnerability in this paper suggest that the agro-pastoralist zones of Southern Somalia and South Sudan, among other areas of East Africa, are particularly vulnerable to recurrent crisis, given the confluence of physical exposure of large numbers of people in communities that lack local resilience, and in states that lack capacity or the willingness to assist the population in times of need. In light of these findings, and the existing sources of foreign assistance and relief, these maps raise a number of questions about where and for what future foreign assistance ought to be directed. They are, nevertheless, merely a starting point for these discussions and should not be considered conclusive distribution plans.
Climate Change and Pastoralism
82
References
AidData. (2010). AidData: Tracking Development Finance Retrieved October 25, 2011, from http://www.aiddata.org/home/index
Ananthaswamy, A. (2010, August 25). Time to blame climate change for extreme weather? Retrieved January 22, 2011, from http://www.newscientist.com/article/mg20727754.200-time-to-blame-climate-change-for-extreme-weather.html
Barder, O. (2011, July 27). Famine and Drought Retrieved August 24, 2011, from http://www.owen.org/blog/4818
Buhaug, H. (2010). Climate not to blame for Africa’s civil wars Proceedings of the National Academy of Sciences, 107(38), 16477-16482.
Buhaug, H., Gleditsch, N. P., & Theisen, O. M. (2008a, February 25). Implications of Climate Change for Armed Conflict Retrieved January 23, 2011, from http://siteresources.worldbank.org/INTRANETSOCIALDEVELOPMENT/Resources/SDCCWorkingPaper_Conflict.pdf
Buhaug, H., Gleditsch, N. P., & Theisen, O. M. (2008b). Implications of Climate Change for Armed Conflict World Bank.
Burke, M. B., Miguel, E., Satyana, S., Dykema, J. A., & Lobell, D. B. (2009). Warming increases the risk of civil war in Africa. Proceedings of the National Academy of Sciences, 106(49), 20670-20674.
Busby, J. (2007). Climate Change and National Security: An Agenda for Action. New York: Council on Foreign Relations.
Busby, J. (2008). Who Cares About the Weather? Climate Change and U.S. National Security. Security Studies, 17(3), 468-504.
Busby, J. (2009a). The Climate Security Connection: What It Means for the Poor. In L. Brainard, A. Jones & N. Purvis (Eds.), Climate Change and Global Poverty: A Billion Lives in the Balance? Washington, DC: Brookings Institution.
Busby, J. (2009b). Feeding Insecurity? Poverty, Weak States, and Climate Change In S. Rice, C. Graff & C. Pascual (Eds.), Confronting Poverty: Weak States and U.S. National Security. Washington, DC: Brookings Institution Press.
Evidence for and vulnerability to climate change
83
Busby, J. (2011, August 23). Resilience and the Future of Pastoralism in the Horn - part V (of the series on the 2011 East African drought). The Duck of MinervaRetrieved October 25, 2011, from http://duckofminerva.blogspot.com/2011/08/resilience-and-future-of-pastoralism-in.html
Busby, J., Smith, T. G., White, K., & Strange, S. M. (2010, August). Locating Climate Insecurity: Where are the Most Vulnerable Places in Africa? Retrieved September 26, 2010, from http://ccaps.strausscenter.org/system/research_items/pdfs/19/original.pdf?1283195613
Campbell, K. M., Gulledge, J., McNeill, J. R., Podesta, J., Ogden, P., Fuerth, L., . . . Mix, D. (2007, November). The Age of Consequences, from http://www.csis.org/media/csis/pubs/071105_ageofconsequences.pdf
Carr, E. R. (2011, July 21). Drought does not equal famine Retrieved August 24, 2011, from http://www.edwardrcarr.com/opentheechochamber/2011/07/21/drought-does-not-equal-famine/
Centre For Research on the Epidemiology of Disasters (CRED). (2011). EM-DAT: The OFDA/CRED International Disaster Database Retrieved August 24, 2011, from http://www.emdat.net
Chowdhury, S., & Squire, L. (2005). Setting Weights for Aggregate Indices: An Application to the Commitment to Development Index and Human Development Index. Journal of Development Studies, 42(5), 761-771.
CNA Corporation. (2007). National Security and the Threat of Climate Change Retrieved July 8, 2007, from http://securityandclimate.cna.org/report/
Cook, K. H., and E. K. Vizy. (2012). Impact of climate change on mid-21st century growing seasons in Africa. Submitted to J. Climate.
Curry, J. (2011, January 15). Attribution of extreme events Retrieved January 22, 2011, from http://judithcurry.com/2011/01/15/attribution-of-extreme-events/
DeCapua, J. (2011, July 27). Does Indian Ocean Hold Key to East Africa Drought? Retrieved August 24, 2011, from http://www.voanews.com/english/news/africa/decapua-east-africa-more-droughts-27jul11-126258123.html
Climate Change and Pastoralism
84
FEWSNET. (2011, October). Horn of Africa Emergency Retrieved October 25, 2011, from http://www.fews.net/pages/Horn-of-Africa-Emergency.aspx
Fingar, T. (2008, June 25). National Intelligence Assessment on the National Security Implications of Global Climate Change to 2030 Retrieved July 18, 2008, from http://www.dni.gov/testimonies/20080625_testimony.pdf
Friedman, L. (2010, February 24). Which Nations Are Most Vulnerable to Climate Change? The Daunting Politics of Choosing Retrieved March 5, 2011, from http://www.nytimes.com/cwire/2011/02/24/24climatewire-which-nations-are-most-vulnerable-to-climate-95690.html?ref=energy-environment
Gleditsch, N. P., Nordås, R., & Salehyan, I. (2007, May). Climate Change and Conflict: The Migration Link. Coping with Crisis: Working Paper SeriesRetrieved March 5, 2011, from http://www.ipacademy.org/asset/file/169/CWC_Working_Paper_Climate_Change.pdf
Good, A. (2011, July 10). Climate change is cause of Ethiopian drought Retrieved August 24, 2011, from http://www.telegraph.co.uk/news/worldnews/africaandindianocean/ethiopia/8628735/Climate-change-is-cause-of-Ethiopian-drought.html
Hendrix, C. S., & Glaser, S. M. (2007). Trends and Triggers: Climate Change and Civil Conflict in Sub-Saharan Africa. Political Geography, 26(6), 695-715.
Herman, P., & Treverton, G. F. (2009). The Political Consequences of Climate Change. Survival, 51(2), 137-148.
Hersh, J. (2011, July 13). East Africa Famine Threatens Regional Stability, USAID Chief Says Retrieved August 24, 2011, from http://www.huffingtonpost.com/2011/07/13/famine-in-africa-usaid_n_897644.html
High Representative and the European Commission to the European Council. (2008, March 14). Climate Change and International Security Retrieved September 26, 2010, from http://www.consilium.europa.eu/uedocs/cms_data/docs/pressdata/en/reports/99387.pdf
Homer-Dixon, T. F. (1999). Environment, scarcity, and violence. Princeton, N.J.: Princeton University Press.
Evidence for and vulnerability to climate change
85
IPCC. (2007a, April 6). Climate Change 2007: Climate Change Impacts, Adaptation and Vulnerability: Summary for Policymakers Retrieved April 10, 2007, from http://www.ipcc.ch/SPM6avr07.pdf
IPCC. (2007b). Climate Change 2007: Working Group I: The Physical Science Basis Retrieved August 24, 2011, from http://www.ipcc.ch/publications_and_data/ar4/wg1/en/ch11s11-2.html
Kahl, C. (1998). Population Growth, Environmental Degradation, and State-Sponsored Violence: The Case of Kenya, 1991-93. International Security, 23(2),80-119.
Kahl, C. H. (2006). States, scarcity, and civil strife in the developing world.Princeton: Princeton University Press.
Lehmann, E. (2011, January 4). Finding the Fingerprints of Climate Change in Storm Damage -- a Very Long Detective Story Retrieved January 22, 2011, from http://www.nytimes.com/cwire/2011/01/04/04climatewire-finding-the-fingerprints-of-climate-change-i-22773.html
Levy, M. A. (1995). Is the Environment a National Security Issue? International Security, 20(2), 35-62.
Levy, M. A., Thorkelson, C., Vörösmarty, C., Douglas, E., & Humphreys, M. (2005). Freshwater Availability Anomalies and Outbreak of Internal War: Results from a Global Spatial Time Series Analysis Retrieved August 26, 2006, from http://www.cicero.uio.no/humsec/papers/Levy_et_al.pdf
Nordås, R., & Gleditsch, N. P. (2009, February 15-18). IPCC and the climate-conflict nexus. Paper presented at the International Studies Association, New York. Office of Partnership Strategy and Stability Operations (PSO). (2010). DoD Involvement in Foreign Disaster Relief 2005-2010. Department of Defense. Washington, DC.
Percival, V., & Homer-Dixon, T. (1998). Environmental Scarcity and Violent Conflict: The Case of South Africa. Journal of Peace Research, 35(3, Special Issue on Environmental Conflict), 279-298.
Pielke Jr., R. (2011, January 4). Signals of Anthropogenic Climate Change in Disaster Data Retrieved January 22, 2011
Podesta, J., & Ogden, P. (2008). The Security Implications of Climate Change, from http://www.twq.com/08winter/docs/08winter_podesta.pdf
Climate Change and Pastoralism
86
Raleigh, C., Jordan, L., & Salehyan, I. (2008, February 25). Assessing the Impact of Climate Change on Migration and Conflict The Social Dimensions of Climate Change Retrieved January 23, 2011, from http://siteresources.worldbank.org/EXTSOCIALDEVELOPMENT/Resources/SDCCWorkingPaper_MigrationandConflict.pdf
Sachs, J. (2011, July 28). The Horn of Africa crisis is a warning to the world Retrieved August 24, 2011, from http://www.guardian.co.uk/global-development/poverty-matters/2011/jul/28/horn-africa-drought-warning?CMP=twt_fd
Salehyan, I. (2008). From Climate Change to Conflict?: No Consensus Yet. Journal of Peace Research 45(3), 315-332.
Solana, J. (2008, March 14). Climate Change and International Security: Paper from the High Representative and the European Commission to the European Council Retrieved July 18, 2008, from http://www.consilium.europa.eu/ueDocs/cms_Data/docs/pressData/en/reports/99387.pdf
Stapleton, L., & Garrod, G. D. (2007). Keeping things simple: why the Human Development Index should not diverge from its equal weights assumption. Social Indicators Research, 84(2), 179-188
Tebaldi, C. (2010, August 20). Pushing the Envelope of Climate Science ‘Attribution Studies’ Retrieved January 22, 2011, from http://www.climatecentral.org/blog/pushing-the-envelope-of-climate-science-attribution-studies/
UN Security Council. (2007, April 17). Security Council Holds First-Ever Debate On Impact Of Climate Change On Peace, Security, Hearing Over 50 Speakers. New York, United Nations. Retrieved July 8, 2007, from http://www.un.org/News/Press/docs/2007/sc9000.doc.htm
UNISDR. (2009). Global assessment report on disaster risk reduction (2009) Retrieved January 23, 2011, from http://www.preventionweb.net/english/hyogo/gar/report/index.php?id=9413
USAID-OFDA. (2010). USAID-OFDA and USG Disaster Response FY 2000-2009 (April 10 ed.). Washington, DC: USAID.
Vizy, E. K., and K. H. Cook (2012). Mid-21st century changes in extreme events over northern and tropical Africa. Submitted to Journal of Climate.
Evidence for and vulnerability to climate change
87
WBGU. (2007, June 26). Climate Change as a Security Risk: Summary for Policymakers Retrieved July 8, 2007, from http://www.wbgu.de/wbgu_jg2007_kurz_engl.html
Weaver, C., & Peratsakis, C. (2010). International Development Assistance for Climate Change Adaptation in Africa: The Aid Scramble CCAPS Policy Brief: TheRobert S. Strauss Center for International Security and Law.
Williams, A. P., & Funk, C. (2011). A westward extension of the warm pool leads to a westward extension of the Walker circulation, drying eastern Africa ClimateDynamics.