Embed Size (px)
Citation preview
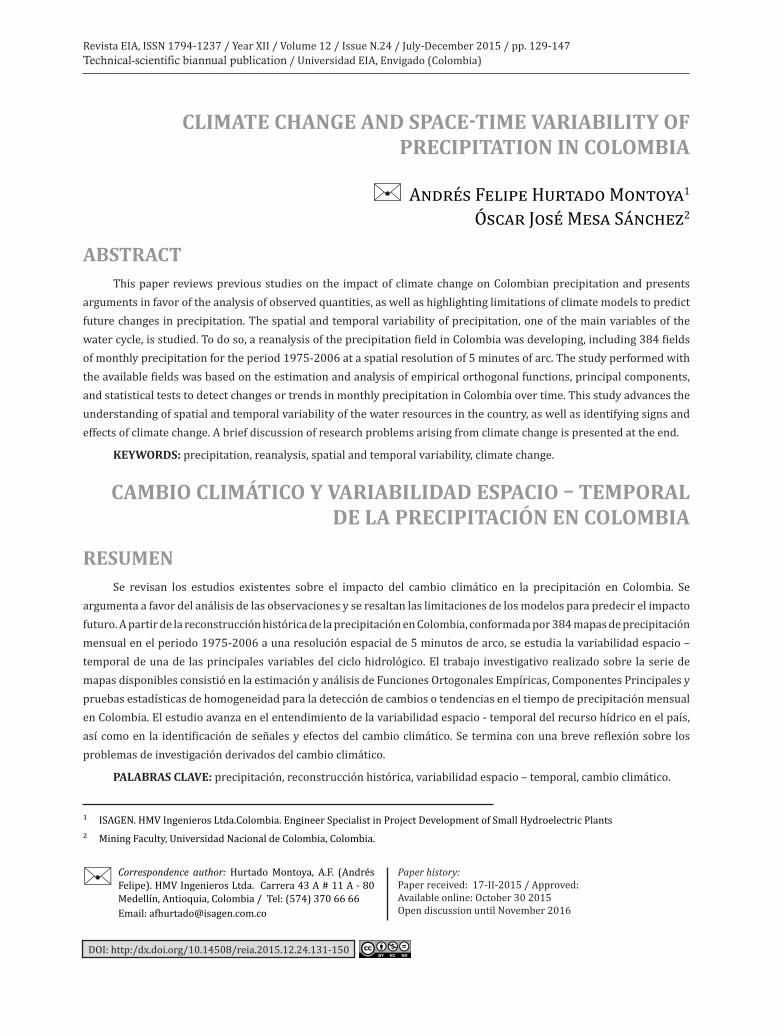
CLIMATE CHANGE AND SPACE-TIME VARIABILITY OF PRECIPITATION IN COLOMBIA
Andrés Felipe Hurtado Montoya1
Óscar José Mesa Sánchez2
ABSTRACTThis paper reviews previous studies on the impact of climate change on Colombian precipitation and presents
arguments in favor of the analysis of observed quantities, as well as highlighting limitations of climate models to predict future changes in precipitation. The spatial and temporal variability of precipitation, one of the main variables of the water cycle, is studied. To do so, a reanalysis of the precipitation field in Colombia was developing, including 384 fields of monthly precipitation for the period 1975-2006 at a spatial resolution of 5 minutes of arc. The study performed with the available fields was based on the estimation and analysis of empirical orthogonal functions, principal components, and statistical tests to detect changes or trends in monthly precipitation in Colombia over time. This study advances the understanding of spatial and temporal variability of the water resources in the country, as well as identifying signs and effects of climate change. A brief discussion of research problems arising from climate change is presented at the end.
KEYWORDS: precipitation, reanalysis, spatial and temporal variability, climate change.
CAMBIO CLIMÁTICO Y VARIABILIDAD ESPACIO – TEMPORAL DE LA PRECIPITACIÓN EN COLOMBIA
RESUMENSe revisan los estudios existentes sobre el impacto del cambio climático en la precipitación en Colombia. Se
argumenta a favor del análisis de las observaciones y se resaltan las limitaciones de los modelos para predecir el impacto futuro. A partir de la reconstrucción histórica de la precipitación en Colombia, conformada por 384 mapas de precipitación mensual en el periodo 1975-2006 a una resolución espacial de 5 minutos de arco, se estudia la variabilidad espacio – temporal de una de las principales variables del ciclo hidrológico. El trabajo investigativo realizado sobre la serie de mapas disponibles consistió en la estimación y análisis de Funciones Ortogonales Empíricas, Componentes Principales y pruebas estadísticas de homogeneidad para la detección de cambios o tendencias en el tiempo de precipitación mensual en Colombia. El estudio avanza en el entendimiento de la variabilidad espacio - temporal del recurso hídrico en el país, así como en la identificación de señales y efectos del cambio climático. Se termina con una breve reflexión sobre los problemas de investigación derivados del cambio climático.
PALABRAS CLAVE: precipitación, reconstrucción histórica, variabilidad espacio – temporal, cambio climático.
Revista EIA, ISSN 1794-1237 / Year XII / Volume 12 / Issue N.24 / July-December 2015 / pp. 129-147Technical-scientific biannual publication / Universidad EIA, Envigado (Colombia)
¹ ISAGEN. HMV Ingenieros Ltda.Colombia. Engineer Specialist in Project Development of Small Hydroelectric Plants
² Mining Faculty, Universidad Nacional de Colombia, Colombia.
Correspondence author: Hurtado Montoya, A.F. (Andrés Felipe). HMV Ingenieros Ltda. Carrera 43 A # 11 A - 80 Medellín, Antioquia, Colombia / Tel: (574) 370 66 66 Email: [email protected]
Paper history: Paper received: 17-II-2015 / Approved:Available online: October 30 2015Open discussion until November 2016
DOI: http:/dx.doi.org/10.14508/reia.2015.12.24.131-150
130
Climate Change and Space-time Variability of Precipitation in Colombia
Rev.EIA.Esc.Ing.Antioq / Escuela de Ingeniería de Antioquia
AS ALTERAÇÕES CLIMÁTICAS E A VARIABILIDADE ESPAÇO – TEMPORAL DA CHUVA TEMPO NA COLÔMBIA
RESUMORevisam-se os estudos existentes sobre o impacto das alterações climáticas sobre a precipitação na Colômbia. Ele
defende a análise das observações e limitações dos modelos são destacados para prever o impacto futuro. A partir da reconstrução histórica de precipitação na Colômbia, que compreende 384 mapas de precipitação mensal no período de 1975 a 2006 em uma resolução espacial de 5 minutos de arco, é estudado a variabilidade espaço hidrológico. A pesqui-sa realizada sobre o número de mapas disponíveis consistiu da estimativa e análise de funções ortogonais empíricas, componentes principais e testes estatísticos de homogeneidade para a detecção de alterações ou tendências ao longo do tempo precipitação mensal na Colômbia. O estudo avança na compreensão da variabilidade espaço – temporal dos re-cursos hídricos no país, bem como na identificação de sinais e efeitos da mudança climática. Ele termina com uma breve reflexão sobre os problemas de pesquisa de mudanças climáticas.
PALAVRAS-CHAVE: precipitação, reconstrução histórica, mudança espaço – temporal, mudança climática.
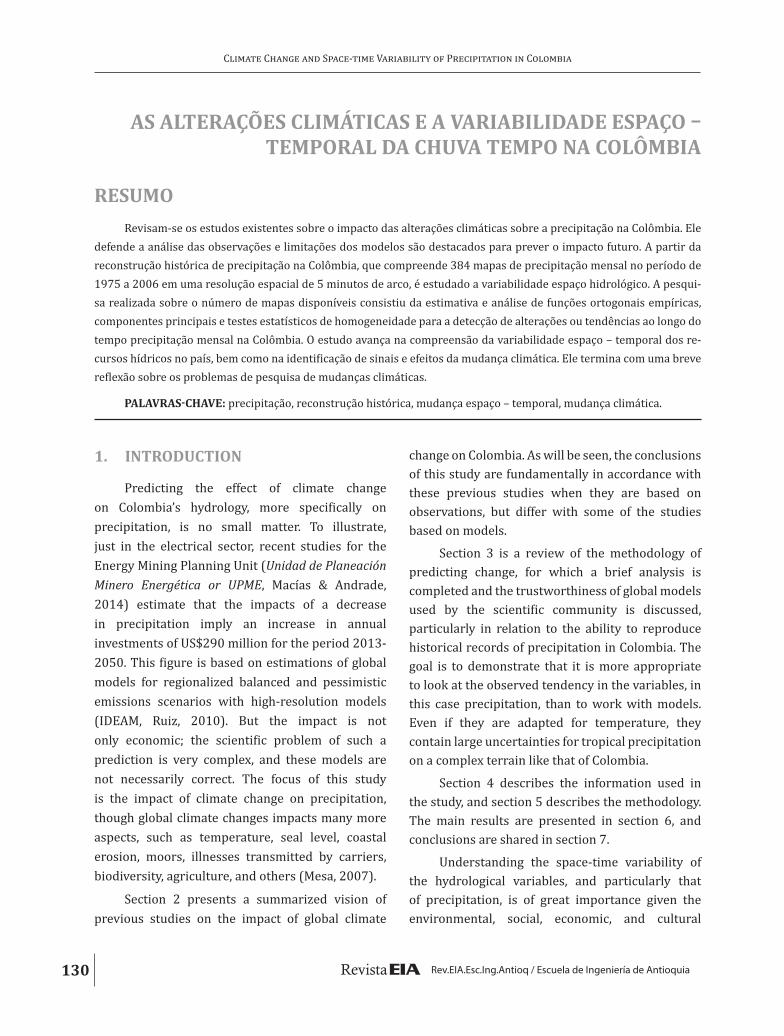
1. INTRODUCTION
Predicting the effect of climate change on Colombia’s hydrology, more specifically on precipitation, is no small matter. To illustrate, just in the electrical sector, recent studies for the Energy Mining Planning Unit (Unidad de Planeación Minero Energética or UPME, Macías & Andrade, 2014) estimate that the impacts of a decrease in precipitation imply an increase in annual investments of US$290 million for the period 2013-2050. This figure is based on estimations of global models for regionalized balanced and pessimistic emissions scenarios with high-resolution models (IDEAM, Ruiz, 2010). But the impact is not only economic; the scientific problem of such a prediction is very complex, and these models are not necessarily correct. The focus of this study is the impact of climate change on precipitation, though global climate changes impacts many more aspects, such as temperature, seal level, coastal erosion, moors, illnesses transmitted by carriers, biodiversity, agriculture, and others (Mesa, 2007).
Section 2 presents a summarized vision of previous studies on the impact of global climate
change on Colombia. As will be seen, the conclusions of this study are fundamentally in accordance with these previous studies when they are based on observations, but differ with some of the studies based on models.
Section 3 is a review of the methodology of predicting change, for which a brief analysis is completed and the trustworthiness of global models used by the scientific community is discussed, particularly in relation to the ability to reproduce historical records of precipitation in Colombia. The goal is to demonstrate that it is more appropriate to look at the observed tendency in the variables, in this case precipitation, than to work with models. Even if they are adapted for temperature, they contain large uncertainties for tropical precipitation on a complex terrain like that of Colombia.
Section 4 describes the information used in the study, and section 5 describes the methodology. The main results are presented in section 6, and conclusions are shared in section 7.
Understanding the space-time variability of the hydrological variables, and particularly that of precipitation, is of great importance given the environmental, social, economic, and cultural
131
Andrés Felipe Hurtado Montoya, Óscar José Mesa Sánchez
ISSN 1794-1237 / Volume 12 / Issue 24 / July-December 2015 / pp. 129-147
implications of the distribution of water resources in any country. Further, analyzing hydrological processes in a context of climate change not only incorporates a greater complexity to said processes, but also implies the necessity of combining efforts for understanding the national hydrology in order to achieve better management of this resource. That is the main goal of this study, which is centered on using precipitation information and mathematical techniques to identify and interpret evidence of climate change in Colombia.
Hydrological records in Colombia are generally scarce, both in terms of quality and of their duration and spatial coverage. Geographical and climate complexity is added to this limitation. The result is a special challenge for hydrology knowledge on appropriate spatial and temporal scales for fundamental applications like proposing sustainable development of the territory and its water resources, disaster prevention, improved knowledge of the influence of macro-climatic phenomena, which could allow us to develop better predictions, or evaluating the possible impacts of global climate change (Hurtado & Mesa, 2014).
In order to determine the evidence and effects of climate change on Colombian hydrology, this paper studies space-time variability of precipitation throughout the country based on historical reconstruction (1975-2006) of the monthly precipitation fields proposed by Hurtado and Mesa (2014).
The use of maps and distributed precipitation fields is justified given the limitations on specific information and its inadequate distribution throughout the country. In addition, utilizing historical reconstruction of one of the main variables of the hydrological cycle, the study of trends and historical homogeneity that can indicate manifestations of climate change, is of great interest for planning the country’s water resource and preventing disasters.
2. PREVIOUS STUDIES
The climatology of precipitation in Colombia is described in various papers (Trojer, 1959; Snow, 1976; Oster, 1979; Eslava, 1993; Mesa, Poveda & Carvajal, 1997; Mejía et al., 1999; Poveda, 2004; Hurtado & Mesa, 2014). The principal control is the stage, twice yearly, of the inter-tropical convergence zone that marks the rainy periods of April-May and September-November throughout the majority of the territory and the periods with less precipitation of December-February and June-August. The spatial distribution is marked by the sources of humidity in the Caribbean, the Pacific, and the Amazon region given the topography and prevailing winds. Inter-year variability is fundamentally controlled by the El Niño-Southern Oscillation in the tropical Pacific (Poveda & Mesa, 1997; Poveda, 2004; Poveda, Álvarez & Rueda, 2011).
Several studies have found evidence of climate change in Colombia using different statistical techniques and using variables with different record durations. The main studies are those by Smith et al. (1996), Mesa, Poveda & Carvajal (1997), Quintana-Gómez (1999), Pabón (2003), Vuille et al. (2003), Ochoa & Poveda (2008), Cantor (2011), Cantor & Ochoa (2011), and Carmona & Poveda (2014). In summary, these studies identify growing trends in temperature and minimum temperature at a significant number of stations and mixed trends in precipitation, depending on the stations, with similar season percentages for each trend and 20% without statistically significant trends for series of up to 40 years without records. For precipitation stations with longer records, the majority (63%) show growing trends, and only 16% show decreasing trends. No clear geographical pattern has been identified to locate areas with a given trend, except for the Pacific plains, which have a greater defined growing trend explained by the growing trend of humidity influx from the Pacific and the Choco Stream.
132
Climate Change and Space-time Variability of Precipitation in Colombia
Rev.EIA.Esc.Ing.Antioq / Escuela de Ingeniería de Antioquia
These conclusions are confirmed in the report by IDEAM, Mayorga, Hurtado & Benavides (2011), in which 310 precipitation stations with monthly records for the period of 1970-2010 were analyzed using the program RCLIMDEX developed by the working group CCl/CLIVAR (Climate and Ocean: Variability, Predictability and Change), part of the World Climate Research Programme of the World Meteorological Organization and Unesco to detect climate change as a coordinated international effort in order to have indices calculated with the same methodology that can be internationally integrated (Peterson, 2005). Of the 310 precipitation stations, 71% show a growing trend, 7% show no trend, and 22% show a decreasing trend. Likewise, the conclusion related to rising temperatures is confirmed with an increase of 0.17°C per decade. It is important to cite this report:
… the generalized increase in precipitation is noteworthy in the country. The northwestern area (Antioquia and Choco) stand out, as do Vichada, Piedemonte de Putumayo, and Providence Island, where we observe the most significant increase. The opposite is occurring on San Andres Island, on the eastern slopes of the Eastern Chain (Arauca and Casanare), and in broad areas of the Alto Cauca, where we observe a decrease in precipitation. The greatest decrease is occurring in the southwest of the territory (Peterson, 2005).
The above summary is in contrast with the following quote from the UPME study:
According to these analyses, which included information from 1971 through 2000 from all of the measuring stations in the country, we found a negative trend in precipitation in a large part of the Andean region, the southern Pacific region, and Piedemonte Llanero in Orinoquia. Likewise, we found an increase in precipitation in the Caribbean region, the rest of the Pacific, and the Amazon region (UPME, Macías & Andrade, 2014: p. 36).
We will later discuss a possible explanation for this inconsistency.
We must mention that the trends observed may be due to causes other than global warming because of the increase of greenhouse gases, such as deforestation and urbanization, among others. There are various papers that have studied the effect of heat islands on the trends observed in the temperature records (Hansen et al., 2010; Hausfather et al., 2013), and the general conclusion is that warming due to the greenhouse effect is real.
The impact of deforestation must also be considered. For example, the study by Salazar (2011) concludes, after a numerical experiment, that a possible drastic future change in the Amazon region’s cover would cause a reduction in precipitation in Colombia to the extent of 300 mm/year.
The warming of the Colombian Andes has led to the complete extinction of eight tropical glaciers, and the six remaining snow-capped peaks are losing ice at accelerated rates (Rabatel et al., 2012). The moors, unique and strategic ecosystems for supplying water to several cities including Bogota and Medellin, are also being threatened by warming and other anthropogenic activities (Ruiz, et al., 2008).
Warming also means an increase in saturation vapor pressure in the air according to the Clausius-Clapeyron equation. Globally, it has been observed that this increase is accompanied by an increase in evaporation, and therefore in absolute humidity to maintain approximately constant relative humidity (Stevens & Bony, 2013). Several series of tank evaporation and relative humidity confirm this observation for Colombia (Mesa et al., 1997). The consequences of this are important to understanding the physical mechanisms associated with the impact of warming on precipitation and river volumes.
The study by Mesa et al. (1997) reports that a good part of the volume series in the Magdalena-Cauca basins have a decreasing trend. Recently, Carmona & Poveda (2014) confirm and/or reinforce this conclusion about these trends
133
Andrés Felipe Hurtado Montoya, Óscar José Mesa Sánchez
ISSN 1794-1237 / Volume 12 / Issue 24 / July-December 2015 / pp. 129-147
through their analysis of the same series with new years of observations and of other series that were not analyzed in the original study. The number of stations with a decreasing trend is greater (from 61% to 100% depending on the length of the record, the first value for records of 25 years and the latter for records of more than 50 years) than the number of stations that show a growing trend (0% to 34%). The regional increasing trend is noteworthy for the Atrato and San Juan volumes, which show growing trends and coincide with areas of a high growing trend regarding precipitation.
Another line of work has been the use of global climate models (GCM): Pabón (2005); IDEAM, Ruiz (2007 and 2010), and Colombia (2010). These models appropriately represent a good part of the physical processes, though not all of them, especially tropical and topographical convection, which are essential to rain in Colombia. In addition, spatial resolution is not generally appropriate for regional studies. In general, there is a possibility of rectifying these deficiencies through the use of mesoscale models which have a finer spatial resolution and better represent convective processes. This methodology, known as downscaling, has advanced but is not free of difficulties. We will present the main results of the studies based on these strategies, and in the following section analyze their foundations in greater detail.
It is important to cite IDEAM & Ruiz (2010: p. 10) to present the results of the low-resolution global models:
For rain and with the use of low-resolution global models, Pabón (2005) maintains that annual precipitation would be reduced in some regions and increased in others. The regions in which there is a certain degree of coincidence in the majority of the models and current trends regarding an increase are: the North and Central Pacific, the Medio Magdalena, the Bogota Savannah, the Sogamoso, Catatumbo, and Arauca river basins, Piedemonte Llanero, central Orinoqua, the central Amazon region,
and Piedemonte in the Amazon region, places for which the increase in rain compared to the typical period 1961-1990 can fall between 10% and 15% by 2050 and between 15% and 25% by the year 2080. For the remaining regions, the study states that it is difficult to arrive to a concrete result since the different models present contradictory results.
According to this quote, for various regions, for example the Pacific, there is a coincidence between the results of the models and the trends observed in the precipitation station records. There is not consistency for Arauca and Casanare, and for various other regions, the results of the models are not consistent.
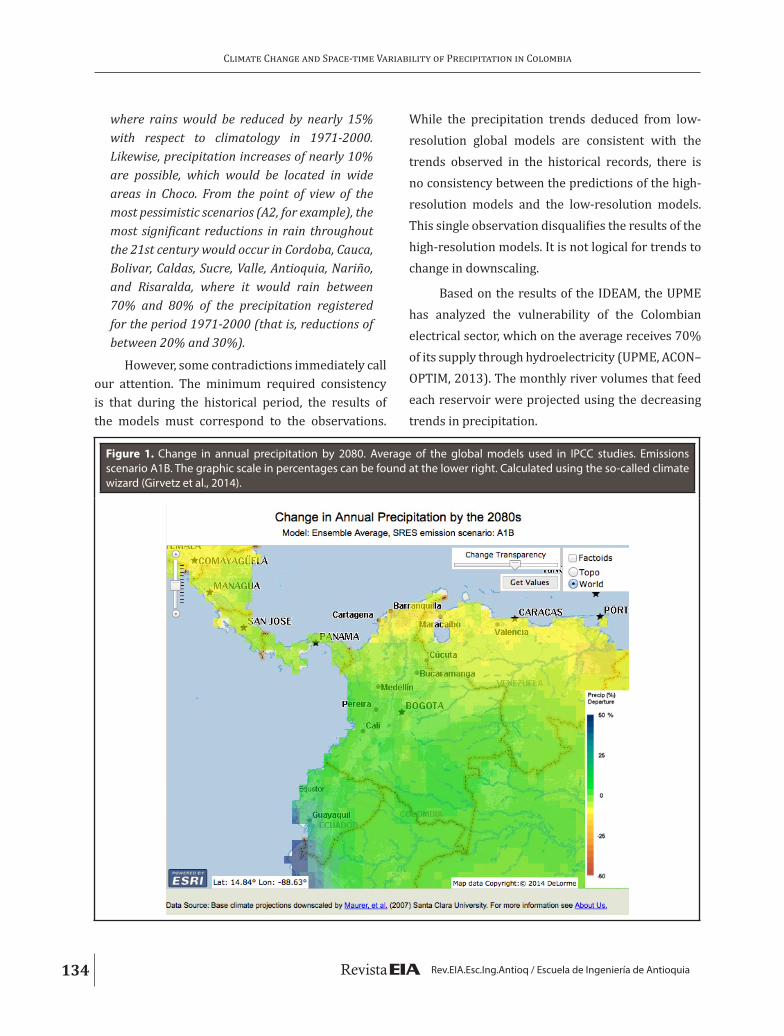
There is an Internet page, http://www.cli-matewizard.org/, which allows us to visualize the results of the models used by the IPCC to predict the impacts of climate change under different emissions scenarios. Figure 1 presents the map that corre-sponds to the change in precipitation in Colombia in scenario A1B for the average of the models. As can be seen for all of Colombia, except the most norther-ly zone, there is an increase of approximately 10%. If one examines the models individually or even the lowest predictions (20%), the general trend is main-tained, although the magnitudes of the changes gen-erally decrease for the majority of Colombia, where the trend remains positive and the northern zone of decrease grows in extension and magnitude.
The high-resolution models used by Pabón (2005), IDEAM & Ruiz (2007), IDEAM & Ruiz (2010), and Colombia (2010) were the regional PRECIS (Providing Regional Climates for Impacts Studies) model from the United Kingdom and the global model GSM- MRI (Global Spectral Model) from Japan. The results obtained can be summarized by citing the 2nd Communication:
The areas which, on the average for the end of the 21st century, would present the greatest reductions in precipitation would be located in the departments of Huila, Putumayo, Nariño, Cauca, Tolima, Cordoba, Bolivar, and Risaralda,
134
Climate Change and Space-time Variability of Precipitation in Colombia
Rev.EIA.Esc.Ing.Antioq / Escuela de Ingeniería de Antioquia
where rains would be reduced by nearly 15% with respect to climatology in 1971-2000. Likewise, precipitation increases of nearly 10% are possible, which would be located in wide areas in Choco. From the point of view of the most pessimistic scenarios (A2, for example), the most significant reductions in rain throughout the 21st century would occur in Cordoba, Cauca, Bolivar, Caldas, Sucre, Valle, Antioquia, Nariño, and Risaralda, where it would rain between 70% and 80% of the precipitation registered for the period 1971-2000 (that is, reductions of between 20% and 30%).
However, some contradictions immediately call our attention. The minimum required consistency is that during the historical period, the results of the models must correspond to the observations.
While the precipitation trends deduced from low-resolution global models are consistent with the trends observed in the historical records, there is no consistency between the predictions of the high-resolution models and the low-resolution models. This single observation disqualifies the results of the high-resolution models. It is not logical for trends to change in downscaling.
Based on the results of the IDEAM, the UPME has analyzed the vulnerability of the Colombian electrical sector, which on the average receives 70% of its supply through hydroelectricity (UPME, ACON–OPTIM, 2013). The monthly river volumes that feed each reservoir were projected using the decreasing trends in precipitation.
Figure 1. Change in annual precipitation by 2080. Average of the global models used in IPCC studies. Emissions scenario A1B. The graphic scale in percentages can be found at the lower right. Calculated using the so-called climate wizard (Girvetz et al., 2014).
135
Andrés Felipe Hurtado Montoya, Óscar José Mesa Sánchez
ISSN 1794-1237 / Volume 12 / Issue 24 / July-December 2015 / pp. 129-147
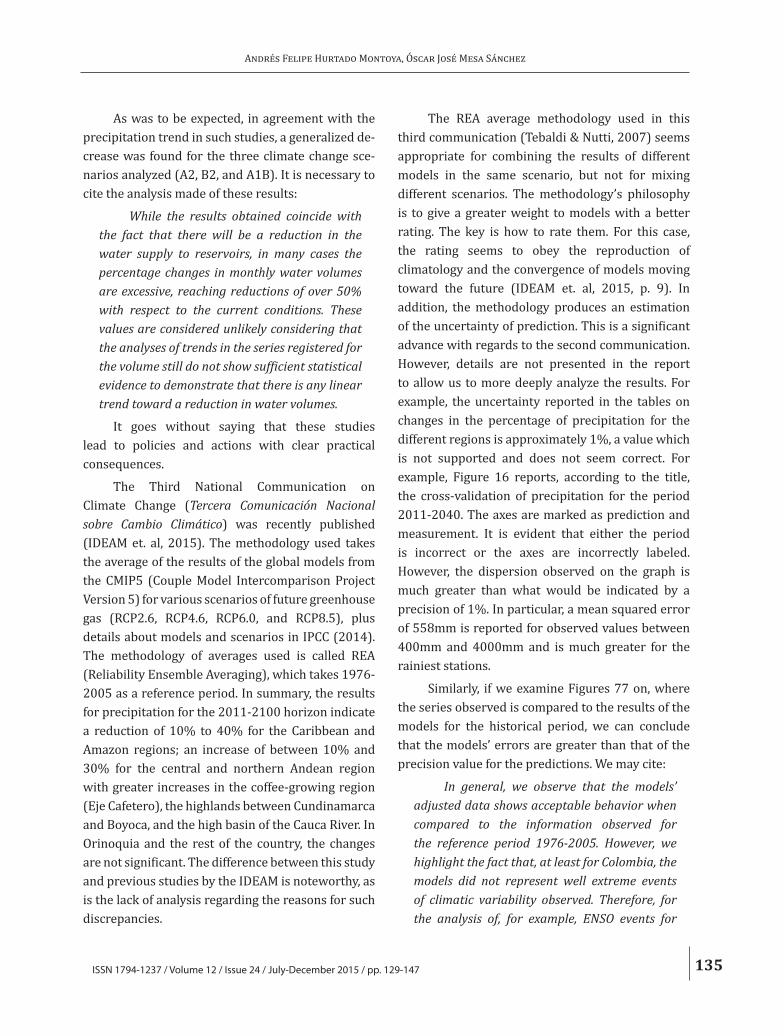
As was to be expected, in agreement with the precipitation trend in such studies, a generalized de-crease was found for the three climate change sce-narios analyzed (A2, B2, and A1B). It is necessary to cite the analysis made of these results:
While the results obtained coincide with the fact that there will be a reduction in the water supply to reservoirs, in many cases the percentage changes in monthly water volumes are excessive, reaching reductions of over 50% with respect to the current conditions. These values are considered unlikely considering that the analyses of trends in the series registered for the volume still do not show sufficient statistical evidence to demonstrate that there is any linear trend toward a reduction in water volumes.
It goes without saying that these studies lead to policies and actions with clear practical consequences.
The Third National Communication on Climate Change (Tercera Comunicación Nacional sobre Cambio Climático) was recently published (IDEAM et. al, 2015). The methodology used takes the average of the results of the global models from the CMIP5 (Couple Model Intercomparison Project Version 5) for various scenarios of future greenhouse gas (RCP2.6, RCP4.6, RCP6.0, and RCP8.5), plus details about models and scenarios in IPCC (2014). The methodology of averages used is called REA (Reliability Ensemble Averaging), which takes 1976-2005 as a reference period. In summary, the results for precipitation for the 2011-2100 horizon indicate a reduction of 10% to 40% for the Caribbean and Amazon regions; an increase of between 10% and 30% for the central and northern Andean region with greater increases in the coffee-growing region (Eje Cafetero), the highlands between Cundinamarca and Boyoca, and the high basin of the Cauca River. In Orinoquia and the rest of the country, the changes are not significant. The difference between this study and previous studies by the IDEAM is noteworthy, as is the lack of analysis regarding the reasons for such discrepancies.
The REA average methodology used in this third communication (Tebaldi & Nutti, 2007) seems appropriate for combining the results of different models in the same scenario, but not for mixing different scenarios. The methodology’s philosophy is to give a greater weight to models with a better rating. The key is how to rate them. For this case, the rating seems to obey the reproduction of climatology and the convergence of models moving toward the future (IDEAM et. al, 2015, p. 9). In addition, the methodology produces an estimation of the uncertainty of prediction. This is a significant advance with regards to the second communication. However, details are not presented in the report to allow us to more deeply analyze the results. For example, the uncertainty reported in the tables on changes in the percentage of precipitation for the different regions is approximately 1%, a value which is not supported and does not seem correct. For example, Figure 16 reports, according to the title, the cross-validation of precipitation for the period 2011-2040. The axes are marked as prediction and measurement. It is evident that either the period is incorrect or the axes are incorrectly labeled. However, the dispersion observed on the graph is much greater than what would be indicated by a precision of 1%. In particular, a mean squared error of 558mm is reported for observed values between 400mm and 4000mm and is much greater for the rainiest stations.
Similarly, if we examine Figures 77 on, where the series observed is compared to the results of the models for the historical period, we can conclude that the models’ errors are greater than that of the precision value for the predictions. We may cite:
In general, we observe that the models’ adjusted data shows acceptable behavior when compared to the information observed for the reference period 1976-2005. However, we highlight the fact that, at least for Colombia, the models did not represent well extreme events of climatic variability observed. Therefore, for the analysis of, for example, ENSO events for
136
Climate Change and Space-time Variability of Precipitation in Colombia
Rev.EIA.Esc.Ing.Antioq / Escuela de Ingeniería de Antioquia
the future climate, there is not a clear tendency toward increase or decrease in precipitation (except for the north of Colombia), and comparing the RCPs to each other, there are no significant differences modeled for precipitation volumes (IDEAM et al. 2015, p. 157).
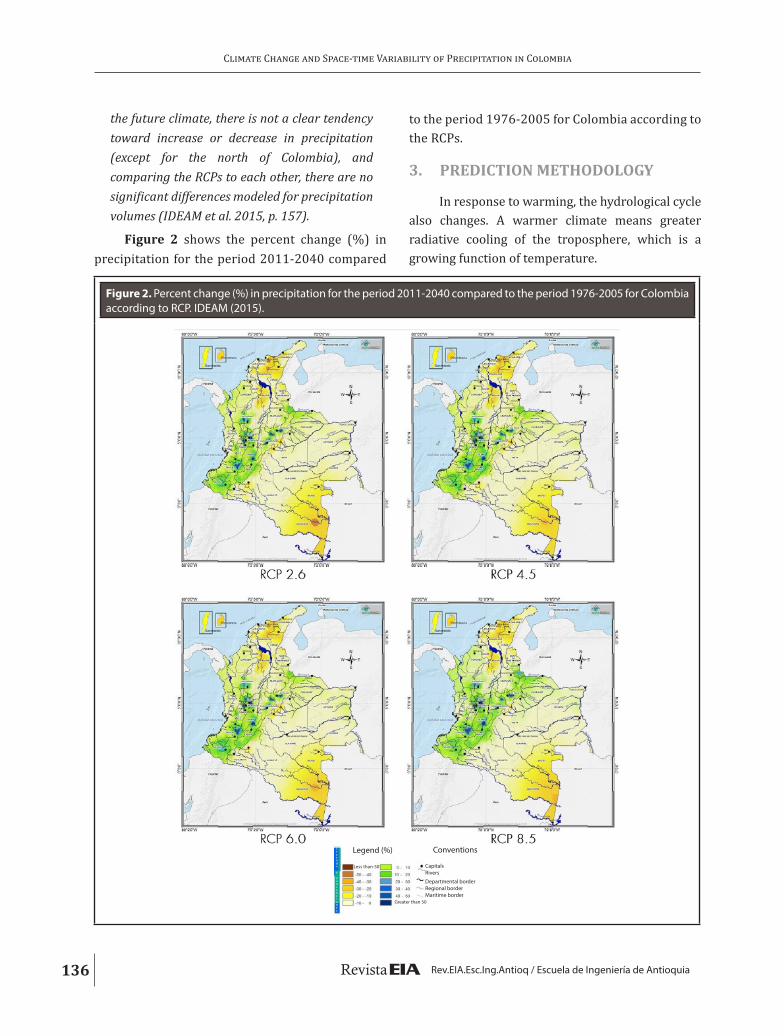
Figure 2 shows the percent change (%) in precipitation for the period 2011-2040 compared
to the period 1976-2005 for Colombia according to the RCPs.
3. PREDICTION METHODOLOGY
In response to warming, the hydrological cycle also changes. A warmer climate means greater radiative cooling of the troposphere, which is a growing function of temperature.
Figure 2. Percent change (%) in precipitation for the period 2011-2040 compared to the period 1976-2005 for Colombia according to RCP. IDEAM (2015).
Less than-50
Legend (%) Conventions
CapitalsRivers
Departmental borderRegional borderMaritime border
Greater than 50
137
Andrés Felipe Hurtado Montoya, Óscar José Mesa Sánchez
ISSN 1794-1237 / Volume 12 / Issue 24 / July-December 2015 / pp. 129-147
The greatest emissions of infrared radiation correspond to the balance required to compensate for the increased radiation absorbed. As cooling is balanced with changes in cloud cover or in the absorption of radiation by the water vapor, there will be changes in precipitation. Regionally, winds will determine where there is an increase or a decrease. If the winds change little compared to the humidity they transport, the wet regions will import more water and will be wetter, while the drier regions will be drier (Mitchell, Wilson & Cunnington, 1987; Wentz, et al., 2007; Soden & Held, 2006). The words used to describe these trends are “the rich get richer and the poor get poorer.” Or, translating this to hydrological language, the rainiest areas will become even rainier, and the dry regions will become drier. Given this general observation based on the trends observed worldwide and on a clear physical argument, we can reasonably expect an increase in precipitation for Colombia as a consequence of global warming. Within this logic, there are other details which make sense and have been mentioned, such as the Pacific area being the region with the greatest degree of increase in precipitation and the area near La Guajira being the only region in Colombia for which a decreasing trend has been predicted by the low-resolution global models.
A first approach to the magnitude of these changes comes from the Clapeyron equation for expressing the dependence of saturation vapor pressure on temperature and energy balance considerations (Stevens & Bony, 2009),
ΔP ≅ ΔR+β
(P – E) Δ ln Ts ,Ts
where ΔR is the change in the atmosphere’s net cooling rate, P and E measure precipitation and evaporation in units of enthalpy flow, Ts is the surface temperature, and β is approximately equal to the relationship between vaporization enthalpy and the constant of water vapor gases. The equation allows us to explain the changes in precipitation predicted by the different models despite their complexity and to modulate the trustworthiness of regional
predictions about precipitation changes derived from global warming scenarios like, for example, experiments to determine sensitivity to doubled concentrations of CO2. The final term emphasizes the coupling of global circulation patterns and precipitation. This analysis again reinforces what was expressed in the previous paragraph.
There are some previous studies on the validation of results of global climate models (Vélez, Ochoa & Poveda, 2014) against precipitation observations. The validation is not satisfactory. Also, a previous study, Acevedo (2009), found quite poor correlations between the precipitation fields in Colombia and the results of 4 global models by the IPCC (ECHAM5, CCSM3, HADGEM1, and MIROC 3.2 HIRES).
A systematic comparison of the precipitation fields calculated by the IPCC global models with the observations in the historical period has not been done, and it is fundamental that it be carried out. This evaluation is fundamental to interpreting the predictions for the different future scenarios of climate change.
To conclude regarding the models, the statement by Mesa (2007: p. 117) is still valid: “there is a very large historical mark on the climate community that has led to an inflation of the role of models. Without ignoring their usefulness and importance, models have serious problems of verification, compilation, scale, and determinism.”
The problems of verification refer to the impossibility of verification due to the number of adjustable parameters.
The difficulty of complication refers to the excessive incorporation of components and processes that have made them as inscrutable as nature itself.
Models are very dependent on scale. Due to the scale, some phenomena like turbulence and changes of state are not represented, but rather set as parameters. But those phenomena, which are poorly
138
Climate Change and Space-time Variability of Precipitation in Colombia
Rev.EIA.Esc.Ing.Antioq / Escuela de Ingeniería de Antioquia
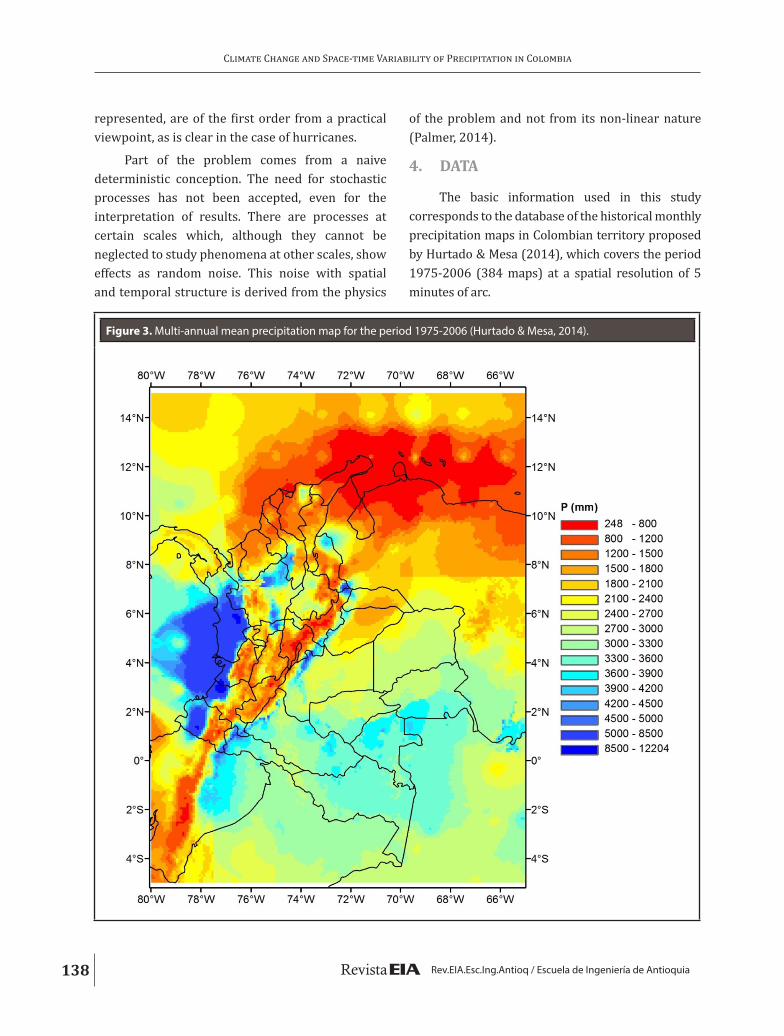
Figure 3. Multi-annual mean precipitation map for the period 1975-2006 (Hurtado & Mesa, 2014).
represented, are of the first order from a practical viewpoint, as is clear in the case of hurricanes.
Part of the problem comes from a naive deterministic conception. The need for stochastic processes has not been accepted, even for the interpretation of results. There are processes at certain scales which, although they cannot be neglected to study phenomena at other scales, show effects as random noise. This noise with spatial and temporal structure is derived from the physics
of the problem and not from its non-linear nature (Palmer, 2014).
4. DATA
The basic information used in this study corresponds to the database of the historical monthly precipitation maps in Colombian territory proposed by Hurtado & Mesa (2014), which covers the period 1975-2006 (384 maps) at a spatial resolution of 5 minutes of arc.
139
Andrés Felipe Hurtado Montoya, Óscar José Mesa Sánchez
ISSN 1794-1237 / Volume 12 / Issue 24 / July-December 2015 / pp. 129-147
The methodology used to calculate the maps consisted of an optimal integration of specific information on a monthly scale (2,270 stations), topography, and monthly series of distributed fields from satellite measurements and studies on assimilated data available for different time periods and at varied spatial resolutions.
The incorporation of topography in the estimation of the precipitation maps consisted of implementing an interpolation model based on the original hypothesis and methodology of the PRISM model (Daly et al., 1994), which consists of considering the topographical effect as the main factor for explaining spatial variability of precipitation. The model’s development consisted basically of appropriately representing the optimum pluviograph, inter-station variability, and the amount of precipitation water according to specific information.
In Hurtado & Mesa (2014) and Hurtado (2009), we find the procedure and characteristics of the data-base. Figure 3 shows the multi-annual precipitation map obtained from the 384 monthly precipitation maps from the period 1975-2006.
5. METHODOLOGY
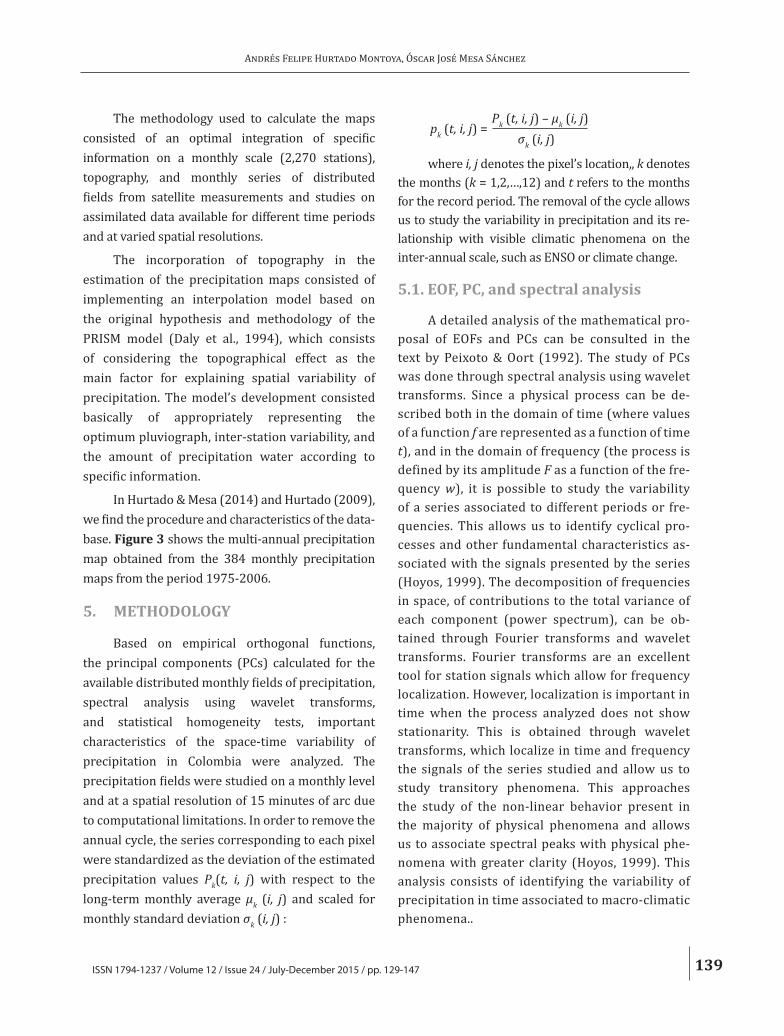
Based on empirical orthogonal functions, the principal components (PCs) calculated for the available distributed monthly fields of precipitation, spectral analysis using wavelet transforms, and statistical homogeneity tests, important characteristics of the space-time variability of precipitation in Colombia were analyzed. The precipitation fields were studied on a monthly level and at a spatial resolution of 15 minutes of arc due to computational limitations. In order to remove the annual cycle, the series corresponding to each pixel were standardized as the deviation of the estimated precipitation values Pk(t, i, j) with respect to the long-term monthly average μk (i, j) and scaled for monthly standard deviation σk (i, j) :
pk (t, i, j) =Pk (t, i, j) – μk (i, j)
σk (i, j)
where i, j denotes the pixel’s location,, k denotes the months (k = 1,2,…,12) and t refers to the months for the record period. The removal of the cycle allows us to study the variability in precipitation and its re-lationship with visible climatic phenomena on the inter-annual scale, such as ENSO or climate change.
5.1. EOF, PC, and spectral analysis
A detailed analysis of the mathematical pro-posal of EOFs and PCs can be consulted in the text by Peixoto & Oort (1992). The study of PCs was done through spectral analysis using wavelet transforms. Since a physical process can be de-scribed both in the domain of time (where values of a function f are represented as a function of time t), and in the domain of frequency (the process is defined by its amplitude F as a function of the fre-quency w), it is possible to study the variability of a series associated to different periods or fre-quencies. This allows us to identify cyclical pro-cesses and other fundamental characteristics as-sociated with the signals presented by the series (Hoyos, 1999). The decomposition of frequencies in space, of contributions to the total variance of each component (power spectrum), can be ob-tained through Fourier transforms and wavelet transforms. Fourier transforms are an excellent tool for station signals which allow for frequency localization. However, localization is important in time when the process analyzed does not show stationarity. This is obtained through wavelet transforms, which localize in time and frequency the signals of the series studied and allow us to study transitory phenomena. This approaches the study of the non-linear behavior present in the majority of physical phenomena and allows us to associate spectral peaks with physical phe-nomena with greater clarity (Hoyos, 1999). This analysis consists of identifying the variability of precipitation in time associated to macro-climatic phenomena..
140
Climate Change and Space-time Variability of Precipitation in Colombia
Rev.EIA.Esc.Ing.Antioq / Escuela de Ingeniería de Antioquia
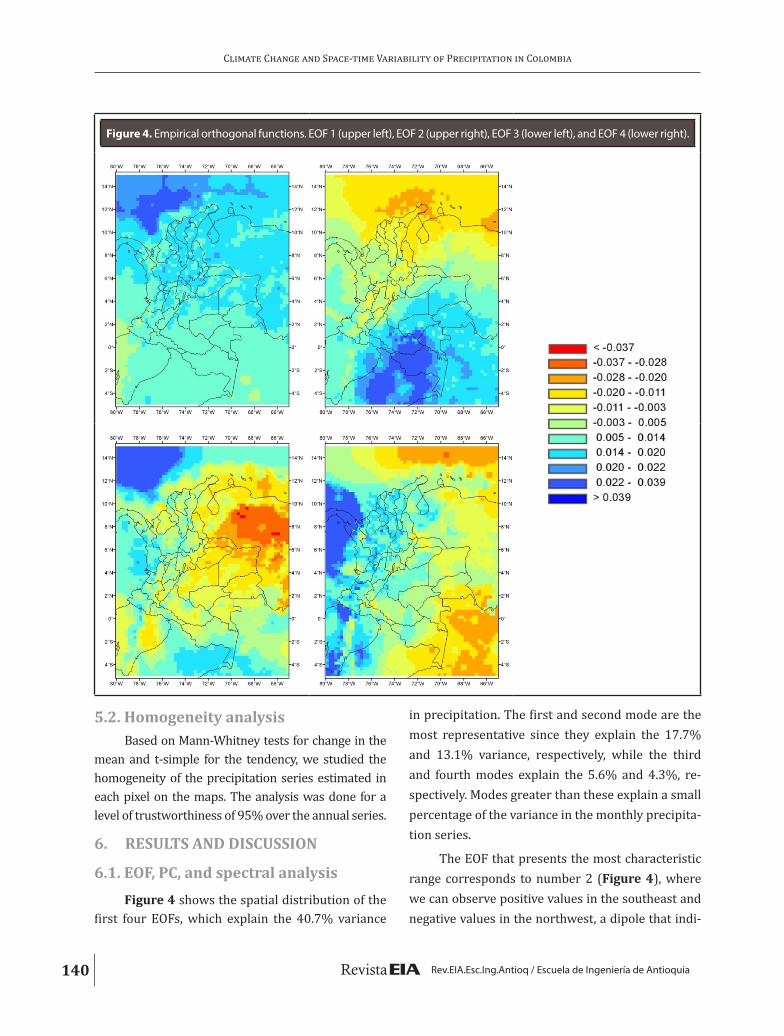
Figure 4. Empirical orthogonal functions. EOF 1 (upper left), EOF 2 (upper right), EOF 3 (lower left), and EOF 4 (lower right).
5.2. Homogeneity analysisBased on Mann-Whitney tests for change in the
mean and t-simple for the tendency, we studied the homogeneity of the precipitation series estimated in each pixel on the maps. The analysis was done for a level of trustworthiness of 95% over the annual series.
6. RESULTS AND DISCUSSION
6.1. EOF, PC, and spectral analysisFigure 4 shows the spatial distribution of the
first four EOFs, which explain the 40.7% variance
in precipitation. The first and second mode are the most representative since they explain the 17.7% and 13.1% variance, respectively, while the third and fourth modes explain the 5.6% and 4.3%, re-spectively. Modes greater than these explain a small percentage of the variance in the monthly precipita-tion series.
The EOF that presents the most characteristic range corresponds to number 2 (Figure 4), where we can observe positive values in the southeast and negative values in the northwest, a dipole that indi-
141
Andrés Felipe Hurtado Montoya, Óscar José Mesa Sánchez
ISSN 1794-1237 / Volume 12 / Issue 24 / July-December 2015 / pp. 129-147
cates a contrary behavior in precipitation variability and which is related to the climatic barrier imposed by the mountain system of the Andes. This charac-teristic and its relationship with the Andes chain are also shown when we analyze the space-time variability of the NDVI (Normalized Difference Veg-etation Index) and, specifically, its EOF 1 (Roldán et al., 2008). EOF 1 does not show a defined variability pattern, and EOFs 3 and 4 also show dipoles that are influenced by the Andes system.
The EOFs estimated for the original precipita-tion fields, that is, without removing the annual cy-cle through standardization (an analysis not shown in this paper), in addition to showing the influence of the mountain system of the Andes chain on the spatial variability of precipitation, also show a great similarity between the first EOF and the multi-annual precipitation map of Colombia (Figure 2), showing characteristic zones like the Pacific region and the Pi-edemonte Llanero.
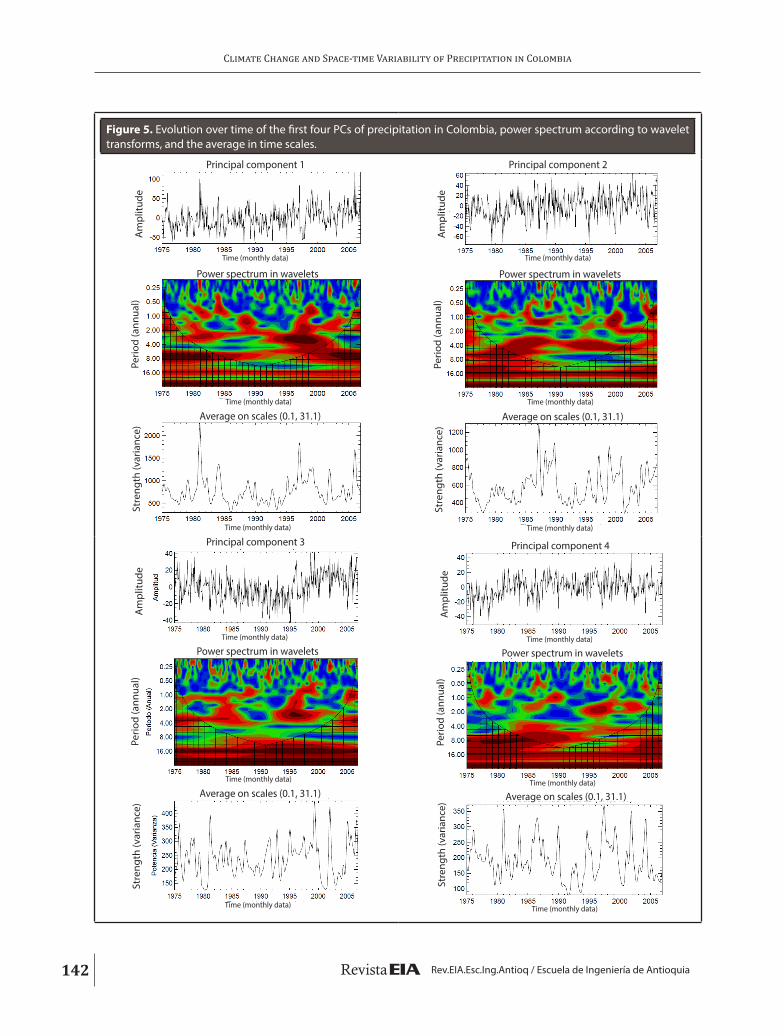
Figure 5 shows the time series corresponding to the first 4 PCs and of the wavelet transforms and the average on the power spectrum scales. The wave-let transform shows that the period associated with the occurrence of the ENSO phenomenon (2-7 years) is what explains the greater part of the precipitation variability in the area of study. In addition, wavelet transforms can be used to appreciate the influence of years characterized by the occurrence of strong events –La NIÑA and El NIÑO– on precipitation vari-ability, like those that correspond to the second half of the 1990s. The band associated with the 2-year pe-riod, mainly present in PC 1, may also be related to the quasi-biennial oscillation. When we observe the time series of the average in the scales (time series of averaged variance), we note features of non-station-arity in them, such as changes and/or growing trends in the variance of CP1 and CP3, mainly, which could be related to the particular phenomenology of ENSO and its relationship to climate change.
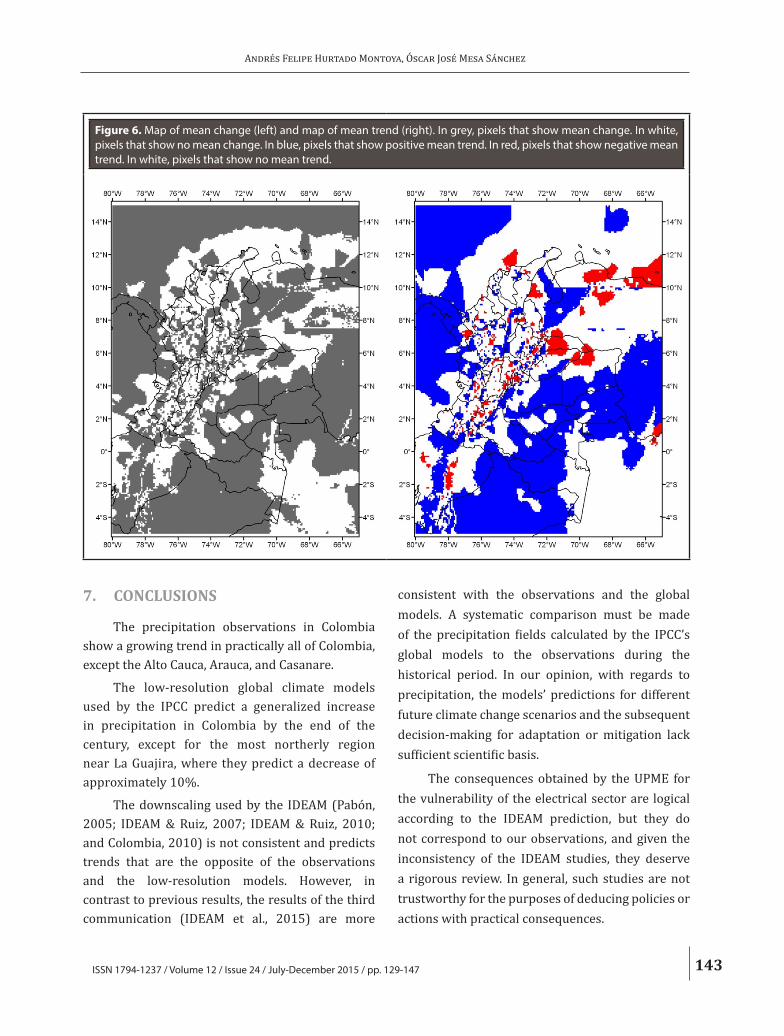
6.2. Homogeneity analysisIn Figure 6, we can see that in the greater
part of the study area, the series show change in the mean or a mean trend. In addition, in most cases in which a mean trend is seen, it is positive, suggesting greater annual quantities of precipitation. Negative trends are seen at some points on the Andean Chain and the north of the study area.
Although the presence of these characteristics in the precipitation series may be a direct consequence of climate change, we must consider that there is a significant degree of uncertainty inherent to the size of the samples (32 years), that the primary information (specific) and the secondary information (spatial maps) with which the database used in this study was constructed has problems of measurement and estimation, and that said database is also associated with an uncertainty that depends greatly on the number of precipitation stations in the country.
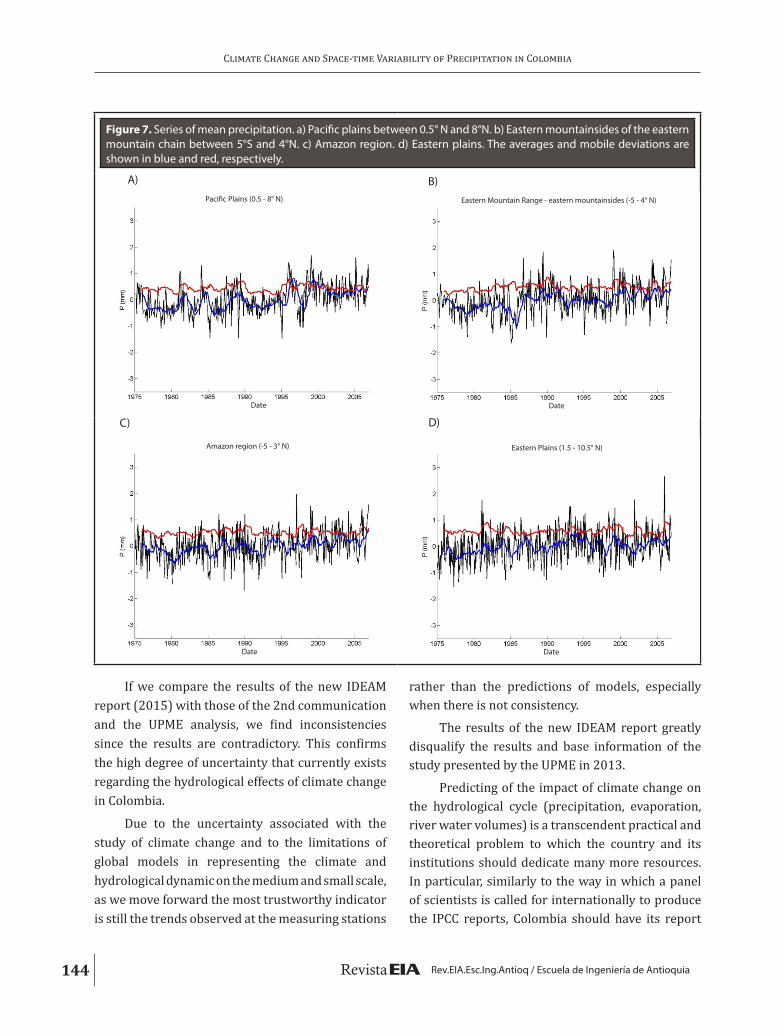
In order to carry out a regional analysis and not an analysis on each of the pixels, we obtained (stan-dardized) time series in 22 regions within the study area. Figure 7 shows some of these. Said series were obtained by averaging for each month the rain values of the pixels that make up a given region. In addition, the mean time series and mobile deviation of 12 months were constructed in order to visualize changes and/or trends in the series’ mean and variance.
In general, the mean precipitation values in each of the regions does not show changes or trends in the means, which was confirmed with the change in mean and trend tests described above. However, in the Pacific Plains region between 0.5°N and 8°N and on the eastern side of the Eastern Mountain Chain between 5°S and 4°N, we observed positive changes in the mean, while in the Amazon region and the Eastern Plains, we observed positive trends in the mean. These observations require further research in order to explain the precipitation variations over time and their possible association to climate change.
142
Climate Change and Space-time Variability of Precipitation in Colombia
Rev.EIA.Esc.Ing.Antioq / Escuela de Ingeniería de Antioquia
Figure 5. Evolution over time of the first four PCs of precipitation in Colombia, power spectrum according to wavelet transforms, and the average in time scales.
Principal component 1
Stre
ngth
(var
ianc
e)Pe
riod
(ann
ual)
Am
plitu
de
Power spectrum in wavelets
Time (monthly data)
Time (monthly data)
Time (monthly data)
Average on scales (0.1, 31.1)
Principal component 2
Stre
ngth
(var
ianc
e)Pe
riod
(ann
ual)
Am
plitu
de
Power spectrum in wavelets
Time (monthly data)
Time (monthly data)
Time (monthly data)
Average on scales (0.1, 31.1)
Principal component 3
Stre
ngth
(var
ianc
e)Pe
riod
(ann
ual)
Am
plitu
de
Power spectrum in waveletsTime (monthly data)
Time (monthly data)
Time (monthly data)
Average on scales (0.1, 31.1)
Principal component 4
Stre
ngth
(var
ianc
e)Pe
riod
(ann
ual)
Am
plitu
de
Power spectrum in waveletsTime (monthly data)
Time (monthly data)
Time (monthly data)
Average on scales (0.1, 31.1)
143
Andrés Felipe Hurtado Montoya, Óscar José Mesa Sánchez
ISSN 1794-1237 / Volume 12 / Issue 24 / July-December 2015 / pp. 129-147
Figure 6. Map of mean change (left) and map of mean trend (right). In grey, pixels that show mean change. In white, pixels that show no mean change. In blue, pixels that show positive mean trend. In red, pixels that show negative mean trend. In white, pixels that show no mean trend.
7. CONCLUSIONS
The precipitation observations in Colombia show a growing trend in practically all of Colombia, except the Alto Cauca, Arauca, and Casanare.
The low-resolution global climate models used by the IPCC predict a generalized increase in precipitation in Colombia by the end of the century, except for the most northerly region near La Guajira, where they predict a decrease of approximately 10%.
The downscaling used by the IDEAM (Pabón, 2005; IDEAM & Ruiz, 2007; IDEAM & Ruiz, 2010; and Colombia, 2010) is not consistent and predicts trends that are the opposite of the observations and the low-resolution models. However, in contrast to previous results, the results of the third communication (IDEAM et al., 2015) are more
consistent with the observations and the global models. A systematic comparison must be made of the precipitation fields calculated by the IPCC’s global models to the observations during the historical period. In our opinion, with regards to precipitation, the models’ predictions for different future climate change scenarios and the subsequent decision-making for adaptation or mitigation lack sufficient scientific basis.
The consequences obtained by the UPME for the vulnerability of the electrical sector are logical according to the IDEAM prediction, but they do not correspond to our observations, and given the inconsistency of the IDEAM studies, they deserve a rigorous review. In general, such studies are not trustworthy for the purposes of deducing policies or actions with practical consequences.
144
Climate Change and Space-time Variability of Precipitation in Colombia
Rev.EIA.Esc.Ing.Antioq / Escuela de Ingeniería de Antioquia
Figure 7. Series of mean precipitation. a) Pacific plains between 0.5° N and 8°N. b) Eastern mountainsides of the eastern mountain chain between 5°S and 4°N. c) Amazon region. d) Eastern plains. The averages and mobile deviations are shown in blue and red, respectively.
A)
Pacific Plains (0.5 - 8° N)
Date
B)Eastern Mountain Range - eastern mountainsides (-5 - 4° N)
Date
C)
Amazon region (-5 - 3° N)
Date
D)
Eastern Plains (1.5 - 10.5° N)
Date
If we compare the results of the new IDEAM report (2015) with those of the 2nd communication and the UPME analysis, we find inconsistencies since the results are contradictory. This confirms the high degree of uncertainty that currently exists regarding the hydrological effects of climate change in Colombia.
Due to the uncertainty associated with the study of climate change and to the limitations of global models in representing the climate and hydrological dynamic on the medium and small scale, as we move forward the most trustworthy indicator is still the trends observed at the measuring stations
rather than the predictions of models, especially when there is not consistency.
The results of the new IDEAM report greatly disqualify the results and base information of the study presented by the UPME in 2013.
Predicting of the impact of climate change on the hydrological cycle (precipitation, evaporation, river water volumes) is a transcendent practical and theoretical problem to which the country and its institutions should dedicate many more resources. In particular, similarly to the way in which a panel of scientists is called for internationally to produce the IPCC reports, Colombia should have its report
145
Andrés Felipe Hurtado Montoya, Óscar José Mesa Sánchez
ISSN 1794-1237 / Volume 12 / Issue 24 / July-December 2015 / pp. 129-147
incorporating the work of the IDEAM but subject to the rigorousness of peer review and including other focuses. Regarding the homogeneity analysis of the 384 monthly precipitation fields, the possible changes and mean trend must be considered in a more detailed study based on independence tests and using many more homogeneity tests in order to obtain more statistically trustworthy conclusions.
The dipoles found through the EOF analysis show clear evidence of the role of the mountain system of the Andes chain on the variability of precipitation in Colombia due to its interaction with the various sources of humidity and the fact that it acts as a climatic barrier that delineates the effects that different macro-climatic phenomena have on precipitation.
Though a homogeneity analysis using the Mann-Whitney mean change test and the t-simple test for trend, we see evidence of an increase in precipitation mainly in the Pacific region, Orinoquia, and the Amazon River basin. In the majority of the Andean region, there are no changes or mean trends, and in the cases in which a trend is shown, it is not easy to guarantee whether it is an increase or a decrease in precipitation in the period analyzed.
The precipitation database used, which corresponds to 32 years of monthly precipitation information across the country, allowed us to advance our understanding of the space-time variability of precipitation in the Colombian territory, as well as to identify signs of climate change in the country.
REFERENCIAS
Acevedo-Aristizábal, L. A. (2009). Estimación hidrológica bajo escenarios de cambio climático en Colombia. (Tesis de Maestría en Ingeniería-Recursos Hidráulicos). Universidad Nacional de Colombia, sede Medellín.
Álvarez-Villa, O. D.; Vélez, J. I. y Poveda, G. (2011). Improved Long-Term Mean Annual Rainfall Fields for Colombia. International Journal of Climatology, 31(14), November, pp. 2194-2212.
Bony, S.; et al. (2013). Robust Direct Effect of Carbon Dioxide on Tropical Circulation and Regional Precipitation. Nature Geoscience, 6(6), April, pp. 447-451.
Cantor, D. C. (2011). Evaluación y análisis espaciotemporal de tendencias de largo plazo en la hidroclimatología colombiana. (Tesis de Maestría en Ingeniería – Recursos Hidráulicos). Facultad de Minas, Universidad Nacional de Colombia, Medellín.
Cantor, D. C. y Ochoa, A. (2011). Señales de cambio climático en series de lluvia en Antioquia. IX Congreso Colombiano de Meteorología y Conferencia Internacional “200 años de la meteorología y de la climatologia en America Latina. Bogotá, Colombia.
Carmona, A. M. y Poveda, G. (2014). Detection of long-term trends in monthly hydro-climatic series of Colombia through Empirical Mode Decomposition. Climatic Change, 123(2), January, pp. 301-313.
Colombia. (2010). 2a Comunicación Nacional ante la Convención Marco de las Naciones Unidas sobre cambio climático. Bogotá.
Daly, C.; Neilson, R. P. y Phillips, D. L. (1994). A Statistical-Topographic Model for Mapping Climatological Precipitation Over Mountainous Terrain. Journal of Applied Meteorology, 33, pp. 140-158.
Eslava, J. A. (1993). Climatología y diversidad climática de Colombia. Revista Academía Colombiana de Ciencias Exactas Fsicas y Naturales, 18(71), Marzo, pp. 507–538.
Girvetz, E.H.; et al. (2009) Applied Climate-Change Analysis: The Climate Wizard Tool. PLoS ONE. [en línea] Available on: http://aquila.usm.edu/fac_pubs/1113
Hansen, J. (2010). Global surface temperature change. Review of Geophysics. [en línea] Available on: http://onlinelibrary.wiley.com/doi/10.1029/2010RG000345/full
Hausfather, Z. et al. (2013). Quantifying the Effect of Urbanization on U.S. Historical Climatology Network Temperature Records, Journal of Geophysical Research Atmospheres, 118, pp. 481-494.
Hoyos, C. D. (1999). Algunas aplicaciones de la transformada de Fourier y la descomposición en onditas a señales hidrológicas y sísmicas. (Trabajo dirigido de grado). Universidad Nacional de Colombia, sede Medellín.
146
Climate Change and Space-time Variability of Precipitation in Colombia
Rev.EIA.Esc.Ing.Antioq / Escuela de Ingeniería de Antioquia
Hurtado-Montoya, A. F. y Mesa-Sánchez, O.J. (2014). Reconstrucción de los campos de precipitación mensual en Colombia. DYNA, 81(186), pp. 251-258.
Hurtado, A. F. (2009). Estimación de los campos mensuales históricos de precipitación en el territorio colombiano. (Tesis de maestría). Universidad Nacional de Colombia, sede Medellín.
IDEAM, et al. (2015). Escenarios de cambio climático para precipitación y temperatura para Colombia 2011-2100. Herramientas cientificas para la toma de decisiones – estudio técnico completo : 3ª. Comunicación Nacional de Cambio Climático. Bogotá D.C.: IDEAM. 279 p.
IPCC, 2014: Climate Change 2014: Synthesis Report. Contribution of Working Groups I, II and III to the Fifth Assessment Report of the Intergovernmental Panel on Climate Change [Core Writing Team, R.K. Pachauri and L.A. Meyer (eds.)]. IPCC, Geneva, Switzerland, 151 pp.
Mayorga, R., et al. (2011). Evidencias de cambio climático en Colombia con base en información estadística. Bogotá D.C.: IDEAM. 34 p.
Mejía J.F., et al. (1999). Distribución espacial y ciclos anual y semianual de la precipitación en Colombia. DYNA, 127, pp. 7-26.
Mesa, O. J.; Poveda, G. y Carvajal L. F. (1997). Introducción al clima de Colombia. Bogotá D.C.: Universidad Nacional de Colombia. 390 p.
Mesa-Sánchez, O.J. (2007). ¿Adónde va a caer este Globo? Acerca del futuro de la Tierra. Medellín: Universidad Nacional de Colombia. 328 p.
Mitchell, J. F. B.; Wilson, C. A. y Cunnington, W. M. (1987). On CO2 Climate Sensitivity and Model Dependence of Results. Quarterly Journal of the Royal Meteorological Society, 113(475), January, pp. 293-322.
Ochoa, A. y Poveda, G. (2008). Distribución espacial de las señales de cambio climático en Colombia. En: XXIII Congreso Latinoamericano de Hidráulica. Cartagena de Indias, 2-6 de septiembre.
Ochoa-Jaramillo, A. y Cantor-Gómez, D. (2011). Tendencias de largo plazo en cinco índices de estabilidad atmosférica en Colombia. En: IX Congreso Colombiano de Meteorología y Conferencia Internacional, «200 años de la meteorología y de la
climatología en América Latina». Bogotá D.C., 23-25 de marzo.
Oster, R. (1979). Las precipitaciones de Colombia. Colombia Geográfica, Instituto Geográfico Agustín Codazi, 6(2), 147 p.
Pabón, J. D. (2003). Cambio climático global y su manifestación en Colombia. Cuadernos de Geografia XII, 12(1–2), julio, pp. 111–119.
Pabón, D. (2005). Escenarios de cambio climático para territorio colombiano. Documento INAPPDF-B/GECC/I. Universidad Nacional de Colombia y Conservación Internacional. Bogotá, Colombia.
Palmer, T. N. (2014). More Reliable Forecasts with less Precise Computations: a Fast-Track Route to Cloud-Resolved Weather and Climate Simulators? Philosophical Transactions of the Royal Society A: Mathematical, Physical and Engineering Sciences, 372(2018), June.
Peixoto, J. P. y Oort, A. H. (1992). Physics of Climate. New York: American Institute of Physics. 520 p.
Peterson, T. C. (2005). Climate Change Indices. WMO Bulletin, 54(2), pp. 83-86.
Poveda, G. y Mesa, O.J. (1997). Feedbacks Between Hydrological Processes in Tropical South America and Large-Scale Oceanic-Atmospheric Phenomena. Journal of Climate, 10(10), October, pp. 2690-2702.
Poveda, G. (2004). La hidroclimatología de Colombia: Una síntesis desde la escala inter-decadal hasta la escala diurna. Rev. Academia Colombiana de Ciencias Exactas Físicas y Naturales, 28(107), pp. 201-222.
Poveda, G., y Álvarez, D. M. (2012). El colapso de la hipótesis de estacionariedad por cambio y variabilidad climática: implicaciones para el diseño hidrológico en ingeniería. Revista de Ingeniería Universidad de los Andes, (36), enero, pp. 65-76.
Poveda G.; Alvarez D. M. y Rueda O. A. (2011). Hydro-Climatic Variability Over the Andes of Colombia Associated with ENSO: a Review of Climatic Processes and Their Impact on One of the Earth’s Most Important Biodiversity Hotspots. Clim Dynam, 36(11), pp. 2233–2249.
Quintana-Gómez, R. A. (1999). Trends of Maximum and Minimum Temperatures in Northern South America. Journal of Climate, 12(7), July, pp. 2104-2112.
147
Andrés Felipe Hurtado Montoya, Óscar José Mesa Sánchez
ISSN 1794-1237 / Volume 12 / Issue 24 / July-December 2015 / pp. 129-147
Rabatel, A., et al. (2012). Review article of the current state of glaciers in the tropical Andes: a multi-century perspective on glacier evolution and climate change. Cryosphere Discuss, 6(4), pp. 2477-2536.
Reichler, T. y Kim, J. (2008). How Well Do Coupled Models Simulate Today’s Climate? Bulletin of the American Meteorological Society, 89, pp. 303–311.
República de Colombia. (2010). 2ª. Comunicación Nacional ante la Convención Marco de Las Naciones Unidas Sobre Cambio Climático. Bogotá.
Roldán, E.; Mesa, J. C. y Poveda, G. (2008). Análisis de la variabilidad espacio temporal del NVDI en Colombia y en la cuenca Amazónica. En: VIII Congreso de meteorología y conferencia internacional «Cambio climático, recursos naturales y desarrollo sostenible», Chocó, Colombia.
Ruiz, D., et al. (2008). Changing Climate and Endangered High Mountain Ecosystems in Colombia. Science of the Total Environment, 398(1-3), pp. 122-132.
Ruiz-Murcia, J. F. e IDEAM (2007). Escenarios de cambio climático, algunos modelos y resultados de lluvia para Colombia bajo el escenario A1B. Bogotá D.C.: IDEAM. 55 p.
Ruiz-Murcia, J.F. e IDEAM (2010). Cambio climático en temperatura, precipitación y humedad relativa para Colombia usando modelos meteorológicos de alta resolución. Panorama 2011 – 2100. Bogotá D.C.: IDEAM. 89 p.
Salazar, J. F. (2011). Regulación biótica del ciclo hidrológico en múltiples escalas. (Tesis de Doctorado en Ingeniería). Universidad Nacional de Colombia. Medellín.
Smith, R.A., et al. (1996). En búsqueda de señales del cambio climático en Colombia. En: IV Congreso Colombiano de Meteorología, Sociedad Colombiana de Meteorología, Bogotá.
Snow, J.W. (1976). The Climate of Central and Northern South America. Climates of Central and South America. Schwerdtfeger W. (ed), pp. 295–403.
Soden, B. J. y Held, I. M. (2006). An Assessment of Climate Feedbacks in Coupled Ocean-Atmosphere Models. Journal of Climate, 19(14), July, pp. 3354-3360.
Stevens, B., y Bony, S. (2013a). Water in the Atmosphere. Physics Today, 66(6), pp. 29-34.
__________________. (2013b). What are Climate Models Missing. Science, 340(6136), May, pp. 1053-1054.
Tebaldi, C. y Knutti, R. (2007). The Use of the Multi-Model Ensemble in Probabilistic Climate Projections. [Online] Philosophical Transactions of the Royal Society A. Available on: http://rsta.royalsocietypublishing.org/content/365/1857/2053
Trojer, H. (1959). Fundamentos para una zonificación meteorológica y climatológica del trópico y especialmente de Colombia. Cenicafé X, (8), pp. 287 – 371.
UPME, Macías, A. M. y Andrade, J. (2014). Estudio de generación eléctrica bajo escenario de cambio climático. Bogotá D.C. 107 p.
UPME, ACON–OPTIM, (2013). Estudio para determinar la vulnerabilidad y las opciones de adaptación del sector energético colombiano frente al cambio climático. Producto No. 3. Informe final. UPME-0223-290-dic/2013-V1. 416 p.
Vélez, A.; Ochoa, A. y Poveda, G. (2014). Validación de temperaturas medias mensuales del Eta/HadCM3 en Colombia para el escenario 20C3M. En: 60 Reunión anual de la Sociedad Interamericana de Horticultura Tropical & V Congreso Colombiano de Horticultura. Memorias electrónicas. Medellín.
Vuille, M., et al. (2003). 20th Century Climate Change in the Tropical Andes: Observations and Model Results. Climatic Change, 59, July, pp. 75–99.
Wentz, F. J., et al. (2007). How Much More Rain Will Global Warming Bring? Science, 317(5835), July, pp. 233-235.
TO REFERENCE THIS ARTICLE /PARA CITAR ESTE ARTÍCULO /
PARA CITAR ESTE ARTIGO /
Hurtado Montoya, A.F.; Mesa Sánchez, Ó.J. (2015). Climate Change and Space-time Variability of Precipitation in Colombia. Revista EIA, 12(24), July-December, pp. 129-147. [Online]. Available on: DOI: http:/dx.doi.org/10.14508/reia.2015.12.24.131-150