Embed Size (px)
Citation preview

Climate Change and Watershed Management
September 28, 2010
Mike McNutt, B.A., B.S. Watershed Coordinator
Cuyahoga County Board of Health
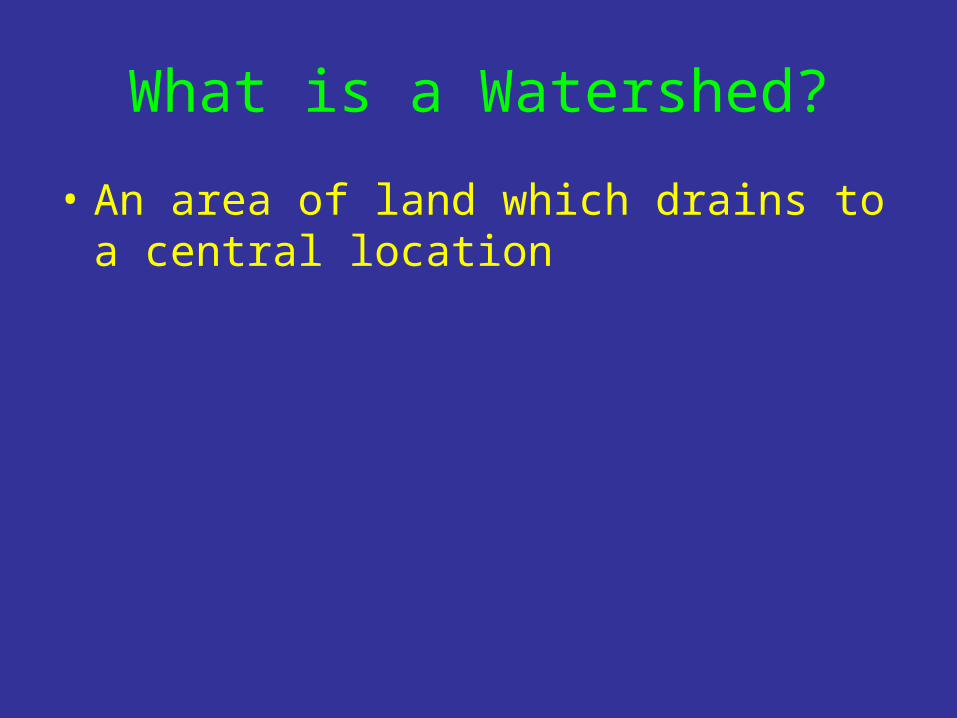
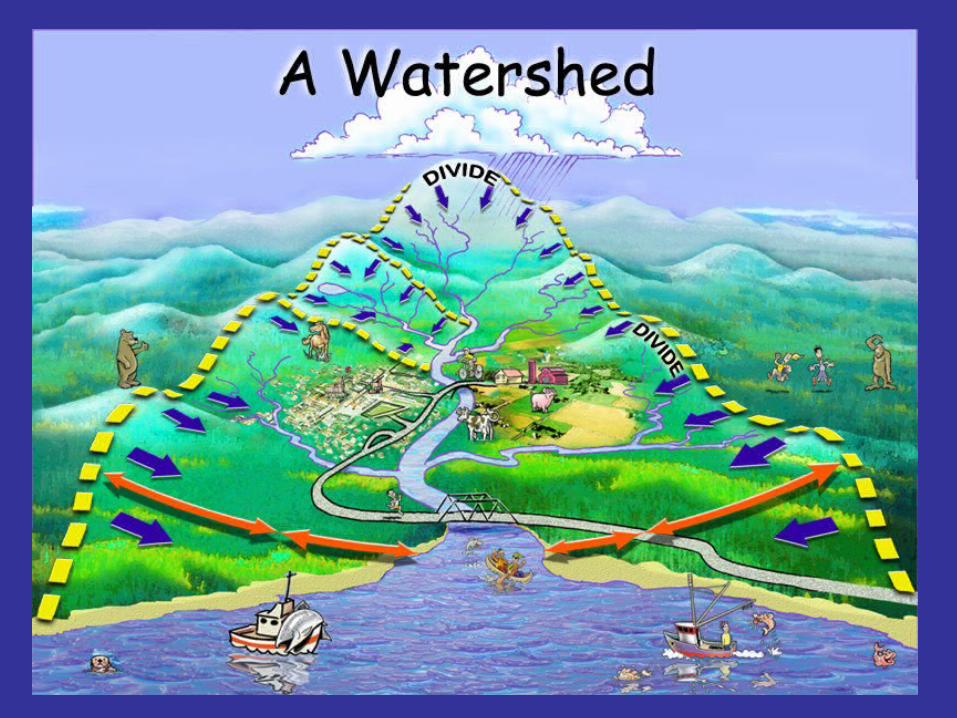
What is a Watershed?
• An area of land which drains to a central location

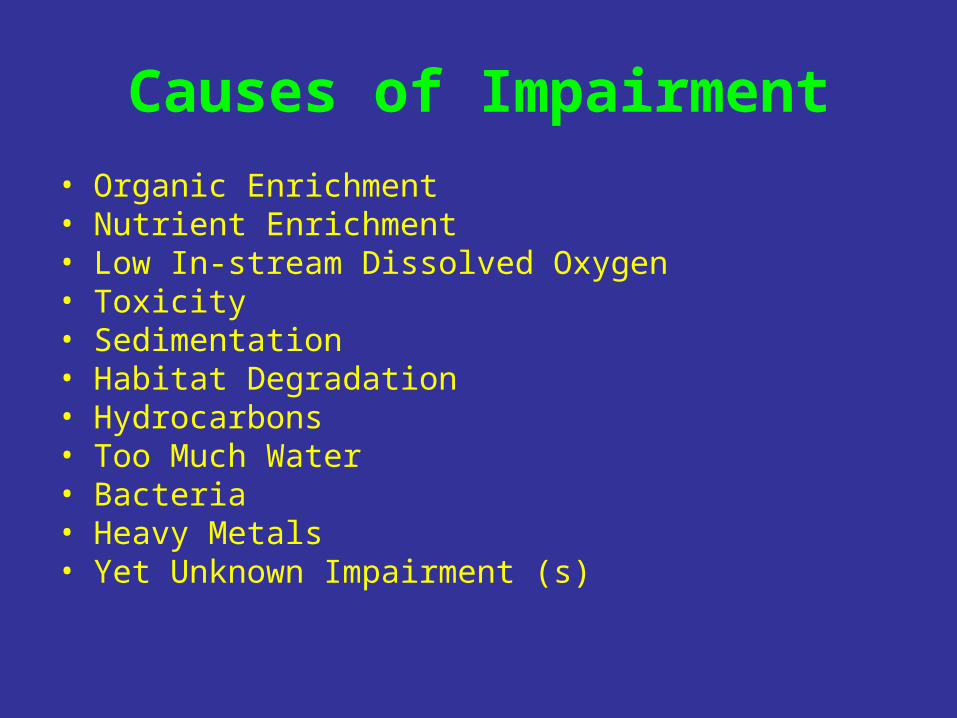
Causes of Impairment• Organic Enrichment• Nutrient Enrichment• Low In-stream Dissolved Oxygen• Toxicity• Sedimentation• Habitat Degradation• Hydrocarbons• Too Much Water• Bacteria• Heavy Metals• Yet Unknown Impairment (s)
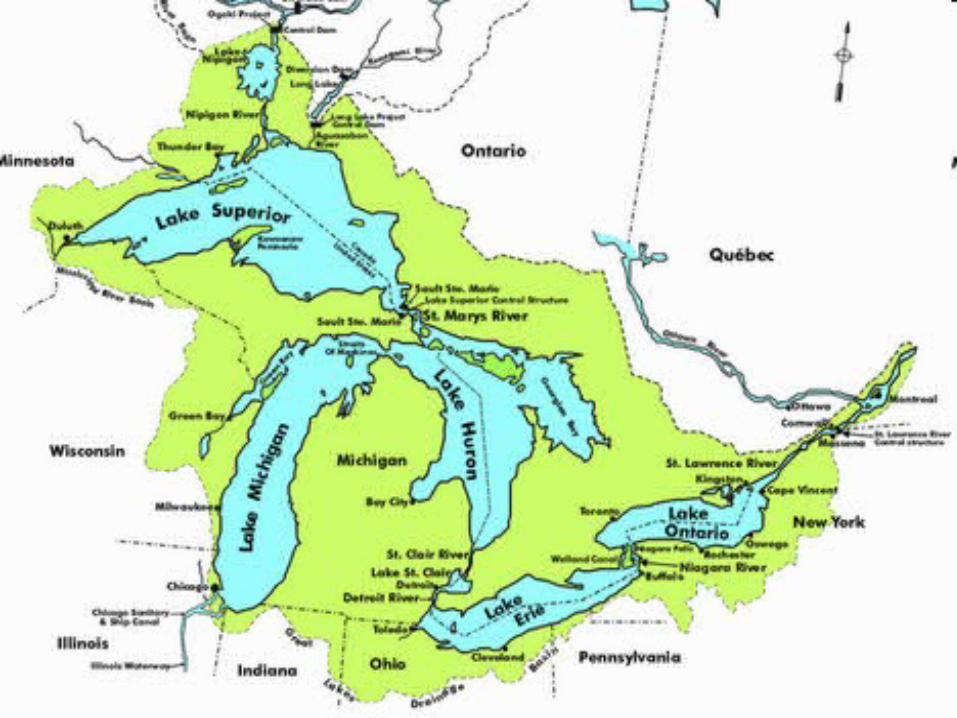
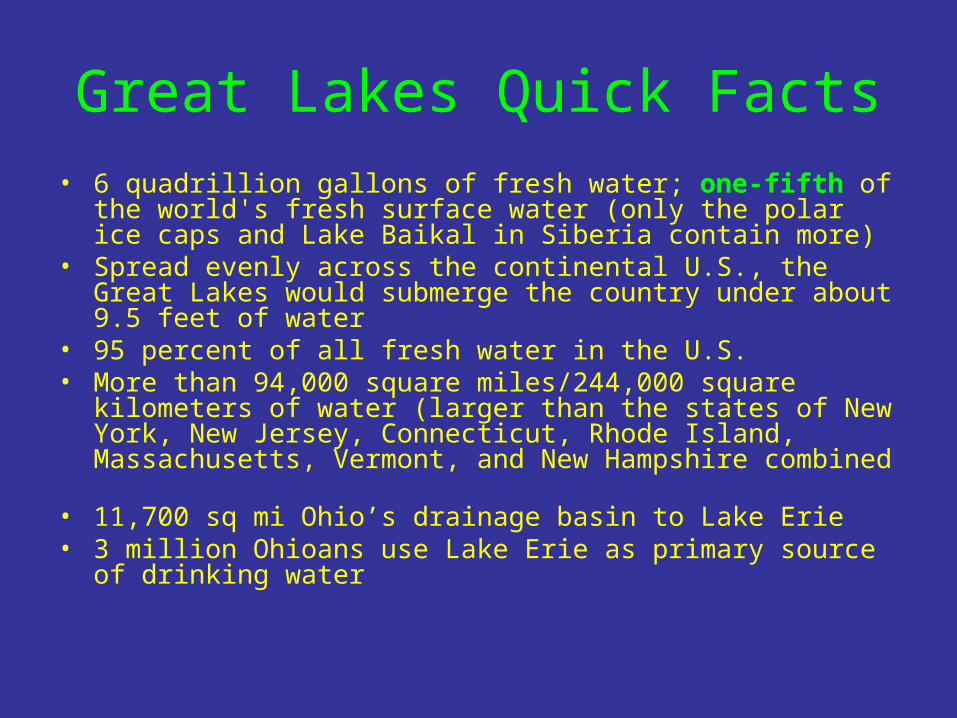
Great Lakes Quick Facts• 6 quadrillion gallons of fresh water; one-fifth of the
world's fresh surface water (only the polar ice caps and Lake Baikal in Siberia contain more)
• Spread evenly across the continental U.S., the Great Lakes would submerge the country under about 9.5 feet of water
• 95 percent of all fresh water in the U.S. • More than 94,000 square miles/244,000 square kilometers
of water (larger than the states of New York, New Jersey, Connecticut, Rhode Island, Massachusetts, Vermont, and New Hampshire combined
• 11,700 sq mi Ohio’s drainage basin to Lake Erie• 3 million Ohioans use Lake Erie as primary source of
drinking water

Adapted from Health Canada, Climate Change Office, 2005
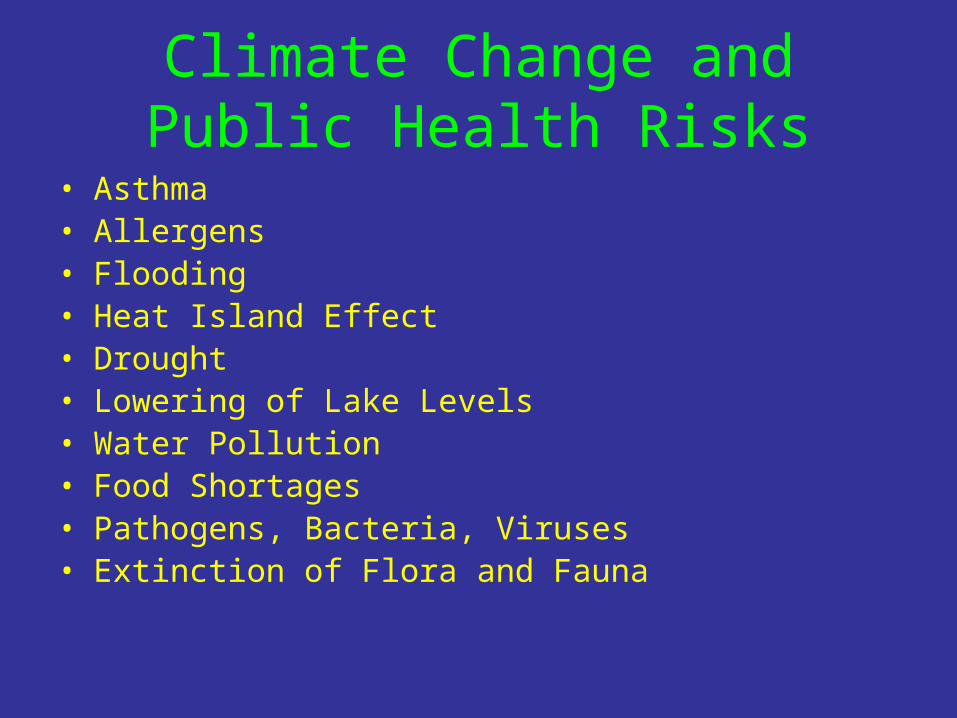
Climate Change and Public Health Risks
• Asthma• Allergens• Flooding• Heat Island Effect• Drought• Lowering of Lake Levels• Water Pollution• Food Shortages• Pathogens, Bacteria, Viruses• Extinction of Flora and Fauna
How Will Climate Change Impact Ohio?
www.climate-speakers.org.uk
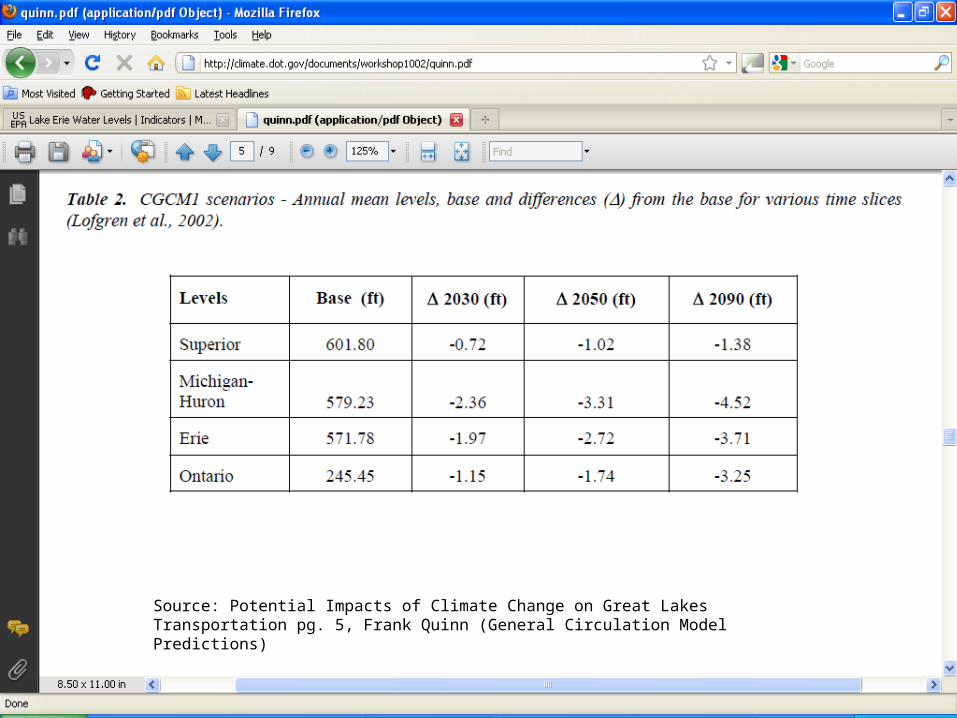
Ohio’s Climate Change Projection for the 21st Century
• Ambient Temperature: 7 – 12 degrees Fahrenheit in the Winter and 6 – 14 degrees Fahrenheit in the Summer
• Precipitation: Average rainfall may not change but may see seasonal variability in precipitation (Summer less and Winter more) Overall drier conditions
• Extreme Events: 24-hour and Multiday events will increase over time
• Reduced Lake Erie water levels: (warmer temperatures, decreased ice cover, increased pressure for water removal)
• Increase in Lake Erie water temperatures
Source: Confronting Climate Change in the Great Lakes Region, Impacts on Ohio Communities and Ecosystems, Union of Concerned Scients
http://ucsusa.org/assets/documents/global_warming/ucssummaryohfinal.pdf
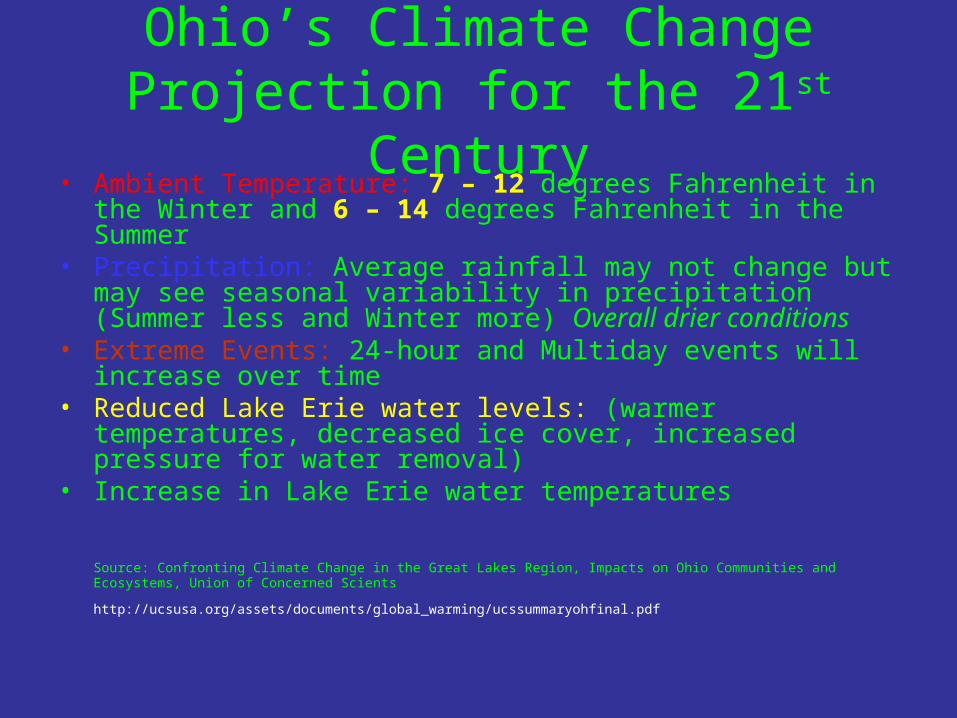
Source: Potential Impacts of Climate Change on Great Lakes Transportation pg. 5, Frank Quinn (General Circulation Model Predictions)
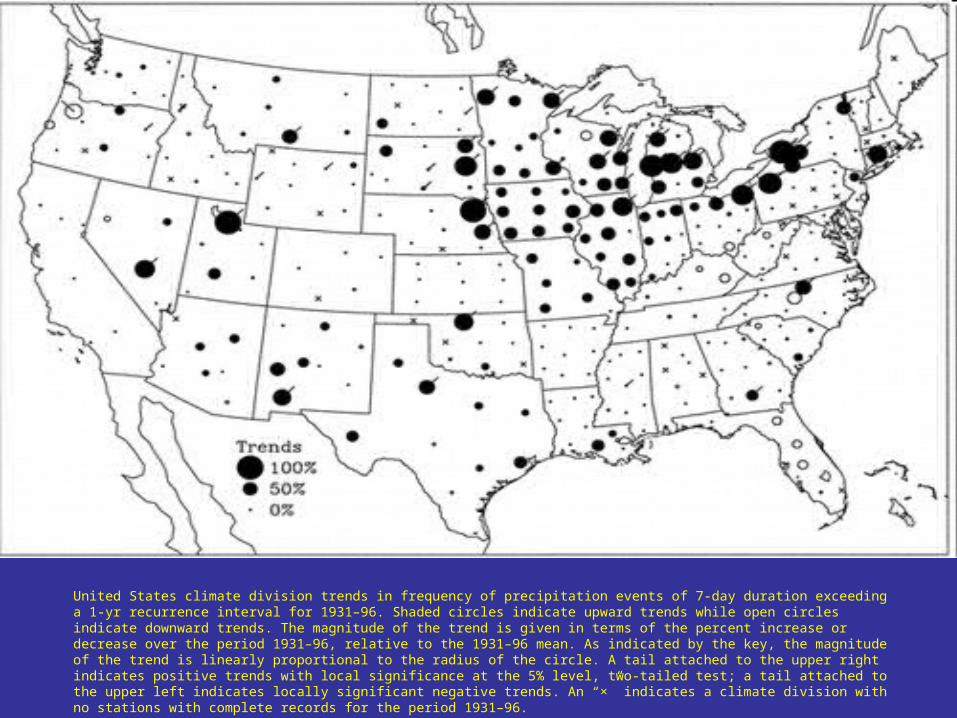
United States climate division trends in frequency of precipitation events of 7-day duration exceeding a 1-yr recurrence interval for 1931–96. Shaded circles indicate upward trends while open circles indicate downward trends. The magnitude of the trend is given in terms of the percent increase or decrease over the period 1931–96, relative to the 1931–96 mean. As indicated by the key, the magnitude of the trend is linearly proportional to the radius of the circle. A tail attached to the upper right indicates positive trends with local significance at the 5% level, two-tailed test; a tail attached to the upper left indicates locally significant negative trends. An “×” indicates a climate division with no stations with complete records for the period 1931–96. Source: Long-Term Trends in Extreme Precipitation Events over the Conterminous United States and CanadaKenneth E. Kunkel and Karen Andsager

Water Extraction Issue
• Great Lakes Compact Implementation• Great Lakes states offer thresholds for the
withdraw of water based on stream flow and biological diversity (Exceptional WWH, WWH, LRW, Modified)
• Withdraw amounts range from 100,000 gpd to 5 mgd
• Ohio proposes 2 mgd• “Put-in-Bay importing water for Labor Day
weekend because of algae issues” –Toledo Blade August 31, 2010
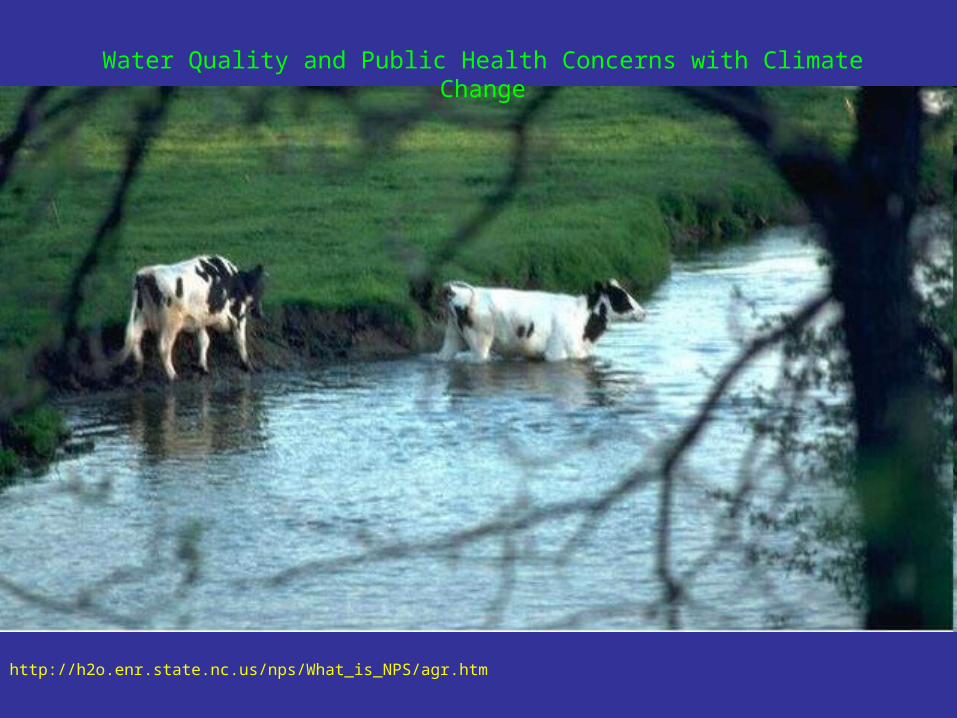
http://h2o.enr.state.nc.us/nps/What_is_NPS/agr.htm
Water Quality and Public Health Concerns with Climate Change
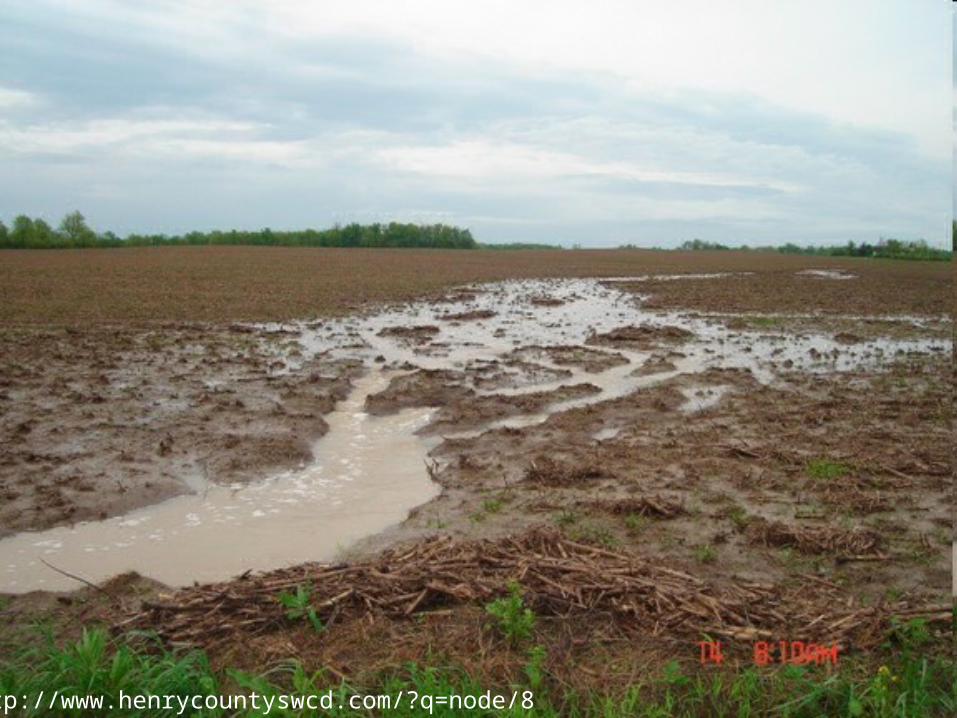
http://www.henrycountyswcd.com/?q=node/8
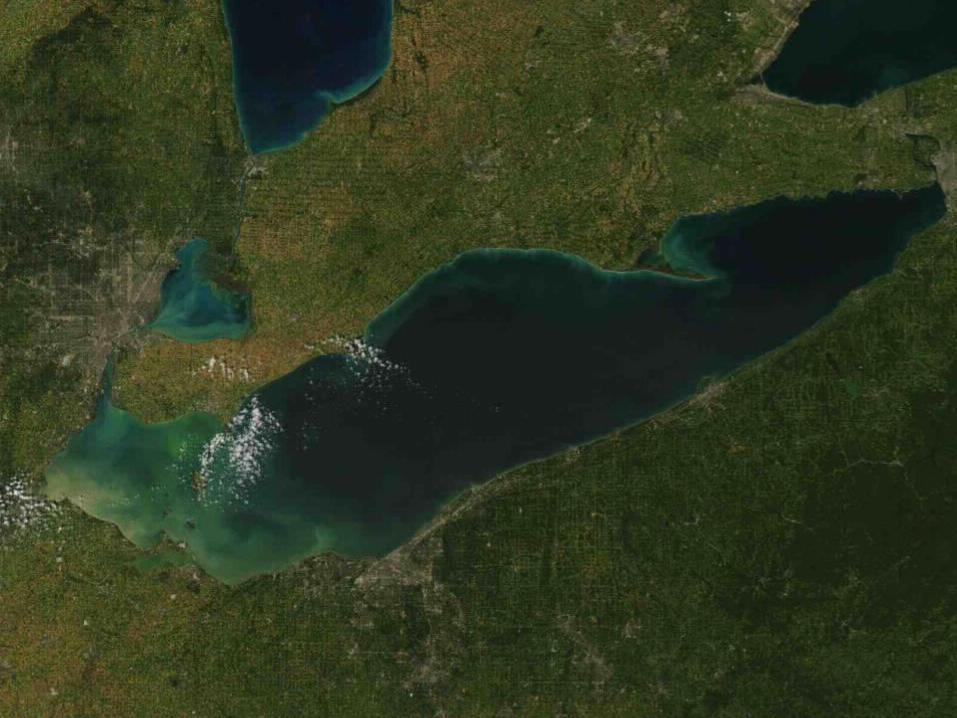
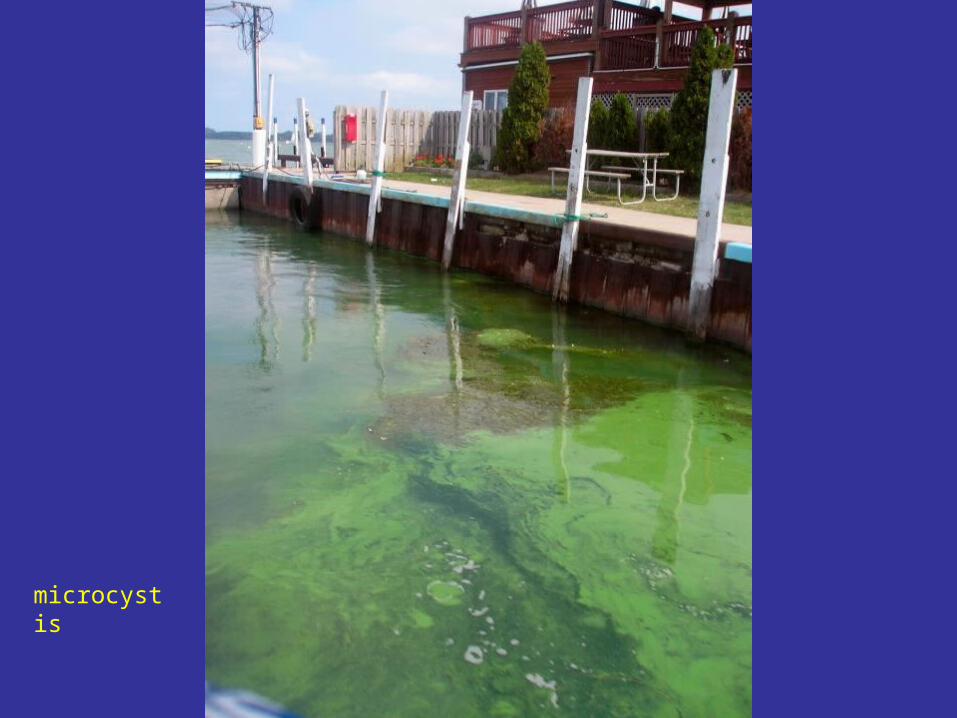
microcystis
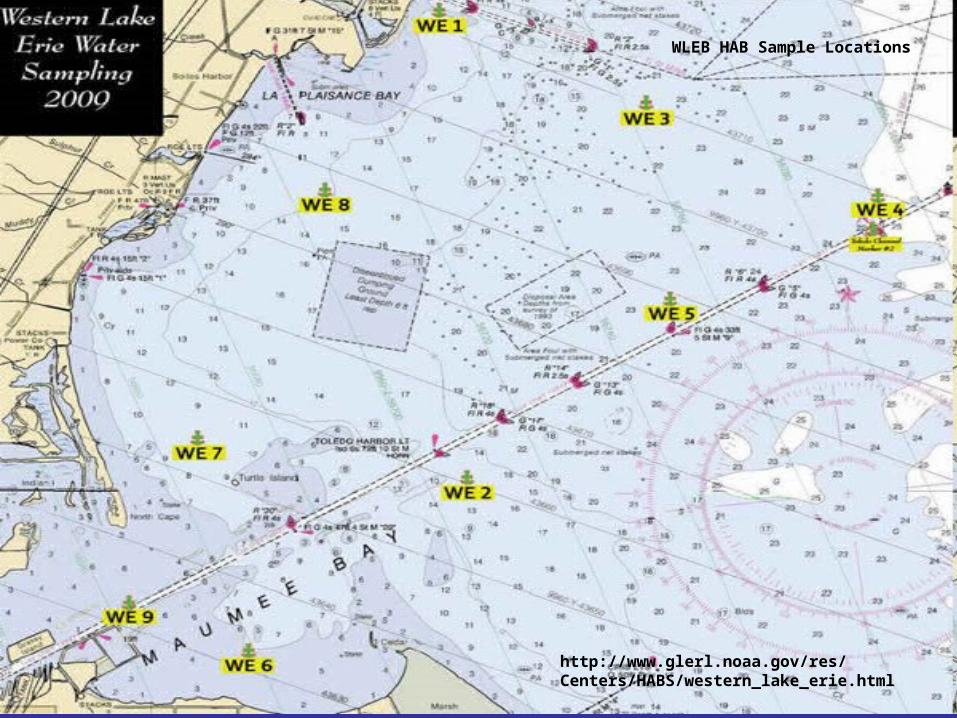
http://www.glerl.noaa.gov/res/Centers/HABS/western_lake_erie.html
WLEB HAB Sample Locations
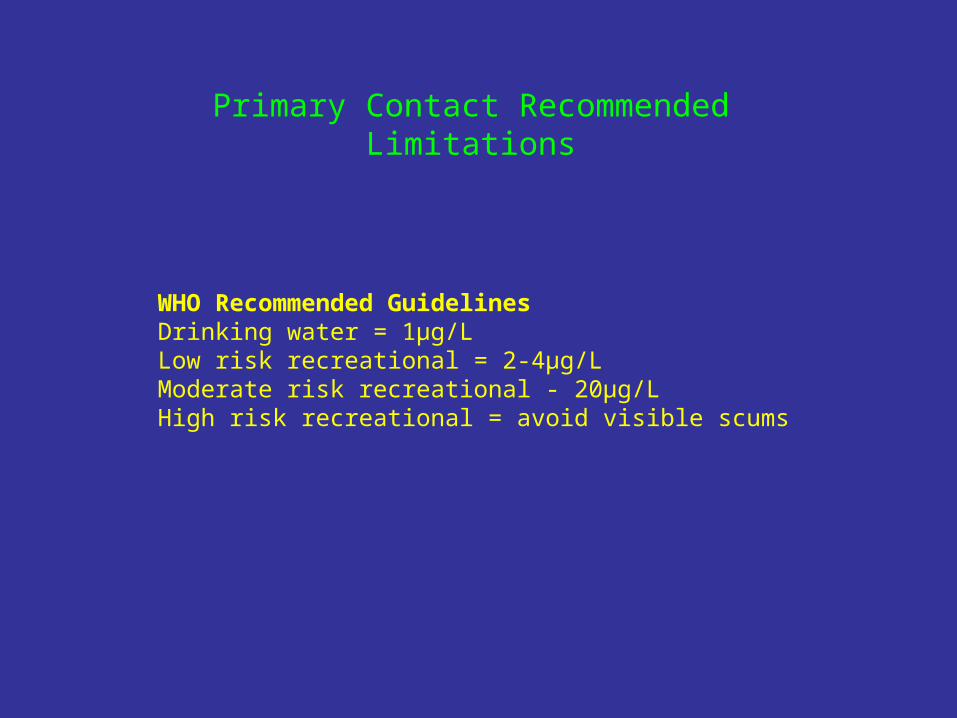
WHO Recommended GuidelinesDrinking water = 1µg/LLow risk recreational = 2-4µg/LModerate risk recreational - 20µg/LHigh risk recreational = avoid visible scums
Primary Contact Recommended Limitations
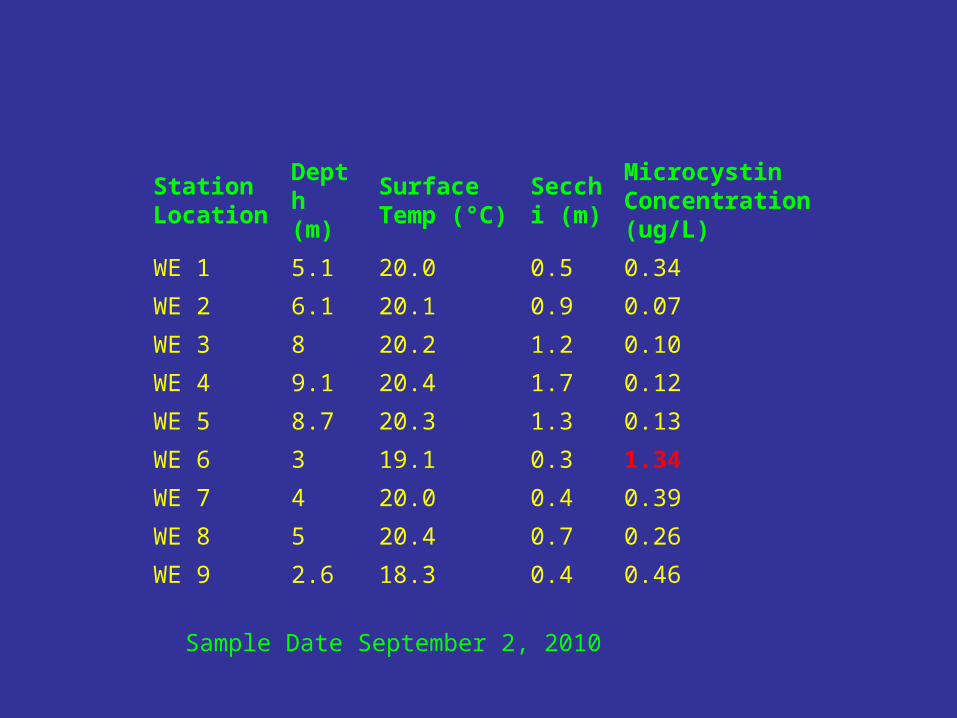
Station Location
Depth (m)
Surface Temp (°C)
Secchi (m)
Microcystin Concentration (ug/L)
WE 1 5.1 20.0 0.5 0.34
WE 2 6.1 20.1 0.9 0.07
WE 3 8 20.2 1.2 0.10
WE 4 9.1 20.4 1.7 0.12
WE 5 8.7 20.3 1.3 0.13
WE 6 3 19.1 0.3 1.34
WE 7 4 20.0 0.4 0.39
WE 8 5 20.4 0.7 0.26
WE 9 2.6 18.3 0.4 0.46
Sample Date September 2, 2010
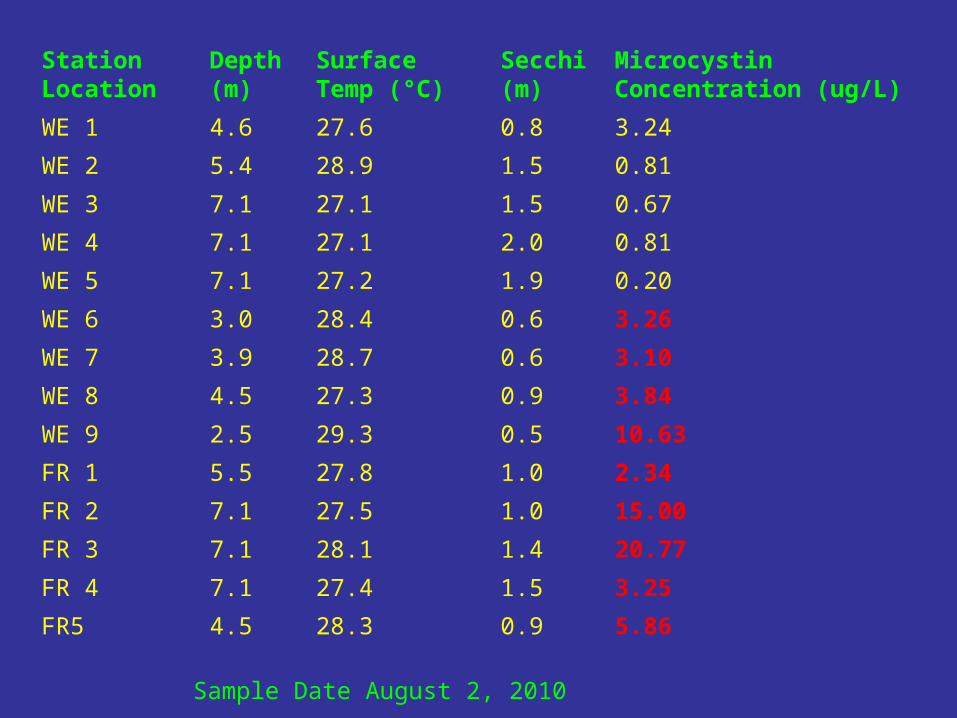
Station Location
Depth (m)
Surface Temp (°C)
Secchi (m)
Microcystin Concentration (ug/L)
WE 1 4.6 27.6 0.8 3.24
WE 2 5.4 28.9 1.5 0.81
WE 3 7.1 27.1 1.5 0.67
WE 4 7.1 27.1 2.0 0.81
WE 5 7.1 27.2 1.9 0.20
WE 6 3.0 28.4 0.6 3.26
WE 7 3.9 28.7 0.6 3.10
WE 8 4.5 27.3 0.9 3.84
WE 9 2.5 29.3 0.5 10.63
FR 1 5.5 27.8 1.0 2.34
FR 2 7.1 27.5 1.0 15.00
FR 3 7.1 28.1 1.4 20.77
FR 4 7.1 27.4 1.5 3.25
FR5 4.5 28.3 0.9 5.86
Sample Date August 2, 2010
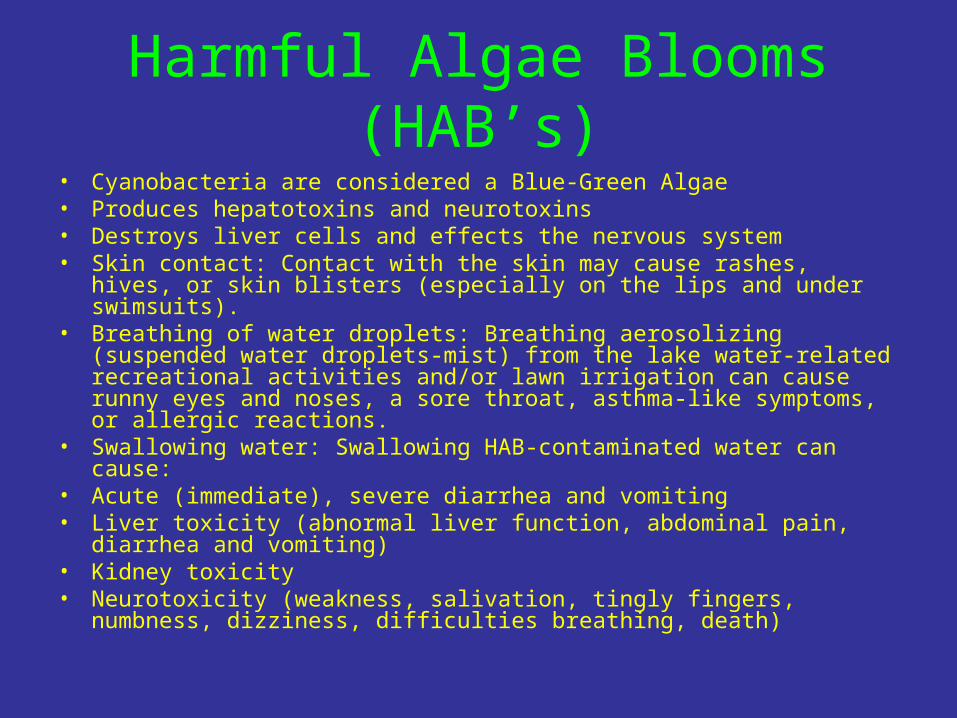
Harmful Algae Blooms (HAB’s)
• Cyanobacteria are considered a Blue-Green Algae• Produces hepatotoxins and neurotoxins • Destroys liver cells and effects the nervous system• Skin contact: Contact with the skin may cause rashes, hives, or
skin blisters (especially on the lips and under swimsuits). • Breathing of water droplets: Breathing aerosolizing (suspended
water droplets-mist) from the lake water-related recreational activities and/or lawn irrigation can cause runny eyes and noses, a sore throat, asthma-like symptoms, or allergic reactions.
• Swallowing water: Swallowing HAB-contaminated water can cause:
• Acute (immediate), severe diarrhea and vomiting • Liver toxicity (abnormal liver function, abdominal pain, diarrhea
and vomiting) • Kidney toxicity • Neurotoxicity (weakness, salivation, tingly fingers, numbness,
dizziness, difficulties breathing, death)
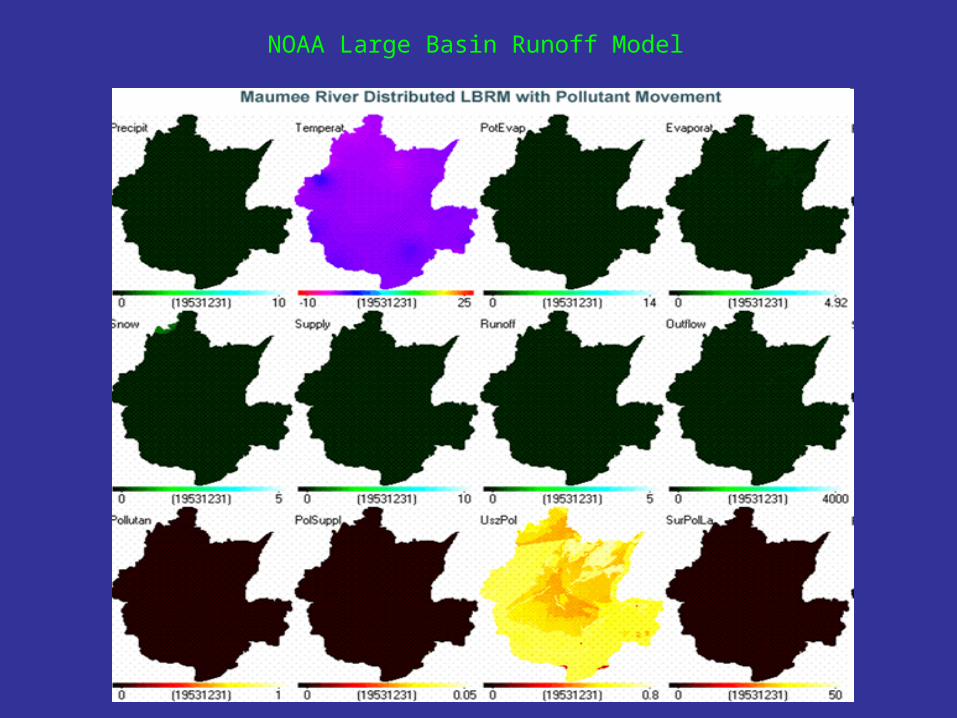
NOAA Large Basin Runoff Model
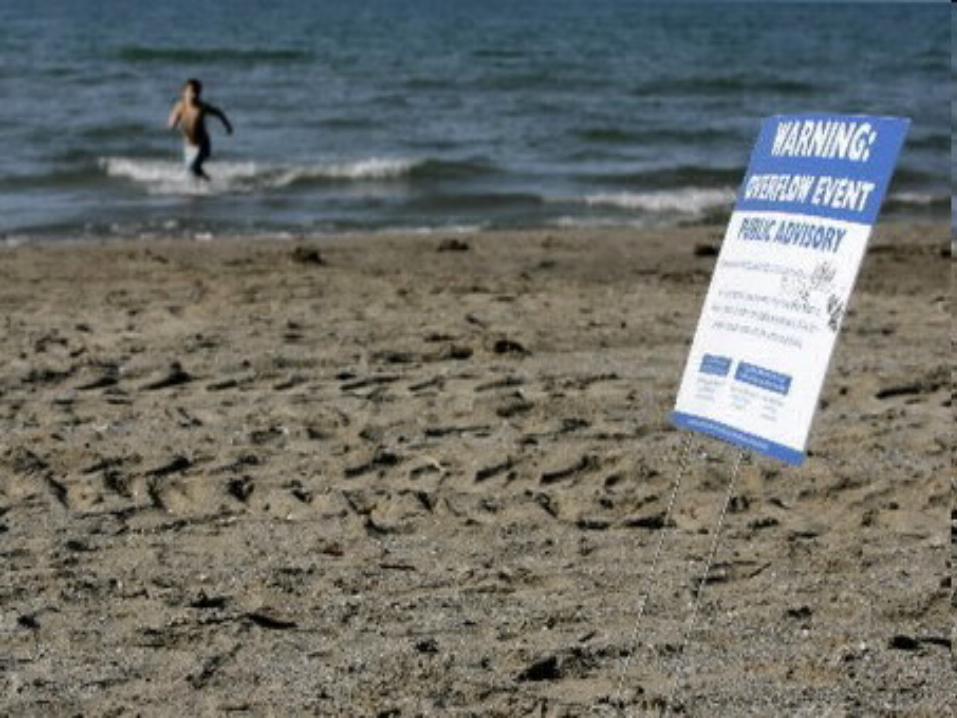
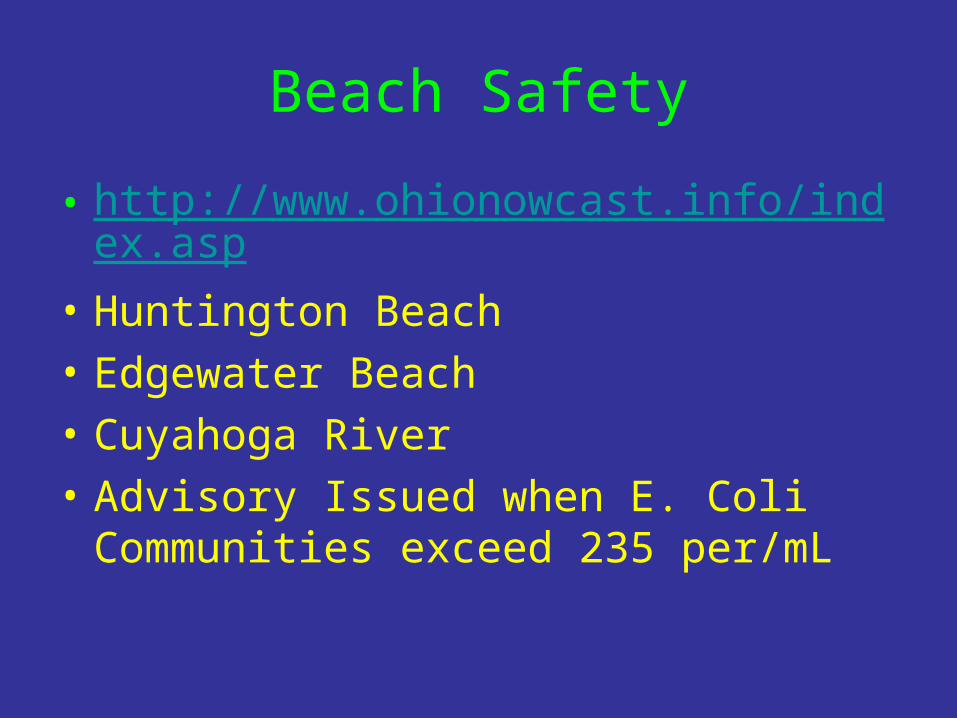
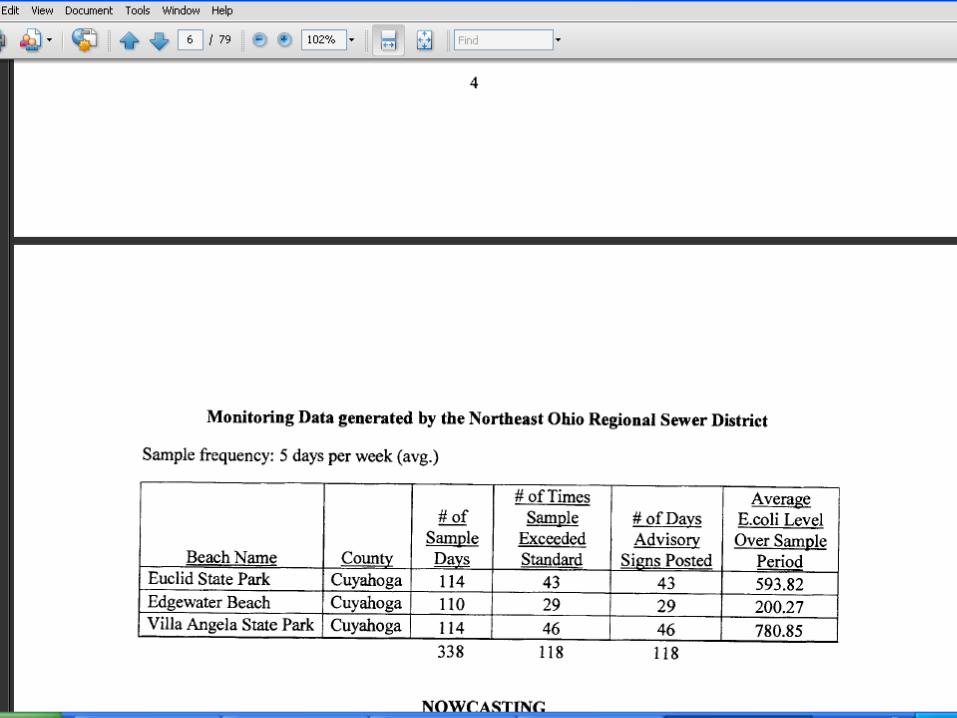
Beach Safety
• http://www.ohionowcast.info/index.asp
• Huntington Beach• Edgewater Beach• Cuyahoga River• Advisory Issued when E. Coli
Communities exceed 235 per/mL
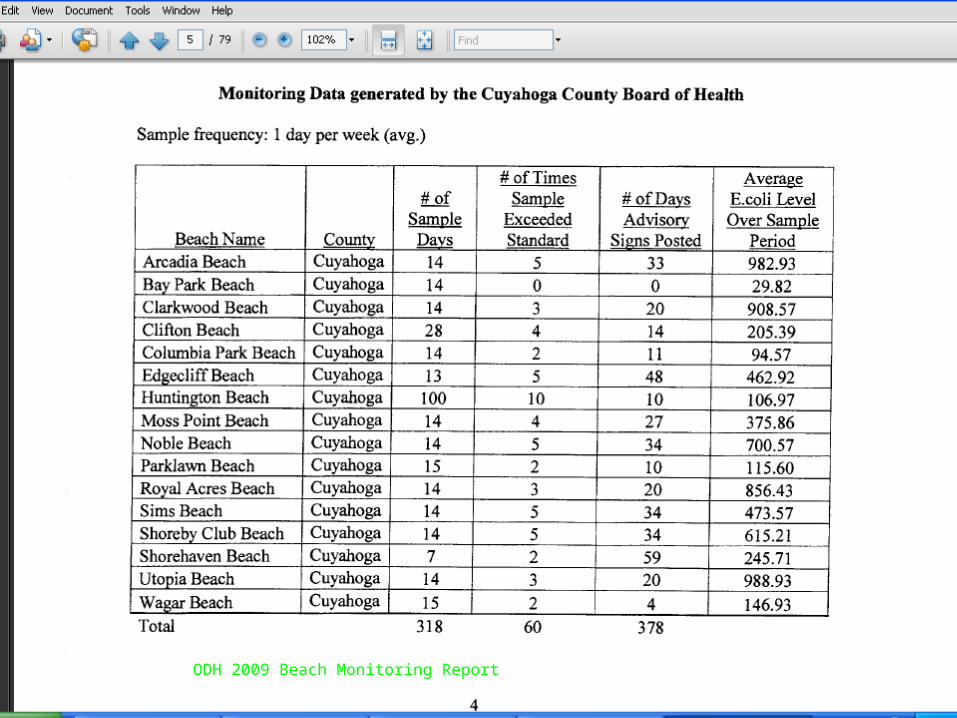
ODH 2009 Beach Monitoring Report
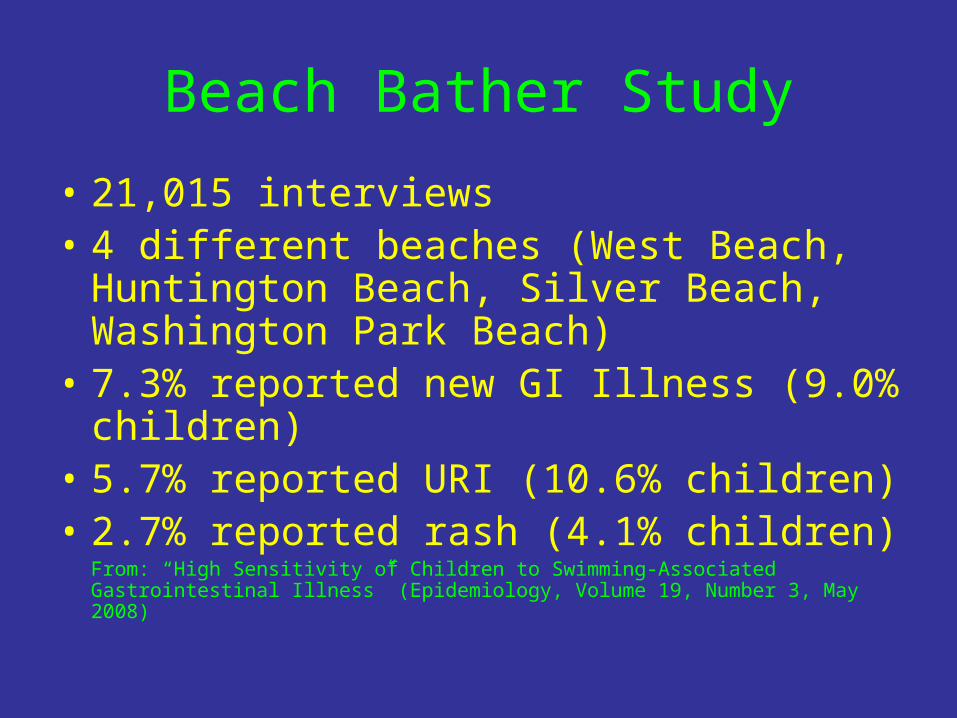
Beach Bather Study
• 21,015 interviews• 4 different beaches (West Beach,
Huntington Beach, Silver Beach, Washington Park Beach)
• 7.3% reported new GI Illness (9.0% children)
• 5.7% reported URI (10.6% children)• 2.7% reported rash (4.1% children)
From: “High Sensitivity of Children to Swimming-Associated Gastrointestinal Illness” (Epidemiology, Volume 19, Number 3, May 2008)
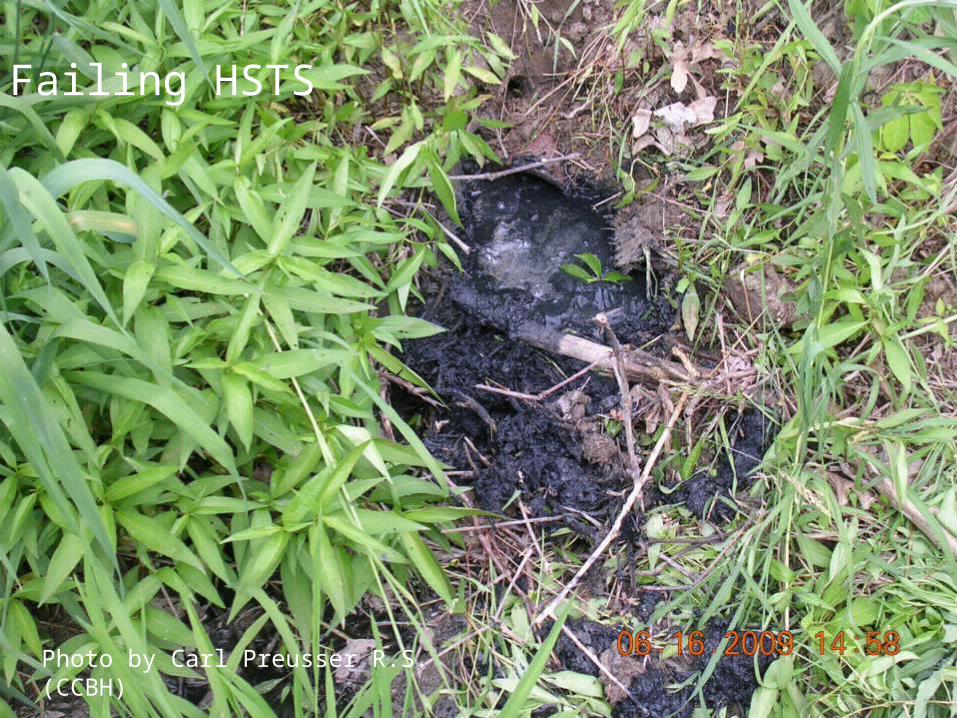
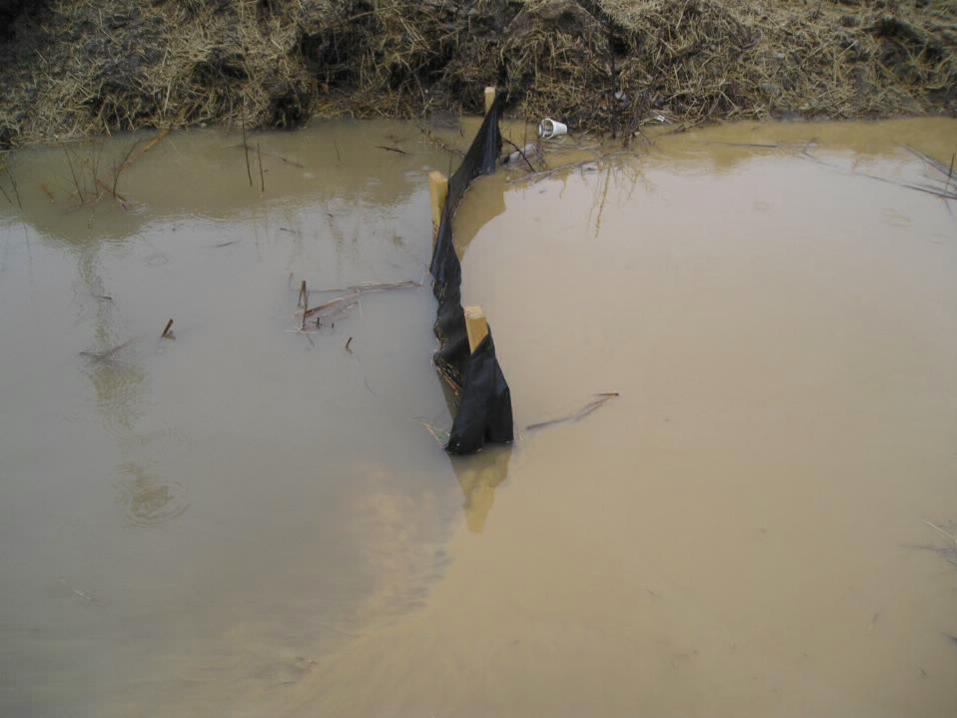
Failing HSTS
Photo by Carl Preusser R.S.(CCBH)

HSTS in Cuyahoga County
• 9,929 Total Active Systems• 1,390 Failing Systems• 3,683 Systems Aged 50+ Years• Average Lifespan of HSTS Systems
is 25 Years
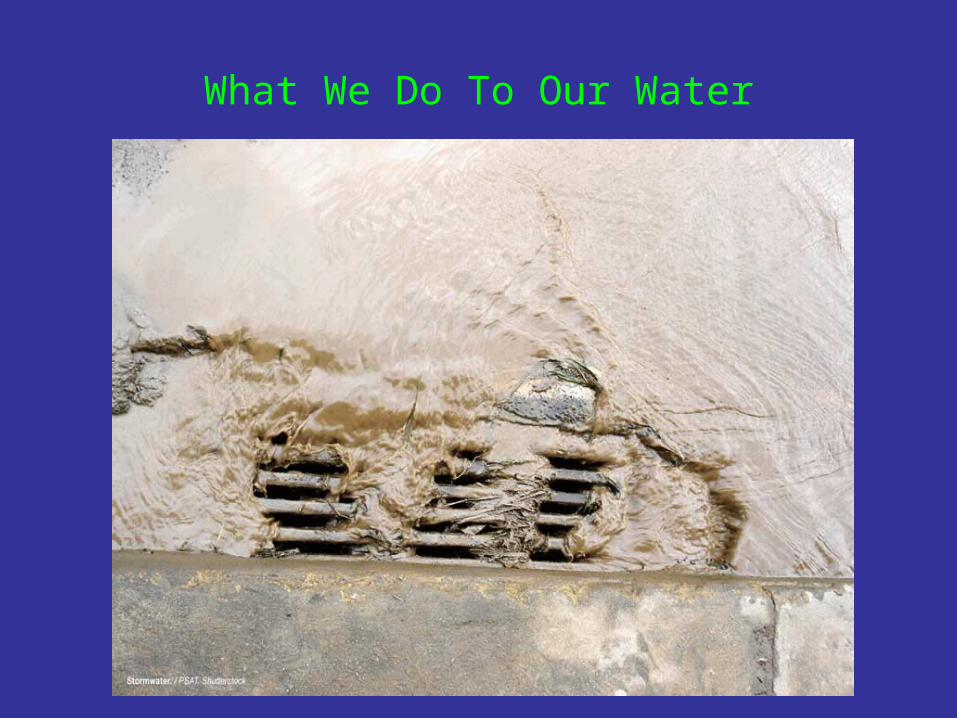
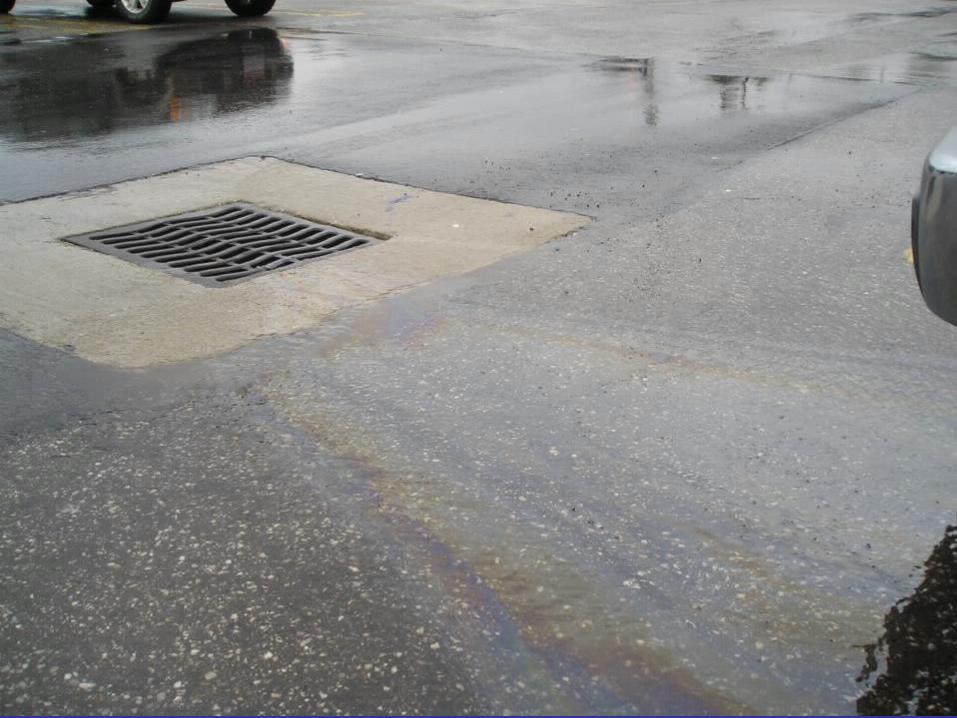
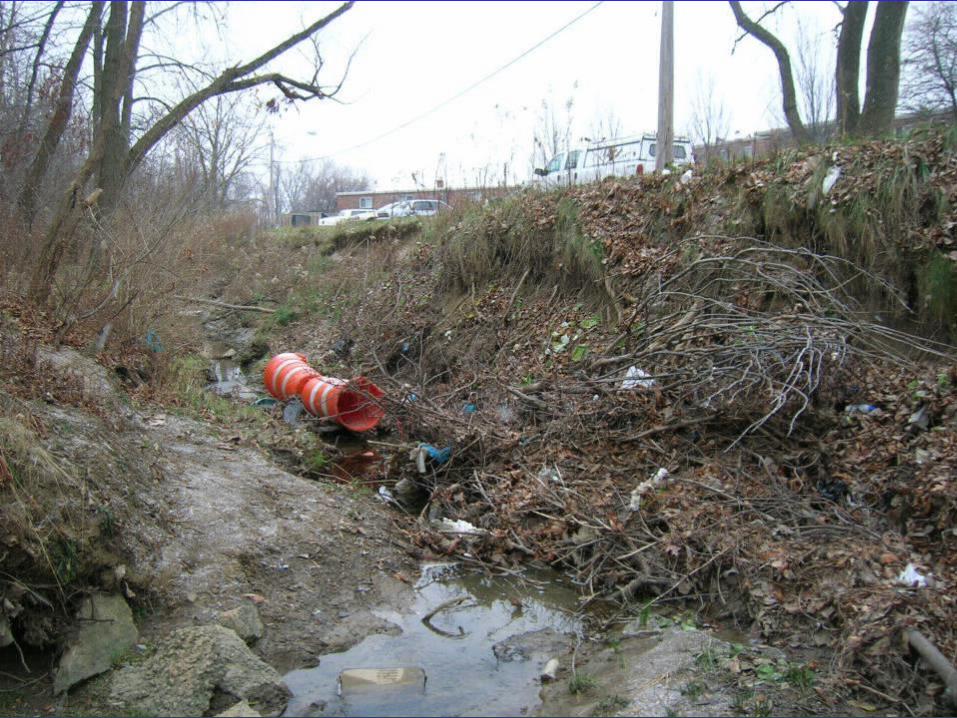
What We Do To Our Water


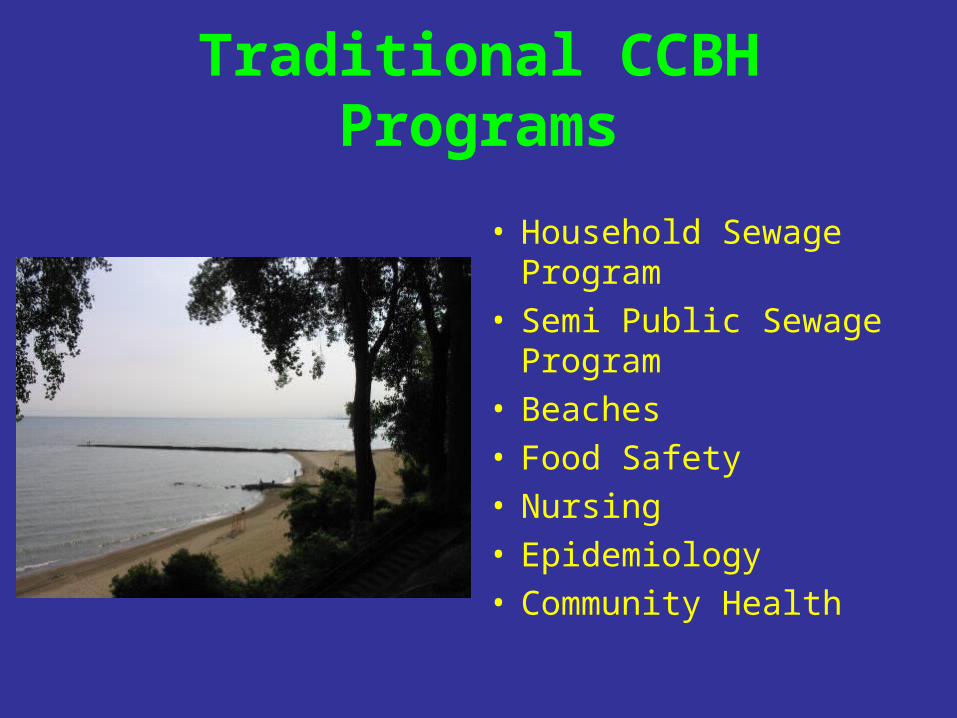
Traditional CCBH Programs
• Household Sewage Program
• Semi Public Sewage Program
• Beaches• Food Safety• Nursing• Epidemiology• Community Health
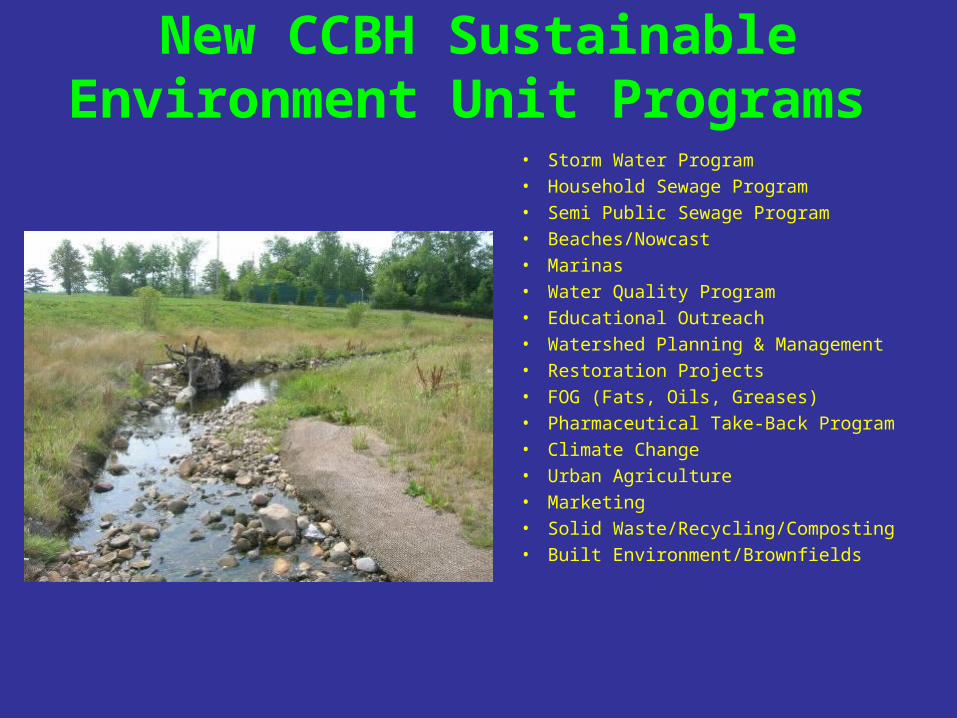
New CCBH Sustainable Environment Unit Programs
• Storm Water Program• Household Sewage Program• Semi Public Sewage Program• Beaches/Nowcast• Marinas• Water Quality Program• Educational Outreach• Watershed Planning & Management• Restoration Projects• FOG (Fats, Oils, Greases)• Pharmaceutical Take-Back Program• Climate Change• Urban Agriculture• Marketing• Solid Waste/Recycling/Composting• Built Environment/Brownfields
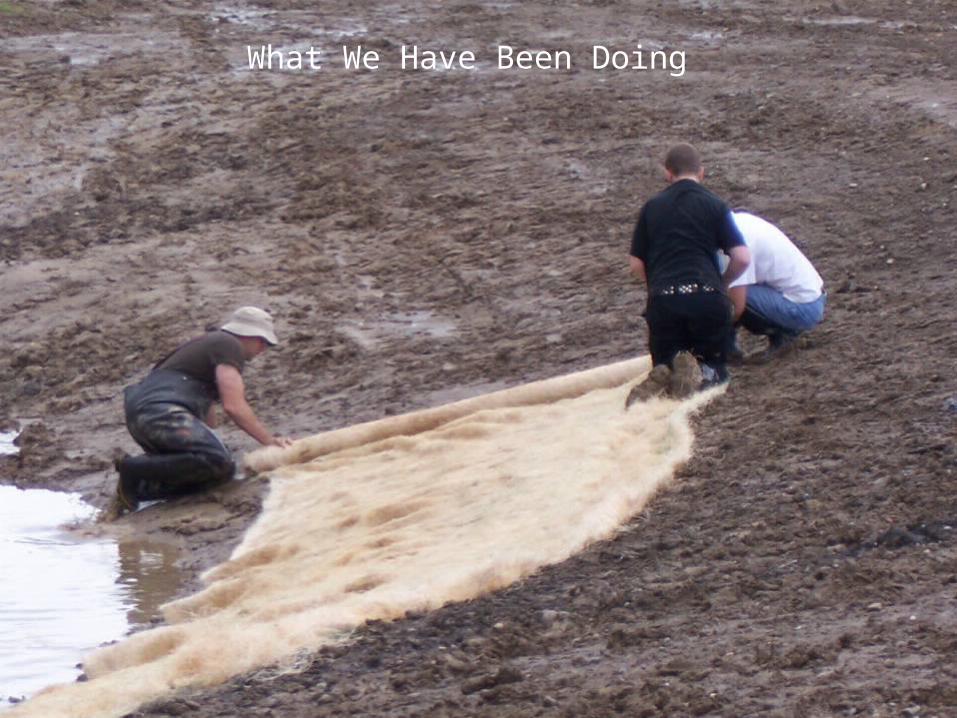
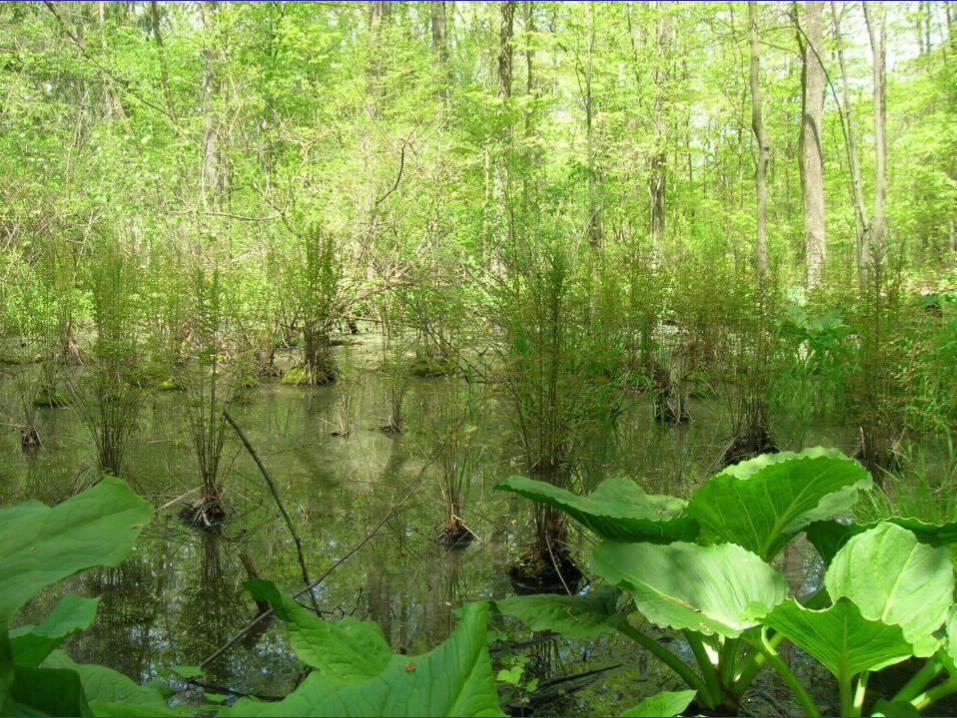
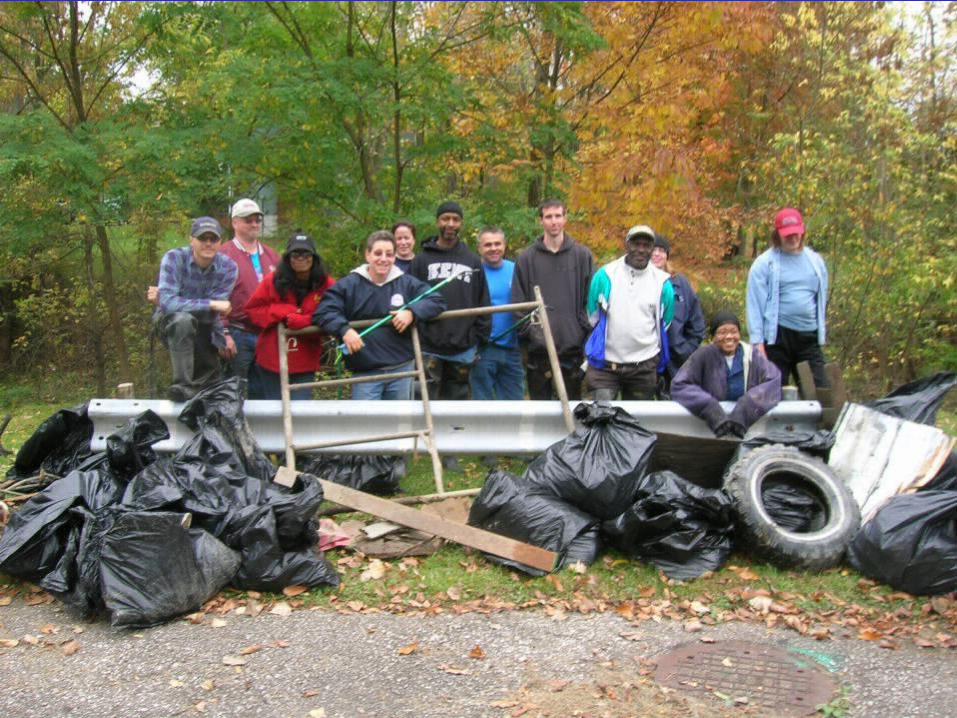
What We Have Been Doing


Courtesy: Biohabitats, Inc.

Agricultural BMP’s
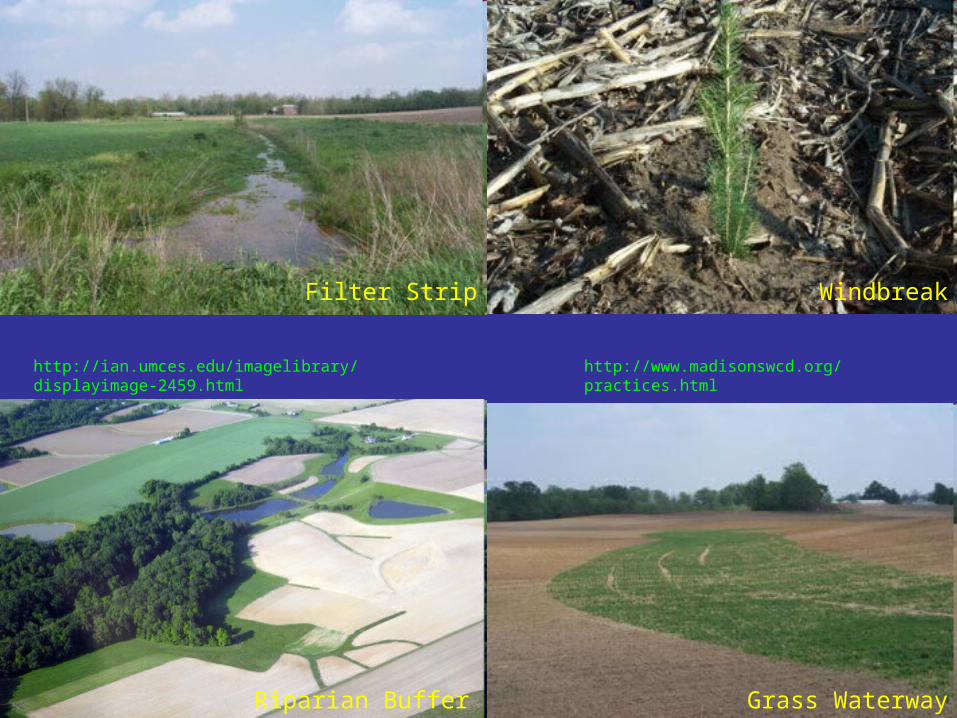
Grass Waterway
Filter Strip
http://www.madisonswcd.org/practices.html
Windbreak
http://ian.umces.edu/imagelibrary/displayimage-2459.html
Riparian Buffer

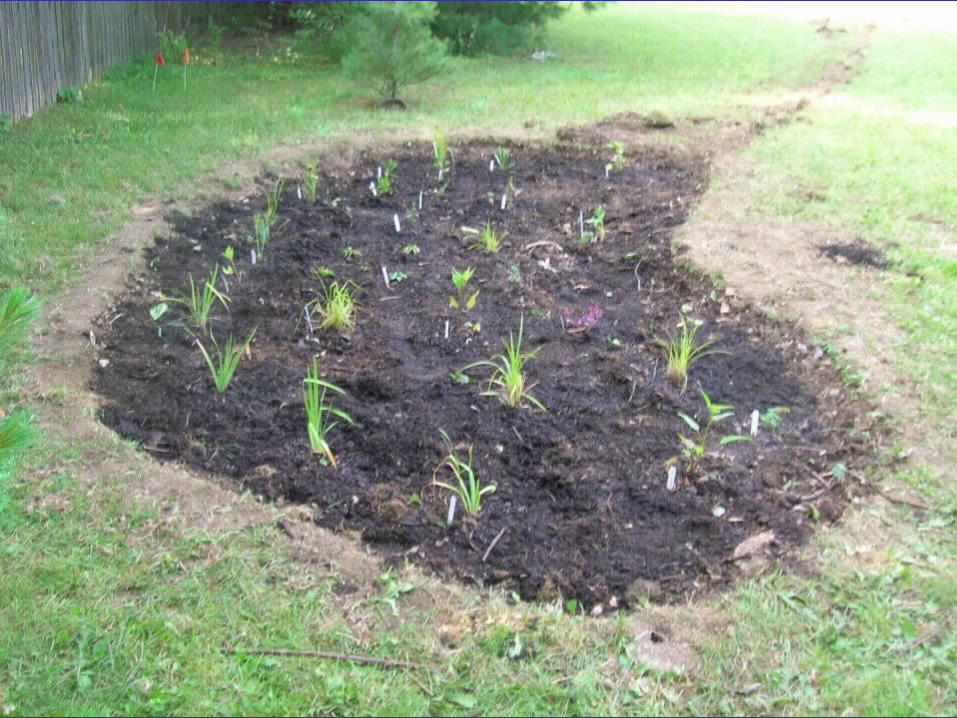
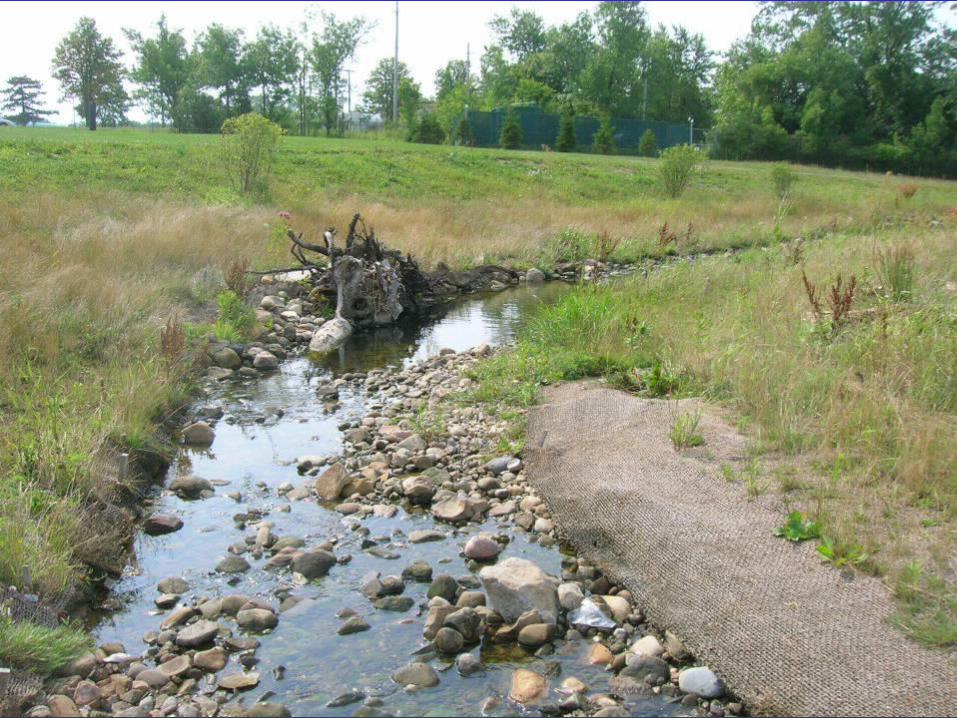
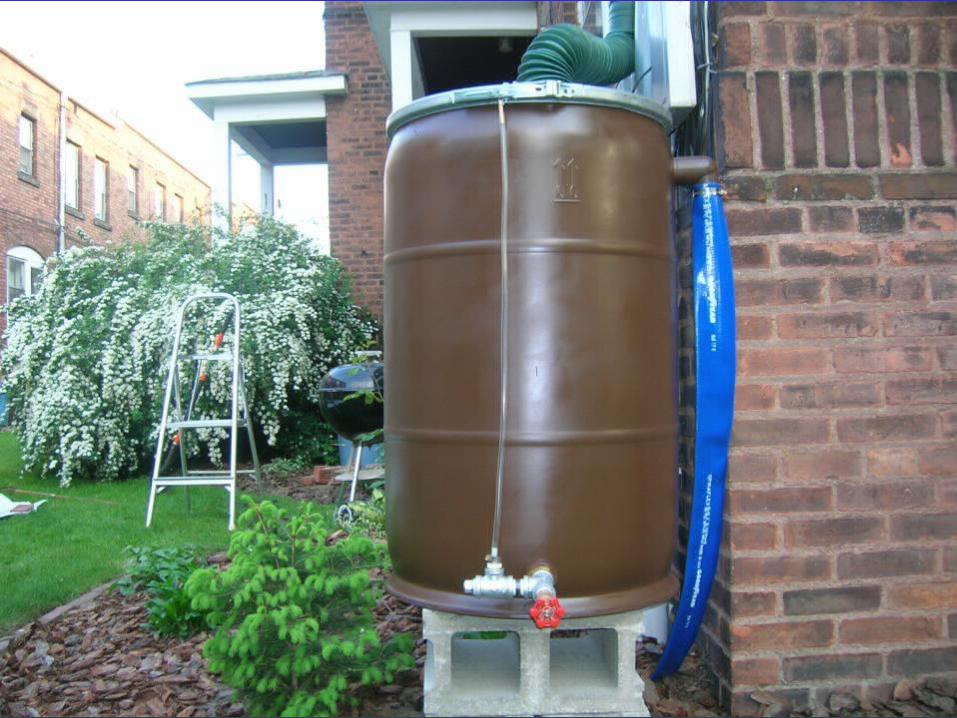
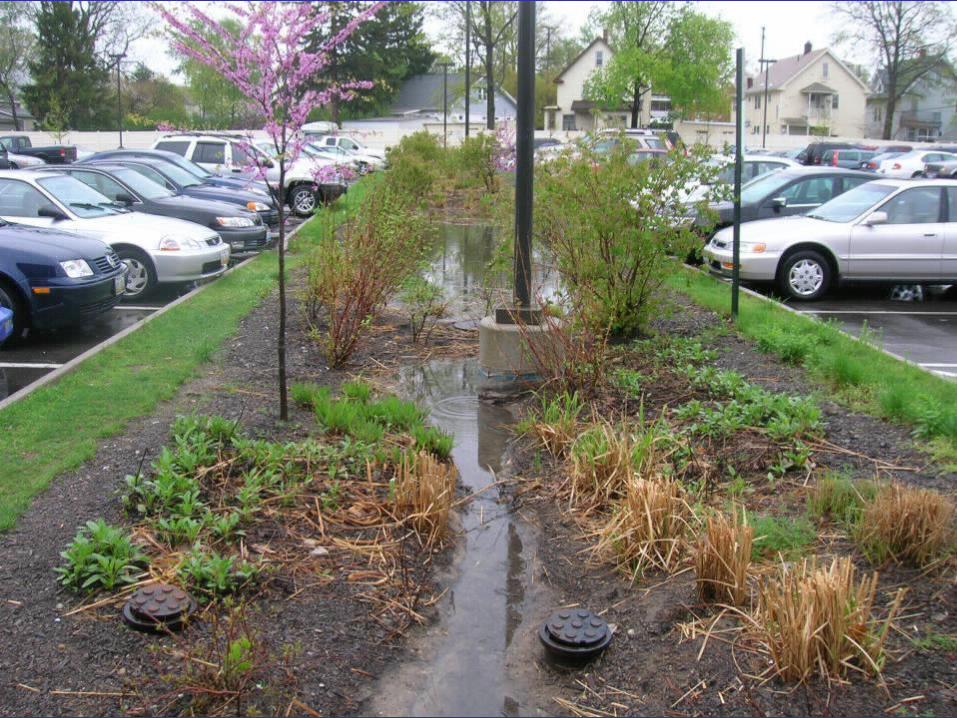
Green Infrastructure