Embed Size (px)
Citation preview

Climate Change Cannot Explain the Upsurge ofTick-Borne Encephalitis in the BalticsDana Sumilo1, Loreta Asokliene2, Antra Bormane3, Veera Vasilenko4, Irina Golovljova4, Sarah E. Randolph1*
1 Department of Zoology, University of Oxford, Oxford, United Kingdom, 2 Centre for Communicable Diseases Prevention and Control, Vilnius,Lithuania, 3 State Agency ‘Public Health Agency’, Riga, Latvia, 4 National Institute for Health Development, Tallinn, Estonia
Background. Pathogens transmitted by ticks cause human disease on a greater scale than any other vector-borne infections inEurope, and have increased dramatically over the past 2–3 decades. Reliable records of tick-borne encephalitis (TBE) since 1970show an especially sharp upsurge in cases in Eastern Europe coincident with the end of Soviet rule, including the three Balticcountries, Estonia, Latvia and Lithuania, where national incidence increased from 1992 to 1993 by 64, 175 and 1,065%,respectively. At the county level within each country, however, the timing and degree of increase showed markedheterogeneity. Climate has also changed over this period, prompting an almost universal assumption of causality. For the firsttime, we analyse climate and TBE epidemiology at sufficiently fine spatial and temporal resolution to question this assumption.Methodology/Principal Finding. Detailed analysis of instrumental records of climate has revealed a significant step increasein spring-time daily maximum temperatures in 1989. The seasonal timing and precise level of this warming were indeed suchas could promote the transmission of TBE virus between larval and nymphal ticks co-feeding on rodents. These changes inclimate, however, are virtually uniform across the Baltic region and cannot therefore explain the marked spatio-temporalheterogeneity in TBE epidemiology. Conclusions/Significance. Instead, it is proposed that climate is just one of manydifferent types of factors, many arising from the socio-economic transition associated with the end of Soviet rule, that haveacted synergistically to increase both the abundance of infected ticks and the exposure of humans to these ticks.Understanding the precise differential contribution of each factor as a cause of the observed epidemiological heterogeneitywill help direct control strategies.
Citation: Sumilo D, Asokliene L, Bormane A, Vasilenko V, Golovljova I, et al (2007) Climate Change Cannot Explain the Upsurge of Tick-BorneEncephalitis in the Baltics. PLoS ONE 2(6): e500. doi:10.1371/journal.pone.0000500
INTRODUCTIONThere is as yet no good explanation for the remarkably rapid
increase in the incidence of tick-borne encephalitis (TBE) over the
past one to two decades in many parts of Europe. Before any
explanation can be found it is essential to define the problem
accurately. Simple national statistics hide considerable variation in
the timing and extent of the increases at finer spatial scales that
makes many of the more obvious explanations unlikely to be
wholly correct. Climate change is all too often proposed as the
cause of the observed upsurges of many different tropical and
temperate vector-borne diseases [inter alia 1–5], including TBE [6–
8]. Changes in surveillance and diagnostic practices are commonly
given as reasons to dismiss the changed incidence as no more than
an artefact. While changes in climate and public health have
undoubtedly occurred over recent decades, such changes are likely
to apply more or less simultaneously across wide geographical and
national regions, respectively, whereas changes in TBE epidemi-
ology show marked spatio-temporal variation and incidence has
not in fact increased everywhere. Furthermore, in Latvia incidence
has decreased again since 1998.
TBE is a typical zoonosis caused by a virus transmitted by ticks,
principally Ixodes ricinus and I. persulcatus, amongst small rodents,
principally mice of the genus Apodemus [9]. Ticks feed only once
per life stage, as larvae, nymphs and adults. Only rodents are
competent transmission hosts for TBE virus, and the period of
rodent infectivity is limited to a few days. Furthermore, only larvae
and nymphs habitually feed on rodents, so that natural
amplification of TBE virus to allow persistent cycles depends on
transmission from the relatively few infected nymphs to the much
more abundant infectible larvae (which then moult to infected,
host-seeking nymphs up to one year later) [10]. This transmission
route demands that larvae and nymphs feed together on individual
rodents (so-called co-feeding), which occurs to different degrees
according to the temperature-driven patterns of seasonal activity
of each tick stage. Tick survival from stage to stage depends on
habitat structure that determines moisture conditions on the
ground and host availability. Together these factors determine the
focal distribution of TBE [11], but have not been shown to
determine incidence.
The risk of exposure of humans to infected tick bites therefore
depends on a wide range of environmental factors, both abiotic
(climate and landscape features) and biotic (tick and host
distributions and abundance), and on socio-economic factors
affecting human behaviour. As the tip of the zoonotic iceberg
expands, explanations should identify factors that determine
growth in the submerged bulk (due mostly to biological factors
that determine the virus transmission potential) and those that
Academic Editor: Colin Sutherland, London School of Hygiene & TropicalMedicine, United Kingdom
Received February 22, 2007; Accepted May 9, 2007; Published June 6, 2007
Copyright: � 2007 Sumilo et al. This is an open-access article distributed underthe terms of the Creative Commons Attribution License, which permitsunrestricted use, distribution, and reproduction in any medium, provided theoriginal author and source are credited.
Funding: This study was funded principally by the Wellcome Trust (grant no.070696/Z/03/Z) and also by the Estonian Science Foundation (grant 5963) and EUgrant GOCE-2003-010284 EDEN; it is catalogued by the EDEN Steering Committeeas EDEN41 (http://www.eden-fp6project.net/). The contents of this publicationare the sole responsibility of the authors and do not necessarily reflect the viewsof the European Commission.
Competing Interests: The authors have declared that no competing interestsexist.
* To whom correspondence should be addressed. E-mail: [email protected]
PLoS ONE | www.plosone.org 1 June 2007 | Issue 6 | e500

cause an increase in relative exposure above the surface (due more
to factors that determine human contact with infected ticks, and
also to human susceptibility to infection). TBE and Lyme
borreliosis (LB), the latter caused by spirochaete bacteria vectored
by the same tick species, are the most significant vector-borne
diseases in Europe. Whereas LB, however, has been recorded non-
systematically only since the mid 1980s, cases of TBE have been
registered systematically for the past 30–50 years. TBE therefore
offers a perfect case study of the diverse impact of humans, both
direct and indirect, on zoonotic risk.
As a first step towards seeking explanations for the geographical
mosaic of TBE epidemiology seen across Europe [12–15], this
study focuses on the Baltic countries. From north to south,
Estonia, Latvia and Lithuania occupy the northeast corner of
Europe on the eastern coast of the Baltic Sea. In the early 1990s, at
the time of independence from Soviet rule, they each experienced
more dramatic increases in national TBE incidence than
anywhere else in Europe apart from Poland, raising their annual
incidence (from c.0.5–7 to 11–54 cases per 100,000 population) to
the highest levels in Europe, matched only by Slovenia. Despite
the small size of these countries (45,200–65,300 km2), the pattern
of TBE increase in individual ‘counties’ (15 in Estonia, 26 in
Latvia and 44 in Lithuania) was markedly non-uniform, but
typically extremely sudden, rising by up to one, even two, orders of
magnitude within a single year relative to the previous 10-year
mean level. Furthermore, the degree of increase was not always
correlated with previous high-risk conditions [16] (see below), and
the year of first increase ranged from 1990 to 1998 for different
counties. Within the Baltic countries there is thus an ideal
opportunity to test whether climate has changed at the right time,
in the right places and in the right way to account for the spatially
variable abrupt discontinuities in TBE incidence. This paper
presents the results of this test and, following a negative result,
proposes an alternative hypothesis to account for the observed
TBE epidemiology.
MATERIALS AND METHODSAnnual TBE case numbers registered by the patients’ place of
permanent residence (county or large city) for the period 1970–
2004 were obtained from national Public Health Agencies in
Estonia, Latvia and Lithuania. More detailed data from Latvia
and Lithuania on the place of infection, where known, indicated
that c.84% of infections were acquired within the patients’ home
county. Human population data, available from National
Statistical Offices from 1970, were used to convert case numbers
into incidence per 100,000 of the population.
Daily or 10-day-mean (dekadal) records of minimum and
maximum air temperature, precipitation (mm) and snow cover
(cm) recorded at 6–8 ground stations per country were acquired
from national Meteorological Agencies (see map). These stations
were selected to be as close as possible to suitable tick habitat and
to be least influenced by heat sources such as airports, factories,
etc. They were also selected to represent observed contrasting
epidemiological patterns and also those parts of Estonia and Latvia
where either I. ricinus ticks occur alone or with I. persulcatus (in
eastern counties) (see map). Where necessary, the daily records
were converted into means for each of three dekads per month to
capture temporal changes at a sufficiently fine resolution to match
tick biology.
Discontinuities in both the epidemiological and meteorological
data were identified by computing generalized distance time series
[17]. The generalized distance D2 is a boundary-locating
algorithm designed to detect sudden changes in mean values over
a given segment of length 2h+1 of the temporal window being
considered (here 1970–2004), where h is a specified number of
time steps. D2 was calculated for every time step j (i.e. year) for
each set of observations, TBE incidence, daily maximum
temperature, rainfall and snow cover, as follows:
D2j ~
(X1{X2)
s21zs2
2
where X1 is the mean of observations from Xj2h to Xj, X2 is the
mean of observations from Xj to Xj+h, and the denominator is
simply the sum of the variances (s2) calculated over each of the two
parts of the temporal window around Xj [18]. To accommodate
the relatively short period of observations available, 35 years,
a value of h = 6 years was selected; short enough to yield a time
series over a meaningful part of this period, but not so short as to
respond too sensitively to short-term fluctuations. With smooth
data, D2 peaks at any discontinuity, whether an increase or
a decrease, but given the highly non-smooth nature of these data,
the precise year of change indicated by the D2 statistic does not
always coincide with a significant change relative to the full data
series [18]. The statistic was therefore interpreted with reference to
absolute values of the raw data, and in conjunction with other
statistics such as anomalies from the overall means and simple
Student’s t-tests applied to the mean values either side of any
discontinuity.
RESULTS
Changes in TBE incidence 1970–2006Nationally, the Baltic countries all show similar patterns of change
in TBE incidence over the past 35 years (Fig. 1), despite the
different mean levels per country. Both Latvia and Lithuania
showed somewhat higher incidence in the late 1970s than
throughout the 1980s, but in Estonia the modest increase in the
late 1970s was maintained through the 1980s. All countries
suffered an abrupt upsurge in 1993, when, relative to the previous
10-year means, incidence increased 2.6-fold in Estonia, 4.5-fold in
Latvia and 13.8-fold in Lithuania and continued to increase over
the following 5 years. Latterly, the incidence in Latvia has reverted
to levels similar to the late 1970s, but no such decline has occurred
in Estonia or Lithuania.
The synchrony of this upsurge does not, however, apply to all
counties within each country. We are here concerned with the
start point of the upsurge, but the peak value of the D2 statistic
indicates the largest discontinuity, with its timing much affected by
isolated events before and after. The start point, therefore, is taken
as the year in which TBE incidence first showed a 2-fold increase
above the previous 10-year mean and also exceeded any previous
level in any one year during those 10 years. It varied from 1990 to
1998, although it occurred in 1993 or 1994 in 50% of counties
(Table 1). There was no consistent change in 10 (12%) counties,
either because incidence was already high and remained so (1
county in Estonia and 2 in Latvia) or because zero or only 1 or 2
cases occurred (1 county in Latvia and 6 in Lithuania). One might
expect the upsurge to occur later where TBE incidence was lower,
but there was no correlation between the timing of the upsurge
and the mean annual incidence over the decade before the
upsurge to support this trivial explanation (R2 = 0.0001, 0.041, and
0.065, p.0.05, n = 26, 15 and 44 for Latvia, Estonia and
Lithuania, respectively).
The following notable points illustrate the variability in the
changing patterns of annual TBE incidence per county, shown in
Fig. 2. Many counties registered zero or extremely few cases before
the early 1990s, after which either the incidence rocketed or only
Tick-Borne Disease Upsurge
PLoS ONE | www.plosone.org 2 June 2007 | Issue 6 | e500

a few cases appeared for several years. The degree of increase in
each county (measured as the ratio of the mean for 5 years post-
increase to the mean for 10 years pre-increase in counties with at
least some cases registered before the upsurge) ranged from 2.5–74
in Estonia to 3–34 in Latvia and 8–706 in Lithuania, and was not
related to the incidence prior to 1980 (i.e. incidence independent
from that used to estimate the proportional increase). In Latvia, of
the eight counties with the highest TBE incidence (.10/100,000)
prior to 1980, six followed the common pattern of reduced
incidence during the 1980s before an upsurge to incidences equal
to or usually higher than the historic levels; exceptions were
Gulbene county (numbered 9 in Fig 2), where annual incidence
was usually lower in the mid-1990s than in the 1980s, and Aluksne
county (immediately northeast of Gulbene), where incidence
increased during the 1980s but very little thereafter. These
variable patterns were not related to the presence of the second
species of tick, I. persulcatus (Fig. 2).
Changes in climate 1970–2004Daily minimum and maximum temperatures were highly
correlated. As the purpose of this analysis is to identify
discontinuities in climatic conditions that may explain the
discontinuities in TBE epidemiology in the Baltic countries during
the period 1970–2004, the results will be presented for maximum
(i.e. day-time) air temperature because there exists some
knowledge of the threshold daily maximum temperature necessary
for I. ricinus host-questing activity [10,19,20], while the biological
relevance of minimum temperatures, presumed to be their impact
on tick mortality, has yet to be quantified.
Annual mean daily maximum air temperatures (AMDMAT) for
the period relevant to TBE epidemiology in the Baltic countries
showed a step increase from 1989 onwards (Fig 3 for an example
at Jelgava, Latvia). The D2 statistic (Fig 3b) peaked at 1988,
reflecting the increase relative to the previous three cool years, but
that merely brought the temperature very close to the overall
mean for 1970–2004 mean. It was not until 1989 that the
temperature consistently exceeded previous levels. There was no
discernible trend either before or after this date, as shown by the
fluctuations about the mean level for each period (horizontal
dotted, Fig 3a), and by the switch in direction, but no change in
magnitude, of the anomalies from the overall mean level for 1970–
2004 (Fig. 3c). At the 20 sites investigated, the increase in the mean
level of the AMDMAT between 1970–1988 and 1989–2004 was
0.94–1.38uC and was maximally statistically significant at this
breakpoint in all cases (Student’s t = 3.05–5.08, df = 33, p,0.005)
(Table S1).
Annual mean conditions serve to focus attention on the
discontinuous nature of past temperature increases in Europe,
but are irrelevant to any type of free-living organism that lives
under seasonally variable daily thermal conditions. Anomalies
from the overall mean levels of each monthly mean daily
maximum air temperatures (MMDMAT) for 1970–2004 reveal
that increases in winter-early spring temperatures contributed
most to the change in AMDMAT (Fig. 4). At all sites, during
January to April an abrupt and statistically significant switch from
predominantly negative to predominantly positive anomalies
occurred in 1989. A similar temperature increase occurred in
July at 14 of the 20 sites, in August at 16 sites and in September at
4 sites (Table S1), but in these months the most marked switch
occurred in 1991 rather than 1989 (Fig. 4). On the other hand,
mean levels of MMDMAT were marginally lower for 1989–2004
than 1970–88 in May (at 12 sites), June (5), October (7), November
(19) and December (9).
Even these monthly means hide details at time scales relevant to
tick biology. Increased air temperatures during the winter and
early spring are irrelevant to ticks that are inactive under such cold
conditions (see mean monthly temperatures 1989–2004, Table S1)
undergoing overwinter diapause at soil level, commonly beneath
snow cover. The critical time for ticks in the Baltic countries is
April, when temperatures start to cross the threshold for activity,
and the time scale appropriate to the onset of activity by ticks of
Table 1. Years in which the upsurge in TBE started in eachcounty within the Baltic countries.
. . . . . . . . . . . . . . . . . . . . . . . . . . . . . . . . . . . . . . . . . . . . . . . . . . . . . . . . . . . . . . . . . . . . . .
No. counties with TBE upsurge starting in each year
Estonia Latvia Lithuania
1990 1
1991 2 2 1
1992 2 3 2
1993 1 12 13
1994 4 3 10
1995 1 1 5
1996 2 1 2
1997 1 4
1998 1 1
no consistentchange
1 3 6
For definition of upsurge, see text.doi:10.1371/journal.pone.0000500.t001....
....
....
....
....
....
....
....
....
....
....
....
....
....
....
....
..
Figure 1. National annual TBE incidence per 100,000 population,1970–2006 in Estonia, Latvia and Lithuania.doi:10.1371/journal.pone.0000500.g001
Tick-Borne Disease Upsurge
PLoS ONE | www.plosone.org 3 June 2007 | Issue 6 | e500

different stages with different temperature sensitivities is dekadal
(10-day) rather than monthly. For March and April, there was no
significant step increase in 1989, nor any other trend, in dekadal
mean daily maximum air temperatures (DMDMAT) for the third
dekad of March or the first dekad of April, but there was for the
first two dekads of March (not shown) and the last two dekads of
April (Fig. 5 and Table S1). Furthermore, exclusive to the third
dekad of April, there was a much more significant step increase in
1993 than in 1989, clear from both the absolute mean
temperatures and the D2 statistic: at Jelgava, for example, the
DMDMAT was on average 2uC higher for 1989–92 than for
1970–88, but 4uC higher for 1993–2004 than for 1989–92. This
Figure 2. Annual TBE incidence per 100,000 population (y-axis) in each county of Estonia, Latvia and Lithuania, 1970–2004 (x-axis). I. ricinus ispresent throughout and I. persulcatus occurs in the darker shaded areas of Estonia and Latvia. The numbers refer to the 20 counties for whichmeteorological data have been analyzed: Estonia, 1 Saaremaa, 2 Laanemaa, 3 Parnumaa, 4 Harjumaa, 5 Ida-Virumaa, 6 Jogevamaa, 7 Tartumaa,8 Vorumaa; Latvia, 9 Gulbene, 10 Rezekne, 11 Kraslava 12 Jelgava, 13 Talsi, 14 Liepaja; Lithuania, 15 Klaipeda, 16 Siauliai, 17 Birzai, 18 Utena, 19Kaunas, 20 Vilnius.doi:10.1371/journal.pone.0000500.g002
Tick-Borne Disease Upsurge
PLoS ONE | www.plosone.org 4 June 2007 | Issue 6 | e500

pattern was consistent for all sites in the Baltics, although least
marked in Estonia (Table S1), with the effect that in all years since
1993 (except for 1997 at 9 sites throughout the region, plus 2003 at
2 sites in Estonia, and 6 years at the southern tip of the island of
Saaremaa, Estonia) DMDMAT for the third dekad of April has
been consistently above 10uC (Fig. 6: data for Latvia shown, data
for Estonia and Lithuania not shown). This is the approximate
threshold for larval I. ricinus activity and therefore permits co-
feeding of larvae with nymphs (see Introduction). In years prior to
1993, and in dekads prior to the end of April, DMDMAT
commonly fell between 7uC (the threshold for nymphal activity)
and 10uC (Figs. 5, 6), therefore permitting nymphs to feed in the
absence of co-feeding larvae. There was no spatial variation in this
pattern of temperature change during the spring, nor at any other
time of the year, that could be related to the variable patterns of
increase in TBE incidence in each county. Conversely, exhaustive
efforts failed to identify any relationship between the inter-annual
variation in any aspect of thermal conditions and the highly
variable annual TBE incidence per county throughout the Baltic
countries, either during the recent decade of high incidence or for
the whole period 1970–2004.
Two aspects of precipitation are relevant to tick-borne diseases:
rainfall, especially during the summer when ticks may die of
desiccation, and snow cover as a protective blanket for ticks
undergoing diapause at ground level. Throughout the region,
there were small but statistically significant changes in monthly
Figure 3. Annual mean daily maximum air temperature recorded atthe meteorological station at Jelgava, Latvia. A) Annual mean dailymaximum air temperature, with mean temperatures 1970–1988 and1989–2004 indicated by the horizontal dotted line. B) Generalizeddistance statistic D2 indicating the major discontinuity through time. C)Anomalies from the mean level 1970–2004. The vertical dashed lineindicates the timing of the marked increase from 1989 onwards (seetext).doi:10.1371/journal.pone.0000500.g003
Figure 4. Monthly mean daily maximum air temperature recorded atthe meteorological station at Jelgava, Latvia. A) Monthly mean dailymaximum air temperature 1970–88 (black line) and 1989–2004 (greyline). B) Anomalies from the mean level 1970–2004 for months thatshow a significant increase in temperature from 1989, indicated by thevertical dashed line.doi:10.1371/journal.pone.0000500.g004
Tick-Borne Disease Upsurge
PLoS ONE | www.plosone.org 5 June 2007 | Issue 6 | e500

rainfall most commonly starting around 1990, although the precise
timing of the maximally significant discontinuities varied geo-
graphically and from month to month (Fig. 7, Table 2). Most
Figure 5. Dekadal mean daily maximum air temperature for21.March-30. April recorded at the meteorological station, Jelgava,Latvia. The horizontal dotted lines indicate mean temperatures for1970–1988 and 1989–2004, except for the 3rd dekad of April, where themore marked increase from 1993 is also highlighted; this discontinuityis confirmed by the D2 statistic peak (bottom graph).doi:10.1371/journal.pone.0000500.g005
Figure 6. TBE incidence (grey bars), and daily maximum temperaturefor 2nd (thin line) and 3rd (heavy line) dekads of April. Examples frommeteorological stations in each of six counties in Latvia.doi:10.1371/journal.pone.0000500.g006
Tick-Borne Disease Upsurge
PLoS ONE | www.plosone.org 6 June 2007 | Issue 6 | e500

consistent was an increase in rainfall during February from 1990 or
a little earlier (also in January and March in some parts, notably
Estonia) (Fig. 7, Table 2). At about the same time, June also
became wetter in many places. Although rainfall in the late
summer was most variable (see anomalies in Fig. 7b), a statistically
significance decrease was commonly recorded in July from 1991 in
Latvia, and in September from 1995 in Latvia but 1989 in Estonia.
Overall, significant rainfall changes were less common in Lithuania.
Snow cover in Latvia and Lithuania (records not available for
Estonia) melted by the end of March, with small amounts sometimes
persisting into April, and reappeared in very small amounts (typically
1–2 cm) during October and November. Snow cover in January–
March was markedly deeper (commonly 10–40 cm) during 1976–
87, decreasing significantly from 1988 except in counties of low snow
fall on the west coast, but appearing slightly earlier in late autumn in
some years at some places (Table 2).
Again it proved impossible to relate these spatial and temporal
patterns of changes in either rainfall or snow cover to the
epidemiology of TBE.
DISCUSSION
Is the upsurge of TBE in the Baltic countries an
artefact?The heterogeneity (Fig 2) in the timing and degree of changes in
the incidence of TBE between counties within each country is
inconsistent with increased incidence being due to any national
changes in public health practices. Furthermore, exhaustive
searches through archives (paper and electronic) and face-to-face
discussions with public health and medical personnel active both
before and after the up-surge in cases of TBE, have provided
convincing evidence (D. Sumilo 2006, DPhil thesis, Oxford
University) that any changes in public health activities may
possibly have exaggerated the up-surge a little, but cannot explain
its full extent. Serological diagnosis of TBE was in place from the
1970s and all notified cases were required to be laboratory
confirmed. The ELISA method of diagnosis was introduced in
1993 in Estonia and Latvia, but not until 1994 in Lithuania, and
ran in parallel with the earlier haemaglutination inhibition method
for a few years. There is consistent denial, by both Baltic and
Russian professionals, of any suppression of TBE case reports
under Soviet rule. The conclusion is that the upsurge in TBE
incidence was real and requires an explanation.
The explanatory power of climate changeFrom this analysis it is clear that aspects of climate that are
relevant to tick-borne encephalitis transmission have changed over
the past 35 years. It is equally clear, however, that although these
changes may have provided a generally more permissive climatic
background for TBEv transmission, they are too similar through-
out the Baltic countries to account for the highly heterogeneous
patterns of change in TBE incidence since the early 1990s. Spring
temperatures have increased significantly, but as a step increase in
1989 rather than in the gradual way normally implied by seeking
trends and superimposing a best-fit curve [21,22]. Our method of
applying a statistic designed to identify discontinuities, and then
cutting the 35-year time series at the identified point of dis-
continuity, not only reflects the observations, but also coinciden-
tally focuses attention on the critical period in relation to TBE
epidemiology. It is not the purpose of this paper to address the
larger picture of climate change (nor to provide explanations for
the meteorological observations), but the conclusions are not
diminished by extending the observations back to the 1960s or to
other parts of Europe; a step increase is apparent in temperature
Figure 7. Daily rainfall (mm) recorded at the meteorological stationat Jelgava, Latvia. A) Monthly mean daily rainfall 1970–89 (black line)and 1990–04 (grey line). B) Anomalies from the mean level 1970–2004for months that show a (significant, marked with an asterisk) changeafter the year indicated by the vertical dashed line (see Table 2).doi:10.1371/journal.pone.0000500.g007
Tick-Borne Disease Upsurge
PLoS ONE | www.plosone.org 7 June 2007 | Issue 6 | e500

records for most of Europe, with fluctuations but no consistent
change prior to the end of the 1980s (http://ipcc-ddc.cru.uea.ac.uk).
Estimates of the mean increase in temperature are given (Table S1)
to illustrate the regional uniformity and seasonality of the warming.
The observed temperature changes from 1989 could have
enhanced the transmission potential for TBEv by permitting
earlier onset of tick activity in the spring. This could have been
exacerbated from 1993 onwards when mean daily maximum
temperatures at the end of April consistently exceeded the
threshold for larval I. ricinus activity (c.10uC [10]), thereby
reducing the delay between the onset of conditions permissive
for this stage and for nymphal I. ricinus (7uC [10,19,20]). Changes
such as this, which would increase the seasonal synchrony
consistently between these tick stages to permit virus transmission
from infected nymphs to infectible larvae co-feeding on rodents,
would be expected to increase the prevalence of infection in ticks
[11]. Temperature thresholds for I. persulcatus activity are un-
known. A short delay of a few years between this climate change
and the upsurge of TBE incidence might be expected, as the
majority of larvae feeding and acquiring virus in one year do not
give rise to infected host-questing nymphs until the following year
[23] and infection prevalence in the tick population could take
time to build up. The timing of the upsurge is consistent with this
only in some counties (Table 1), and its variability cannot be
accounted for by the uniform timing of the temperature changes.
The same sort of conclusion arises from considering daily
minimum temperatures that have changed in parallel with
maximum temperatures. In this case, the biological significance
Table 2. Years of maximally statistically significant discontinuities in rainfall and snow cover recorded at sites in the three Balticcountries.
. . . . . . . . . . . . . . . . . . . . . . . . . . . . . . . . . . . . . . . . . . . . . . . . . . . . . . . . . . . . . . . . . . . . . . . . . . . . . . . . . . . . . . . . . . . . . . . . . . . . . . . . . . . . . . . . . . . . . . . . . . . . . . . . . . . . . . . . . . . . . . . . . .
Rainfall Year of maximally significant discontinuity
County Jan Feb Mar Apr May June July Aug Sep Oct Nov Dec
Latvia Jelgava 1990 1990 1990 1988 1991 1991 1995
Dagda 1990 1988 1991 1991
Gulbene 1990 1990 1988 1995 1991
Liepaja 1990 1991
Rezekne 1990 1991 1995
Talsi 1990 1990
Lithuania Birzai 1990 1991 1989
Kaunas 1989
Klaipeda 1987 1991 1993
Siauliai 1990 1987 1989 1992
Utena 1989 1987 1987 1987 1989
Vilnius 1989
Estonia Harjumaa 1990 1989
Laanemaa 1987 1994 1993
Parnumaa 1990 1991 1992 1988
Saaremaa 1989 1989
Jogevamaa 1989 1988 1989 1989
Ida-Virumaa 1989 1989 1989
Tartumaa 1990 1990 1990 1989
Vorumaa 1990 1990 1988 1989
Snow cover
Latvia Jelgava
Dagda 1988 1989 1990
Gulbene 1988 1989 1990
Liepaja
Rezekne 1988 1988 1989
Talsi 1988 1990
Lithuania Birzai 1988 1988 1987
Kaunas 1988
Klaipeda
Siauliai 1988 1992 1988
Utena 1988 1986
Vilnius 1988 1988 1986 1991 1988
Italics indicate an increase, non-italics indicate a decrease. Bold type, p,0.05, regular type, p,0.1 for Student’s t-test on mean values for periods either side of thediscontinuity (within the period 1970–2004).doi:10.1371/journal.pone.0000500.t002..
....
....
....
....
....
....
....
....
....
....
....
....
....
....
....
....
....
....
....
....
....
....
....
....
....
....
....
....
....
....
....
....
....
....
....
....
....
.
Tick-Borne Disease Upsurge
PLoS ONE | www.plosone.org 8 June 2007 | Issue 6 | e500
of warming may lie in reduced tick overwinter mortality. As would
be expected from the geographical distribution of I. ricinus as far
north as c.65uN in Sweden [24] and I. persulcatus across northern
Russia, both tick species are adaptively cold-hardy, but neverthe-
less I. ricinus has been observed to suffer increased mortality when
exposed experimentally to increasingly sub-zero temperatures
below 210uC [25]. The natural level of mortality, however, and
its sensitivity to natural winter conditions beneath snow cover are
not known. In any case, whatever the improvement in overwinter
survival caused by the step increase in minimum temperatures
from 1989 onwards, the pattern of increased minimum temper-
ature was similar throughout the region. Furthermore, the
different range of these two tick species suggests differential
sensitivities to thermal conditions, but there is no consistent
difference in patterns of TBE change in counties dominated by
either I. ricinus or I. persulcatus in Estonia and Latvia (Fig. 2).
Decreased rainfall in mid to late summer could adversely affect
ticks, causing increased desiccation stress, but because this
decrease occurred during the wettest season of the year, and also
commonly followed an increase in rainfall in June, it is unlikely
that conditions became limiting for either survival or questing by
ticks. The observed 25% decrease in rainfall may, however, have
allowed an increase in people’s outdoor recreation, which is known
commonly to include visits to tick-infested forests (see below).
In conclusion, in the absence of any identified differences between
counties, climate changes alone do not offer a sufficient explana-
tion for the observed spatio-temporal heterogeneity in epidemio-
logical changes.
An alternative hypothesis to explain the
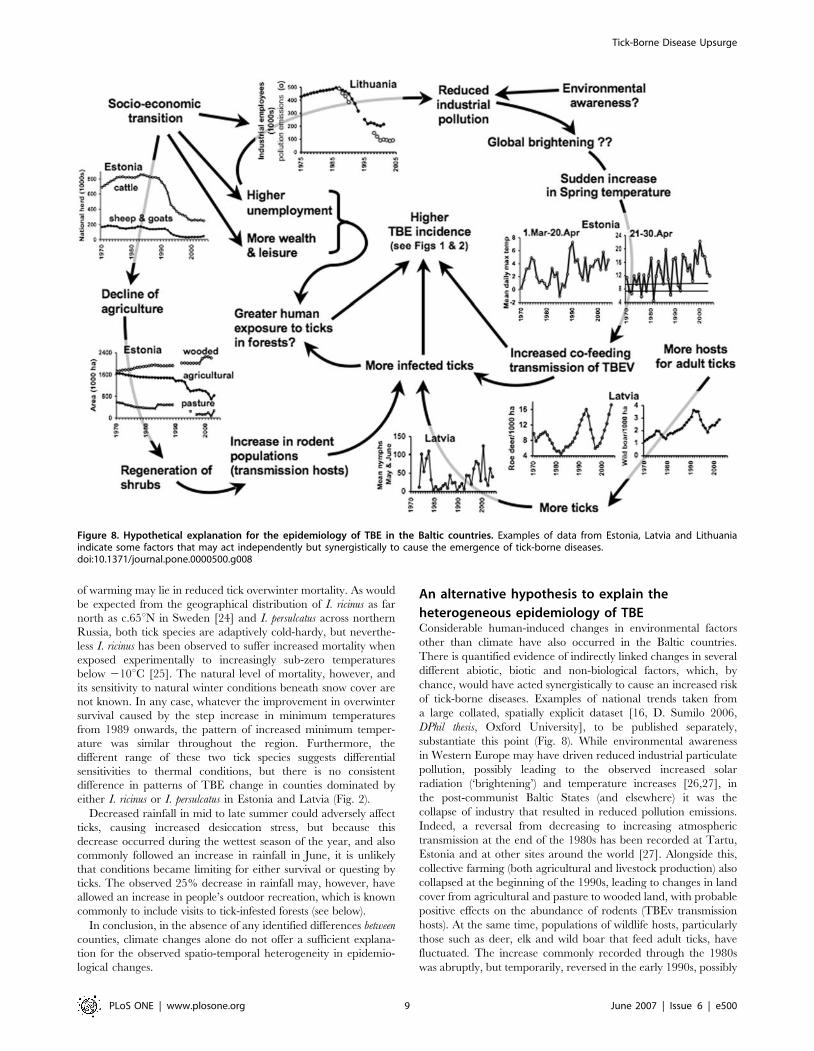
heterogeneous epidemiology of TBEConsiderable human-induced changes in environmental factors
other than climate have also occurred in the Baltic countries.
There is quantified evidence of indirectly linked changes in several
different abiotic, biotic and non-biological factors, which, by
chance, would have acted synergistically to cause an increased risk
of tick-borne diseases. Examples of national trends taken from
a large collated, spatially explicit dataset [16, D. Sumilo 2006,
DPhil thesis, Oxford University], to be published separately,
substantiate this point (Fig. 8). While environmental awareness
in Western Europe may have driven reduced industrial particulate
pollution, possibly leading to the observed increased solar
radiation (‘brightening’) and temperature increases [26,27], in
the post-communist Baltic States (and elsewhere) it was the
collapse of industry that resulted in reduced pollution emissions.
Indeed, a reversal from decreasing to increasing atmospheric
transmission at the end of the 1980s has been recorded at Tartu,
Estonia and at other sites around the world [27]. Alongside this,
collective farming (both agricultural and livestock production) also
collapsed at the beginning of the 1990s, leading to changes in land
cover from agricultural and pasture to wooded land, with probable
positive effects on the abundance of rodents (TBEv transmission
hosts). At the same time, populations of wildlife hosts, particularly
those such as deer, elk and wild boar that feed adult ticks, have
fluctuated. The increase commonly recorded through the 1980s
was abruptly, but temporarily, reversed in the early 1990s, possibly
Figure 8. Hypothetical explanation for the epidemiology of TBE in the Baltic countries. Examples of data from Estonia, Latvia and Lithuaniaindicate some factors that may act independently but synergistically to cause the emergence of tick-borne diseases.doi:10.1371/journal.pone.0000500.g008
Tick-Borne Disease Upsurge
PLoS ONE | www.plosone.org 9 June 2007 | Issue 6 | e500

due to increased abundance of wolves as hunters turned their
attention to more edible targets. A rare long-term record of a tick
population in Rigas county, Latvia, indicates increasing abun-
dance from the mid 1990s, but to levels no higher than those
recorded in the 1970s, and rather too late to account fully for the
c.3-fold greater incidence in TBE in Rigas county from 1993
(Fig. 2).
As the demand for labour in both agriculture and industry
decreased in the Baltics, different approaches to managing this
transition led to increased polarisation in economic conditions
both between and within the countries during the 1990s. People in
Estonia were more successful in keeping their jobs or moving into
other sectors, especially in the growing service sector, than those in
Latvia and Lithuania. In these latter two countries, more than half
of those employed in agriculture in 1990 were not in employment
by 2000, therefore relying on income from sources other than paid
jobs (28).
A cross-sectional survey of over 1,000 people carried out in
2001 in Latvia showed that on average 69% of adults visited
forests more or less regularly for work, food harvest or leisure
purposes [29]. Nearly 80% of people in both the lowest and the
highest income groups had visited forests over the previous
2 years, compared to 67% on average incomes, and were
therefore more likely to be exposed to tick-infested habitats.
Picking mushrooms and berries was stated as the principal reason
for frequent visits to forests by female, older, poorer, less well
educated and rural people, while younger people and the better
paid and better educated city dwellers combined mushroom- and
berry-picking with recreational walking on their less frequent visits
[30]. Men were more likely to work in forests. Picking up a tick
was not limited to, but was several times more likely amongst,
forest visitors, and especially amongst people involved in food
gathering or work. The role of human behaviour in determining
risk of exposure to TBE virus is further emphasized by data on tick
bites reported to Latvia’s national Public Health Agency in Riga;
irrespective of the local seasonal abundance of questing ticks, most
tick bites occurred over the summer when rain-free weekends
followed a week of heavy rainfall [30]. This pattern of exposure to
ticks is consistent with people visiting forests to collect mushrooms
immediately after good conditions for fungal growth.
Vaccination against TBE offers very effective protection, and
people who had visited forests, no matter how infrequently, were
more likely to have been vaccinated than those who had not visited
a forest recently [29,30]. Those on higher incomes, however, were
up to five times more likely to be vaccinated than those on the
lowest incomes. Therefore, even though both groups did indeed
report higher than average contact with ticks, people on lower
incomes would have had a higher probability of TBE infection if
bitten by an infected tick.
Taking all factors into consideration, post-communist social
transition would have created socio-economic conditions likely to
increase human exposure to ticks to a greater or lesser extent.
Variable contributions of each factor in different places at different
times, due to normal regional variation in environmental and
cultural conditions, alongside the more uniform changes in
climate, would offer a powerful conceptual explanation for the
spatio-temporal heterogeneity in upsurge in TBE across the Baltic
States and also Central and Eastern Europe (see the EU-F6 EDEN
project at http://www.eden-fp6project.net/), and also for the
marked decreases in TBE incidence in many Baltic counties since
1999 [30]. Evidence for such variation exists and is highly
suggestive (D. Sumilo 2006, DPhil thesis, Oxford University). The
next goal is a spatially explicit quantification of this complex
network of environmental and human factors, each changing
independently yet indirectly linked, and apparently acting
synergistically on the enzootic transmission cycles and/or degree
of human exposure. This will allow predictions over large
heterogeneous regions to test this hypothesis and warn of potential
future changes if conditions continue to change in similar ways.
SUPPORTING INFORMATION
Table S1 Annual, monthly and dekadal (for April) mean daily
maximum temperatures oC for 1989–2004 (columns A), and
increases or decreases relative to 1970–88 (columns B). Statistically
significant (p,0.05) changes are shown in bold.
Found at: doi:10.1371/journal.pone.0000500.s001 (0.05 MB
XLS)
ACKNOWLEDGMENTSData for this study were supplied by the Meteorological and Hydrological
Institute, the Health Protection Inspectorate and National Institute for
Health Development in Estonia, the Environment, Geology and
Meteorology Agency and the State Public Health Agency in Latvia, and
the Hydrometeorological Service and the Centre for Communicable
Diseases Prevention and Control in Lithuania. We thank all the members
of the EDEN-TBD sub-project for valuable discussions and supporting
climate data from other parts of Europe.
Author Contributions
Conceived and designed the experiments: SR. Analyzed the data: SR DS.
Wrote the paper: SR. Other: Acquired the data from national sources and
contributed considerable expertise: AB VV IG LA.
REFERENCES1. Epstein PR (2001) West Nile Virus and the climate. J Urban Hlth 78(2):
367–371.
2. Patz J (2002) A human disease indicator for the effects of recent global climatechange. Proc Natl Acad Sci USA 99(20): 12506–12508.
3. WHO (2003) Climate Change and Human Health-Risks and Responses.
Geneva: WHO. 297 p.
4. Epstein PR (2005) Climate change and human health. New Eng J Med 353(11):
1433–1436.
5. Menne B, Ebi KL, eds (2006) Climate Change and Adaptation Strategies for
Human Health. Darmstadt: Springer. 449 p.
6. Lindgren E, Gustafson R (2001) Tick-borne encephalitis in Sweden and climate
change. Lancet 358: 16–18.
7. Daniel M, Danielova V, Kriz B, Jirsa A, Nozicka J (2003) Shift of the tick Ixodes
ricinus and tick-borne encephalitis to higher altitudes in central Europe. Eur J Clin
Microbiol Infect Dis 22: 327–328.
8. Daniel M, Danielova V, Krız B, Benes C (2006) Tick-borne encephalitis. In:
Menne B, Ebi KL, eds (2006) Climate Change and Adaptation Strategies for
Human Health. Darmstadt: Springer. pp 189–205.
9. Labuda M, Randolph SE (1999) Survival of tick-borne encephalitis virus:
cellular basis and environmental determinants. Zentralbl Bakteriol 288:513–524.
10. Randolph SE (2004) Tick ecology: processes and patterns behind the
epidemiological risk posed by ixodid ticks as vectors. Parasitology 129: S37–66.
11. Randolph SE, Green RM, Peacey MF, Rogers DJ (2000) Seasonal synchrony:
the key to tick-borne encephalitis foci identified by satellite data. Parasitology121: 15–23.
12. Randolph SE (2001) The shifting landscape of tick-borne zoonoses: tick-borne
encephalitis and Lyme borreliosis in Europe. Phil Trans Roy Soc B 356:
1045–1056.
13. Suss J, Schrader C, Abel U, Bormane A, Duks A et al (2002) Characterisation oftick-borne encephalitis (TBE) foci in Germany and Latvia (1997–2000). Int J Med
Microbiol 291 S33: 34–42.
14. Suss J (2003) Epidemiology and ecology of TBE relevant to the production of
effective vaccines. Vaccine 21: S1/19–S11/35.
15. Randolph SE (2006) EDEN-Emerging diseases in a changing European
environment: Tick-borne diseases. Int J Med Microbiol 296 (S1): 84–86.
Tick-Borne Disease Upsurge
PLoS ONE | www.plosone.org 10 June 2007 | Issue 6 | e500

16. Sumilo D, Bormane A, Asokliene L, Lucenko I, Vasilenko V, Randolph SE
(2006) Tick-borne encephalitis in the Baltic States: identifying risk factors in
space and time. Int J Med Microbiol 296 (S1): 76–79.
17. Davis JC (1986) Statistics and Data Analysis in Geology. New York: Wiley.
18. Gleason ACR, Prince SD, Goetz SJ, Small J (2002) Effects of orbital drift on
land surface temperature measured by AVHRR thermal sensors. Rem Sens
Environ 79: 147–165.
19. Macleod J (1935) Ixodes ricinus in relation to its physical environment. II. The
factors governing survival and activity. Parasitology 27: 123–144.
20. Perret J-L, Guigoz E, Rais O, Gern L (2000) Influence of saturation deficit and
temperature on Ixodes ricinus tick questing activity in a Lyme borrelosis-endemic
area (Switzerland). Parasitol Res 86: 554–557.
21. Houghton JT, Ding Y, Griggs DJ, Noguer M, van der Linden PJ, et al. (2001)
Climate Change 2001: the Scientific Basis. Cambridge University Press. 881 p.
22. Barnett C, Hossell J, Perry M, Proctor C, Hughes G (2006) A handbook of
climate trends across Scotland. Scotland&Northern Ireland Forum for
Environmental Research. 62 p.
23. Randolph SE, Green RM, Hoodless AN, Peacey MF (2002) An empirical
quantitative framework for the seasonal population dynamics of the tick Ixodes
ricinus. Int J Parasitol 32: 979–989.
24. Talleklint L, Jaenson TGT (1998) Increasing geographical distribution and
density of Ixodes ricinus (Acari: Ixodidae) in central and northern Sweden. J MedEntomol 35: 521–526.
25. Dautel H, Knulle W (1997) Cold hardiness, supercooling ability and causes of
low-temperature mortality in the soft tick, Argas reflexus, and the hard tick, Ixodes
ricinus (Acari: Ixodidae) from central Europe. J Insect Physiol 43: 843–854.
26. Sharma S, Lavoue D, Cachier H, Barrie LA, Gong SL (2004) Long-term trendsof the black carbon concentrations in the Canadian Arctic. J Geophys Res-
Atmos 109: D15203–15212.
27. Wild M, Gilgen H, Roesch A, Ohmura A, Long CN et al (2005) From dimmingto brightening: decadal changes in solar radiation at Earth’s surface. Science
308: 847–850.28. Reutersward A (2003) Labour markets and social policies in the Baltic Countries.
Paris: Organisation for Economic Co-operation and Development. 177 p.29. SKDS Marketing and Public Opinion Research Centre (2001) [Investigation
into the factors hindering immunisations of the population against diphtheria
and tick-borne encephalitis] (in Latvian). Riga: SKDS, Latvia. 179 p.30. Sumilo D, Asokliene L, Avsic-Zupanc T, Bormane A, Vasilenko V, Lucenko I,
Golovljova I, Randolph SE (2007) Incidence-dependent decreases in tick-borneencephalitis exceed vaccination in the Baltics and Slovenia. Emerg Infect Dis (in
review).
Tick-Borne Disease Upsurge
PLoS ONE | www.plosone.org 11 June 2007 | Issue 6 | e500