Embed Size (px)
Citation preview

Climate Change Implications for Future Energy Systems
January 16, 2008, Verbund, Vienna.
Arnulf Grubler – FES Yale University and IIASA
Contact: [email protected]

Drivers of the Climate Change Challenge
• Demographic (growth & composition)• Economic (growth, structure, disparities)• Social (values, lifestyles, policies)• Technologic (rates & direction of change)• Environmental (limits, adaptability)• Valuation (discounting, non-market
damages and benefits)
Forecasting impossible! → Scenario Approach
Drivers can be both source and remedy!

Global Carbon & Warming Budgets
Scope for climate stabilization efforts depend on:(1) Baseline and (2) Climate Target

A Taxonomy of Scenarios (ex. IPCC SRES)
Different combination of driving forcescan lead to similar emissions and climate change outcomes
EMISSIONS:
High: POP: HighGDP: Medium
Efficiency: LowTECH: Dirty
Medium:
Low: POP: LowGDP: High
Efficiency: HighTECH: Clean
Largest TECH leverage of climate policies:high GDP (capital turnover) and high efficiency!
A1T
A1B A1FI
A1FIA2A1B
B2A1T
B1
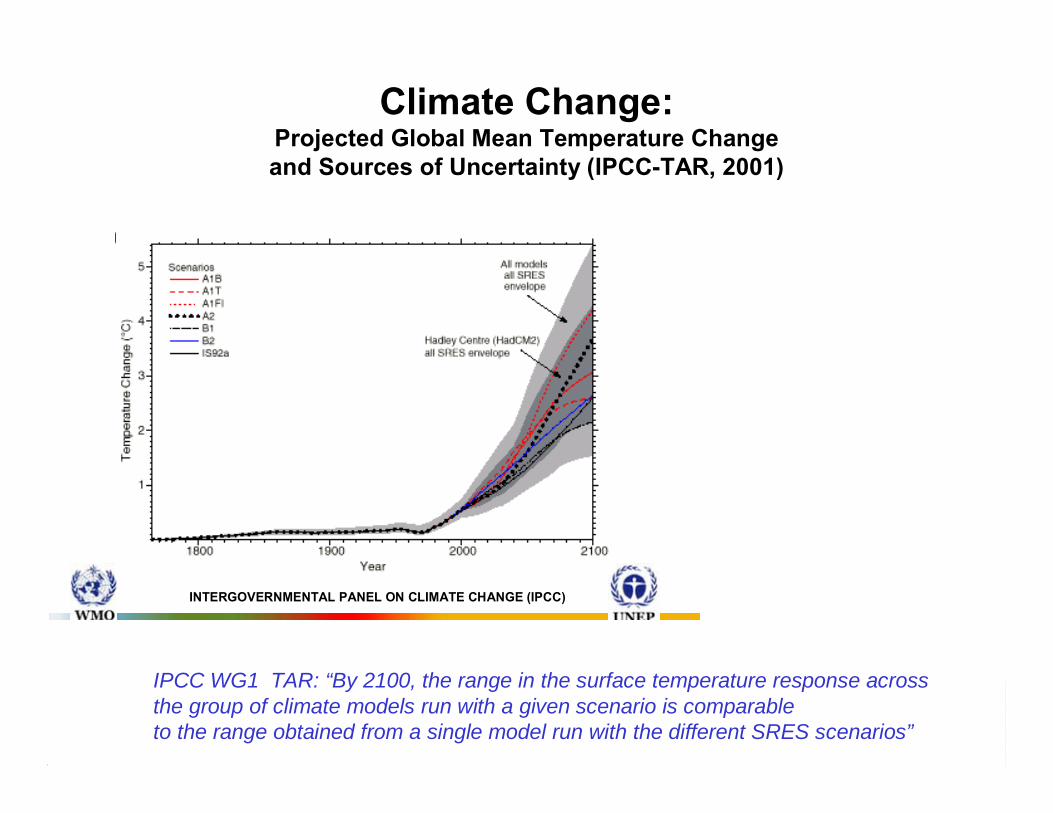
Climate Change:Projected Global Mean Temperature Change and Sources of Uncertainty (IPCC-TAR, 2001)
INTERGOVERNMENTAL PANEL ON CLIMATE CHANGE (IPCC)
IPCC WG1 TAR: “By 2100, the range in the surface temperature response acrossthe group of climate models run with a given scenario is comparableto the range obtained from a single model run with the different SRES scenarios”
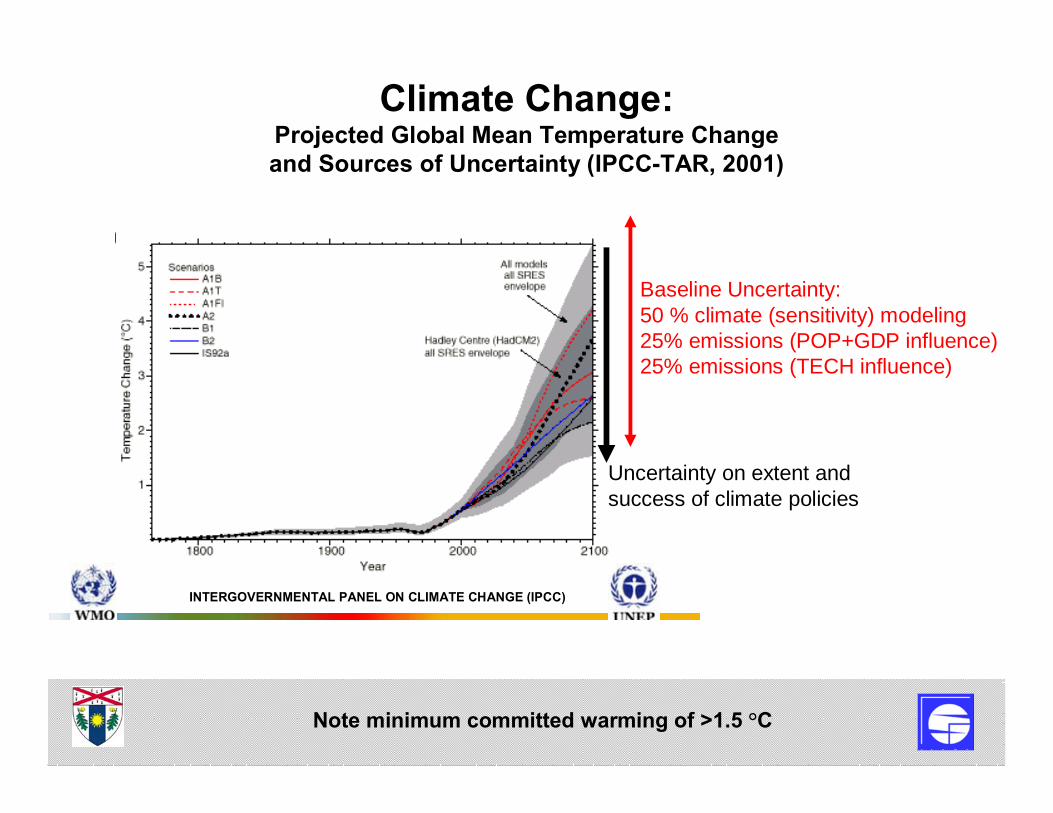
Climate Change:Projected Global Mean Temperature Change and Sources of Uncertainty (IPCC-TAR, 2001)
INTERGOVERNMENTAL PANEL ON CLIMATE CHANGE (IPCC)
Baseline Uncertainty:50 % climate (sensitivity) modeling25% emissions (POP+GDP influence)25% emissions (TECH influence)
Uncertainty on extent and success of climate policies
Note minimum committed warming of >1.5 °C

Projected Surface Temperature ChangeA1B, 2090A1B, 2090--2099 relative to 19802099 relative to 1980--19991999
Source: IPCCSource: IPCC--AR4 WG1, 2007AR4 WG1, 2007

EU Regional Climate Variability:Observations (b)modeled for present (c)and future (d)conditions.
Note 2003 heat wave being far outside both observational and model range.
IPCC uncertainty terminology (adopted from Schneider and Moss) :<1% probability =“exceptionally unlikely” (but 2003 happened!)

Air Conditioning
n.a.7%China
(urban HH)
27%5%EU~100%85%Japan
80%81%US
% commercial buildings with AC
% of Households with AC
Conservative Projection: 4-fold increase in EU to 2020worldwide to 2030
World AC electricity use: 2000: 800 TWh2030: >2700 TWh(=75% of total US electricity)
Source: P. Waide, IEA

Projected Water Availability (Runoff)
Source: IPCCSource: IPCC--AR4 WG1, 2007AR4 WG1, 2007
A1B, 2090A1B, 2090--2099 relative to 19802099 relative to 1980--19991999
Note: Hatched areas indicate good model agreement,white areas indicate model disagreement

Agricultural Impacts of Climate Change Scenarios.
Source: IIASA LUCC, 2000.
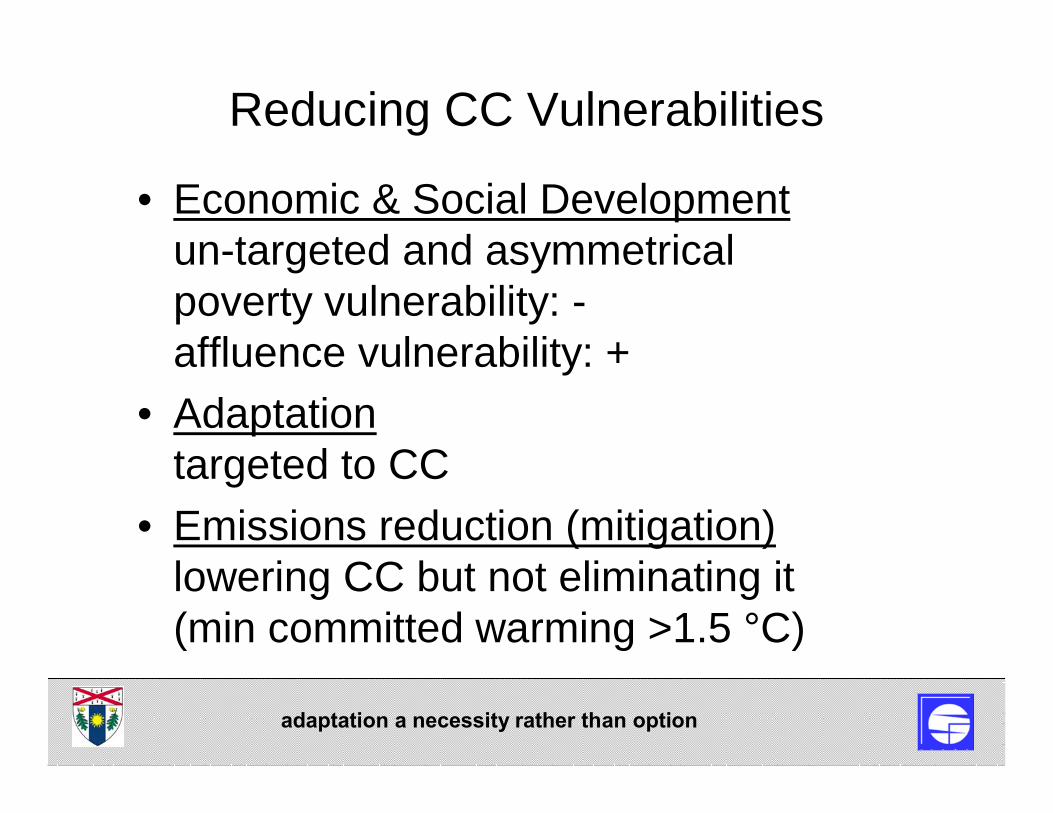
Reducing CC Vulnerabilities
• Economic & Social Developmentun-targeted and asymmetricalpoverty vulnerability: -affluence vulnerability: +
• Adaptation targeted to CC
• Emissions reduction (mitigation)lowering CC but not eliminating it(min committed warming >1.5 °C)
adaptation a necessity rather than option
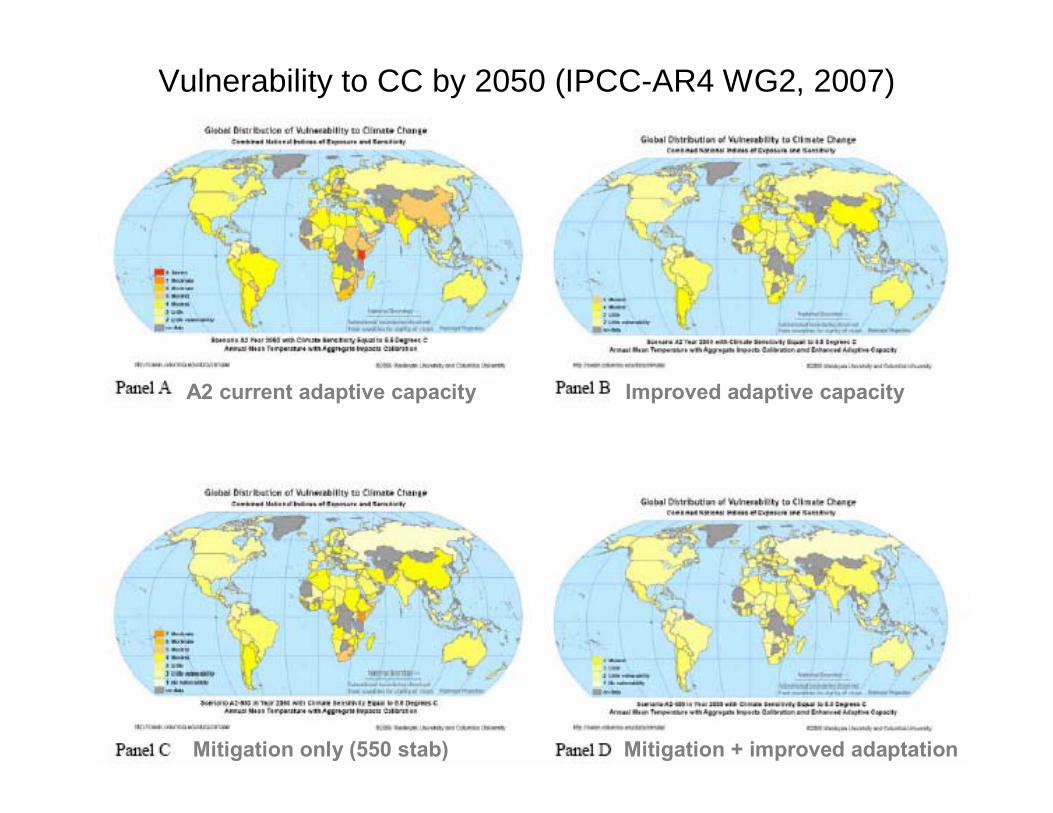
Vulnerability to CC by 2050 (IPCC-AR4 WG2, 2007)
A2 current adaptive capacity Improved adaptive capacity
Mitigation only (550 stab) Mitigation + improved adaptation

Climate Change: The Bottom Line• Vast uncertainties
(targets & mitigation feasibility/costs):-- impacts (warming plus variability)-- technology (which ones when, where, how)
• Magnitude of challenge depends on:-- future development in “South”-- technologies available
(efficiency AND clean supply)• Policy Approach: Rather than: “wait and do
nothing”/ “optimum” path,get prepared, hedge risks, adapt (develop incentives, institutions, and technology mitigation/adaptation response portfolios)

Mitigation Technology Portfolio Analysis
• Paramount importance of Baseline • Costs matter• Diffusion time constants matter• Differences in where technology is developed
and where it is deployed• Technological interdependence and systemic
aspects important in “transition” analysis• Non-energy, non-CO2 can help (lower costs),
but cannot solve problem (reduce energy-CO2)• Multiple drivers, but all channeled
via investments
Σ: Popular “wedge” analysis fails on all above accounts!

Mitigation Scenario AnalysisSource: Riahi et al., TFSC 74(2007)
0
5
10
15
20
25
30
35
40
1990 2000 2010 2020 2030 2040 2050 2060 2070 2080 2090 2100
Annu
al G
HG e
mis
sion
s, G
tC e
q. A2r
A2r - 4.5W/m2
1990
2000
2010
2020
2030
2040
2050
2060
2070
2080
2090
2100
Energy conservation and efficiencyimprovementSwitch to natural gas
Fossil CCS
Nuclear
Biomass (incl. CCS)
Other renewables
Sinks
CH4
N2O
F-gases
CO2
0
5
10
15
20
25
30
35
40
1990 2000 2010 2020 2030 2040 2050 2060 2070 2080 2090 2100
Ann
ual G
HG
em
issi
ons,
GtC
eq.
B2
B2 - 4.5W/m2
Σ: Mitigation “wedges” are baseline and target dependent
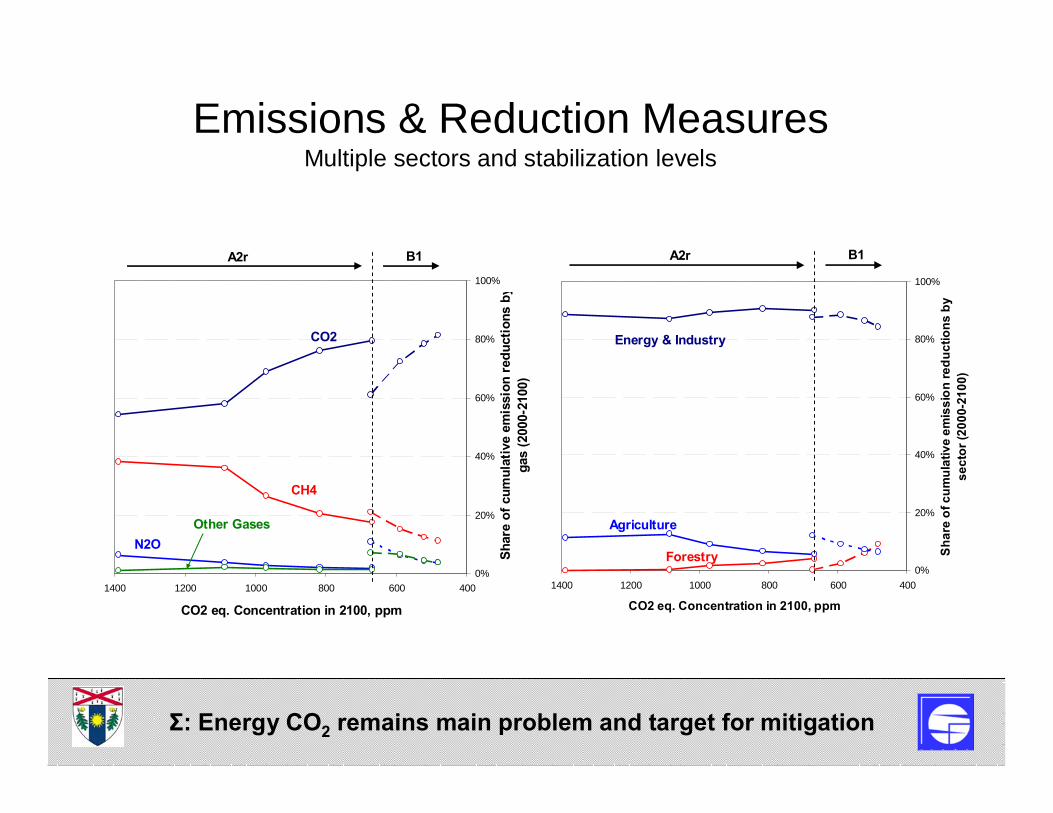
Emissions & Reduction MeasuresMultiple sectors and stabilization levels
0%
20%
40%
60%
80%
100%
400600800100012001400
CO2 eq. Concentration in 2100, ppm
Sha
re o
f cum
ulat
ive
emis
sion
redu
ctio
ns b
y se
ctor
(200
0-21
00)
B1A2r
Energy & Industry
Forestry
Agriculture
0%
20%
40%
60%
80%
100%
400600800100012001400
CO2 eq. Concentration in 2100, ppm
Shar
e of
cum
ulat
ive
emis
sion
red
uctio
ns b
y g
as (2
000-
2100
)
B1A2r
CO2
CH4
N2OOther Gases
Σ: Energy CO2 remains main problem and target for mitigation
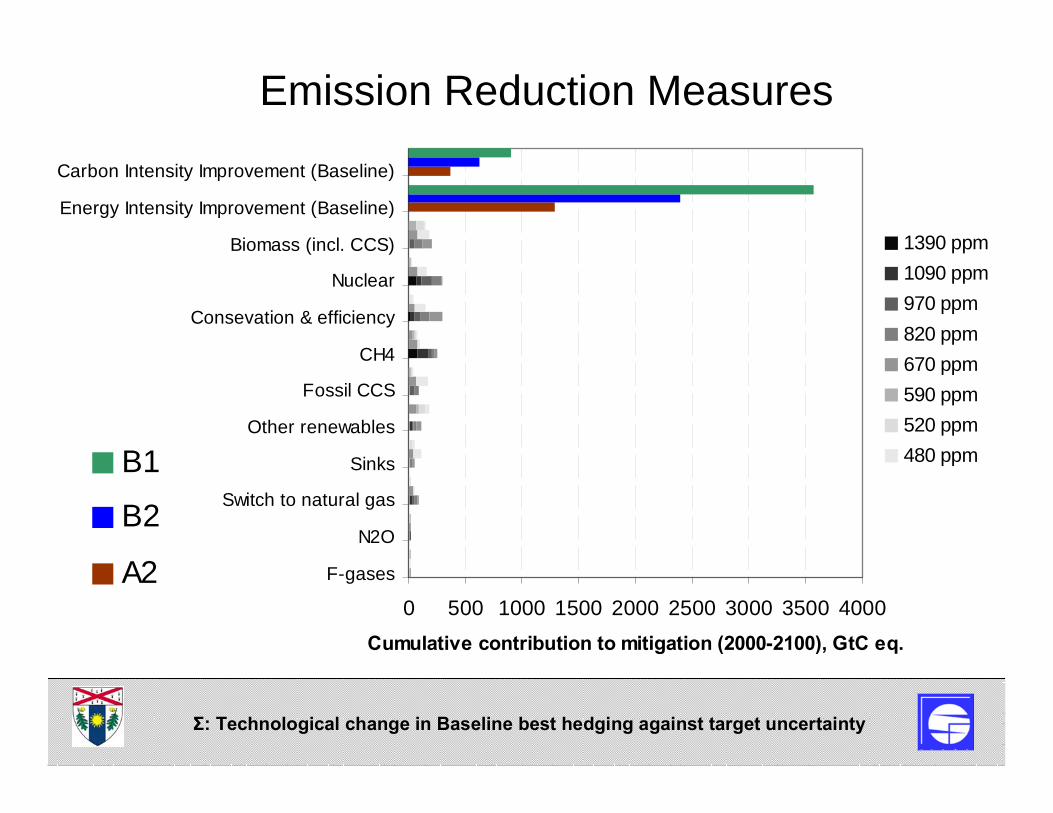
Emission Reduction Measures
Emissions reductions due to climate policies
Improvements incorporated inbaselines
0 500 1000 1500 2000 2500 3000 3500 4000F-gases
N2O
Switch to natural gas
Sinks
Other renewables
Fossil CCS
CH4
Consevation & efficiency
Nuclear
Biomass (incl. CCS)
Energy Intensity Improvement (Baseline)
Carbon Intensity Improvement (Baseline)
Cumulative contribution to mitigation (2000-2100), GtC eq.
1390 ppm1090 ppm970 ppm820 ppm670 ppm590 ppm520 ppm480 ppmB1
B2
A2
Σ: Technological change in Baseline best hedging against target uncertainty

Emission Reduction Measures
0 50 100 150 200 250 300 350
F-gases
N2O
Switch to natural gas
Sinks
Other renewables
Fossil CCS
CH4
Consevation & efficiency
Nuclear
Biomass (incl. CCS)
Cumulative contribution to mitigation (2000-2100), GtC eq.
1390 ppm1090 ppm970 ppm820 ppm670 ppm590 ppm520 ppm480 ppm
A2B1 B2
RF = 0.7
RF = 0.3
RF = 0.2
RF = 0.1
RF = 0.5
RF = 0.1
RF = 0.3
RF = 0.7
RF = 1.0 RF = 0.2
(0.9 incl. baseline)
RF = Robustness factor of options across scenario uncertainty is highest for:F-gases and N2O reduction, energy conservation & efficiency, and biomass+CCS “wildcard” (if feasible)
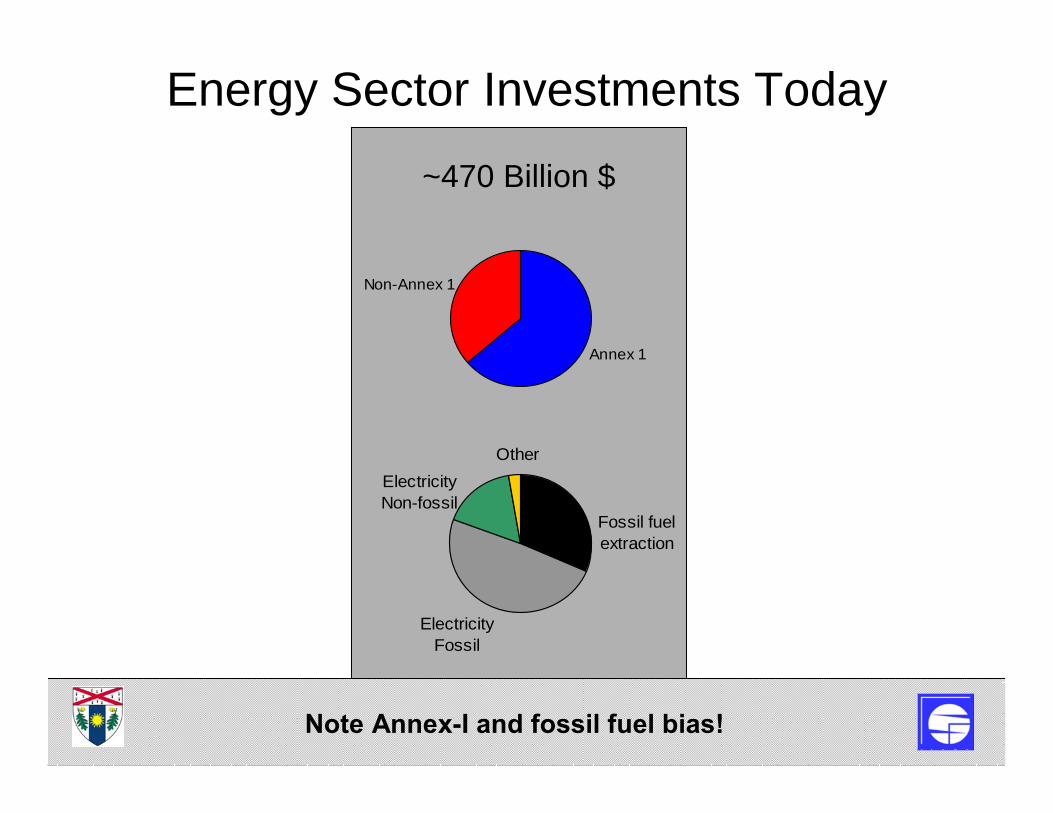
Energy Sector Investments Today
Electricity Fossil
OtherElectricity Non-fossil
Fossil fuel extraction
Annex 1
Non-Annex 1
~470 Billion $
Note Annex-I and fossil fuel bias!
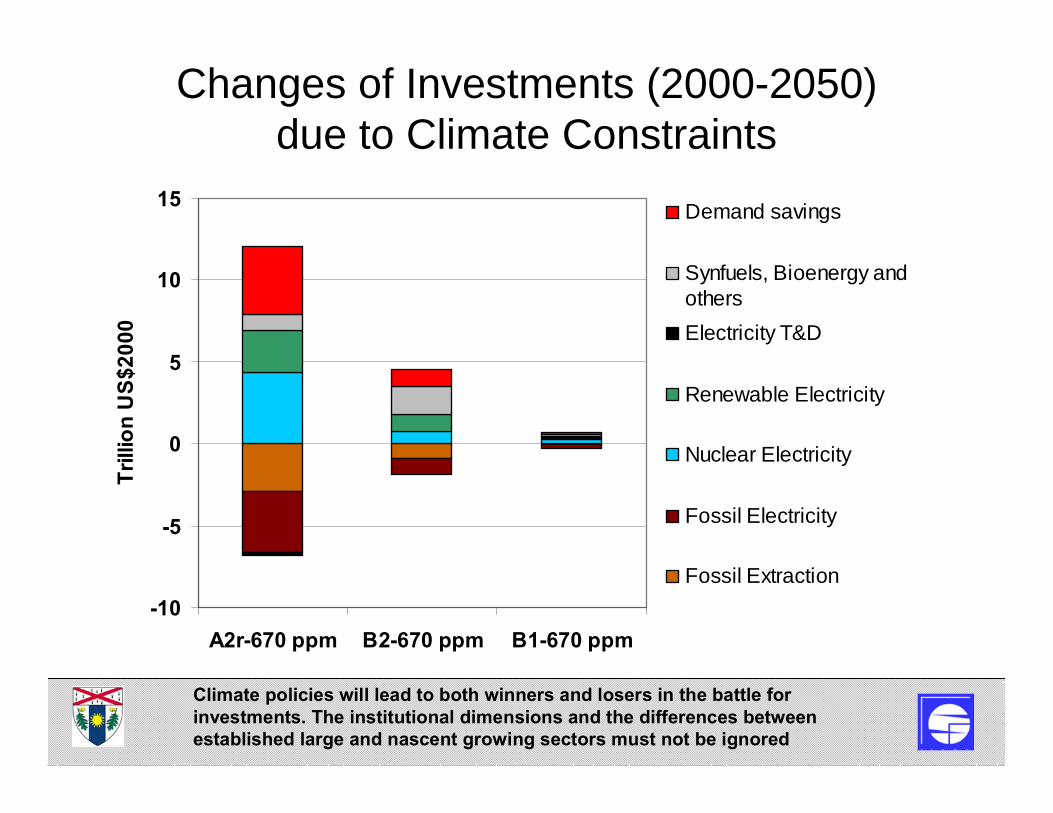
-10
-5
0
5
10
15
A2r-670 ppm B2-670 ppm B1-670 ppm
Trill
ion
US$
2000
Demand savings
Synfuels, Bioenergy andothersElectricity T&D
Renewable Electricity
Nuclear Electricity
Fossil Electricity
Fossil Extraction
Changes of Investments (2000-2050)due to Climate Constraints
Climate policies will lead to both winners and losers in the battle for investments. The institutional dimensions and the differences between established large and nascent growing sectors must not be ignored
Energy Systems Implications
• Highest vulnerability in energy sector(prime climate policy target under increasing demand, incl. from CC)
• Long-term target: Zero emissions• Large point sources (power plants): Early
targets and risk of stranded investments (prepare for CCS or nuclear or “die”)
• Transformation constraint: End-use (lifestyles) and infrastructures (esp. in transportation)
“Conventional wisdom” scenarios are poor strategic guidefor transition planning

A2r - 2000
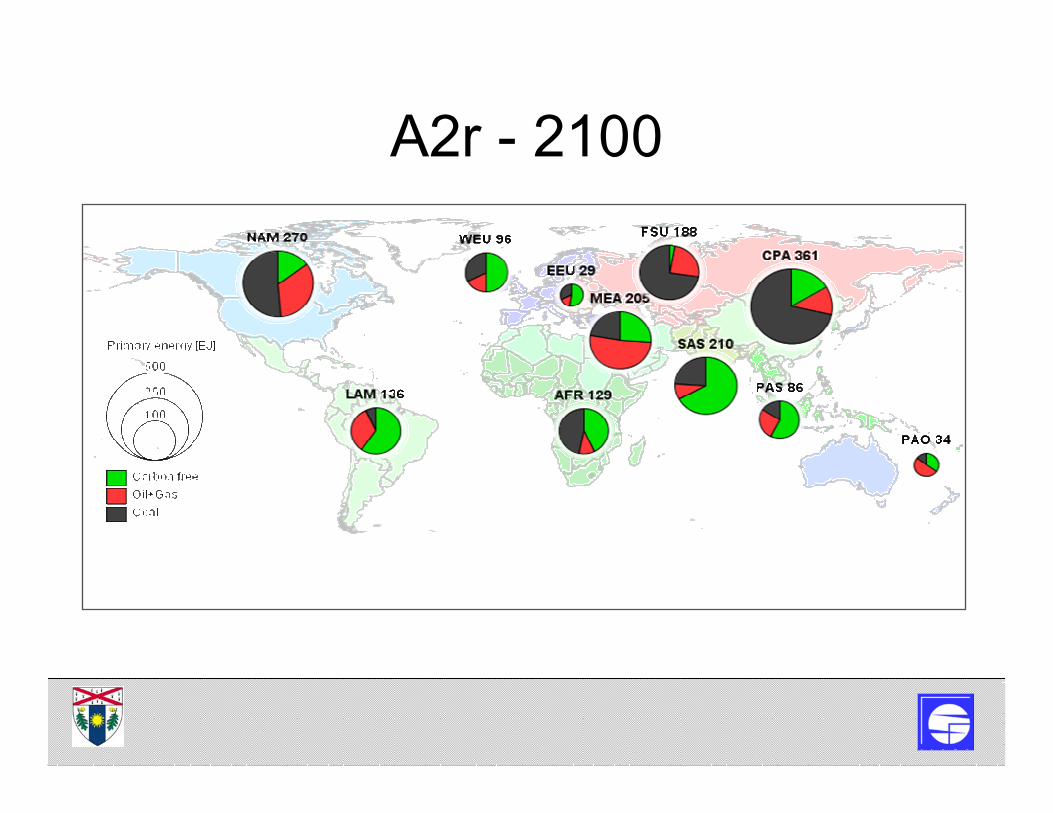
A2r - 2100

A2r - 2100 – 670 ppm stabilization

North -- South
• Responsibility: Mostly in Annex-I• Vulnerability: Mostly in “South”
• Adaptation capacity: Mostly in Annex-I• Future emission growth: Mostly in “South”
• Near-term mitigation potential: highest in Annex-I
• Near-term mitigation costs: lowest in “South”
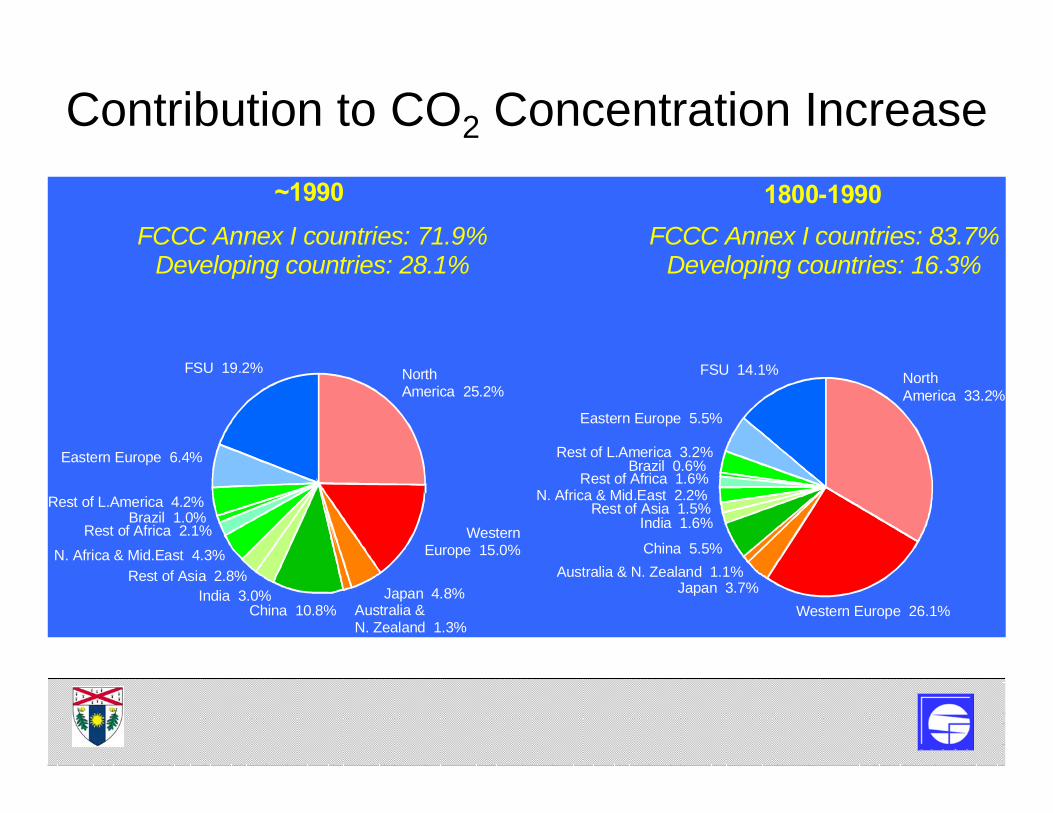
Contribution to CO2 Concentration Increase~1990 1800-1990
Eastern Europe 5.5%
FSU 14.1%
Rest of L.America 3.2%Brazil 0.6%
Rest of Africa 1.6%N. Africa & Mid.East 2.2%
Rest of Asia 1.5%India 1.6%
China 5.5%Australia & N. Zealand 1.1%
Japan 3.7%Western Europe 26.1%
North America 33.2%
North America 25.2%
Western Europe 15.0%
Japan 4.8%Australia & N. Zealand 1.3%
China 10.8%India 3.0%
Rest of Asia 2.8%N. Africa & Mid.East 4.3%
Rest of Africa 2.1%Brazil 1.0%
Rest of L.America 4.2%
Eastern Europe 6.4%
FSU 19.2%
FCCC Annex I countries: 71.9%Developing countries: 28.1%
FCCC Annex I countries: 83.7%Developing countries: 16.3%

UNFCC Annex-I Emissions (all GHGs CO2-equiv)
-4000
-2000
0
2000
4000
6000
8000
10000
12000
2000 2020 2040 2060 2080 2100
Mill
ion
tons
C (C
O2-
equi
v)
Climate stabilization: 700 ppm by 2100 (2.5°C)500 ppm by 2100 (<2°C)
Baselines (no mitigation)

Developing Countries (all GHGs CO2-equiv)
-4000
-2000
0
2000
4000
6000
8000
10000
12000
2000 2020 2040 2060 2080 2100
Mill
ion
tons
C (C
O2-
equi
v)
Emissions peak:2030 (+ <30%) for 500 ppm2050 (+ <80%) for 700 ppm
0-emissions by2080 for 500 ppm2100 for 700 ppm
Climate stabilization: 700 ppm by 2100 (2.5°C)500 ppm by 2100 (<2°C)
Baselines (no mitigation)
Strategies for Addressing Climate Change• Given pervasive uncertainty, adopt portfolio
approach (mitigation+adaptation)• Largest “silver bullet”: Demand management• Biggest challenge: Not in engineering but in
political economy (consistency of long-term incentives/signals)
• Largest “shifts” required: less technological, but in OECD innovation environment(reverse declining R&D, investments, short-term market myopia) and integration of developing countries
Σ: Modeling can help in identifying optimal technology hedging portfoliosbut cannot help in solving the incentive/innovation environment problem