Embed Size (px)
Citation preview
Climate change in relation to rainfall and temperature in Erbil province, Kurdistan, Iraq
Rawa H. Hama ,Rabar T. Hamad&Farhad H. Aziz
University of Salahaddin – Science College – Environmental sciences Dep.
Abstract: Iraq and Iraqi Kurdistan region are located in the south west Asia، responded to environmental change during last few decades caused drought conditions as a result of decreasingrainfall or / and precipitation in the area including Erbil governorate. Therefore an attempt was made to determine the mean of annual rainfall and temperature in Erbil city from 1941 to 2011 and 1974 to 2011 respectively.The aim of this study is to estimation theeffect of environmental change on rainfall and temperature of the area. The results revealed that the maximum amount of rainfall was 872.4 mm/year in 1945 and the minimum was 227.5 mm/year occurred in 1955 . The frequency distribution of rainfall as a histogram for 5 years intervals indicated that high rainfall of 569.98 was occurred in years 1941-1945.However when the amount of rainfall distributed between years, it is found that 36.61% was between 357–486 mm/year followed by 26.76% between 229–356 mm/year. The mean, median, mode, range and skeweness was 411.4, 353.5, 438.9, 644.9 and 0.315 . As far as temperature concerned the similar
ranked order was observed for the maximum temperature of 20.62 that occurred in year 2010 and
the minimum temperature was 16.15 occurred in year 1992. The correlation between temperature and rainfall revealed a weak relationship ( R = - 0.11), indicating inverse relationship, that mean rainfall was depended on temperature.
Keyword:Iraq, Kurdistan region, Environment,climate change,rainfall, Temperature
Introduction Climate change refers to any significant change in measures of climate (e.g., temperature, precipitation and wind) lasting for an extended period (decades or longer). Global warming refers to an average increase in the Earth’s temperature, which, in turn, causes changes in climate. The term climate change often is used interchangeably withthe term global warming, but according to the National Academy of Sciences the term climate change is preferred because it helps convey that there are other changes in addition to rising temperatures. (www.scdhec.gov/recycle). Climate models predict that the global temperature will rise by about 0.8°C±2 by the year 2100.This change would be much larger than any climatechange experienced over at least the last 10,000
years.(Mann ET Al.1999). Rapid changes in global temperatureupto date increased by 0.5 (www.pcc.ch/climate_change/en/g34/html.), (UNEP Climate Change Presentation - June 2009). The projection is based on a wide range of assumptions about the main forces driving future emissions such as population growth and technological change but does not reflect any efforts to control emissions due to concerns about climate change. There are many uncertainties about the scale and impacts of climate change, particularly at the regional level, because of the delaying effect of the oceans, surface temperatures do not respond immediately to greenhouse gas emissions, so climate change will continue for hundreds of years after atmospheric concentrations have stabilized.(UNEP and UNFCCC).
In relation to the factors effecting on environment, the main greenhouse gases are carbon dioxide, water vapor, ozone, methane, nitrous oxide, and halocarbons and other industrial gases.Apart fromthe industrial gases, all of these gases occur naturally. Together, they make less than 1% of the atmosphere. This is enough to produce a .natural greenhouseeffect. That keeps the planet some 30°C warmer than it
would otherwise be (UNEP, 2010).The main causes of greenhouse is some gasses that directly emitted by human include CO2, CH4, nitrous oxide (N2O),Ozon (O3) and several others. The
sources and recent trends of these gasses are detailed below(Alcock and Hegarty( 2006) and (Desonie, 2007).
Deforestation:Deforestation of rainforests; every year help to absorb almost 20% of man made
CO2 emission therefore deforestation can be classed as a major contributor to the causes of climate change. Cutting down rainforests faster than they can be replaced has a devastating effect on the carbon emission cycle producing an extra 17% of greenhouse gases. Remember trees absorb CO2.More deforestation means more CO2 build up in the atmosphere. Deforestation by means of cutting down and burning these tropical rainforests usually pave the way for agriculture and industry which often produce
even more CO2. ( www.climate change challenge.org). Irregularly of precipitation in the world caused by O3 depletion which is Affecting on aA drought conditions when a region stays abnormally dry for a long enough period to cause an imbalance in the water cycle. There are some ways this can happen. Less rain could fall on the region. Either because of hotter air temperatures or wind shifts. Or there could be less water to begin with — say,
because there was less snowfall in the previous winter( Anon, 2009and DEH, 2006)
Increasing sea level. The average sea level is predicted to rise by 9 to 88 cm by 2100.This would be
caused mainly by the thermal expansion of the upper layers of the ocean as they warm, with some contribution from melting glaciers.. Slightly faster melting of the Greenland and Antarctica ice sheets is likely to be counteracted by increased snowfall in both regions. As the warming penetrates deeper into the oceans and ice continues to melt, the sea level will continue rising long after surface temperatures have leveled off. (Duxburyand Duxbury.1997).
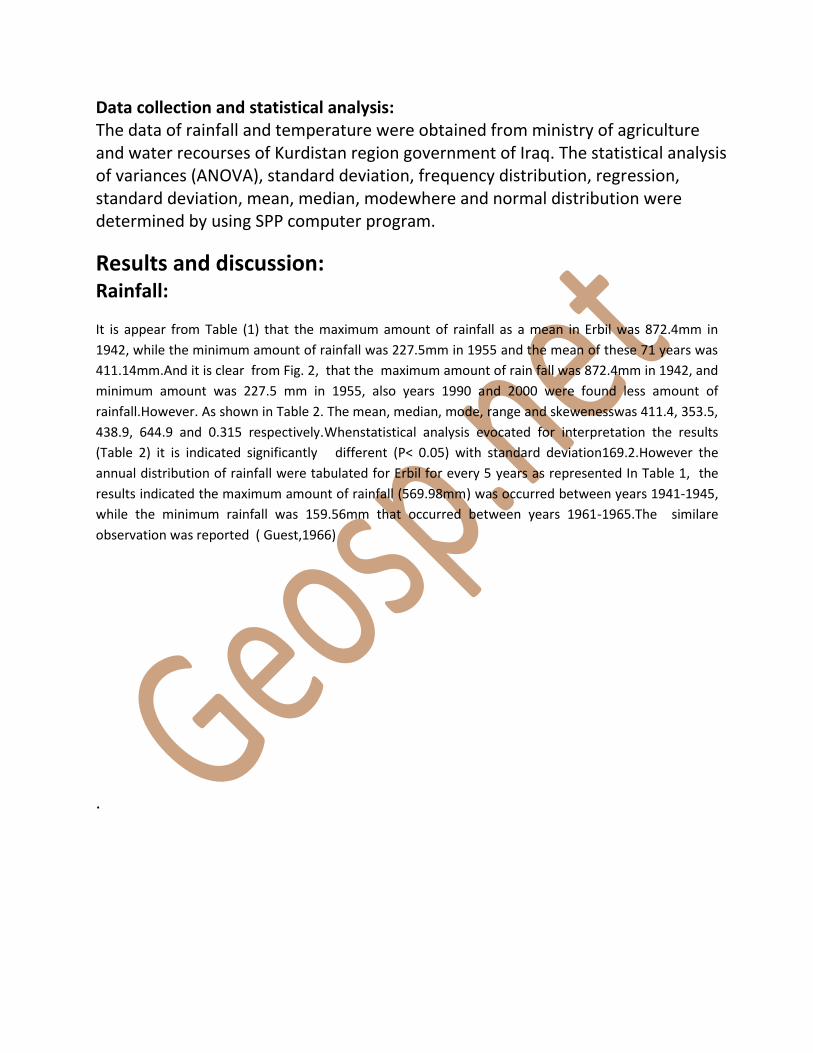
Methods:
Figure (1): Location of Erbil province on earth map.
Data collection and statistical analysis: The data of rainfall and temperature were obtained from ministry of agriculture and water recourses of Kurdistan region government of Iraq. The statistical analysis of variances (ANOVA), standard deviation, frequency distribution, regression, standard deviation, mean, median, modewhere and normal distribution were determined by using SPP computer program.
Results and discussion:
Rainfall:
It is appear from Table (1) that the maximum amount of rainfall as a mean in Erbil was 872.4mm in
1942, while the minimum amount of rainfall was 227.5mm in 1955 and the mean of these 71 years was
411.14mm.And it is clear from Fig. 2, that the maximum amount of rain fall was 872.4mm in 1942, and
minimum amount was 227.5 mm in 1955, also years 1990 and 2000 were found less amount of
rainfall.However. As shown in Table 2. The mean, median, mode, range and skewenesswas 411.4, 353.5,
438.9, 644.9 and 0.315 respectively.Whenstatistical analysis evocated for interpretation the results
(Table 2) it is indicated significantly different (P< 0.05) with standard deviation169.2.However the
annual distribution of rainfall were tabulated for Erbil for every 5 years as represented In Table 1, the
results indicated the maximum amount of rainfall (569.98mm) was occurred between years 1941-1945,
while the minimum rainfall was 159.56mm that occurred between years 1961-1965.The similare
observation was reported ( Guest,1966)
.

Table (1): The mean of rainfall (mm/year) in Erbil from 1941 to 2011.
Year Rainfall(mm) Year Rainfall(mm) Year Rainfall(mm)
1941 783.2 1964 250.7 1987 235.9
1942 872.4 1965 353.5 1988 626.9
1943 560.4 1966 383.4 1989 367.301
1944 336.6 1967 473 1990 332
1945 297.3 1968 536.4 1991 344.1
1946 609.9 1969 613.1 1992 730.2
1947 470 1970 255.4 1993 601.6
1948 332.9 1971 448.2 1994 583.4
1949 558.6 1972 406.4 1995 494.4
1950 522 1973 261.5 1996 411.09
1951 398.4 1974 546.5 1997 438.9
1952 403.7 1975 417.2 1998 333.9
1953 337.7 1976 452.34 1999 229.2
1954 502.6 1977 347.2 2000 272.3
1955 227.5 1978 380.1 2001 330.9
1956 285.1 1979 375.6 2002 542.1
1957 492.8 1980 321.5 2003 496.1
1958 296.3 1981 360 2004 472.5
1959 269.8 1982 438.9 2005 293.3
1960 310 1983 419 2006 509.2
1961 269 1984 359.5 2007 272.1
1962 240 1985 463.9 2008 297.1
1963 500 1986 349 2009 311.6
2010 287.4
2011 289.1
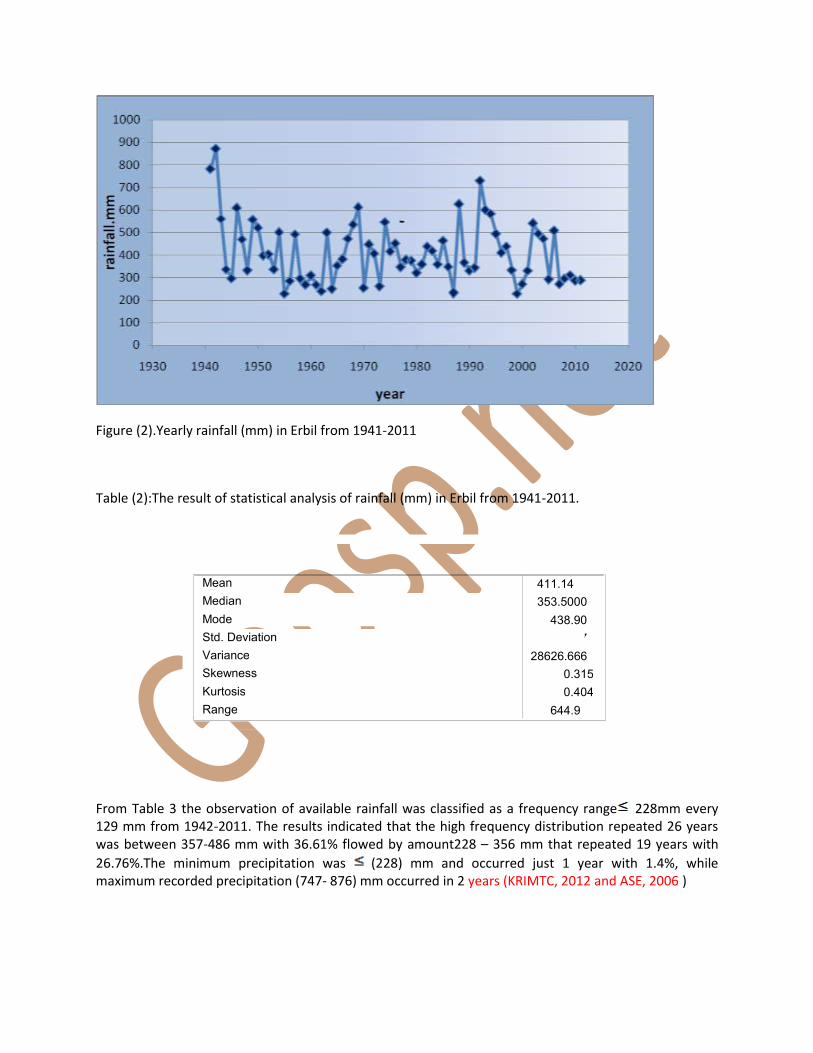
Figure (2).Yearly rainfall (mm) in Erbil from 1941-2011
Table (2):The result of statistical analysis of rainfall (mm) in Erbil from 1941-2011.
From Table 3 the observation of available rainfall was classified as a frequency range 228mm every 129 mm from 1942-2011. The results indicated that the high frequency distribution repeated 26 years was between 357-486 mm with 36.61% flowed by amount228 – 356 mm that repeated 19 years with
26.76%.The minimum precipitation was (228) mm and occurred just 1 year with 1.4%, while maximum recorded precipitation (747- 876) mm occurred in 2 years (KRIMTC, 2012 and ASE, 2006 )
411.14 353.5000
438.90 169.19417 28626.666
0.315 0.404
644.9
Mean Median
Mode Std. Deviation Variance Skewness
Kurtosis Range
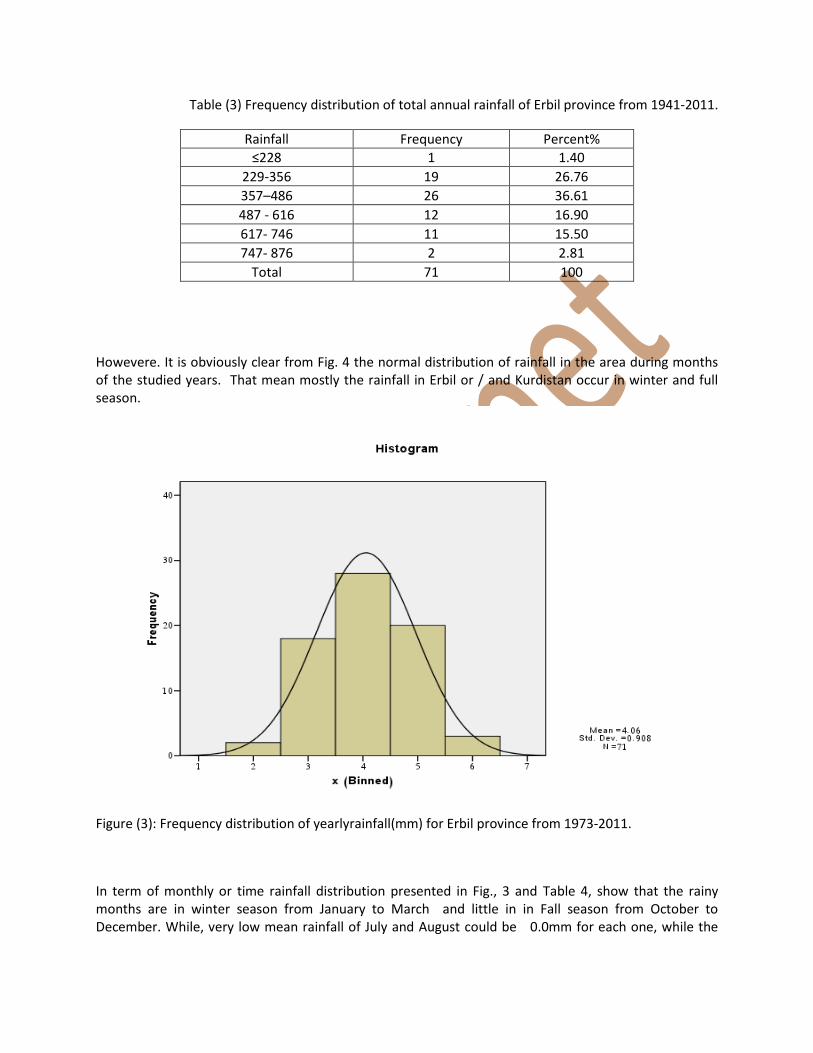
Table (3) Frequency distribution of total annual rainfall of Erbil province from 1941-2011.
Rainfall Frequency Percent%
≤228 1 1.40
229-356 19 26.76
357–486 26 36.61
487 - 616 12 16.90
617- 746 11 15.50
747- 876 2 2.81
Total 71 100
Howevere. It is obviously clear from Fig. 4 the normal distribution of rainfall in the area during months of the studied years. That mean mostly the rainfall in Erbil or / and Kurdistan occur in winter and full season.
Figure (3): Frequency distribution of yearlyrainfall(mm) for Erbil province from 1973-2011.
In term of monthly or time rainfall distribution presented in Fig., 3 and Table 4, show that the rainy months are in winter season from January to March and little in in Fall season from October to December. While, very low mean rainfall of July and August could be 0.0mm for each one, while the
maximum rainfall in winter occur in January and February with mean of 81.97mm and 76.75mm respectively Guest, 1966 )
Table (4): Mean monthly rainfall during year from 1941-2011 for Erbil province.
Month JAN FEB MAR APR MAY JUN JUL AUG SEP OCT NOV DEC
Rainfall 81.98 76.75 75.51 54.54 20.34 0.492 0.0 0.0 0.649 13.29 38.13 71.33
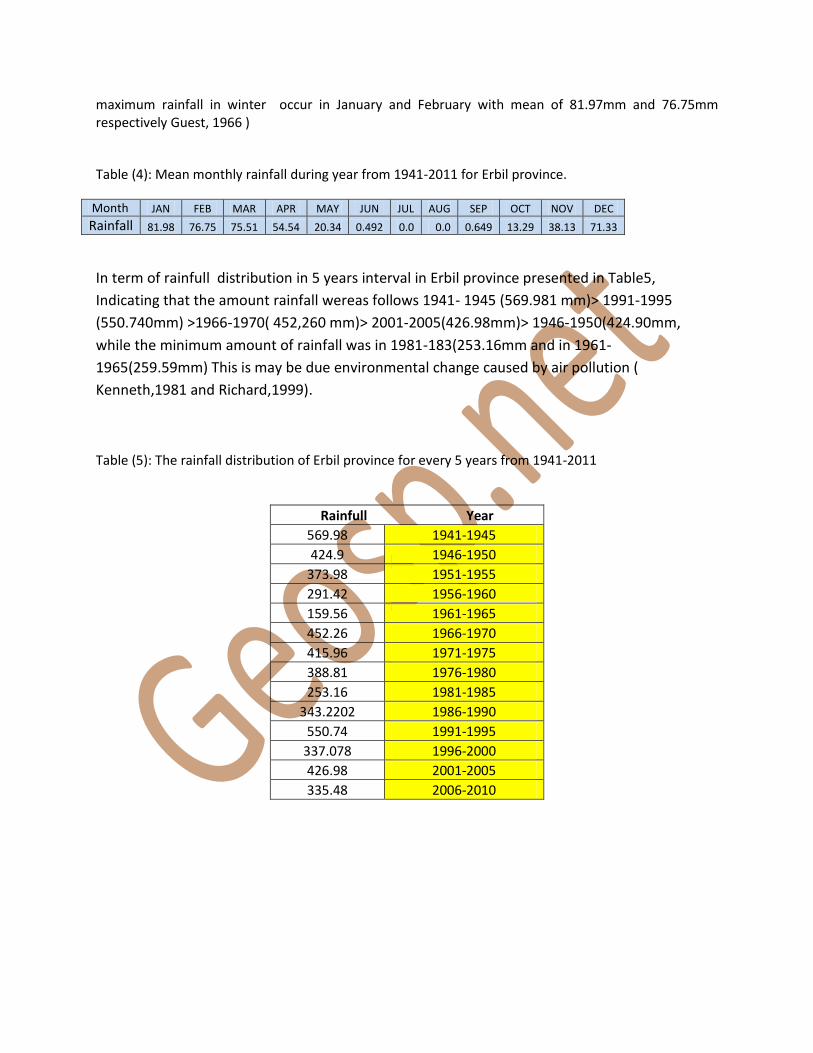
In term of rainfull distribution in 5 years interval in Erbil province presented in Table5,
Indicating that the amount rainfall wereas follows 1941- 1945 (569.981 mm)> 1991-1995
(550.740mm) >1966-1970( 452,260 mm)> 2001-2005(426.98mm)> 1946-1950(424.90mm,
while the minimum amount of rainfall was in 1981-183(253.16mm and in 1961-
1965(259.59mm) This is may be due environmental change caused by air pollution (
Kenneth,1981 and Richard,1999).
Table (5): The rainfall distribution of Erbil province for every 5 years from 1941-2011
Rainfull Year
569.98 1941-1945
424.9 1946-1950
373.98 1951-1955
291.42 1956-1960
159.56 1961-1965
452.26 1966-1970
415.96 1971-1975
388.81 1976-1980
253.16 1981-1985
343.2202 1986-1990
550.74 1991-1995
337.078 1996-2000
426.98 2001-2005
335.48 2006-2010
.Temperature:
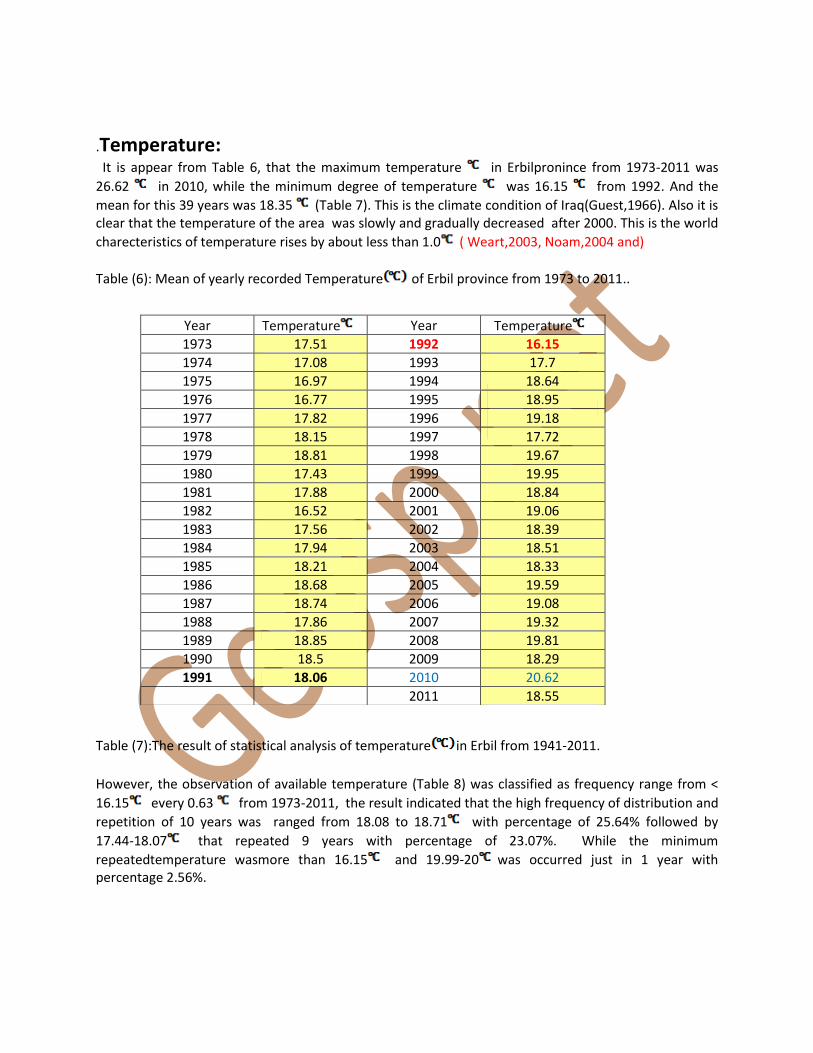
It is appear from Table 6, that the maximum temperature in Erbilpronince from 1973-2011 was
26.62 in 2010, while the minimum degree of temperature was 16.15 from 1992. And the
mean for this 39 years was 18.35 (Table 7). This is the climate condition of Iraq(Guest,1966). Also it is clear that the temperature of the area was slowly and gradually decreased after 2000. This is the world
charecteristics of temperature rises by about less than 1.0 ( Weart,2003, Noam,2004 and)
Table (6): Mean of yearly recorded Temperature of Erbil province from 1973 to 2011..
Table (7):The result of statistical analysis of temperature in Erbil from 1941-2011.
However, the observation of available temperature (Table 8) was classified as frequency range from <
16.15 every 0.63 from 1973-2011, the result indicated that the high frequency of distribution and
repetition of 10 years was ranged from 18.08 to 18.71 with percentage of 25.64% followed by
17.44-18.07 that repeated 9 years with percentage of 23.07%. While the minimum
repeatedtemperature wasmore than 16.15 and 19.99-20 was occurred just in 1 year with percentage 2.56%.
Temperature Year Temperature Year
16.15 1992 17.51 1973
17.7 1993 17.08 1974
18.64 1994 16.97 1975
18.95 1995 16.77 1976
19.18 1996 17.82 1977
17.72 1997 18.15 1978
19.67 1998 18.81 1979
19.95 1999 17.43 1980
18.84 2000 17.88 1981
19.06 2001 16.52 1982
18.39 2002 17.56 1983
18.51 2003 17.94 1984
18.33 2004 18.21 1985
19.59 2005 18.68 1986
19.08 2006 18.74 1987
19.32 2007 17.86 1988
19.81 2008 18.85 1989
18.29 2009 18.5 1990
20.62 2010 18.06 1991
18.55 2011
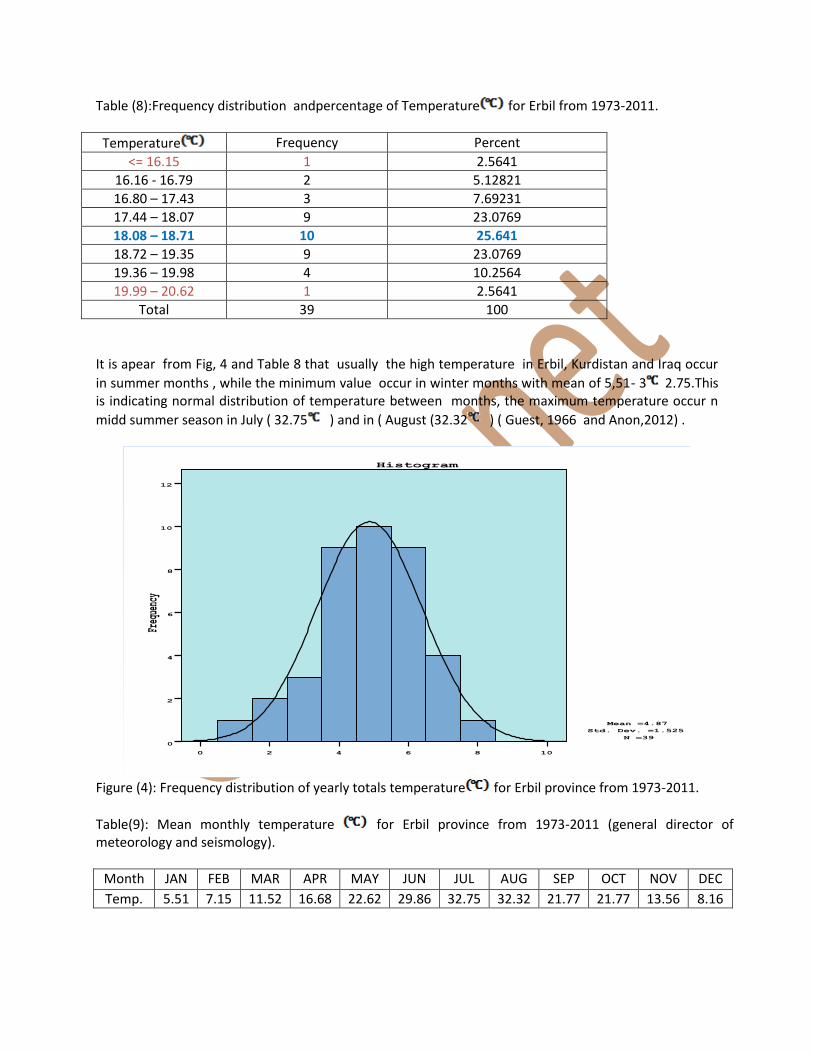
Table (8):Frequency distribution andpercentage of Temperature for Erbil from 1973-2011.
Temperature Frequency Percent
<= 16.15 1 2.5641
16.16 - 16.79 2 5.12821
16.80 – 17.43 3 7.69231
17.44 – 18.07 9 23.0769
18.08 – 18.71 10 25.641
18.72 – 19.35 9 23.0769
19.36 – 19.98 4 10.2564
19.99 – 20.62 1 2.5641
Total 39 100
It is apear from Fig, 4 and Table 8 that usually the high temperature in Erbil, Kurdistan and Iraq occur
in summer months , while the minimum value occur in winter months with mean of 5,51- 3 2.75.This is indicating normal distribution of temperature between months, the maximum temperature occur n
midd summer season in July ( 32.75 ) and in ( August (32.32 ) ( Guest, 1966 and Anon,2012) .
1086420
Freq
uenc
y
12
10
8
6
4
2
0
Histogram
Mean =4.87
Std. Dev. =1.525
N =39
Figure (4): Frequency distribution of yearly totals temperature for Erbil province from 1973-2011.
Table(9): Mean monthly temperature for Erbil province from 1973-2011 (general director of meteorology and seismology).
DEC NOV OCT SEP AUG JUL JUN MAY APR MAR FEB JAN Month
8.16 13.56 21.77 21.77 32.32 32.75 29.86 22.62 16.68 11.52 7.15 5.51 Temp.
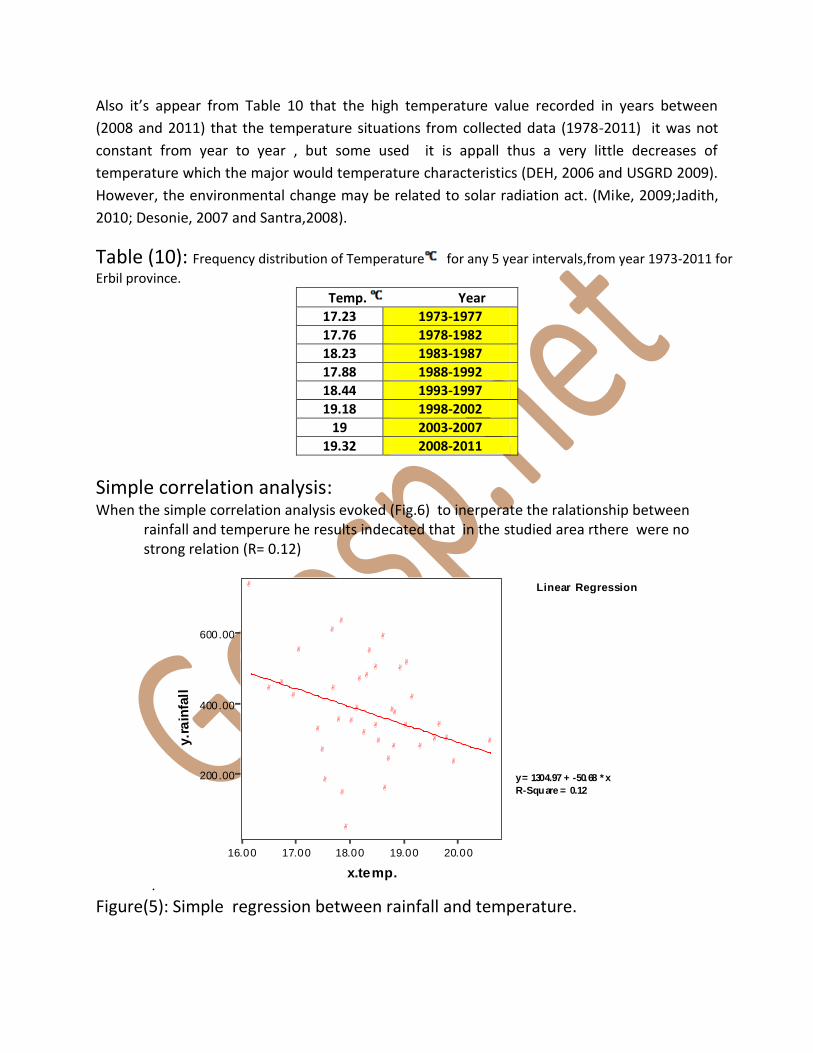
Also it’s appear from Table 10 that the high temperature value recorded in years between
(2008 and 2011) that the temperature situations from collected data (1978-2011) it was not
constant from year to year , but some used it is appall thus a very little decreases of
temperature which the major would temperature characteristics (DEH, 2006 and USGRD 2009).
However, the environmental change may be related to solar radiation act. (Mike, 2009;Jadith,
2010; Desonie, 2007 and Santra,2008).
Table (10): Frequency distribution of Temperature for any 5 year intervals,from year 1973-2011 for
Erbil province.
Temp. Year
17.23 1973-1977
17.76 1978-1982
18.23 1983-1987
17.88 1988-1992
18.44 1993-1997
19.18 1998-2002
19 2003-2007
19.32 2008-2011
Simple correlation analysis: When the simple correlation analysis evoked (Fig.6) to inerperate the ralationship between
rainfall and temperure he results indecated that in the studied area rthere were no strong relation (R= 0.12)
.
Linear Regression
16.00 17.00 18.00 19.00 20.00
x.temp.
200.00
400.00
600.00
y.r
ain
fall
y = 1304.97 + -50.68 * x
R-Square = 0.12
Figure(5): Simple regression between rainfall and temperature.
References:
A.S.E ‘Australia State of the environment (2006).Independent report to the Australian Government Minister for the Environment and Heritage, Department of Environment and Heritage.
Alcock, D.; Hegarty, R.S.( 2006), Effects of pasture improvement on productivity, gross margin and methane emissions of a grazing sheep enterprise’, International Congress Series, Vol. 1293, pp. 103–106 Anon (2012).The Kurdistan region of Iraq, Ministry of Transport and Communications, General
Meteorological Director. Erbil.
Desonie,D.(2007).Climate change, Chelsea House, New York.
Duxbury,C. A. and Duxbury,A. C. (1997) World Ocean,WCB.,McGraw_,New York,PpSO4.
General Director 0f Meteorology, Iraqi Kurdistan Region, meteorology and climate department (2012). Data for Rainfall.
Guest,E.. and Al-Rawi(1966). Flora of Iraq,Ministry of Agriculture, Iraq.
Judith,L.(2010) “Cycles and trends in solar irradiance and climate,” Wiley Interdisciplinary Reviews: Climate Change, vol. 1, , 111-122.
Kenneth, W. W. (1981) Air pollution.2dd.Harper and Row,publisher,New York.
Mike,L.(2009) “Solar Change and Climate: an update in the light of the current exceptional solar minimum,” Proceedings of the Royal Society A doi 10.1098/rspa.2009.0519;
Naome, O.(2004) “The Scientific Consensus on Climate Change :Vol .306 no.(5702)p. 1686 DOL:10.1126/science.1103618.
Richard,R.,(1999) Global Problems and the Culture of Capitalism,pp.233-236. Santra, S.C.(2008). Environmental Science.NewCentral Book Agency (P ) Ltd. India
U. S. G. C. R. P. United State Global Change Research Program(1991) “Global Climate Change Impact in the United States, “Cambridge University Press.
U.S.G.R.P., United State Global Change Research Program(2009).“Global Climate Change Impact in the United States, “Cambridge University Press.
UNEP,United Nation Environment Programme(2009).Climate Change,from website: www.unep.org/ Climate Change /Introduction
Weart,S.R.2003.The Discovery of Global Warmng.Havard University Press,Cambrdge,Mass.