Embed Size (px)
Citation preview
Balt ic Sea Environment Proceedings No. 111
Climate Change in the Baltic Sea AreaHELCOM Thematic Assessment in 2007
Helsinki CommissionBaltic Marine Environment Protection Commission

Baltic Sea Environment Proceedings No. 111
Helsinki CommissionBaltic Marine Environment Protection Commission
Climate Change in the Baltic Sea Area HELCOM Thematic Assessment in 2007
Information included in this publication or extracts thereof are free for citation on the condition that the complete reference of the publication is given:HELCOM, 2007Climate Change in the Baltic Sea Area – HELCOM Thematic Assessment in 2007Balt. Sea Environ. Proc. No. 111
Copyright 2007 by the Baltic Marine Environment Protection Commission – Helsinki Commission –
Design and layout: Leena Närhi, Bitdesign, Vantaa, FinlandCover photo: Seppo Keränen, Finland. Baltic ringed seal pup in collapsed nest.
ISSN 0357-2994
Prepared by Janet F. Pawlak, MEC – Marine Environmental ConsultantsIn collaboration with Juha-Markku Leppänen, HELCOM Secretariat
Based on the BALTEX Assessment of Climate Change for the Baltic Sea Basin (BACC)
BACC Lead Authors:Joachim Dippner Baltic Sea Research Institute, Warnemünde, GermanyL. Phil Graham Swedish Meteorological and Hydrological Institute, Norrköping, SwedenBo Gustafsson Göteborg University, SwedenRaino Heino Finnish Meteorological Institute, Helsinki, FinlandAnders Omstedt Göteborg University, Earth Sciences Center-Oceanography, SwedenBenjamin Smith Lund University, SwedenHeikki Tuomenvirta Finnish Meteorological Institute, Helsinki, FinlandHans von Storch GKSS Research Centre Geesthacht, GermanyValery Vuglinsky Russian State Hydrological Institute, St. Petersburg, RussiaIlppo Vuorinen University of Turku, Finland
Additional contributors to the HELCOM Thematic Assessment:Sten Bergström SMHI, SwedenHans-Jörg Isemer BALTEX Secretariat, GKSS Research Centre Geesthacht, GermanyErik Kjellström SMHI, SwedenMarkus Meier SMHI, SwedenJouni Räisänan University of Helsinki, FinlandMarcus Reckermann BALTEX Secretariat, GKSS Research Centre Geesthacht, GermanyMarkku Rummukainen SMHI, SwedenJoanna Wibig University of Łodz, Poland
3
Clim
ate
Cha
nge
in th
e B
altic
Sea
Are
a –
HE
LCO
M T
hem
atic
Ass
essm
ent i
n 20
07
Contents
Preface . . . . . . . . . . . . . . . . . . . . . . . . . . . . . . . . . . . . . . . . . . . . . . . . . . . . . . . . . . . . . . . . . . . . . . . . . . .5
Executive Summary . . . . . . . . . . . . . . . . . . . . . . . . . . . . . . . . . . . . . . . . . . . . . . . . . . . . . . . . . . .6
1. Introduction . . . . . . . . . . . . . . . . . . . . . . . . . . . . . . . . . . . . . . . . . . . . . . . . . . . . . . . . . . . . . . . . .9
2. The Baltic Sea Area. . . . . . . . . . . . . . . . . . . . . . . . . . . . . . . . . . . . . . . . . . . . . . . . . . . . . . .10
3. The Baltic Climate: Past Climate and Recent Climate Change. . . .12
3.1 Atmospheric circulation and wind patterns and their changes over the Baltic Sea basin . . . . . . . . . . . . . . . . . . . . . . . . . . . . . . . . . . . .12
3.2 Precipitation and cloudiness and their changes in the Baltic Sea basin . . . . . . . . . . . . . . . . . . . . . . . . . . . . . . . . . . . . . . . . . . . . . . . . . . .14
3.3 Changes in extreme events . . . . . . . . . . . . . . . . . . . . . . . . . . . . . . . . . . . . . . . . . . .16
4. Changes in the Hydrological and Hydrographic Regimes of the Baltic Sea Basin . . . . . . . . . . . . . . . . . . . . . . . . . . . . . . . . . . . . . . . . . . . . . . . . . . . . . .18
4.1 Water and ice regime, and snow cover . . . . . . . . . . . . . . . . . . . . . . . . . . . . . . .18
4.2 Hydrography . . . . . . . . . . . . . . . . . . . . . . . . . . . . . . . . . . . . . . . . . . . . . . . . . . . . . . . . . 20
4.3 Coastal erosion . . . . . . . . . . . . . . . . . . . . . . . . . . . . . . . . . . . . . . . . . . . . . . . . . . . . . . .21
5. Projections of Future Climate Change . . . . . . . . . . . . . . . . . . . . . . . . . . . . . . . 22
5.1 Projected global climate change . . . . . . . . . . . . . . . . . . . . . . . . . . . . . . . . . . . . 22
5.2 Projections of future climate in the Baltic Sea basin . . . . . . . . . . . . . . . . 26
5.2.1 Projections based on global climate models . . . . . . . . . . . . . . . . . 26
5.2.2 Projections based on regional climate models . . . . . . . . . . . . . . . 28
5.3 Projected future changes in the Baltic Sea . . . . . . . . . . . . . . . . . . . . . . . . . . 30
5.4 Summary of future climate change projections for the Baltic Sea Basin . . . . . . . . . . . . . . . . . . . . . . . . . . . . . . . . . . . . . . . . . . . . . . . . . 32
6. Climate-related Change in the Baltic Marine Environment . . . . . . . 34
6.1 Projected changes in the physical and chemical conditions in the Baltic Sea . . . . . . . . . . . . . . . . . . . . . . . . . . . . . . . . . . . . . . . . . . . . . . . . . . . . . . . . 34
6.1.1 Nutrient inputs . . . . . . . . . . . . . . . . . . . . . . . . . . . . . . . . . . . . . . . . . . . . . . . . 34
6.1.2 Chemical contaminants. . . . . . . . . . . . . . . . . . . . . . . . . . . . . . . . . . . . . . . 35
4
6.2 Potential climate-related changes in the Baltic marine ecosystem . 36
6.2.1 Bacteria . . . . . . . . . . . . . . . . . . . . . . . . . . . . . . . . . . . . . . . . . . . . . . . . . . . . . . . 36
6.2.2 Phytoplankton . . . . . . . . . . . . . . . . . . . . . . . . . . . . . . . . . . . . . . . . . . . . . . . . .37
6.2.3 Zooplankton . . . . . . . . . . . . . . . . . . . . . . . . . . . . . . . . . . . . . . . . . . . . . . . . . . 38
6.2.4 Benthos . . . . . . . . . . . . . . . . . . . . . . . . . . . . . . . . . . . . . . . . . . . . . . . . . . . . . . . 39
6.2.5 Fish . . . . . . . . . . . . . . . . . . . . . . . . . . . . . . . . . . . . . . . . . . . . . . . . . . . . . . . . . . . 40
6.2.6 Marine mammals . . . . . . . . . . . . . . . . . . . . . . . . . . . . . . . . . . . . . . . . . . . . . .42
6.2.7 Seabirds . . . . . . . . . . . . . . . . . . . . . . . . . . . . . . . . . . . . . . . . . . . . . . . . . . . . . . 44
7. Concluding Remarks . . . . . . . . . . . . . . . . . . . . . . . . . . . . . . . . . . . . . . . . . . . . . . . . . . . . 46
References . . . . . . . . . . . . . . . . . . . . . . . . . . . . . . . . . . . . . . . . . . . . . . . . . . . . . . . . . . . . . . . . . . . . .47
Acknowledgements . . . . . . . . . . . . . . . . . . . . . . . . . . . . . . . . . . . . . . . . . . . . . . . . . . . . . . . . . . 48
5
Clim
ate
Cha
nge
in th
e B
altic
Sea
Are
a –
HE
LCO
M T
hem
atic
Ass
essm
ent i
n 20
07
This HELCOM Thematic Assessment on Climate Change in the Baltic Sea Area is based on the Assessment of Climate Change for the Baltic Sea Basin Project (The BACC Project). It integrates available knowledge of historical, current, and expected future climate change. The BACC Project is a joint venture of the BALTEX (Baltic Sea Experiment) Program and HELCOM (Baltic Marine Environment Protection Commission) as an example of a dialogue between the scientifi c community and environmental policy makers. The unique feature of BACC is the combination of evidence on climate change and related impacts on marine, freshwater, and terrestrial ecosystems in the Baltic Sea basin, which encompasses the entire water catchment with runoff into the Baltic Sea. It is the fi rst systematic scientifi c effort for assessing climate change in a European region. More than 80 scientists from 12 countries have contributed on a voluntary basis.
Given this clear relationship to the BACC report, this Thematic Assessment Report does not contain many references to specifi c scientifi c
literature, but rather full details, together with ref-erences to the primary scientifi c publications, can be found in the BACC report (The BACC Authors Group, 2007).
BALTEX together with HELCOM and Göteborg University organized the First International Con-ference on the Assessment of Climate Change for the Baltic Sea Basin in Gothenburg, Sweden, on 22–23 May 2006 (see The BACC Lead Authors Group, 2006). The objective of the Conference was to discuss issues of climate change related to the entire water catchment of the Baltic Sea; possible impacts of these changes on marine and terrestrial ecosystems, and on society; and means of improving the dialogue between scientists, politicians, and the public at large with regard to issues related to climate change. The conference was attended by leading scientists, politicians, journalists, and interested stakeholders from the Baltic Sea countries. The management actions presented below are based on the conclusions of the Conference.
Preface
6
The Baltic Sea Area and Global Climate ChangeThe Baltic Sea Area is subject to global infl u-ences, such as those related to the widespread, global emissions of large quantities of greenhouse gases, particularly since the middle of the 20th century. Greenhouse gases have been shown to account for a signifi cant proportion of the global increase in temperature during the past century. “Climate change” is a neutral term, however, as changes in climate may be due to internal dynam-ics, natural external factors, or anthropogenic fac-tors. The causes of observed changes are usually complex and require research and modelling to attempt to understand them.
Climate change in the Baltic Sea basin is related to overall global climate change, and projections of future climate change in the Baltic area build on global and regional climate models and emissions scenarios for greenhouse gases and aerosols. Projections of future climate changes are based on the application of climate models together with emissions scenarios that have been developed based on assumptions of different kinds of future human behaviour in relation to the amounts of greenhouse gases emitted. These models can provide future assessments of temperature, wind, precipitation, and other quantities, but not of the infl uence of such changes, e.g., on the environment. To estimate these infl uences, it is necessary to make use of impact models (e.g., hydrology models, crop models), which generally run on a local scale and take the quantities pro-vided by the climate models as input.
Fluctuating climateThe climate of the Baltic Sea basin is character-ized by large seasonal contrasts, owing to its geographical location, variable topography, and land-sea contrasts. The climate is infl uenced by major air pressure systems, particularly the North Atlantic Oscillation during wintertime, which affect the atmospheric circulation and precipitation in the Baltic Sea basin. In addition to the natural variability in climate, global warming has been observed during the past century, with the larg-est contribution to this global warming arising
from increased greenhouse gas concentrations, particularly carbon dioxide and methane. This is especially the case for the past few decades when the increase in greenhouse gas concentrations has been the most rapid.
Warming trendThe warming trend for the entire globe was about 0.05°C/decade from 1861–2000, while the trend for the Baltic Sea basin has been somewhat larger, 0.08°C/decade. This warming trend has been refl ected in a decrease in the number of very cold days during winter as well as a decrease in the duration of the ice cover and its thickness in many rivers and lakes, particularly in the eastern and southeastern Baltic Sea basin. In addition, the length of the frost-free season has increased and an increasing length of the growing season in the Baltic Sea basin has been observed during this period.
The projections for future climate change in the Baltic Sea basin, with all of their caveats and uncertainties, indicate that atmospheric temperatures will continue to warm during the course of the 21st century in every sub-region of the Baltic Sea basin. Based on available regional modelling studies, a warming of the mean annual temperature in the order of 3ºC to 5ºC is projected for the total basin during this century. These fi gures, however, do not refl ect the full range of uncertainties in global climate model projections. Seasonally, the largest part of this warming would occur to the east and north of the Baltic Sea during winter months and to the south of the Baltic Sea during summer months. A warming of such magnitude would lead to a lengthening of the growing season, by as much as 20 days to 50 days for northern areas and 30 days to 90 days for southern areas by the late 21st century, depending on the different emissions scenarios used.
In the Baltic Sea, there has also been a general tendency toward milder sea-ice conditions during the past century; this is refl ected in time series data on the maximum annual extent of sea ice and the length of the ice season in the Baltic Sea. The largest change has been in the length of
Executive Summary
7
Clim
ate
Cha
nge
in th
e B
altic
Sea
Are
a –
HE
LCO
M T
hem
atic
Ass
essm
ent i
n 20
07
the ice season, which has decreased by 14–44 days over the past century, mainly due to earlier ice break-up. On the basis of the ice extent, the shift towards a warmer climate took place in the latter half of the 19th century. During the past ten years, all ice winters have been average, mild, or extremely mild.
The mean sea surface temperature of the Baltic Sea is projected to increase, resulting in a marked decrease in the extent of ice in the sea. The projected decrease of ice cover by the end of the 21st century is dramatic, with the Bothnian Sea, large areas of the Gulf of Finland and the Gulf of Riga, and the outer parts of the southwestern archipelago of Finland becoming, on average, ice free. The length of the ice season would decrease by 1–2 months in the northern parts of the Baltic Sea and by 2–3 months in the central parts.
General increase in precipitationIn association with this warming there would be changes in precipitation patterns, both geographi-cally and seasonally, leading to a general increase in annual precipitation that is projected to be larg-est in the northern parts of the Baltic Sea basin. Seasonally, more of the increase in precipitation would occur in winter than in summer. Regionally, southern areas of the basin would be drier than northern areas, particularly during summer. These changes in precipitation will affect the runoff into the Baltic Sea, with potential increases in mean annual river fl ow from the northernmost catch-ments occurring together with decreases in the southernmost catchments. Seasonally, summer river fl ows would tend to decrease, while winter fl ows would tend to increase. In some of the regional scenario simulations, the average salinity of the Baltic Sea is projected to decrease.
Ecosystem changes expectedChanges in water temperature, water balance, circulation, and salinity associated with climate change can be expected to have impacts on the biological processes and biota in the Baltic Sea, affecting the species that live in the Baltic Sea, their distribution, and their interactions.
The projected increase in the temperature of the upper water layer of the Baltic Sea could result in a decrease in spring and autumn convective mixing, thus affecting the circulation and distribu-tion of nutrients in the photic zone. A change in runoff could result in a change in the input of
nutrients from the catchment area. The increase in water temperature may also increase bacterial activity, which can affect nutrient recycling and mineralization in surface waters. These changes can have an infl uence on phytoplankton species composition and primary production, which are of great importance for the Baltic ecosystem. For example, warming will inhibit cold-water species (such as some diatoms) but may stimulate warm-water species, such as the bloom-forming toxic cyanobacteria. Reduced ice cover and earlier stabilization of the water column in spring will also cause the spring bloom to begin earlier. Changes in the timing of the blooms and in the species composition will also disturb the existing food webs, provoking changes at the higher trophic levels.
The potential decrease in salinity projected in some of the simulations would have a direct infl uence on the composition and distribution of species in the Baltic Sea, particularly for plankton and zoobenthos. The zooplankton species composition, in turn, has an infl uence on their predators, planktivorous fi sh such as herring and sprat, thus affecting their growth and condition. A potential decrease in salinity could also increase the area of oxic sediments and thus increase the area available for zoobenthos colonization. This would thus affect the distribution of benthos and probably also the species composition.
The anticipated impact of warming on marine mammals in the Baltic Sea is mainly expected in the large decrease of ice cover, impacting the seal species that breed on ice, primarily ringed seals but also grey seals. On the other hand, increased temperatures may be advantageous for harbour seals and harbour porpoises. Potential effects on birds indicate that migrating and wintering birds in the Baltic may be most affected by warming processes, with birds wintering farther north in the Baltic Basin than previously.
Thus, although the impacts of climate change during the 21st century are diffi cult to predict with certainty, it is clear that the projected increase in temperature, taken together with changes in other conditions associated with windiness and precipitation, will have a major infl uence on the conditions for biota in the Baltic Sea basin. This will affect species composition, distributions, and interactions in ways that are only roughly under-stood at the present time.
8
Climate Change and ManagementThe accumulating scientifi c evidence indicates a future change to warmer temperatures. For the water body of the Baltic Sea, a decrease in ice cover and a tendency towards lower salinity can be expected to have an infl uence on the Baltic Sea ecosystem and its species composition. The expected changes in precipitation (and thus river runoff) may have additional detrimental effects in relation to the problem of eutrophication. In addi-tion, there is a risk of increases in storm surges and fl oods, posing further challenges to coastal management.
Because the mitigation of climate change is a global challenge, support for the implementation of national, EU, and particularly global initiatives to reduce emissions of greenhouse gases (including the European Climate Change Programme, the UN Framework Convention on Climate Change, and the Kyoto Protocol) is necessary.
Adaptation to climate change will need to be regional and local and should aim to reduce the negative effects of climate change. In order to balance management decisions between the precautionary principle and scientifi c evidence, a robust basis of environmental observations and model projections should be developed to support policy-making and management.
In relation to the programmes of HELCOM, it is clear that climate change could very strongly affect the attainment of ecological objectives associated with all four HELCOM goals: (1) the Baltic Sea unaffected by eutrophication; (2) a favourable status of Baltic Sea biodiversity; (3) Baltic Sea life undisturbed by hazardous substances; and (4) maritime activities carried out in an environmentally friendly way. The greatest effect would be on biodiversity, but clear effects could also be anticipated on eutrophication.
The HELCOM strategy in relation to climate change should aim to limit or mitigate adverse impacts as well as to enhance the resilience of the Baltic marine environment by improving its capacity to cope with the stress of climate change. It is thus necessary to continue to improve measures:– to mitigate eutrophication by intensifying the
reduction of waterborne and airborne nutrient inputs;
– to continue and intensify measures to reduce inputs of heavy metals and persistent or haz-ardous organic pollutants;
– to reduce emissions (both from fuel combus-tion and from ship antifouling treatments) from maritime transport and to prevent ballast water releases;
– to enhance the protection of marine and coastal landscapes and habitats and, particularly, the conservation of native Baltic species.
In order to increase our understanding of climate change and its impacts, it is necessary to continue long-term monitoring and data collection and to develop monitoring programmes further to take into account climate change-related aspects. The development of models, particularly models of the Baltic marine ecosystem and the potential impact of climate-related changes on ecosystem components and processes, is of urgent importance. For model-ling, better knowledge of ecosystem processes as well as, among others, species interactions is needed based on fundamental scientifi c research. Promotion of cross-sector and interdisciplinary scientifi c research is invaluable, while co-operation between the scientifi c and management communi-ties is essential in order to develop cost-effi cient and effective measures for adaptation.
The implementation of the strategic Baltic Sea Action Plan, which is currently being drafted by HELCOM to further reduce pollution in the sea and repair the damage done to the marine environment, will provide a basis for enhancing the resiliency and adaptive capacity of the Baltic Sea environment.
9
Clim
ate
Cha
nge
in th
e B
altic
Sea
Are
a –
HE
LCO
M T
hem
atic
Ass
essm
ent i
n 20
07
The Baltic Sea is, geologically speaking, a very young sea, still subject to natural, comparatively rapid, geological processes such as the gradual uplifting of the Baltic Sea basin, in all but the southern areas, owing to the melting of the glaciers that covered this area until about 10 000 years ago. However, human activities have had a growing infl uence on the Baltic Sea and its ecology, and these infl uences have become increasing large over the past two centuries as the population has increased and agricultural and industrial activities have intensifi ed. The Baltic Sea is also subject to wider, more global infl uences, such as those related to the wide-spread global emissions of large quantities of greenhouse gases, mainly carbon dioxide (CO2) and methane, particularly within the second half of the 20th century, which are having an infl u-ence on global climate. This report will review the current climate of the Baltic Sea area in a
historical perspective to assess the changes that have already occurred and then will provide indications of possible and plausible future changes in the climate as well as some of their projected impacts on the ecology of the Baltic Sea. It should be noted that the term “climate change” does not refer only to anthropogenic climate change, but is a broader term, including changes due to internal dynamics and natural external factors, as well as anthropogenic factors. When changes have been observed, research and modelling are needed to attempt to attribute causative factors for the changes, and these factors are usually complex. Based on the BACC report, this Thematic Assessment report has adopted the Intergovernmental Panel on Climate Change (IPCC) defi nition of climate change, which is “any change in climate over time whether due to natural variability or as a result of human activity” (Pielke, 2004).
1. Introduction
10
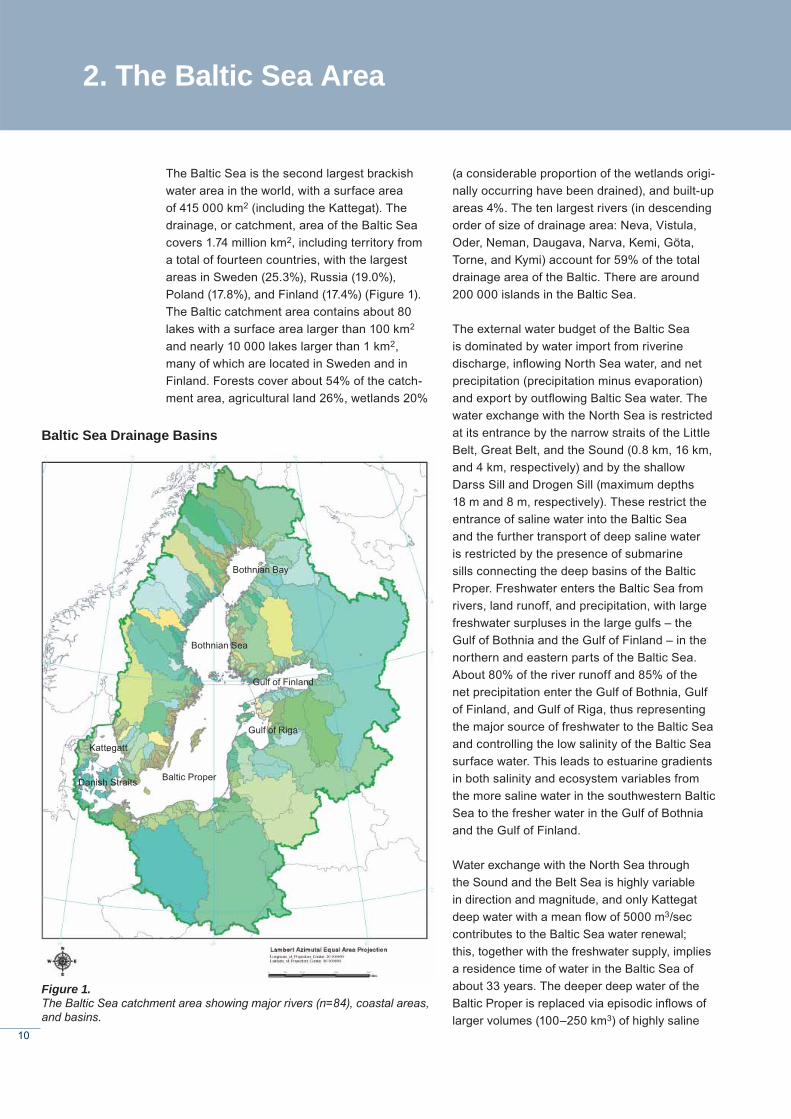
The Baltic Sea is the second largest brackish water area in the world, with a surface area of 415 000 km2 (including the Kattegat). The drainage, or catchment, area of the Baltic Sea covers 1.74 million km2, including territory from a total of fourteen countries, with the largest areas in Sweden (25.3%), Russia (19.0%), Poland (17.8%), and Finland (17.4%) (Figure 1). The Baltic catchment area contains about 80 lakes with a surface area larger than 100 km2 and nearly 10 000 lakes larger than 1 km2, many of which are located in Sweden and in Finland. Forests cover about 54% of the catch-ment area, agricultural land 26%, wetlands 20%
(a considerable proportion of the wetlands origi-nally occurring have been drained), and built-up areas 4%. The ten largest rivers (in descending order of size of drainage area: Neva, Vistula, Oder, Neman, Daugava, Narva, Kemi, Göta, Torne, and Kymi) account for 59% of the total drainage area of the Baltic. There are around 200 000 islands in the Baltic Sea.
The external water budget of the Baltic Sea is dominated by water import from riverine discharge, infl owing North Sea water, and net precipitation (precipitation minus evaporation) and export by outfl owing Baltic Sea water. The water exchange with the North Sea is restricted at its entrance by the narrow straits of the Little Belt, Great Belt, and the Sound (0.8 km, 16 km, and 4 km, respectively) and by the shallow Darss Sill and Drogen Sill (maximum depths 18 m and 8 m, respectively). These restrict the entrance of saline water into the Baltic Sea and the further transport of deep saline water is restricted by the presence of submarine sills connecting the deep basins of the Baltic Proper. Freshwater enters the Baltic Sea from rivers, land runoff, and precipitation, with large freshwater surpluses in the large gulfs – the Gulf of Bothnia and the Gulf of Finland – in the northern and eastern parts of the Baltic Sea. About 80% of the river runoff and 85% of the net precipitation enter the Gulf of Bothnia, Gulf of Finland, and Gulf of Riga, thus representing the major source of freshwater to the Baltic Sea and controlling the low salinity of the Baltic Sea surface water. This leads to estuarine gradients in both salinity and ecosystem variables from the more saline water in the southwestern Baltic Sea to the fresher water in the Gulf of Bothnia and the Gulf of Finland.
Water exchange with the North Sea through the Sound and the Belt Sea is highly variable in direction and magnitude, and only Kattegat deep water with a mean fl ow of 5000 m3/sec contributes to the Baltic Sea water renewal; this, together with the freshwater supply, implies a residence time of water in the Baltic Sea of about 33 years. The deeper deep water of the Baltic Proper is replaced via episodic infl ows of larger volumes (100–250 km3) of highly saline
2. The Baltic Sea Area
Baltic Sea Drainage Basins
Bothnian Bay
Danish Straits Baltic Proper
Gulf of Riga
Bothnian Sea
Gulf of Finland
Kattegatt
Figure 1. The Baltic Sea catchment area showing major rivers (n=84), coastal areas, and basins.
11
Clim
ate
Cha
nge
in th
e B
altic
Sea
Are
a –
HE
LCO
M T
hem
atic
Ass
essm
ent i
n 20
07
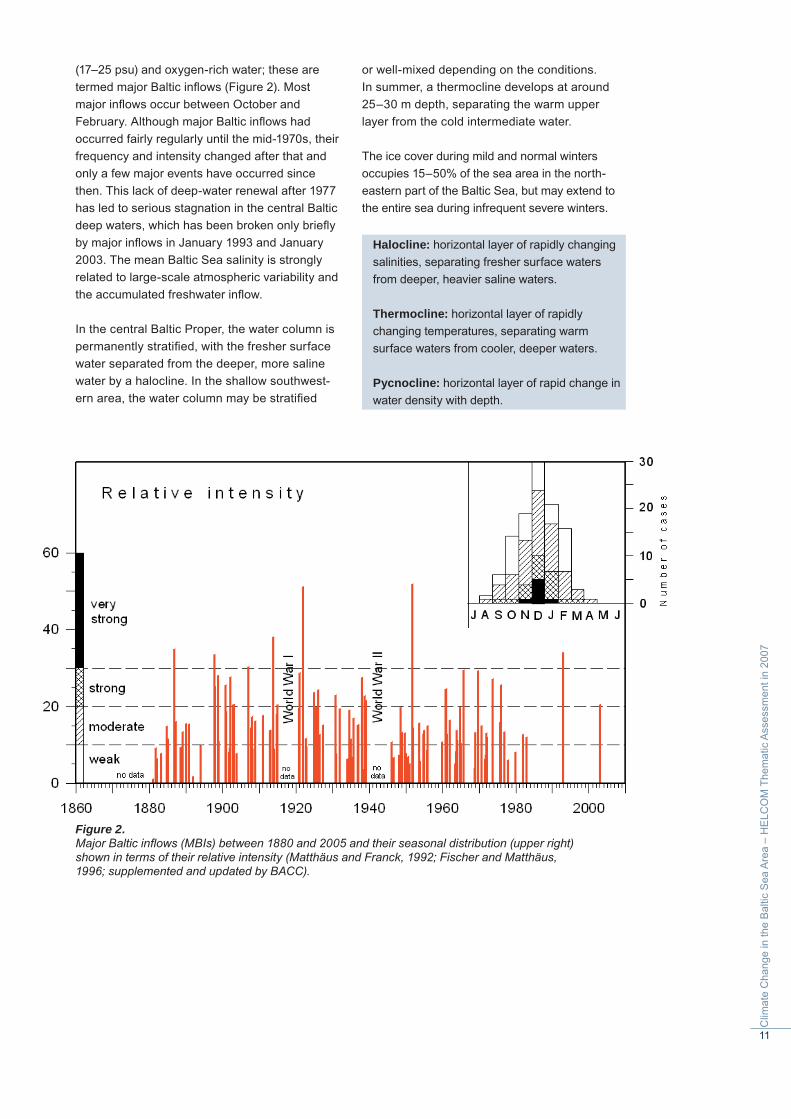
(17–25 psu) and oxygen-rich water; these are termed major Baltic infl ows (Figure 2). Most major infl ows occur between October and February. Although major Baltic infl ows had occurred fairly regularly until the mid-1970s, their frequency and intensity changed after that and only a few major events have occurred since then. This lack of deep-water renewal after 1977 has led to serious stagnation in the central Baltic deep waters, which has been broken only briefl y by major infl ows in January 1993 and January 2003. The mean Baltic Sea salinity is strongly related to large-scale atmospheric variability and the accumulated freshwater infl ow.
In the central Baltic Proper, the water column is permanently stratifi ed, with the fresher surface water separated from the deeper, more saline water by a halocline. In the shallow southwest-ern area, the water column may be stratifi ed
or well-mixed depending on the conditions. In summer, a thermocline develops at around 25–30 m depth, separating the warm upper layer from the cold intermediate water.
The ice cover during mild and normal winters occupies 15–50% of the sea area in the north-eastern part of the Baltic Sea, but may extend to the entire sea during infrequent severe winters.
Halocline: horizontal layer of rapidly changing salinities, separating fresher surface waters from deeper, heavier saline waters.
Thermocline: horizontal layer of rapidly changing temperatures, separating warm surface waters from cooler, deeper waters.
Pycnocline: horizontal layer of rapid change in water density with depth.
Figure 2. Major Baltic infl ows (MBIs) between 1880 and 2005 and their seasonal distribution (upper right) shown in terms of their relative intensity (Matthäus and Franck, 1992; Fischer and Matthäus, 1996; supplemented and updated by BACC).
12
The climate of the Baltic Sea basin (i.e., the Baltic Sea and its catchment area), located between 50 °N and 70 °N in the coastal zone of the Eurasian continent, is embedded in the general atmospheric circulation system of the Northern Hemisphere with mean westerly air fl ow of annually varying intensity. The strong westerly air fl ow provides for maritime, humid air mass transport particularly into the southwestern and southern parts of the Baltic Sea basin, while in the east and north the maritime westerly air fl ow is weakened, providing for increasingly continental climate conditions. There are two main climatic types dominant in much of the Baltic Sea basin: 1) most of the middle and northern areas are dominated by the temperate coniferous-mixed forest zone with long, cold, wet winters, where the mean temperature of the warmest month is no lower than 10°C and that of the coldest month is no higher than −3°C, and where the rainfall is, on average, moderate in all seasons; and 2) much of the southwestern and southern areas belong to the marine west-coast climate, where prevailing winds constantly bring in moisture from the oceans and the presence of a warm ocean current provides for moist and mild winters, with frequent thawing periods even in mid-winter.
3.1 Atmospheric circulation and wind patterns and their changes over the Baltic Sea basinThe Baltic Sea basin is an area of permanent exchange of air masses of different features, resulting in great variability of weather, from day to day and from year to year. Major air pressure systems known to affect the weather and circula-tion in the Baltic Sea basin are the low-pressure system usually found near Iceland (Icelandic Low) and the high-pressure system in the region over the Azores Islands (Azores High). In addi-tion, the winter high/summer low over Russia may infl uence the climate and circulation in the Baltic Sea basin. These systems dominate the long-term mean surface air pressure and related mean circulation patterns over Northern Europe, showing a distinct annual cycle. A general description of this annual cycle since 1961 shows that, in the cool season of the year, start-
ing in September, southwesterly air fl ow prevails, intensifying in October. The mean southwesterly fl ow is especially intensive in January and Feb-ruary, when the core pressure of the Icelandic Low is deepest and the anticyclone (region of high pressure) over Russia as well as the Azores High is well developed. The strongest pressure gradient forms over the Baltic Sea basin during this season. The intensity of mean air fl ow over the Baltic Sea region decreases in March and becomes even weaker in April, when the Azores High starts to stretch into parts of mid-Europe; the mean fl ow over the southern Baltic Sea basin becomes weakly anticyclonic (clockwise, in the Northern Hemisphere) and, as a consequence, the mean wind direction changes to west in the north and northwesterly in the southern parts of the basin. The weakest mean pressure gradient occurs during May. In June and July, the direction of the mean air fl ow is northwesterly to westerly. Thus, the Icelandic Low dominates the basin from October to March, while during May to August particularly the southern part of the basin is infl uenced by an extension of the Azores High.
The strength of the surface air pressure gradient between the Icelandic Low and the Azores High, termed the North Atlantic Oscillation (NAO), has often been used to characterize the circulation pattern and strength over Northern Europe (see Box on the North Atlantic Oscillation). In particu-lar, the wintertime NAO has been shown to cor-relate with weather and climate in the Baltic Sea basin, whereas there is little to no infl uence in summer. The variability of the NAO over the past two centuries has been rather large and irregu-lar. In 1962–1980, a weak NAO was associated with cold conditions in the Baltic Sea basin and possibly also several fl oods in the southern part. There were several distinctive jumps in the NAO in the last two decades of the 1900s, resulting in large temperature anomalies. Since 1989, there has been a high positive NAO during most win-ters and a lower negative than previously in the autumn. In association with the high NAO during winter in the 1990s, the westerly wind fl ow from the North Atlantic was particularly strong, contributing to the mild winters in Fennoscandia during this period.
3. The Baltic Climate: Past Climate and Recent Climate Change
13
Clim
ate
Cha
nge
in th
e B
altic
Sea
Are
a –
HE
LCO
M T
hem
atic
Ass
essm
ent i
n 20
07
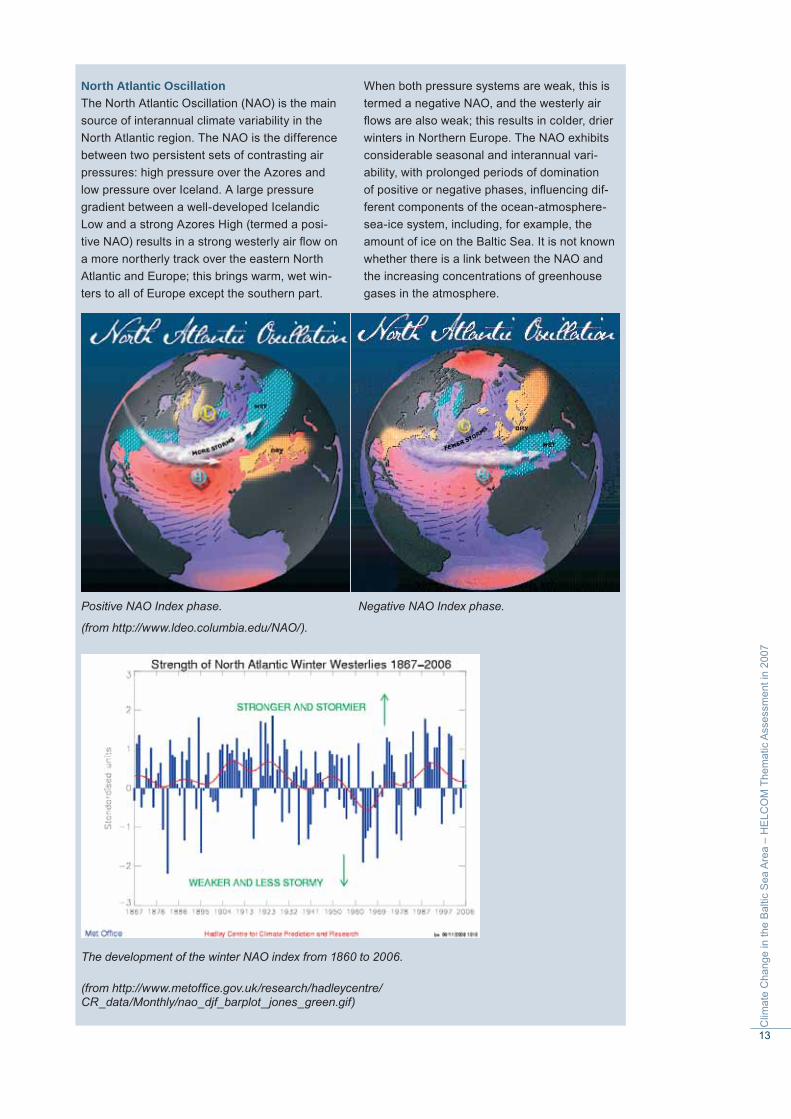
North Atlantic OscillationThe North Atlantic Oscillation (NAO) is the main source of interannual climate variability in the North Atlantic region. The NAO is the difference between two persistent sets of contrasting air pressures: high pressure over the Azores and low pressure over Iceland. A large pressure gradient between a well-developed Icelandic Low and a strong Azores High (termed a posi-tive NAO) results in a strong westerly air fl ow on a more northerly track over the eastern North Atlantic and Europe; this brings warm, wet win-ters to all of Europe except the southern part.
When both pressure systems are weak, this is termed a negative NAO, and the westerly air fl ows are also weak; this results in colder, drier winters in Northern Europe. The NAO exhibits considerable seasonal and interannual vari-ability, with prolonged periods of domination of positive or negative phases, infl uencing dif-ferent components of the ocean-atmosphere-sea-ice system, including, for example, the amount of ice on the Baltic Sea. It is not known whether there is a link between the NAO and the increasing concentrations of greenhouse gases in the atmosphere.
Negative NAO Index phase.
The development of the winter NAO index from 1860 to 2006.
(from http://www.metoffi ce.gov.uk/research/hadleycentre/CR_data/Monthly/nao_djf_barplot_ jones_green.gif)
Positive NAO Index phase.
(from http://www.ldeo.columbia.edu/NAO/).
14
The distribution of surface air temperatures is closely linked to the general climate and circula-tion regimes described above, with the general north-south temperature gradient modulated by the southwest/northeast contrast of maritime versus continental climate infl uence. The mean annual temperature differs by more than 10°C over the Baltic Sea basin. The coldest regions are northeast Finland and the upper regions of the Scandinavian mountains, with mean annual surface air temperatures well below 0°C. Northeast Finland also has the largest difference between the warmest and coldest temperatures of the year. In the southwestern part of the basin (Denmark and northern Germany), monthly mean temperatures are higher than 0°C throughout the year, but the summers are not as warm as in continental regions farther to the east.
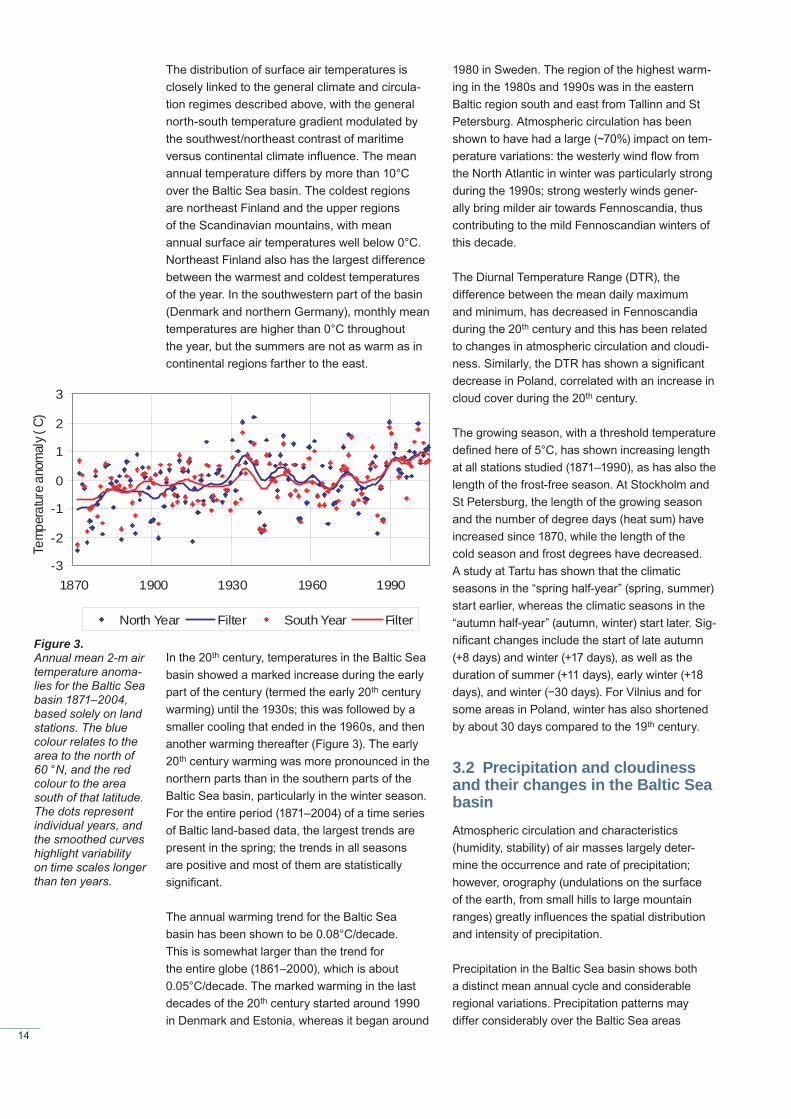
In the 20th century, temperatures in the Baltic Sea basin showed a marked increase during the early part of the century (termed the early 20th century warming) until the 1930s; this was followed by a smaller cooling that ended in the 1960s, and then another warming thereafter (Figure 3). The early 20th century warming was more pronounced in the northern parts than in the southern parts of the Baltic Sea basin, particularly in the winter season. For the entire period (1871–2004) of a time series of Baltic land-based data, the largest trends are present in the spring; the trends in all seasons are positive and most of them are statistically signifi cant.
The annual warming trend for the Baltic Sea basin has been shown to be 0.08°C/decade. This is somewhat larger than the trend for the entire globe (1861–2000), which is about 0.05°C/decade. The marked warming in the last decades of the 20th century started around 1990 in Denmark and Estonia, whereas it began around
1980 in Sweden. The region of the highest warm-ing in the 1980s and 1990s was in the eastern Baltic region south and east from Tallinn and St Petersburg. Atmospheric circulation has been shown to have had a large (~70%) impact on tem-perature variations: the westerly wind fl ow from the North Atlantic in winter was particularly strong during the 1990s; strong westerly winds gener-ally bring milder air towards Fennoscandia, thus contributing to the mild Fennoscandian winters of this decade.
The Diurnal Temperature Range (DTR), the difference between the mean daily maximum and minimum, has decreased in Fennoscandia during the 20th century and this has been related to changes in atmospheric circulation and cloudi-ness. Similarly, the DTR has shown a signifi cant decrease in Poland, correlated with an increase in cloud cover during the 20th century.
The growing season, with a threshold temperature defi ned here of 5°C, has shown increasing length at all stations studied (1871–1990), as has also the length of the frost-free season. At Stockholm and St Petersburg, the length of the growing season and the number of degree days (heat sum) have increased since 1870, while the length of the cold season and frost degrees have decreased. A study at Tartu has shown that the climatic seasons in the “spring half-year” (spring, summer) start earlier, whereas the climatic seasons in the “autumn half-year” (autumn, winter) start later. Sig-nifi cant changes include the start of late autumn (+8 days) and winter (+17 days), as well as the duration of summer (+11 days), early winter (+18 days), and winter (−30 days). For Vilnius and for some areas in Poland, winter has also shortened by about 30 days compared to the 19th century.
3.2 Precipitation and cloudiness and their changes in the Baltic Sea basinAtmospheric circulation and characteristics (humidity, stability) of air masses largely deter-mine the occurrence and rate of precipitation; however, orography (undulations on the surface of the earth, from small hills to large mountain ranges) greatly infl uences the spatial distribution and intensity of precipitation.
Precipitation in the Baltic Sea basin shows both a distinct mean annual cycle and considerable regional variations. Precipitation patterns may differ considerably over the Baltic Sea areas
-3
-2
-1
0
1
2
3
1870 1900 1930 1960 1990
Tem
pera
ture
anom
aly(
C)
North Year Filter South Year Filter
Figure 3. Annual mean 2-m air temperature anoma-lies for the Baltic Sea basin 1871–2004, based solely on land stations. The blue colour relates to the area to the north of 60 °N, and the red colour to the area south of that latitude. The dots represent individual years, and the smoothed curves highlight variability on time scales longer than ten years.
15
Clim
ate
Cha
nge
in th
e B
altic
Sea
Are
a –
HE
LCO
M T
hem
atic
Ass
essm
ent i
n 20
07
compared to land areas of the basin. There are a number of diffi culties in developing good estimates of the amount of precipitation, particularly over sea areas and for snow, owing among others to the small-scale variation in precipitation and the diffi culties of rain gauges to catch all precipitation. Recent observations have provided an estimate (for the past 30 years) of mean annual precipitation of 750 mm/year for the entire Baltic Sea basin, including both land and sea. There are, however, large regional variations in the annual mean precipitation. Over the drainage basin of the Baltic Sea, the largest amounts of precipitation occur in the mountain regions in Scandinavia and southern Poland, while the lowest amounts occur in the northern and northeastern part of the basin as well as over the central Baltic Sea. Mean monthly pre-cipitation is highest during July and August, with up to 80 mm in August, and lowest from February to April, with less than 45 mm on average.
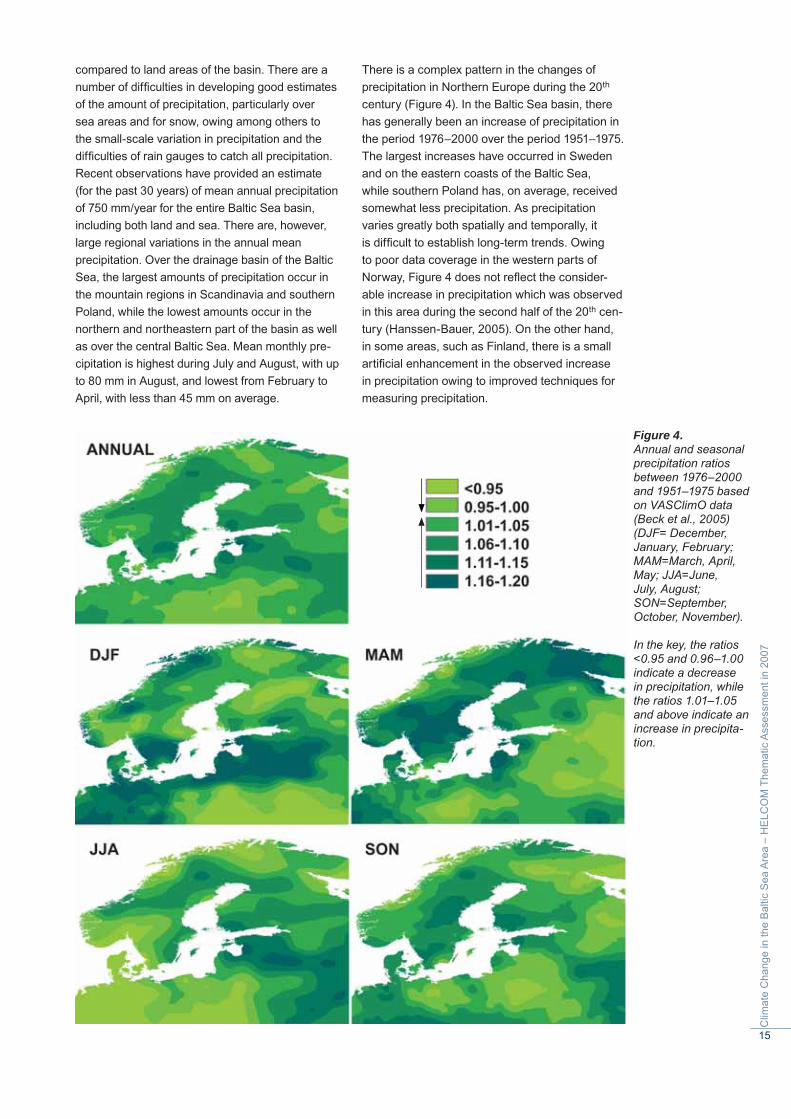
There is a complex pattern in the changes of precipitation in Northern Europe during the 20th century (Figure 4). In the Baltic Sea basin, there has generally been an increase of precipitation in the period 1976–2000 over the period 1951–1975. The largest increases have occurred in Sweden and on the eastern coasts of the Baltic Sea, while southern Poland has, on average, received somewhat less precipitation. As precipitation varies greatly both spatially and temporally, it is diffi cult to establish long-term trends. Owing to poor data coverage in the western parts of Norway, Figure 4 does not refl ect the consider-able increase in precipitation which was observed in this area during the second half of the 20th cen-tury (Hanssen-Bauer, 2005). On the other hand, in some areas, such as Finland, there is a small artifi cial enhancement in the observed increase in precipitation owing to improved techniques for measuring precipitation.
Figure 4. Annual and seasonal precipitation ratios between 1976–2000 and 1951–1975 based on VASClimO data (Beck et al., 2005) (DJF= December, January, February; MAM=March, April, May; JJA=June, July, August; SON=September, October, November).
In the key, the ratios <0.95 and 0.96–1.00 indicate a decrease in precipitation, while the ratios 1.01–1.05 and above indicate an increase in precipita-tion.
16
There are distinct patterns of seasonal changes, with spring precipitation increasing over large areas around the Baltic Sea; for example, an increase of more than 15% in the spring has occurred in central Sweden, but in some regions in southern Poland spring precipitation has decreased. Rainfall amounts during summer have shown a small decrease over areas mainly in the western and southern parts of the Baltic Sea basin, but some increase has occurred in regions around the northern Baltic Proper as well as in southern Finland and northern Sweden. In autumn there has been an overall increase, although there are regions showing a small decrease particularly in Germany and Poland. The season with the largest increase is winter. The main area of increase stretches from Norway, Denmark, and Germany in the west to the Baltic States and Russia in the east.
During wintertime, part of the increase in pre-cipitation can be attributed to the more frequent westerly and/or cyclonic circulation related to the large-scale changes in atmospheric circulation; some of the changes in the summer months have also been attributed to changes in circula-tion patterns.
For much of the Baltic Sea basin, in particular the eastern continental part and also much of the Baltic Sea itself, there is a prominent annual cycle of clouds, with the largest cloud amounts during winter and the smallest amounts during summer. However, little to nearly no annual cycle in clouds is observed in parts of the western and northern regions (in particular, mid- and northern Sweden and northern Finland). During summer months, few or no convective clouds form over the Baltic Sea, in contrast to the surrounding land areas.
A general increasing trend in cloud cover over large parts of Northern Europe (Fennoscandia) has been observed during the period 1910–1995, with the change characteristic for spring, summer, and autumn. However, wintertime cloudiness seems to have been decreasing since the 1930s.
3.3 Changes in extreme eventsAs the climate changes, the characteristics of extreme events may also change. Extreme climate events can be defi ned as events that occur with extraordinarily low frequency during a certain period of time (rarity), events with high magnitude (intensity) or duration, and events causing sizeable impacts such as losses
(severity). Some indices have been developed to study changes in climate extremes; these include the number of very warm or very cold days for the time of year, the number of heavy rainfall days, and the number of frost days.
In terms of cold-temperature events, there has been a strong decrease in the number of days with a minimum temperature below 0°C in the second half of the 20th century. This decrease is greatest in Denmark, exceeding 8 days per decade at some places. In the annual cycle, the strongest decrease in frost-day numbers is observed in winter and spring, while a slight increasing tendency is observed during autumn. The warming trend is also evident in the number of annual winter and spring ice-days (days with the maximum temperature below 0°C), whereas the number of ice-days is slightly increasing during autumn.
For warm-temperature events, the strongest increase in warm days has occurred in spring and winter (0–3% per decade), but in the east-ern regions a decreasing tendency has been observed in autumn and summer. The number of days with a maximum temperature above 25°C has undergone a small increase in the southwestern part of the Baltic Sea basin, most signifi cantly in southern Germany; however, in the eastern part of the Baltic Sea basin, a decrease has been observed.
Seasonal minimum and maximum daily tem-peratures are positively correlated with the NAO index. The intensity of temperature extremes is also related to cloud cover: during winter and autumn in Fennoscandia, there are positive correlations between minimum and maximum daily temperatures and cloud cover, indicating that cloud cover prevents cooling, while during summer correlations are negative and more signifi cant.
The length of the growing season has shown a signifi cant increasing trend in the period 1901–1990 associated with the fact that the starting date is coming earlier and the ending date is later.
Wet spells, defi ned here as the number of days with precipitation ≥10 mm, have shown an increasing trend in the central and northern parts of the Baltic Sea basin, while there has been a small decrease in Poland. There have been a number of extreme precipitation events
17
Clim
ate
Cha
nge
in th
e B
altic
Sea
Are
a –
HE
LCO
M T
hem
atic
Ass
essm
ent i
n 20
07in the Baltic Sea basin during the past century, but many of them have been in mountain areas, which orographically enhance precipitation.
Extreme winds are related to the North Atlantic storm track and to the phase of the NAO. Strong winds can, among others, cause wind erosion, snow drift, damage to nature (e.g., forests), and damage to coastal areas caused by intensive wave action and/or coastal fl ooding resulting from storm surges.
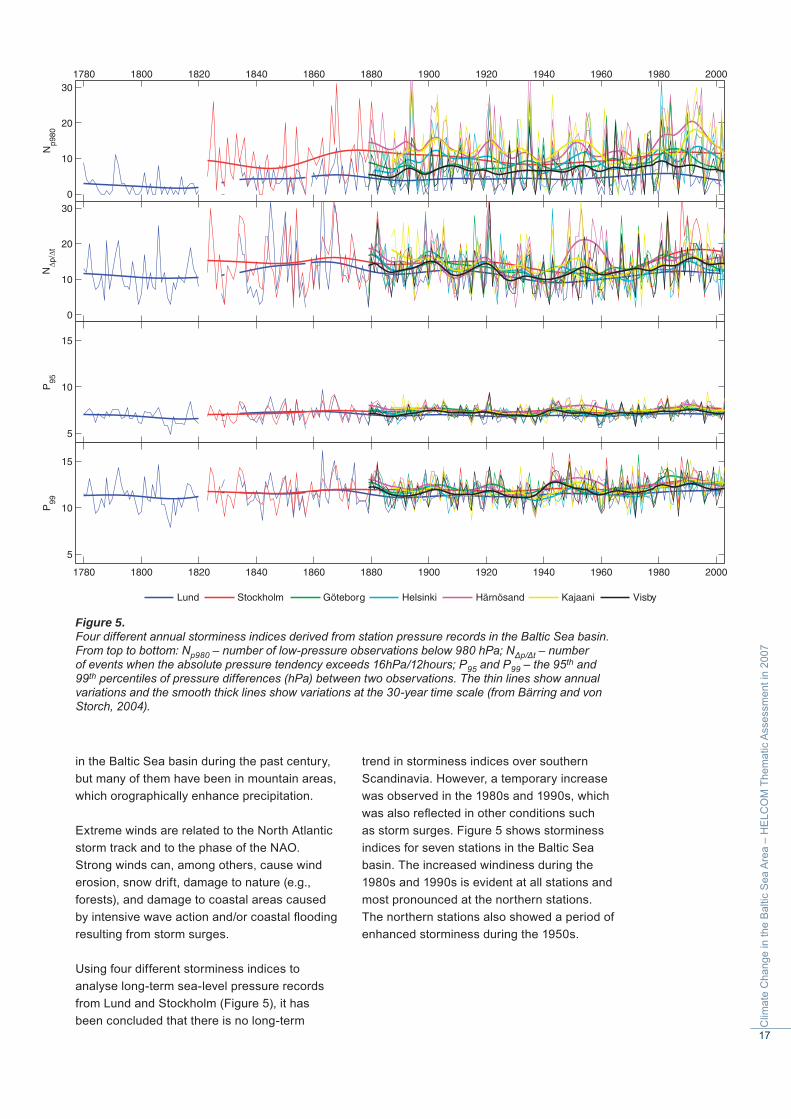
Using four different storminess indices to analyse long-term sea-level pressure records from Lund and Stockholm (Figure 5), it has been concluded that there is no long-term
trend in storminess indices over southern Scandinavia. However, a temporary increase was observed in the 1980s and 1990s, which was also refl ected in other conditions such as storm surges. Figure 5 shows storminess indices for seven stations in the Baltic Sea basin. The increased windiness during the 1980s and 1990s is evident at all stations and most pronounced at the northern stations. The northern stations also showed a period of enhanced storminess during the 1950s.
1780 1800 1820 1840 1860 1880 1900 1920 1940 1960 1980 2000
0
10
20
30
Np9
80
0
10
20
30
NΔp
/Δt
5
10
15
P95
1780 1800 1820 1840 1860 1880 1900 1920 1940 1960 1980 2000
5
10
15
P99
Lund Stockholm Göteborg Helsinki Härnösand Kajaani Visby
Figure 5. Four different annual storminess indices derived from station pressure records in the Baltic Sea basin. From top to bottom: Np980 – number of low-pressure observations below 980 hPa; NΔp/Δt – number of events when the absolute pressure tendency exceeds 16hPa/12hours; P95 and P99 – the 95th and 99th percentiles of pressure differences (hPa) between two observations. The thin lines show annual variations and the smooth thick lines show variations at the 30-year time scale (from Bärring and von Storch, 2004).
18
October; rivers on the southern and southeastern coasts of the Baltic freeze in late December, while in the rivers fl owing within the southwestern coasts of the Baltic Sea a permanent ice cover may not be formed during some warm winters. The duration of the complete ice cover in the northern extremity of the Baltic Sea basin may last 180 to 200 days, with ice break-up usually occurring early in May. In the southeastern part of the basin, ice break-up occurs in late March.
An analysis of ice events in rivers of the Russian territory of the Baltic Sea drainage basin has shown that, over the course of the second half of the 20th century, the start of ice events came 10–15 days later and the complete ice melt occurred 15–20 days earlier compared with the 1950s. The duration of the complete ice coverage in rivers in the north of this area became 25–30 days shorter, while in the southern rivers this period was reduced by 35–40 days. The maximum thickness of the ice cover decreased by 15–20% by the end of the 20th century in comparison with 30–40 years earlier.
Similarly, a strong negative trend in the ice cover duration (decreasing by 0.5–0.9 day/year on aver-age) has been observed for some lakes in the Polish and Russian parts of the Baltic drainage basin during the past 40–50 years. A negative trend in the maximum ice cover thickness has also been established for Polish, Russian, and Finnish study
4.1 Water and ice regime, and snow cover
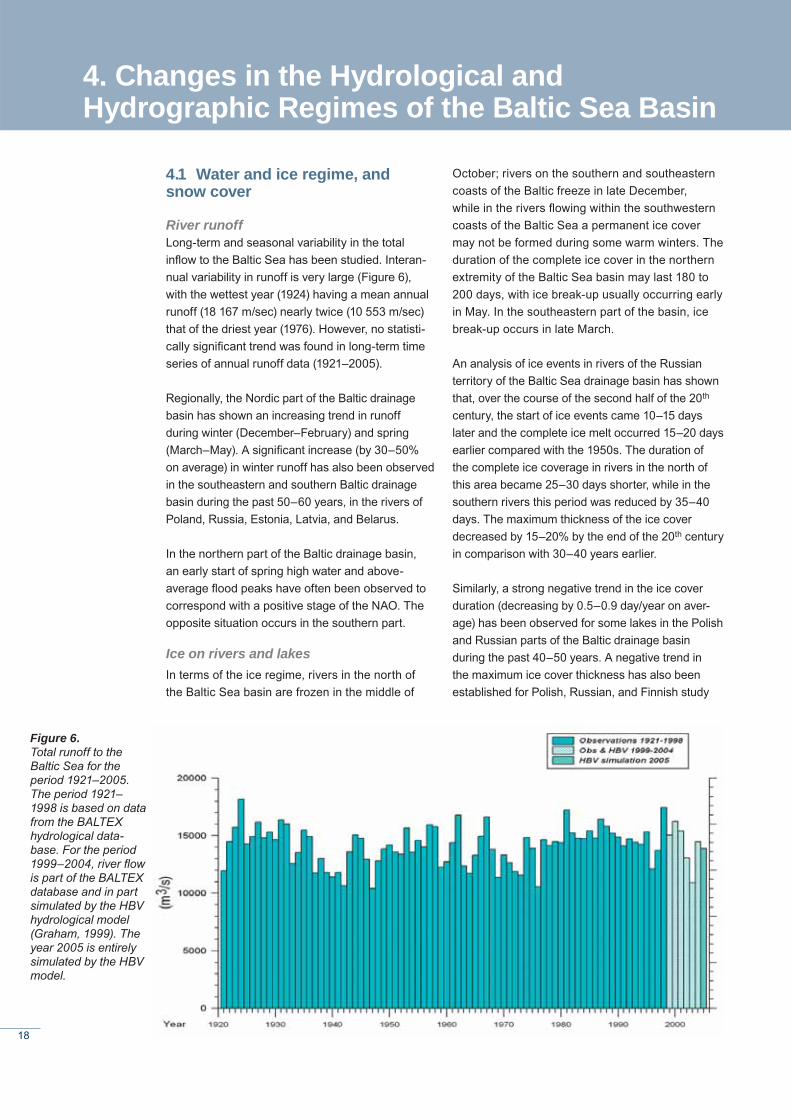
River runoffLong-term and seasonal variability in the total infl ow to the Baltic Sea has been studied. Interan-nual variability in runoff is very large (Figure 6), with the wettest year (1924) having a mean annual runoff (18 167 m/sec) nearly twice (10 553 m/sec) that of the driest year (1976). However, no statisti-cally signifi cant trend was found in long-term time series of annual runoff data (1921–2005).
Regionally, the Nordic part of the Baltic drainage basin has shown an increasing trend in runoff during winter (December–February) and spring (March–May). A signifi cant increase (by 30–50% on average) in winter runoff has also been observed in the southeastern and southern Baltic drainage basin during the past 50–60 years, in the rivers of Poland, Russia, Estonia, Latvia, and Belarus.
In the northern part of the Baltic drainage basin, an early start of spring high water and above-average fl ood peaks have often been observed to correspond with a positive stage of the NAO. The opposite situation occurs in the southern part.
Ice on rivers and lakesIn terms of the ice regime, rivers in the north of the Baltic Sea basin are frozen in the middle of
4. Changes in the Hydrological and Hydrographic Regimes of the Baltic Sea Basin
Figure 6. Total runoff to the Baltic Sea for the period 1921–2005. The period 1921–1998 is based on data from the BALTEX hydrological data-base. For the period 1999–2004, river fl ow is part of the BALTEX database and in part simulated by the HBV hydrological model (Graham, 1999). The year 2005 is entirely simulated by the HBV model.
19
Clim
ate
Cha
nge
in th
e B
altic
Sea
Are
a –
HE
LCO
M T
hem
atic
Ass
essm
ent i
n 20
07
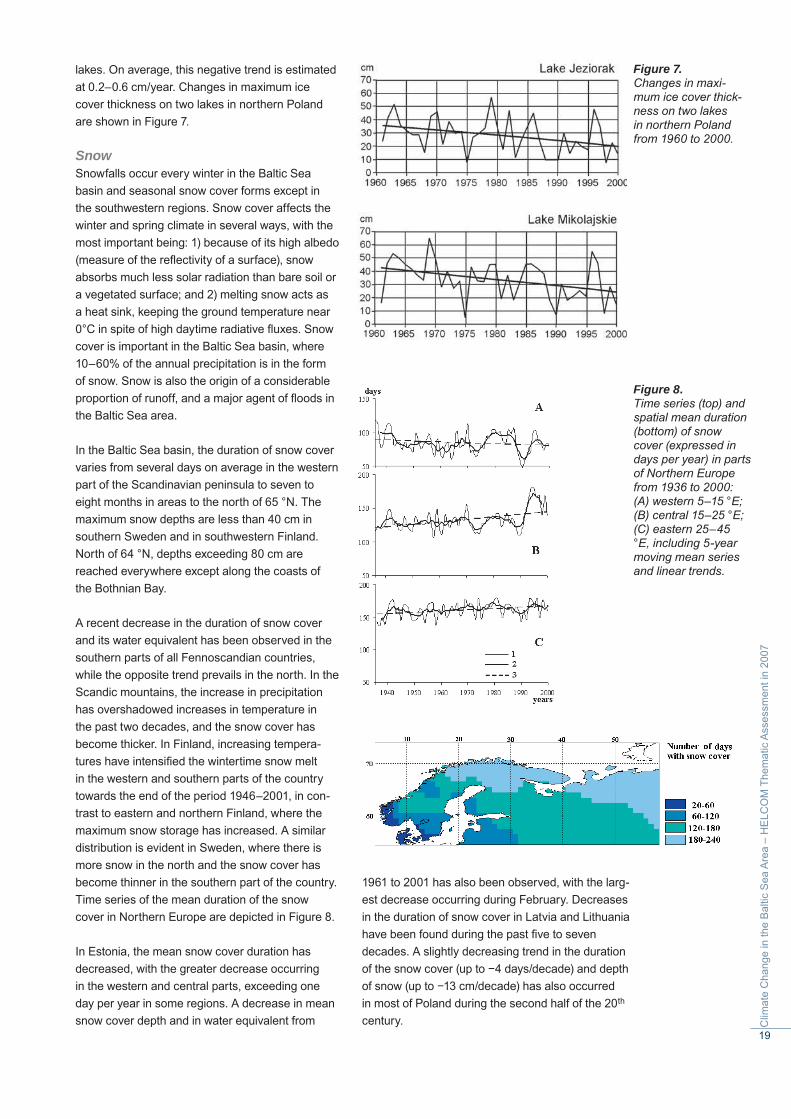
lakes. On average, this negative trend is estimated at 0.2–0.6 cm/year. Changes in maximum ice cover thickness on two lakes in northern Poland are shown in Figure 7.
SnowSnowfalls occur every winter in the Baltic Sea basin and seasonal snow cover forms except in the southwestern regions. Snow cover affects the winter and spring climate in several ways, with the most important being: 1) because of its high albedo (measure of the refl ectivity of a surface), snow absorbs much less solar radiation than bare soil or a vegetated surface; and 2) melting snow acts as a heat sink, keeping the ground temperature near 0°C in spite of high daytime radiative fl uxes. Snow cover is important in the Baltic Sea basin, where 10–60% of the annual precipitation is in the form of snow. Snow is also the origin of a considerable proportion of runoff, and a major agent of fl oods in the Baltic Sea area.
In the Baltic Sea basin, the duration of snow cover varies from several days on average in the western part of the Scandinavian peninsula to seven to eight months in areas to the north of 65 °N. The maximum snow depths are less than 40 cm in southern Sweden and in southwestern Finland. North of 64 °N, depths exceeding 80 cm are reached everywhere except along the coasts of the Bothnian Bay.
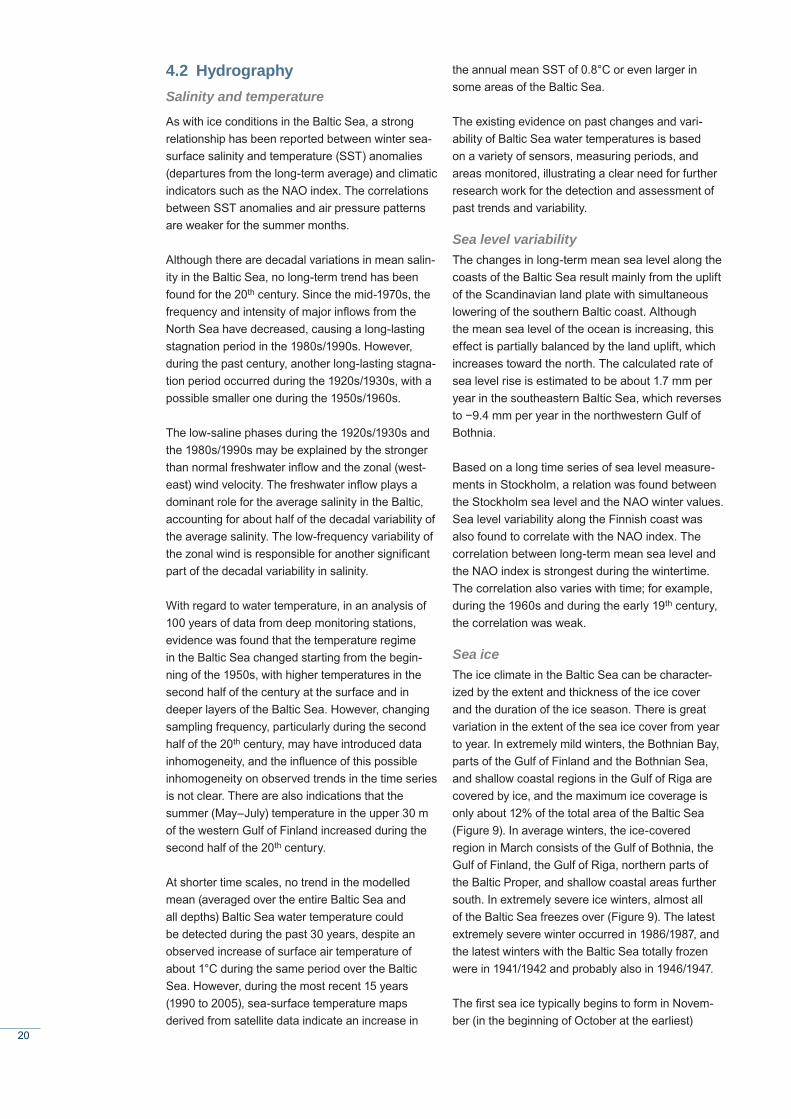
A recent decrease in the duration of snow cover and its water equivalent has been observed in the southern parts of all Fennoscandian countries, while the opposite trend prevails in the north. In the Scandic mountains, the increase in precipitation has overshadowed increases in temperature in the past two decades, and the snow cover has become thicker. In Finland, increasing tempera-tures have intensifi ed the wintertime snow melt in the western and southern parts of the country towards the end of the period 1946–2001, in con-trast to eastern and northern Finland, where the maximum snow storage has increased. A similar distribution is evident in Sweden, where there is more snow in the north and the snow cover has become thinner in the southern part of the country. Time series of the mean duration of the snow cover in Northern Europe are depicted in Figure 8.
In Estonia, the mean snow cover duration has decreased, with the greater decrease occurring in the western and central parts, exceeding one day per year in some regions. A decrease in mean snow cover depth and in water equivalent from
1961 to 2001 has also been observed, with the larg-est decrease occurring during February. Decreases in the duration of snow cover in Latvia and Lithuania have been found during the past fi ve to seven decades. A slightly decreasing trend in the duration of the snow cover (up to −4 days/decade) and depth of snow (up to −13 cm/decade) has also occurred in most of Poland during the second half of the 20th century.
Figure 8. Time series (top) and spatial mean duration (bottom) of snow cover (expressed in days per year) in parts of Northern Europe from 1936 to 2000: (A) western 5–15 °E; (B) central 15–25 °E; (C) eastern 25–45 °E, including 5-year moving mean series and linear trends.
Figure 7. Changes in maxi-mum ice cover thick-ness on two lakes in northern Poland from 1960 to 2000.
20
4.2 HydrographySalinity and temperature
As with ice conditions in the Baltic Sea, a strong relationship has been reported between winter sea-surface salinity and temperature (SST) anomalies (departures from the long-term average) and climatic indicators such as the NAO index. The correlations between SST anomalies and air pressure patterns are weaker for the summer months.
Although there are decadal variations in mean salin-ity in the Baltic Sea, no long-term trend has been found for the 20th century. Since the mid-1970s, the frequency and intensity of major infl ows from the North Sea have decreased, causing a long-lasting stagnation period in the 1980s/1990s. However, during the past century, another long-lasting stagna-tion period occurred during the 1920s/1930s, with a possible smaller one during the 1950s/1960s.
The low-saline phases during the 1920s/1930s and the 1980s/1990s may be explained by the stronger than normal freshwater infl ow and the zonal (west-east) wind velocity. The freshwater infl ow plays a dominant role for the average salinity in the Baltic, accounting for about half of the decadal variability of the average salinity. The low-frequency variability of the zonal wind is responsible for another signifi cant part of the decadal variability in salinity.
With regard to water temperature, in an analysis of 100 years of data from deep monitoring stations, evidence was found that the temperature regime in the Baltic Sea changed starting from the begin-ning of the 1950s, with higher temperatures in the second half of the century at the surface and in deeper layers of the Baltic Sea. However, changing sampling frequency, particularly during the second half of the 20th century, may have introduced data inhomogeneity, and the infl uence of this possible inhomogeneity on observed trends in the time series is not clear. There are also indications that the summer (May–July) temperature in the upper 30 m of the western Gulf of Finland increased during the second half of the 20th century.
At shorter time scales, no trend in the modelled mean (averaged over the entire Baltic Sea and all depths) Baltic Sea water temperature could be detected during the past 30 years, despite an observed increase of surface air temperature of about 1°C during the same period over the Baltic Sea. However, during the most recent 15 years (1990 to 2005), sea-surface temperature maps derived from satellite data indicate an increase in
the annual mean SST of 0.8°C or even larger in some areas of the Baltic Sea.
The existing evidence on past changes and vari-ability of Baltic Sea water temperatures is based on a variety of sensors, measuring periods, and areas monitored, illustrating a clear need for further research work for the detection and assessment of past trends and variability.
Sea level variabilityThe changes in long-term mean sea level along the coasts of the Baltic Sea result mainly from the uplift of the Scandinavian land plate with simultaneous lowering of the southern Baltic coast. Although the mean sea level of the ocean is increasing, this effect is partially balanced by the land uplift, which increases toward the north. The calculated rate of sea level rise is estimated to be about 1.7 mm per year in the southeastern Baltic Sea, which reverses to −9.4 mm per year in the northwestern Gulf of Bothnia.
Based on a long time series of sea level measure-ments in Stockholm, a relation was found between the Stockholm sea level and the NAO winter values. Sea level variability along the Finnish coast was also found to correlate with the NAO index. The correlation between long-term mean sea level and the NAO index is strongest during the wintertime. The correlation also varies with time; for example, during the 1960s and during the early 19th century, the correlation was weak.
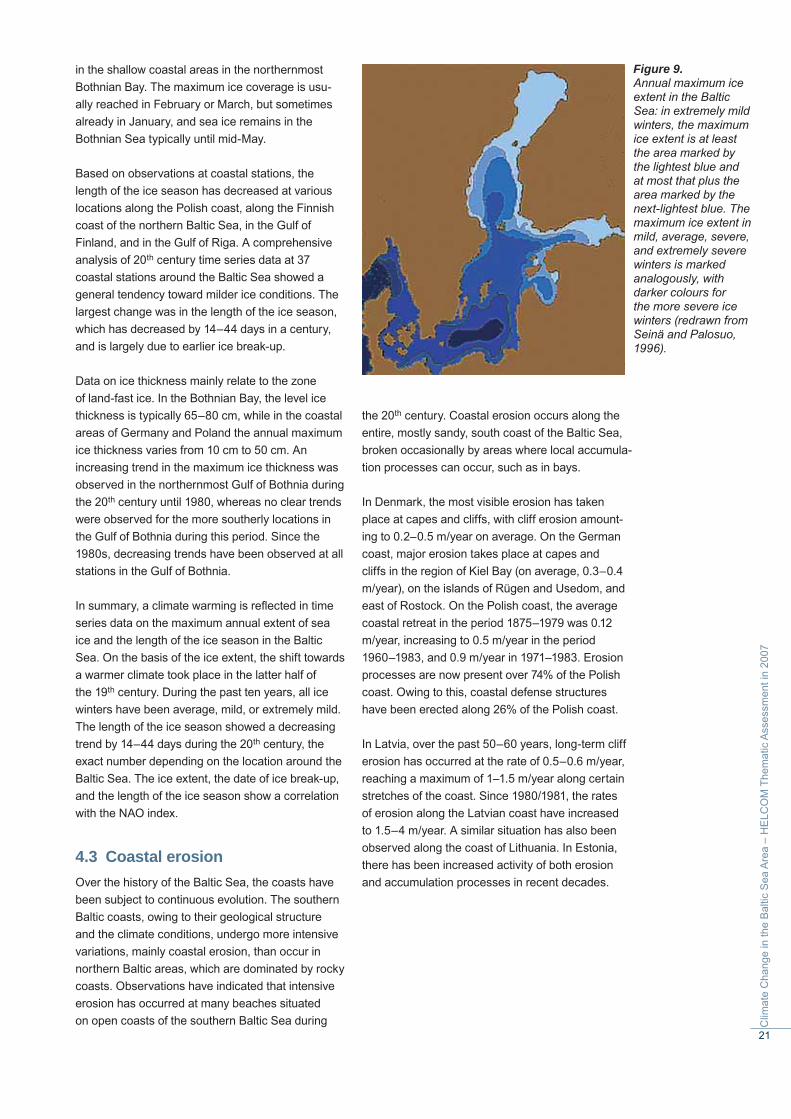
Sea iceThe ice climate in the Baltic Sea can be character-ized by the extent and thickness of the ice cover and the duration of the ice season. There is great variation in the extent of the sea ice cover from year to year. In extremely mild winters, the Bothnian Bay, parts of the Gulf of Finland and the Bothnian Sea, and shallow coastal regions in the Gulf of Riga are covered by ice, and the maximum ice coverage is only about 12% of the total area of the Baltic Sea (Figure 9). In average winters, the ice-covered region in March consists of the Gulf of Bothnia, the Gulf of Finland, the Gulf of Riga, northern parts of the Baltic Proper, and shallow coastal areas further south. In extremely severe ice winters, almost all of the Baltic Sea freezes over (Figure 9). The latest extremely severe winter occurred in 1986/1987, and the latest winters with the Baltic Sea totally frozen were in 1941/1942 and probably also in 1946/1947.
The fi rst sea ice typically begins to form in Novem-ber (in the beginning of October at the earliest)
21
Clim
ate
Cha
nge
in th
e B
altic
Sea
Are
a –
HE
LCO
M T
hem
atic
Ass
essm
ent i
n 20
07
in the shallow coastal areas in the northernmost Bothnian Bay. The maximum ice coverage is usu-ally reached in February or March, but sometimes already in January, and sea ice remains in the Bothnian Sea typically until mid-May.
Based on observations at coastal stations, the length of the ice season has decreased at various locations along the Polish coast, along the Finnish coast of the northern Baltic Sea, in the Gulf of Finland, and in the Gulf of Riga. A comprehensive analysis of 20th century time series data at 37 coastal stations around the Baltic Sea showed a general tendency toward milder ice conditions. The largest change was in the length of the ice season, which has decreased by 14–44 days in a century, and is largely due to earlier ice break-up.
Data on ice thickness mainly relate to the zone of land-fast ice. In the Bothnian Bay, the level ice thickness is typically 65–80 cm, while in the coastal areas of Germany and Poland the annual maximum ice thickness varies from 10 cm to 50 cm. An increasing trend in the maximum ice thickness was observed in the northernmost Gulf of Bothnia during the 20th century until 1980, whereas no clear trends were observed for the more southerly locations in the Gulf of Bothnia during this period. Since the 1980s, decreasing trends have been observed at all stations in the Gulf of Bothnia.
In summary, a climate warming is refl ected in time series data on the maximum annual extent of sea ice and the length of the ice season in the Baltic Sea. On the basis of the ice extent, the shift towards a warmer climate took place in the latter half of the 19th century. During the past ten years, all ice winters have been average, mild, or extremely mild. The length of the ice season showed a decreasing trend by 14–44 days during the 20th century, the exact number depending on the location around the Baltic Sea. The ice extent, the date of ice break-up, and the length of the ice season show a correlation with the NAO index.
4.3 Coastal erosionOver the history of the Baltic Sea, the coasts have been subject to continuous evolution. The southern Baltic coasts, owing to their geological structure and the climate conditions, undergo more intensive variations, mainly coastal erosion, than occur in northern Baltic areas, which are dominated by rocky coasts. Observations have indicated that intensive erosion has occurred at many beaches situated on open coasts of the southern Baltic Sea during
the 20th century. Coastal erosion occurs along the entire, mostly sandy, south coast of the Baltic Sea, broken occasionally by areas where local accumula-tion processes can occur, such as in bays.
In Denmark, the most visible erosion has taken place at capes and cliffs, with cliff erosion amount-ing to 0.2–0.5 m/year on average. On the German coast, major erosion takes place at capes and cliffs in the region of Kiel Bay (on average, 0.3–0.4 m/year), on the islands of Rügen and Usedom, and east of Rostock. On the Polish coast, the average coastal retreat in the period 1875–1979 was 0.12 m/year, increasing to 0.5 m/year in the period 1960–1983, and 0.9 m/year in 1971–1983. Erosion processes are now present over 74% of the Polish coast. Owing to this, coastal defense structures have been erected along 26% of the Polish coast.
In Latvia, over the past 50–60 years, long-term cliff erosion has occurred at the rate of 0.5–0.6 m/year, reaching a maximum of 1–1.5 m/year along certain stretches of the coast. Since 1980/1981, the rates of erosion along the Latvian coast have increased to 1.5–4 m/year. A similar situation has also been observed along the coast of Lithuania. In Estonia, there has been increased activity of both erosion and accumulation processes in recent decades.
Figure 9. Annual maximum ice extent in the Baltic Sea: in extremely mild winters, the maximum ice extent is at least the area marked by the lightest blue and at most that plus the area marked by the next-lightest blue. The maximum ice extent in mild, average, severe, and extremely severe winters is marked analogously, with darker colours for the more severe ice winters (redrawn from Seinä and Palosuo, 1996).
22
5. Projections of Future Climate Change
5.1 Projected global climate change
Climate change in the Baltic Sea basin is related to overall global climate change, and projections of future climate change in the Baltic area build on global models, scenarios, and data sets.
Changes in the global climate can occur both as a result of natural variability and as a response to anthropogenic forcing. Part of the natural vari-ability is forced, i.e., caused by external factors such as solar variability and volcanic eruptions, while another part is unforced, associated with the internal dynamics of the climate system. The most important source of anthropogenic climate forcing is changes in the atmospheric composition. Increases in carbon dioxide (CO2) and other greenhouse gases (e.g., methane and nitrous oxide) make the atmosphere less trans-parent for thermal radiation and therefore tend to warm up the surface and the troposphere. However, human activities have also increased the concentrations of several aerosol types. The net effect of anthropogenic aerosols is thought
to cool the global climate, although less is quantitatively known about this effect than about the impact of increasing greenhouse gases. The relative importance of aerosol-induced cooling, as opposed to greenhouse-gas-induced warm-ing, is likely to decrease in the future owing to anticipated measures to improve air quality.
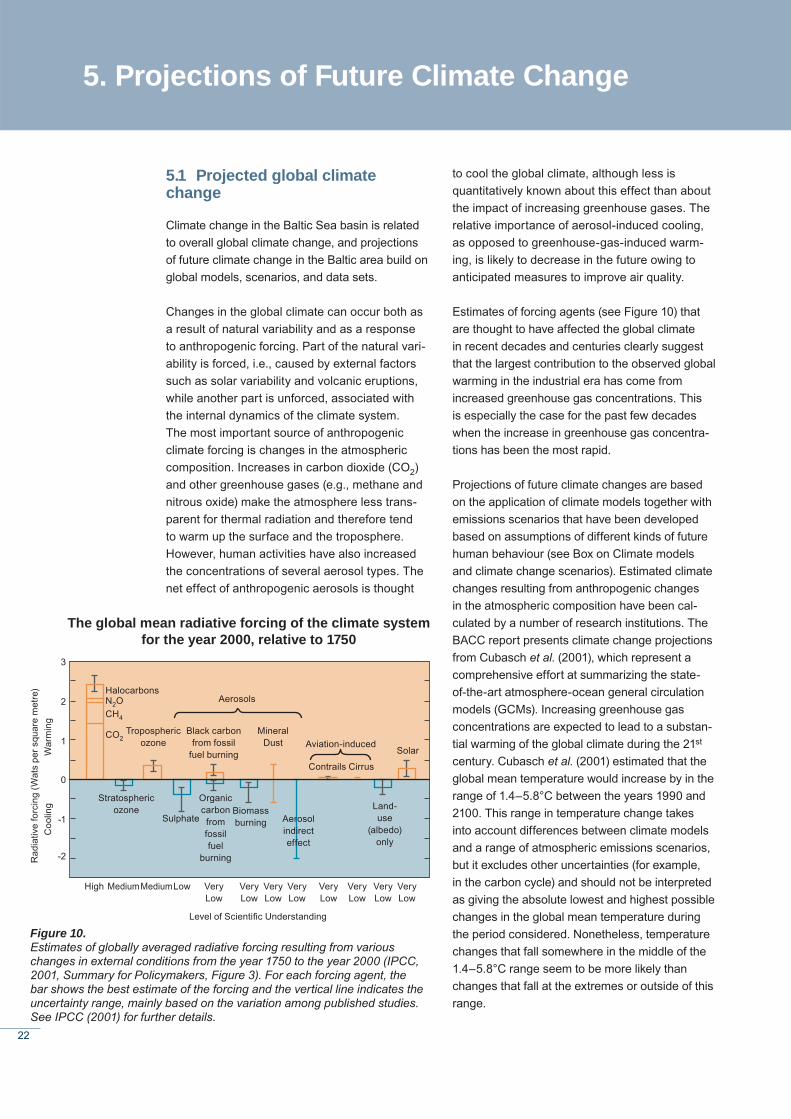
Estimates of forcing agents (see Figure 10) that are thought to have affected the global climate in recent decades and centuries clearly suggest that the largest contribution to the observed global warming in the industrial era has come from increased greenhouse gas concentrations. This is especially the case for the past few decades when the increase in greenhouse gas concentra-tions has been the most rapid.
Projections of future climate changes are based on the application of climate models together with emissions scenarios that have been developed based on assumptions of different kinds of future human behaviour (see Box on Climate models and climate change scenarios). Estimated climate changes resulting from anthropogenic changes in the atmospheric composition have been cal-culated by a number of research institutions. The BACC report presents climate change projections from Cubasch et al. (2001), which represent a comprehensive effort at summarizing the state-of-the-art atmosphere-ocean general circulation models (GCMs). Increasing greenhouse gas concentrations are expected to lead to a substan-tial warming of the global climate during the 21st century. Cubasch et al. (2001) estimated that the global mean temperature would increase by in the range of 1.4–5.8°C between the years 1990 and 2100. This range in temperature change takes into account differences between climate models and a range of atmospheric emissions scenarios, but it excludes other uncertainties (for example, in the carbon cycle) and should not be interpreted as giving the absolute lowest and highest possible changes in the global mean temperature during the period considered. Nonetheless, temperature changes that fall somewhere in the middle of the 1.4–5.8°C range seem to be more likely than changes that fall at the extremes or outside of this range.
Figure 10. Estimates of globally averaged radiative forcing resulting from various changes in external conditions from the year 1750 to the year 2000 (IPCC, 2001, Summary for Policymakers, Figure 3). For each forcing agent, the bar shows the best estimate of the forcing and the vertical line indicates the uncertainty range, mainly based on the variation among published studies. See IPCC (2001) for further details.
Halocarbons
The global mean radiative forcing of the climate system for the year 2000, relative to 1750
Aerosols
Aviation-induced
Contrails Cirrus
Black carbon from fossil
fuel burning
Mineral Dust
Tropospheric ozone
Solar
Organic carbon from fossil fuel
burning
Stratospheric ozone Biomass
burning Aerosol indirect effect
Land-use
(albedo) only
Sulphate
N2OCH4
CO2
High
3
2
1
0
-1
-2
MediumMediumLow Very Low
Coo
ling
War
min
gR
adia
tive
forc
ing
(Wat
s pe
r squ
are
met
re)
Very Low
Very Low
Very Low
Very Low
Very Low
Very Low
Very Low
Level of Scientifi c Understanding
23
Clim
ate
Cha
nge
in th
e B
altic
Sea
Are
a –
HE
LCO
M T
hem
atic
Ass
essm
ent i
n 20
07
Global warming is expected to vary both geographically and seasonally. Continents are generally expected to warm more rapidly than the oceans, so that nearly all land areas are likely to warm faster than the global average. Particularly strong warming is projected for Northern Hemi-sphere high-latitude areas in winter, not only over land but even more over the Arctic Ocean, where the warming will be greatly amplifi ed by reduced sea ice.
There will likely be a slight increase in the globally averaged precipitation during the 21st century. Most models suggest a 1–2% increase in global precipitation for each 1°C increase in global mean temperature (Cubasch et al., 2001). However, precipitation changes will vary geographically even more than temperature. High-latitude areas are expected to experience a general increase in precipitation, particularly in winter, when increases are also likely in many mid-latitude areas.
Climate models and climate change scenariosClimate models are based on mathematical equations that describe the physical behaviour and evolution of the atmosphere and the ocean. Future climate can be projected and past climate can be hindcasted to a certain precision using these models. In addition to the internal processes of the models themselves, external factors infl uence the results of the model simulations. These include both natural (e.g., changes in incident solar radiation due to variations in the activity of the sun and volcanic eruptions) and anthropogenic forcing factors. Anthropogenic external forcings are unknown for future times, but they can be assessed using assumptions of different kinds of future human behaviour. The Intergovernmental Panel on Climate Change (IPCC) has developed qualitative assumptions for the future and deduced several quantitative future scenarios that have been published in the Special Report on Emissions Scenarios (SRES).
Emissions scenarios are plausible representa-tions of the future development of emissions of greenhouse gases and aerosol precursors, based on coherent and internally consistent sets of assumptions about demographic, socio-economic, and technological changes in the future. The SRES scenarios are built around four storylines, each based on differ-ent assumptions concerning the factors that might drive the development of human society during the 21st century. Two storylines (A1, A2) describe a world in which people strive after personal wealth rather than environmental quality, while in the other two (B1, B2) sustain-able development is pursued. Based on these storylines, a number of different emissions scenarios were constructed, six of which were used by the IPCC to illustrate potential future developments.
Climate models can be used to study and simulate the behaviour of the climate system. Results presented in this HELCOM report are mainly based on simulations made using coupled atmosphere-ocean general circula-tion models (technically AOGCMs, but often referred to simply as GCMs) and regional climate models (RCMs). GCMs are the most advanced tool for studying climate change on global and large regional scales; they simulate the three-dimensional temporal evolution of atmospheric and oceanic conditions based on physical laws. The horizontal resolution of these models when applied in the IPCC Third Assessment Report was about 300 km.
To simulate in more detail the climate of a specifi c area, such as the Baltic Sea basin, regional climate models (RCMs) are needed. These have a better horizontal resolution (usually 20–50 km) and permit a more detailed representation of the local physical geography, such as mountain ranges and land-sea distributions, as well as a more detailed representation of weather systems. RCMs need boundary conditions provided by a global climate model, both for several atmospheric variables at the horizontal bound-aries of the RCM domain (e.g., temperature, wind, and moisture) and for sea-surface tem-perature at the lower boundary. RCM results, including the simulated climate changes, depend strongly on the boundary conditions.
These models can provide future assessments of temperature, wind, precipitation, and other quantities, but not of the full infl uence of such changes. To estimate further infl uences, it is necessary to make use of impact models (e.g., hydrology models, crop models), which gener-ally run on a local scale and take the quantities provided by the climate models as input.
24
To obtain an estimate of the climate changes in the Baltic Sea basin in the 21st century, the BACC assessment reviewed results from three types of climate model experiments: 1) simula-tions from the second phase of the global Cou-pled Model Intercomparison Project (CMIP2); 2) global climate model (GCM) simulations based on the IPCC Special Report on Emis-sions Scenarios (SRES); and 3) regional climate model (RCM) simulations (see Box on Climate
model experiments). Some projections of future climate in the Baltic Sea basin from global and regional climate models will be provided here. It should be noted, however, that the results presented here are based on only a subset of the available GCMs and these, in turn, do not represent the full range of uncertainties regard-ing emissions scenarios, model uncertainties, or natural variability.
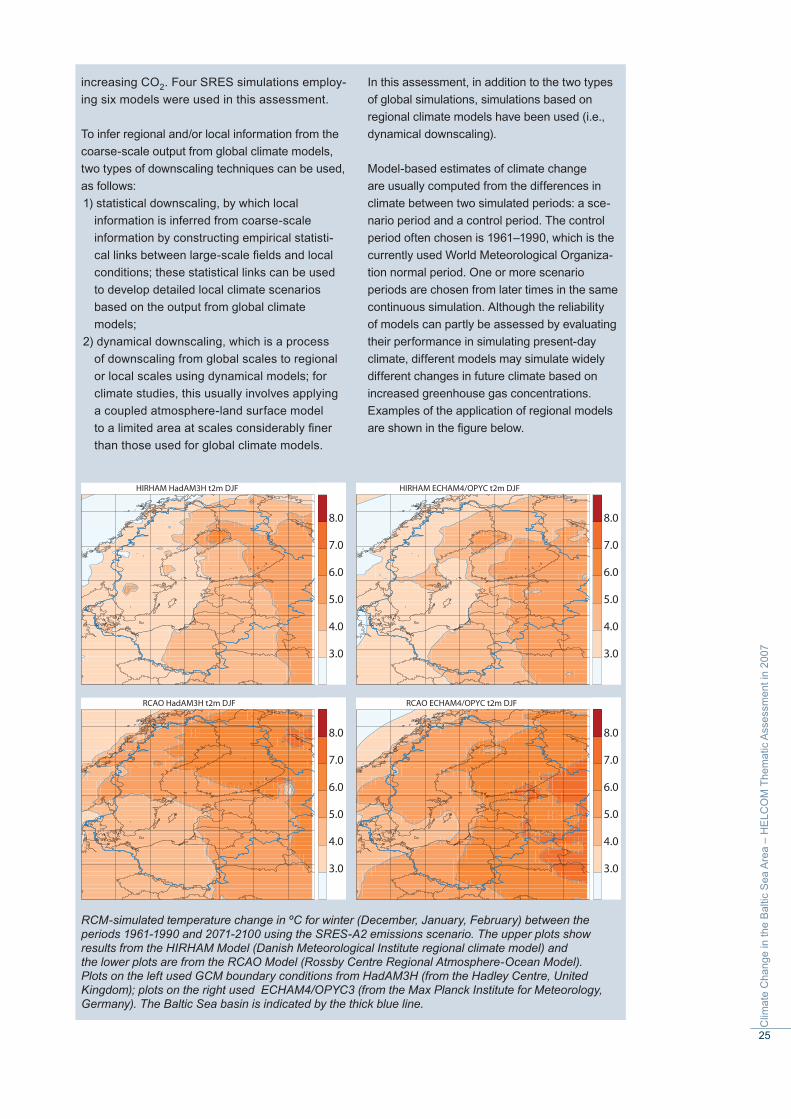
Climate model experimentsIn this assessment, the results of two global climate change experiments have been used: the CMIP2 experiments and experiments based on SRES forcing scenarios available from the IPCC Data Distribution Centre (see Box on Climate models and climate change scenarios for a description of the SRES scenarios). The second phase of the Coupled Model Intercom-
parison Project (CMIP2) is an intercomparison of standard idealized climate change experi-ments conducted with many climate models; CMIP2 results for twenty models were availa-ble for this assessment. Each model was used to make two 80-year simulations: a control simulation with constant CO2 concentrations (approximately present-day) and an increased greenhouse gas simulation with gradually
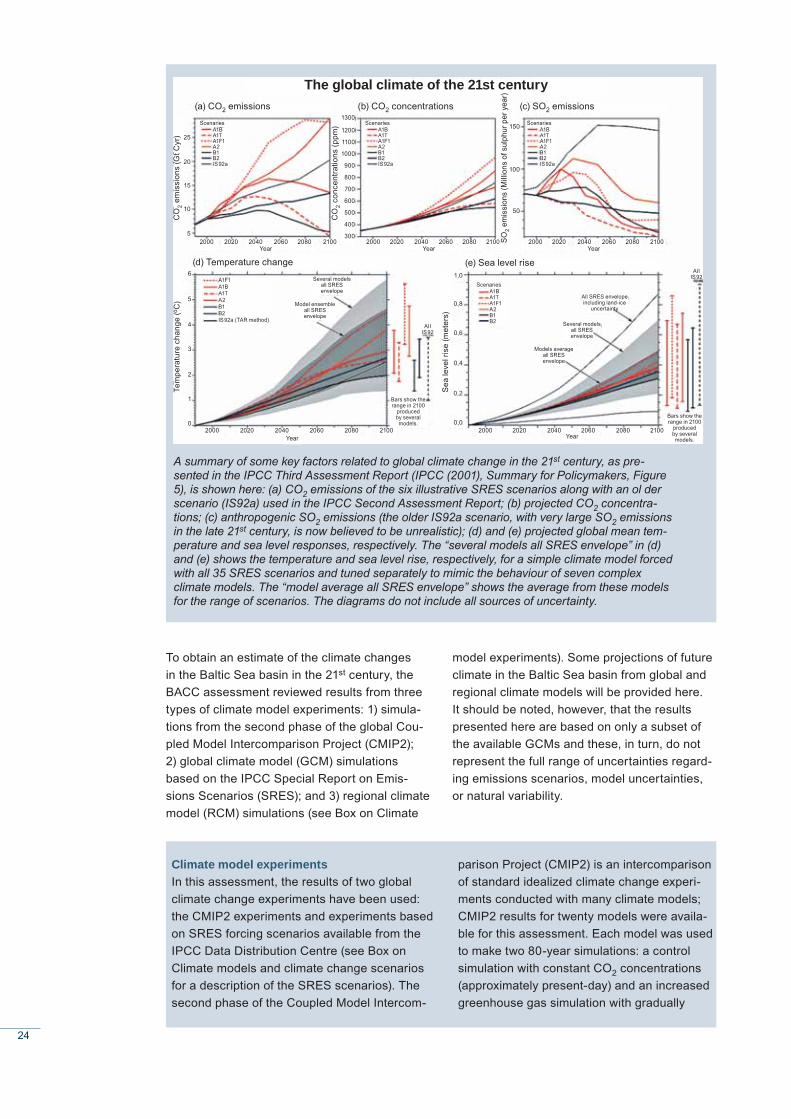
A summary of some key factors related to global climate change in the 21st century, as pre-sented in the IPCC Third Assessment Report (IPCC (2001), Summary for Policymakers, Figure 5), is shown here: (a) CO2 emissions of the six illustrative SRES scenarios along with an ol der scenario (IS92a) used in the IPCC Second Assessment Report; (b) projected CO2 concentra-tions; (c) anthropogenic SO2 emissions (the older IS92a scenario, with very large SO2 emissions in the late 21st century, is now believed to be unrealistic); (d) and (e) projected global mean tem-perature and sea level responses, respectively. The “several models all SRES envelope” in (d) and (e) shows the temperature and sea level rise, respectively, for a simple climate model forced with all 35 SRES scenarios and tuned separately to mimic the behaviour of seven complex climate models. The “model average all SRES envelope” shows the average from these models for the range of scenarios. The diagrams do not include all sources of uncertainty.
The global climate of the 21st century(a) CO2 emissions (b) CO2 concentrations (c) SO2 emissions
(d) Temperature change (e) Sea level rise1,0
0,8
0,6
0,4
0,2
0,0
150
100
50
1300
1200
1100
1000
900
800
700
600
500
400
300
25
20
15
10
5
6
5
3
2
1
0
4
2000 2020 2040 2060 2080 2100 2000 2020 2040 2060 2080 2000 2020 2040 2060 2080 2100
2000 2020 2040 2060 2080 2100
Bars show the range in 2100
produced by several models.
Bars show the range in 2100
produced by several models.
2000 2020 2040 2060 2080 2100Year Year
Year Year Year
AII IS 92
AII IS 92
Model ensemble all SRES envelope
Several models all SRES envelope A1B
A1TA1F1A2B1B2
ScenariesA1F1A1BA1TA2B1B2IS 92a (TAR method)
ScenariesScenariesA1BA1TA1F1A2B1B2IS 92a
Scenaries
Tem
pera
ture
cha
nge
(oC
)C
O2 e
mis
sion
s (G
t Cyr
)
Sea
leve
l ris
e (m
eter
s)
CO
2 con
cent
ratio
ns (p
pm)
Several models all SRES envelope
Models average all SRES envelope
All SRES envelope including land-ice
uncertainty
2100 SO2 e
mis
sion
s (M
illion
s of
sul
phur
per
yea
r)
A1BA1TA1F1A2B1B2IS 92a
A1BA1TA1F1A2B1B2IS 92a
25
Clim
ate
Cha
nge
in th
e B
altic
Sea
Are
a –
HE
LCO
M T
hem
atic
Ass
essm
ent i
n 20
07
increasing CO2. Four SRES simulations employ-ing six models were used in this assessment.
To infer regional and/or local information from the coarse-scale output from global climate models, two types of downscaling techniques can be used, as follows: 1) statistical downscaling, by which local
information is inferred from coarse-scale information by constructing empirical statisti-cal links between large-scale fi elds and local conditions; these statistical links can be used to develop detailed local climate scenarios based on the output from global climate models;
2) dynamical downscaling, which is a process of downscaling from global scales to regional or local scales using dynamical models; for climate studies, this usually involves applying a coupled atmosphere-land surface model to a limited area at scales considerably fi ner than those used for global climate models.
In this assessment, in addition to the two types of global simulations, simulations based on regional climate models have been used (i.e., dynamical downscaling).
Model-based estimates of climate change are usually computed from the differences in climate between two simulated periods: a sce-nario period and a control period. The control period often chosen is 1961–1990, which is the currently used World Meteorological Organiza-tion normal period. One or more scenario periods are chosen from later times in the same continuous simulation. Although the reliability of models can partly be assessed by evaluating their performance in simulating present-day climate, different models may simulate widely different changes in future climate based on increased greenhouse gas concentrations. Examples of the application of regional models are shown in the fi gure below.
RCM-simulated temperature change in ºC for winter (December, January, February) between the periods 1961-1990 and 2071-2100 using the SRES-A2 emissions scenario. The upper plots show results from the HIRHAM Model (Danish Meteorological Institute regional climate model) and the lower plots are from the RCAO Model (Rossby Centre Regional Atmosphere-Ocean Model). Plots on the left used GCM boundary conditions from HadAM3H (from the Hadley Centre, United Kingdom); plots on the right used ECHAM4/OPYC3 (from the Max Planck Institute for Meteorology, Germany). The Baltic Sea basin is indicated by the thick blue line.
HIRHAM HadAM3H t2m DJF
3.0
4.0
5.0
6.0
7.0
8.0
HIRHAM ECHAM4/OPYC t2m DJF
3.0
4.0
5.0
6.0
7.0
8.0
RCAO HadAM3H t2m DJF
3.0
4.0
5.0
6.0
7.0
8.0
RCAO ECHAM4/OPYC t2m DJF
3.0
4.0
5.0
6.0
7.0
8.0
26
5.2 Projections of future climate in the Baltic Sea basin5.2.1 Projections based on global climate modelsIn relation to global climate models (GCMs), the BACC report summarized the results of calcula-tions in which six GCMs were forced using four SRES scenarios (B1, B2, A2, and A1FI) for the Baltic Sea basin. As there is a distinct southwest to northeast gradient in the geographical distribu-tion of average model-simulated temperature change, results for both the Baltic Sea and its catchment area were reported according to southwestern and northeastern sub-regions (Figure 11).
As only six GCMs were analysed, statistical calculations were made to determine the prob-ability intervals for the changes in temperature and precipitation derived from the SRES-forced
simulations performed with the GCMs. The 95% probability intervals for temperature change for each season, region, and scenario are shown in Figure 12. The projected temperature change is positive in all cases. In winter and spring, the northeastern part of the Baltic Sea basin is pro-jected to warm more than the southwestern part, while in summer and autumn differences among regions are smaller. The probability intervals are quite broad, refl ecting the large scatter among the projections of the various models.
Figure 13 shows the 95% probability intervals for precipitation change. For most regions and sea-sons, the 95% probability intervals intersect the zero line; thus, in most cases it cannot be fi rmly established whether there will be an increase or a decrease in precipitation. The winter projections show a particularly wide range of magnitude from the models, although they generally point towards increased winter precipitation.
Figure 11. The four sub-regions employed for sum-marizing the probability intervals of tempera-ture and precipitation change.
27
Clim
ate
Cha
nge
in th
e B
altic
Sea
Are
a –
HE
LCO
M T
hem
atic
Ass
essm
ent i
n 20
07
Figure 12. Seasonal GCM-driven 95% probability intervals of temperature change in °K (vertical bars) from 1961–1990 to 2070–2099 for four sub-regions (defi ned in Figure 11), derived from SRES-forced simula-tions performed with six GCMs. Intervals are given separately for the A1FI (red), A2 (black), B2 (blue), and B1 (green) scenarios. The dot in the centre of the bar denotes the median of the interval.
Figure 13. Seasonal GCM-derived 95% probability inter-vals of precipitation change in percent. Intervals are given separately for the A1FI (red), A2 (black), B2 (blue), and B1 (green) scenarios. The dot in the centre of the bar denotes the median of the interval.
28
5.2.2 Projections based on regional climate models
Projected future changes in atmospheric conditions
A number of regional climate change projections covering the entire Baltic Sea basin have been performed. The European project PRUDENCE used ten different regional climate models to produce more than 25 experiments, the majority of which were based on a “common” global climate change experiment based on boundary conditions from the same GCM forced by the A2 SRES emissions scenario. Temperature and precipitation change results from PRUDENCE are shown for winter in Figure 14 and for summer in Figure 15.
These model results project an increase in near-surface air temperature for all regions of
the Baltic Sea basin. A common feature of these scenarios is a stronger increase in wintertime temperature compared to summertime tempera-ture in the northern and eastern sub-regions. Furthermore, snow and ice cover would retreat north and east, resulting in large changes in the Baltic Sea climate, particularly during the winter season. For example, the strong reduction in sea ice in the Bothnian Bay would lead to a sub-stantial increase in air temperature over the sea in this basin. The projected temperature change for summer shows a more pronounced warming in southern areas of the Baltic Sea basin than in the north.
The results shown in Figures 14 and 15 are identifi ed as either coming from the common PRUDENCE experiment (same GCM) or other experiments, which include different driving GCMs, different emissions scenarios, higher
1 2 3 4 5 6
10
20
30
40
50
60
Temperature change (K)
Prec
ipita
tion
chan
ge (
%) LAND/NE
1 2 3 4 5 6
10
20
30
40
50
60
Temperature change (K)
Prec
ipita
tion
chan
ge (
%) LAND/SW
1 2 3 4 5 6
10
20
30
40
50
60
Temperature change (K)
Prec
ipita
tion
chan
ge (
%) SEA/NE
1 2 3 4 5 6
10
20
30
40
50
60
Temperature change (K)
Prec
ipita
tion
chan
ge (
%) SEA/SW
Figure 14. Changes in winter (December, January, February) mean temperature and precipitation for the areas defi ned in Figure 11. The “O” symbol denotes seven RCMs from the common PRUDENCE experiment based on the same GCM (HadAM3H). The “X” symbol denotes other regional downscaling experiments from PRUDENCE, which included different driving GCMs, different emissions scenarios, higher horizon-tal resolution, and several ensemble members.
29
Clim
ate
Cha
nge
in th
e B
altic
Sea
Are
a –
HE
LCO
M T
hem
atic
Ass
essm
ent i
n 20
07
horizontal resolution, and several ensemble members. Looking at results from the common experiment, this illustrates the spread between the projections for area mean temperature and precipitation due specifi cally to differences in formulation of the regional climate models. The spread between the other experiments is even larger as it represents the estimation of additional uncertainties introduced by additional driving factors.
Although extreme temperatures (defi ned here as the 5th and 95th percentiles of daily air tem-peratures) are much more diffi cult to simulate than mean temperatures, regional climate models project an increase in daily maximum temperature during summer. The amount of this increase ranges from 3°C up to more than 10°C among different model simulations for the Baltic Sea basin by the late 21st century. Similarly,
extremely low temperatures during winter are simulated to increase by 4°C to 12°C, depending on the model.
In agreement with results from global model experiments, regional projections for winter pre-cipitation show increases over most of Europe. In projections for future summers, regional climate change simulations show increases in precipitation in the northern parts of the Baltic Sea basin and decreases in the southern parts. This results in only a small average change for the basin as a whole. Extreme precipitation events generally show an increase in winter, roughly in proportion to the increase in average precipitation.
In line with the changes in temperature, projec-tions show a future decrease in mean annual maximum snow depth everywhere over Northern
Figure 15. Changes in summer (June, July, August) mean temperature and precipitation for the areas defi ned in Figure 11. The “O” symbol denotes seven RCMs from the common PRUDENCE experiment based on the same GCM (HadAM3H). The “X” symbol denotes other regional downscaling experiments from PRUDENCE, which included different driving GCMs, different emissions scenarios, higher horizontal resolution, and several ensemble members. (Note that the common experiment is not shown for the sea areas due to unrealistically high Baltic Sea summer sea-surface temperatures in HadAM3H.)
1 2 3 4 5 6−40
−20
0
20
40
Temperature change (K)
Prec
ipita
tion
chan
ge (
%) LAND/NE
1 2 3 4 5 6−40
−20
0
20
40
Temperature change (K)
Prec
ipita
tion
chan
ge (
%) LAND/SW
1 2 3 4 5 6−40
−20
0
20
40
Temperature change (K)
Prec
ipita
tion
chan
ge (
%) SEA/NE
1 2 3 4 5 6−40
−20
0
20
40
Temperature change (K)
Prec
ipita
tion
chan
ge (
%) SEA/SW
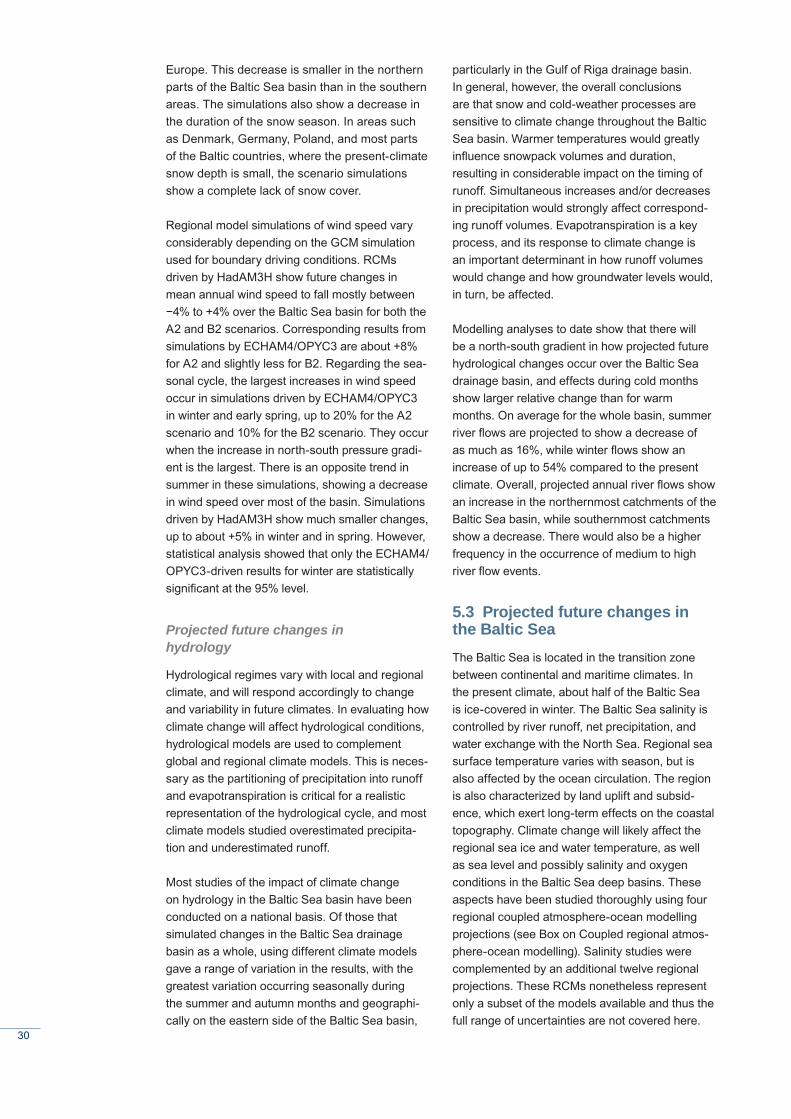
30
Europe. This decrease is smaller in the northern parts of the Baltic Sea basin than in the southern areas. The simulations also show a decrease in the duration of the snow season. In areas such as Denmark, Germany, Poland, and most parts of the Baltic countries, where the present-climate snow depth is small, the scenario simulations show a complete lack of snow cover.
Regional model simulations of wind speed vary considerably depending on the GCM simulation used for boundary driving conditions. RCMs driven by HadAM3H show future changes in mean annual wind speed to fall mostly between −4% to +4% over the Baltic Sea basin for both the A2 and B2 scenarios. Corresponding results from simulations by ECHAM4/OPYC3 are about +8% for A2 and slightly less for B2. Regarding the sea-sonal cycle, the largest increases in wind speed occur in simulations driven by ECHAM4/OPYC3 in winter and early spring, up to 20% for the A2 scenario and 10% for the B2 scenario. They occur when the increase in north-south pressure gradi-ent is the largest. There is an opposite trend in summer in these simulations, showing a decrease in wind speed over most of the basin. Simulations driven by HadAM3H show much smaller changes, up to about +5% in winter and in spring. However, statistical analysis showed that only the ECHAM4/OPYC3-driven results for winter are statistically signifi cant at the 95% level.
Projected future changes in hydrology
Hydrological regimes vary with local and regional climate, and will respond accordingly to change and variability in future climates. In evaluating how climate change will affect hydrological conditions, hydrological models are used to complement global and regional climate models. This is neces-sary as the partitioning of precipitation into runoff and evapotranspiration is critical for a realistic representation of the hydrological cycle, and most climate models studied overestimated precipita-tion and underestimated runoff.
Most studies of the impact of climate change on hydrology in the Baltic Sea basin have been conducted on a national basis. Of those that simulated changes in the Baltic Sea drainage basin as a whole, using different climate models gave a range of variation in the results, with the greatest variation occurring seasonally during the summer and autumn months and geographi-cally on the eastern side of the Baltic Sea basin,
particularly in the Gulf of Riga drainage basin. In general, however, the overall conclusions are that snow and cold-weather processes are sensitive to climate change throughout the Baltic Sea basin. Warmer temperatures would greatly infl uence snowpack volumes and duration, resulting in considerable impact on the timing of runoff. Simultaneous increases and/or decreases in precipitation would strongly affect correspond-ing runoff volumes. Evapotranspiration is a key process, and its response to climate change is an important determinant in how runoff volumes would change and how groundwater levels would, in turn, be affected.
Modelling analyses to date show that there will be a north-south gradient in how projected future hydrological changes occur over the Baltic Sea drainage basin, and effects during cold months show larger relative change than for warm months. On average for the whole basin, summer river fl ows are projected to show a decrease of as much as 16%, while winter fl ows show an increase of up to 54% compared to the present climate. Overall, projected annual river fl ows show an increase in the northernmost catchments of the Baltic Sea basin, while southernmost catchments show a decrease. There would also be a higher frequency in the occurrence of medium to high river fl ow events.
5.3 Projected future changes in the Baltic SeaThe Baltic Sea is located in the transition zone between continental and maritime climates. In the present climate, about half of the Baltic Sea is ice-covered in winter. The Baltic Sea salinity is controlled by river runoff, net precipitation, and water exchange with the North Sea. Regional sea surface temperature varies with season, but is also affected by the ocean circulation. The region is also characterized by land uplift and subsid-ence, which exert long-term effects on the coastal topography. Climate change will likely affect the regional sea ice and water temperature, as well as sea level and possibly salinity and oxygen conditions in the Baltic Sea deep basins. These aspects have been studied thoroughly using four regional coupled atmosphere-ocean modelling projections (see Box on Coupled regional atmos-phere-ocean modelling). Salinity studies were complemented by an additional twelve regional projections. These RCMs nonetheless represent only a subset of the models available and thus the full range of uncertainties are not covered here.
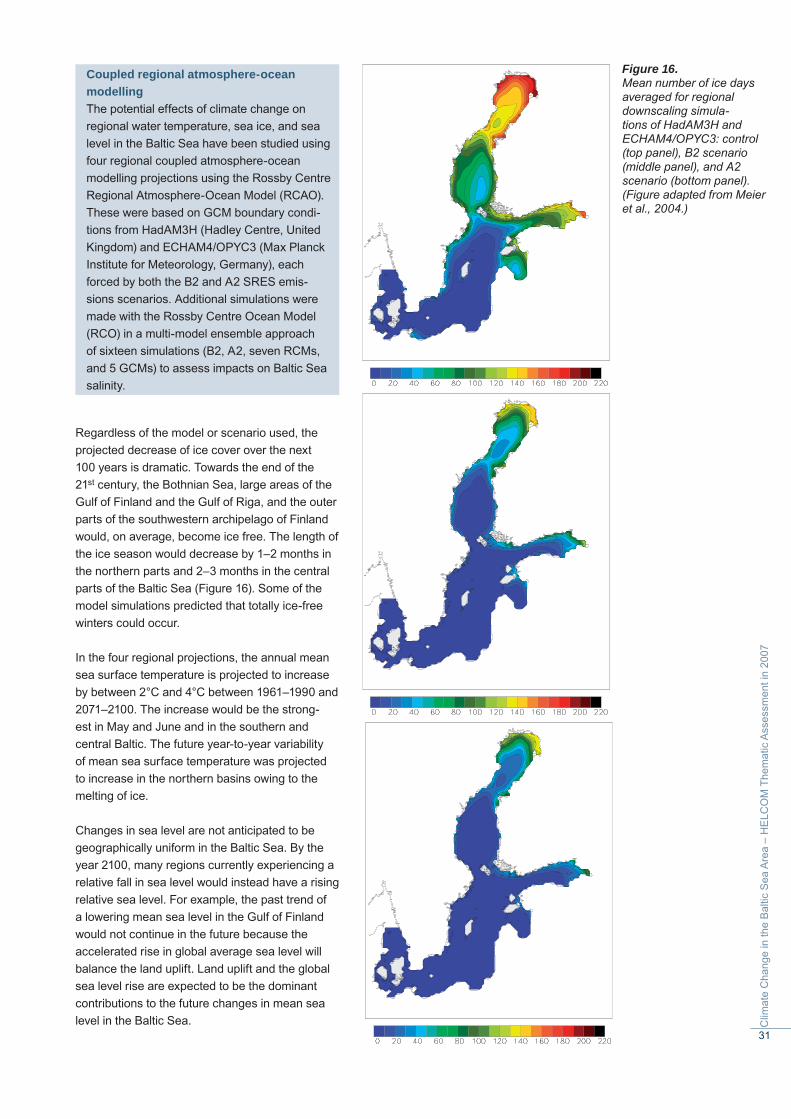
31
Clim
ate
Cha
nge
in th
e B
altic
Sea
Are
a –
HE
LCO
M T
hem
atic
Ass
essm
ent i
n 20
07
Coupled regional atmosphere-ocean modellingThe potential effects of climate change on regional water temperature, sea ice, and sea level in the Baltic Sea have been studied using four regional coupled atmosphere-ocean modelling projections using the Rossby Centre Regional Atmosphere-Ocean Model (RCAO). These were based on GCM boundary condi-tions from HadAM3H (Hadley Centre, United Kingdom) and ECHAM4/OPYC3 (Max Planck Institute for Meteorology, Germany), each forced by both the B2 and A2 SRES emis-sions scenarios. Additional simulations were made with the Rossby Centre Ocean Model (RCO) in a multi-model ensemble approach of sixteen simulations (B2, A2, seven RCMs, and 5 GCMs) to assess impacts on Baltic Sea salinity.
Regardless of the model or scenario used, the projected decrease of ice cover over the next 100 years is dramatic. Towards the end of the 21st century, the Bothnian Sea, large areas of the Gulf of Finland and the Gulf of Riga, and the outer parts of the southwestern archipelago of Finland would, on average, become ice free. The length of the ice season would decrease by 1–2 months in the northern parts and 2–3 months in the central parts of the Baltic Sea (Figure 16). Some of the model simulations predicted that totally ice-free winters could occur.
In the four regional projections, the annual mean sea surface temperature is projected to increase by between 2°C and 4°C between 1961–1990 and 2071–2100. The increase would be the strong-est in May and June and in the southern and central Baltic. The future year-to-year variability of mean sea surface temperature was projected to increase in the northern basins owing to the melting of ice.
Changes in sea level are not anticipated to be geographically uniform in the Baltic Sea. By the year 2100, many regions currently experiencing a relative fall in sea level would instead have a rising relative sea level. For example, the past trend of a lowering mean sea level in the Gulf of Finland would not continue in the future because the accelerated rise in global average sea level will balance the land uplift. Land uplift and the global sea level rise are expected to be the dominant contributions to the future changes in mean sea level in the Baltic Sea.
Figure 16. Mean number of ice days averaged for regional downscaling simula-tions of HadAM3H and ECHAM4/OPYC3: control (top panel), B2 scenario (middle panel), and A2 scenario (bottom panel). (Figure adapted from Meier et al., 2004.)
32
Regional wind changes in the Baltic Sea may have an additional impact on sea level surge heights. In two out of four regional scenario simulations, extreme sea levels are projected to increase signifi cantly more than the mean sea level. The combination of high sea levels induced by storm surges, ice-free seas, and unfrozen sedi-ments would enhance erosion and the transport of sediments.
Using sixteen regional scenario simulations, the average salinity changes for the Baltic Sea are projected to vary between −45% and +4%. The largest positive change is not statistically signifi cant. In the projection with the largest nega-tive change, sea surface salinity in the Bornholm Basin is as low as that in the northern Bothnian Sea in the present climate and the Belt Sea front is shifted northward. However, a pronounced halocline would still be expected to remain and separate the upper and lower layers in the Baltic Proper, limiting the impact of direct wind-induced mixing to the surface layer. Although salinity in the entire Baltic might be signifi cantly lower at the end of the 21st century, stability and deep-water ventilation would very likely change only slightly. Changes in salinity would have large impacts on species distribution, food webs, and life histories of the species living in the Baltic Sea.
5.4 Summary of future climate change projections for the Baltic Sea BasinProjected future warming in the Baltic Sea basin generally exceeds the global mean warming in GCM (global climate model) simulations. Looking at the annual mean from an ensemble of twenty GCM simulations, regional warming over the Baltic Sea basin would be about 50% higher than global mean warming. In the northern areas of the basin, the largest warming is generally simulated in winter; further south the seasonal cycle of warming is less clear. However, the rela-tive uncertainty in the regional warming is larger than that in the global mean warming. Taking the northern areas of the basin as an example, the warming from the late 20th century to the late 21st century could range from as low as 1°C in summer (lowest scenario for summer) to as high as 10°C in winter (highest scenario for winter). The simulated warming would generally be accompanied by an increase in precipitation in the Baltic Sea basin, except in the southernmost areas in summer. However, the uncertainty for precipitation change is larger than that for
temperature change, and the coarse resolution of GCMs does not resolve small-scale variations of precipitation change that are induced by the regional topography and land cover.
A more geographically detailed assessment of future anthropogenic climate change in the Baltic Sea basin requires the use of statistical or dynamical downscaling methods. However, as only a limited number of GCM simulations have been downscaled by RCMs (regional climate models) or statistical downscaling methods, the range of results derived from those downscaling experiments does not fully refl ect the range of uncertainties in the GCM projections. Accepting this, the range of results from available downscal-ing studies is presented below, as it gives an indication of plausible future changes. All values refer to changes projected for the late 21st cen-tury, represented here as differences in climate between the years 1961–1990 and 2071-2100. All references to “northern” and “southern” areas of the Baltic Sea basin are defi ned by the sub-regions shown in Figure 11.
Consistent with GCM studies, all available downscaling studies also indicate increases in temperature during all seasons for every sub-region of the Baltic Sea basin. Combined results show a projected warming of the mean annual temperature in the order of 3ºC to 5ºC for the total basin. Seasonally, the largest part of this warming would occur in the northern areas of the Baltic Sea basin during winter months and in the southern areas of the Baltic Sea basin during summer months. Corresponding changes in temperatures would be 4ºC to 6ºC in winter and 3ºC to 5ºC in summer, as estimated from a matrix of regional climate model experiments. As noted above, these ranges most probably underestimate the real uncertainty. The diurnal temperature range – the difference between daily maximum and minimum temperature – would also decrease, most strongly in autumn and winter months. Such levels of warming would lead to a lengthening of the growing season, defi ned here as the continu-ous period when daily mean temperature exceeds 5ºC. An example from one RCM indicates that the growing season length could increase by as much as 20 days to 50 days for northern areas and 30 days to 90 days for southern areas by the late 21st century. The range depends on which of the different emissions scenarios is used.
Projected changes in precipitation from downs-caling studies also depend both on differences
33
Clim
ate
Cha
nge
in th
e B
altic
Sea
Are
a –
HE
LCO
M T
hem
atic
Ass
essm
ent i
n 20
07
in greenhouse gas emissions scenarios and differences between climate models. Moreover, precipitation results are more sensitive than temperature results to the statistical uncertainty in determining climatological means from a limited number of simulated years, particularly at regional scales. Seasonally, winters are projected to become wetter in most of the Baltic Sea basin and summers to become drier in southern areas for many scenarios. Northern areas could generally expect winter precipitation increases of about 25% to 75%, while the projected summer changes lie between −5% and 35%. Southern areas could expect increases ranging from about 20% to 70% during winter, while summer changes would be negative, showing decreases of as much as 45%. Taken together, these changes lead to a projected increase in annual precipitation for the entire basin. In broad terms, these results are consist-ent with GCM studies of precipitation change, although the projected summer decrease in the southern areas of the basin tends to be larger and to extend further north in the available RCM stud-ies than in most reported GCMs. This difference refl ects the fact that the few GCM simulations that have been downscaled by RCMs also show this pattern of precipitation change.
Projected changes in wind differ widely between various climate models. Differences in the circulation patterns of the driving GCMs are particularly important for the modelled outcome of this variable. From the RCM results presented here, only those driven by the ECHAM4/OPYC3 GCM show statistically signifi cant changes for projected future climate scenarios. For mean daily wind speed over land areas, this would amount to a mean increase of about 8% on an annual basis and a maximum mean seasonal increase of up to 12% during winter. The corresponding mean sea-sonal increase over the Baltic Sea in winter, when the decrease in ice cover enhances near-surface winds, would be up to 18%. For RCMs driven by the HadAM3H GCM, the changes are small and not statistically signifi cant. Modelled changes in extreme wind generally follow the same pattern as that for the mean wind; however, the spatial reso-lution of both GCMs and RCMs is far too coarse to accurately represent the fi ne scales of extreme wind. As the downscaled projections differ widely, there is no robust signal seen in the RCM results. Looking at projected changes in large-scale atmospheric circulation from numerous GCMs, they indicate that an increase in windiness for the Baltic Sea basin would be somewhat more likely than a decrease. However, the magnitude of
such a change is still highly uncertain and it may take a long time before greenhouse gas-induced changes in windiness emerge, if ever, from background natural variability. It can be noted, moreover, that ECHAM4/OPYC3 is one of the GCMs that gives higher values of change in large-scale wind.
Hydrological studies show that increases in mean annual river fl ow from the northernmost catch-ments would occur together with decreases in the southernmost catchments. Seasonally, summer river fl ows would tend to decrease, while winter fl ows would tend to increase, by as much as 50%. The southernmost catchments would be affected by the combination of both decreased summer precipitation and increased evapotranspiration. Oceanographic studies show that mean annual sea surface temperatures could increase by about 2°C to 4ºC by the end of the 21st century. Ice extent in the sea would then decrease by about 50% to 80%. The average salinity of the Baltic Sea is projected to change between −45% and +4%. However, it should be noted that, with the exception of salinity, these oceanographic fi ndings are based on only four regional scenario simulations using two emissions scenarios and two global models.
34
Since the formation of the Baltic Sea after the last ice age, changes in climate have had a strong impact on the Baltic Sea. In addition to natural cycles and long-term developments in the Baltic marine ecosystem, human activities have caused substantial changes. It is useful to distinguish between human-mediated (anthropogenic) changes caused by activities more or less directly affecting the Baltic marine environment and those occurring indirectly as a result of climate change. Climate-induced changes in marine ecosystems include changes in nutrient cycling and contami-nant distribution and changes at all trophic levels from bacteria to seabirds and marine mammals.
In the discussion below, the general results of the climate change projections presented in previous sections are considered in relation to the Baltic marine ecosystem. Long-term projections of potential impacts on the Baltic marine ecosystem similar to those prepared for climate change in the Baltic Sea basin have not yet been made; however, based on evidence obtained from long-term data series and well-known responses of marine organ-isms to changes in their environment, information is provided on the potential impacts of climate change on the various groups of biota in the Baltic marine ecosystem and their interactions.
6.1 Projected changes in the physical and chemical conditions in the Baltic Sea
6.1.1 Nutrient inputs
Nutrients and light are essential for the growth of marine plants, including phytoplankton, at the base of the marine food chain. However, human activities contribute important additional sources of nutrients via river runoff (from agriculture, managed forestry, and point sources), direct inputs (from municipal discharge, industry, and fi sh farming), and atmospheric deposition (from agriculture and fuel combustion, including traf-fi c). These anthropogenic sources have led to increased fl uxes of nutrients in the Baltic Sea, i.e., eutrophication. Eutrophication may cause reduced water transparency, increased primary production of phytoplankton, and changes in the planktonic species composition. When phytoplankton are
not consumed by zooplankton, either owing to the timing or the large size of the bloom or to a change in phytoplankton species, the phytoplank-ton ultimately sink in the water column to bottom waters and the seabed, where the organic matter decomposes through bacterial action, releasing the remineralized nutrients nitrogen and phospho-rus and consuming oxygen. In areas with reduced water renewal, this process can cause a decrease in the oxygen content of the bottom waters and seabed, and ultimately result in a situation with a complete lack of oxygen (anoxia), and even in the production of hydrogen sulfi de. Anoxic conditions are found in the deep basins of the Baltic Sea, resulting in benthic deserts and lower portions of the water column devoid of fauna.
Runoff is the leading environmental variable determining land-sea fl uxes of dissolved constitu-ents. Atmospheric deposition is also a signifi cant source of input of the nutrients nitrogen oxide, ammonia, and, to a much lesser extent, phospho-rus into the Baltic Sea.
In terms of the impact of climate change on nutri-ent inputs to the Baltic Sea, the most important effects of climate change are expected through changes in the timing of seasonal and annual events (spring runoff, autumn low fl ow, ice and snow cover formation, etc.), the frequency and severity of extreme events (fl oods, droughts, erosion), thresholds and ranges. Changes to the climate in the Baltic Sea drainage basin would not only affect the total amount of freshwater fl owing into the sea, but also the distribution of the origin and nutrient content of these fl ows. It is projected that, overall, there will be a moderate increase in the total mean annual river fl ow to the Baltic Sea, but with a general trend of reduced river fl ows from agriculture-dominated southern and conti-nental areas of the Baltic Sea basin and increased river fl ows from largely forested northern catch-ments. Over the next century, estimates indicate that runoff may increase by up to 15% averaged over the entire Baltic Sea catchment and between 10% and 40% for the catchments of the Bothnian Bay, Bothnian Sea, and the Gulf of Finland. Cal-culations have shown that water runoff explains between 71% and 97% of the variability in nutrient and carbon land-sea fl uxes in the Baltic Sea.
6. Climate-related Change in the Baltic Marine Environment
35
Clim
ate
Cha
nge
in th
e B
altic
Sea
Are
a –
HE
LCO
M T
hem
atic
Ass
essm
ent i
n 20
07
The most prominent effect of global warming with respect to watershed exports of matter is therefore likely to be a signifi cant increase in the inputs of dissolved constituents such as nutrients (nitrogen, phosphorus, silicon), as well as total organic and inorganic carbon, from catchments experiencing enhanced precipitation.
Climate change projections show that snow packs will decrease and snow melt will occur earlier with climate warming. Owing to less snow pack, the shorter duration of snow cover, and frequent melting periods, the peak fl ow and fl oods in early spring would be less intense in the eastern part of the Baltic. Base fl ow of the rivers, typical for summer, would be reached earlier and would last until autumn, when a signifi cant increase of river runoff would occur owing to greater precipitation. The southern part of the Baltic may become more vulnerable to rainstorms and fl ood events, which would have a severe effect on agricultural activities in former fl oodplain areas, as well as on nutrient losses.
In the central and northern parts of the Baltic Sea drainage basin, agricultural catchments currently show a clear annual course of nutrient runoff, with moderate losses in winter, a peak in early spring, high nutrient losses even in autumn, and the lowest nutrient runoff in summer. The highest year-to-year variability of nutrient losses is associated with autumn, while variability is also high in late winter and spring. Under climate change, the variability of nutrient losses is expected to increase mainly in winter and spring when the duration of frozen surfaces, amount of snowpack water, occurrence of strong night frost events, and number of soil freeze-thaw cycles are changing. Shorter periods of frozen surface and increased numbers of soil freeze-thaw cycles would lead to more intensive leaching during winter in arable land, especially in northern areas.
It is diffi cult to predict the balance between the above-mentioned counteractive forcings in their effects on total and regional nutrient export rates to the Baltic Sea and there is currently no overall scientifi c consensus on the infl uence of climate change on nutrient inputs to the Baltic.
Climate change can also be expected to result in changes in the mixing and distribution of nutrients in the Baltic Sea. With climate change, higher than normal air and water temperatures during wintertime would have consequences if the water temperature stays above the temperature of maxi-
mum water density. In such a case in late winter, the normal deep convection in brackish water does not occur and a smaller amount of nutrients is trans-ported into the euphotic zone from deeper waters.
6.1.2 Chemical contaminants
Human activities have resulted in the emission and discharge of a number of chemical contaminants, often referred to as hazardous substances, into the environment. These include natural substances for which environmental concentrations have increased owing to human activities, such as poly-cyclic aromatic hydrocarbons (PAHs) and heavy metals including lead, mercury, cadmium, and copper. The largest number and variety of hazard-ous substances are synthetic organic chemicals, either produced intentionally for specifi c industrial or agricultural purposes or arising as by-products from combustion or industrial processes. In the Baltic Sea, hazardous substances of importance include dioxins, TBT, nonylphenolethoxylates (NP/NPE), brominated fl ame retardants (polybrominated diphenylethers (PBDEs)), PCBs, short-chained chlorinated paraffi ns (SCCP), and certain musk xylenes. Many of these substances are persistent and accumulate in the Baltic marine environment, particularly in the sediments where they can remain for very long periods. These substances also accumulate in the food web, transferring up the food chain to higher predators, in which they may accumulate to levels affecting the health of the organisms, for example, through impacts on hormone or immune systems or on reproduction. Hazardous substances enter the Baltic Sea via direct discharges from land-based sources (e.g., industrial and municipal wastes), river runoff or drainage, atmospheric deposition from local and more distant sources, and from ships.
The Baltic Sea appears to be particularly sensitive to persistent toxic substances owing to its physical characteristics, including the long residence time of the water, and the fact that many of the species are not originally adapted to this brackish water environment. Most of them live at the edge of their physiological tolerance range in terms of salinity and many of them are cold-adapted organisms. Differences among species concerning their ther-mal tolerance limits and in their capacities to adjust these limits may determine how populations are affected by climate change.
A systematic change in the hydrographic conditions due to a change towards warmer temperatures and reduced salinity can be expected to have a direct
36
impact on the distribution and acclimation capac-ity of native biota, as well as on the bioavailability and effects of contaminants. The combination of higher temperatures and lower salinities could reduce the general fi tness of native marine spe-cies. Invertebrates such as blue mussels clearly respond to changes in temperature or salinity, for example, in terms of metabolic rates and enzyme activities. The projected change in abiotic factors may also have an infl uence on the processes involved in the metabolism of toxic substances: higher temperatures result in increased turn-over rates or generally higher metabolic rates. Higher temperatures and/or lower salinity could affect the species’ ability to deal with toxic substances and the different physiological regulation proc-esses involved in the detoxifi cation of hazardous substances.
In addition, the bioavailability of specifi c con-taminants (particularly metals) is greatly affected by salinity. Numerous studies have shown an increasing metal uptake by diverse aquatic organ-isms at reduced salinities. Thus, altered prevailing abiotic conditions would also impact the extent of exposure of organisms to toxic substances in different areas of the Baltic Sea. The predicted changes in the hydrographic conditions would also affect resuspension processes of sediment-bound chemical contaminants.
In light of the complex hydrographic conditions in the Baltic Sea, chemical pollution must be seen as an additional factor acting upon the Baltic ecosystem. There is still little understanding of how multiple stressors (e.g., salinity, tempera-ture, and chemical contaminants) in combination may affect marine ecosystems and their biota. It will be a further challenge to estimate how projected future changes in key abiotic factors (temperature, salinity) due to climate change will impact Baltic biota. More experimental studies and modelling efforts are needed to test various scenarios of transport and cycling of chemical contaminants and to assess counteracting effects on important Baltic species, the impact on their well-being and fi tness, and potential impacts on entire populations.
6.2 Potential climate-related changes in the Baltic marine ecosystemIn terms of interannual variability, the most important drivers of the biological system of the Baltic Sea are the North Atlantic Oscillation (NAO)
and major Baltic infl ows of salt water from the North Sea. Decadal-scale trends in hydrographic, chemical, and biological conditions in the Baltic Sea are considered to be climatic regimes. It has been shown that winter season anomalies in the air temperature over central England are controlled by hemispheric processes, especially on the decadal scale, and they are very informative about long-lasting hydrographic conditions in the Baltic Sea. In general, higher air temperatures over Western Europe are accompanied by increasing fi lling levels of the Baltic Proper due to enhanced precipitation in the Baltic catchment area as a consequence of the dominating mild mode of the winter NAO.
In general, the state of the Baltic Sea ecosystem strictly depends on the frequency of infl ow events interrupting multi-year lasting periods of stagnation in deep-water hydrographic conditions. The deep water of the Baltic Proper occupies layers deeper than 130 m and contains about 5% of its overall volume; its residence time mainly exceeds three years owing to the sporadic nature of deep-water renewal. There is some observational evidence that the response of the Baltic hydrography to long-term changes of external forcing conditions is largest and most rapid in the deepest parts of deep basins, where mixing processes between deep and intermediate layers infl uence the state of the whole Baltic ecosystem on interannual time scales.
Changes in water temperature, water balance, circulation, and salinity associated with climate change can be expected to have impacts on the biological processes and biota in the Baltic Sea, affecting the species that live in the Baltic Sea, their distribution, and their interaction. Information is provided below on possible impacts of the climate changes projected above on several groups of biota based on evidence from long-term observations and the known responses of marine organisms to changes in their environment.
6.2.1 Bacteria
Heterotrophic bacteria are a natural component of all aquatic ecosystems and play a substantial role in biogeochemical processes in both the pelagic and benthic environments. Key aspects of the carbon and nitrogen cycles, such as anaerobic fermenta-tion of organic carbon and fi xation of atmospheric nitrogen, are carried out solely by bacteria.
Pelagic bacteria primarily rely on dissolved organic matter, and constitute the basis of a microbial-based food web. In the Baltic, the intra-annual
37
Clim
ate
Cha
nge
in th
e B
altic
Sea
Are
a –
HE
LCO
M T
hem
atic
Ass
essm
ent i
n 20
07
variation in growth of pelagic bacteria has been shown to be due to the combined effects of temperature, the quality of organic substrate, and competition. Pelagic bacteria are grazed by nanoplanktonic fl agellates and apparently are also controlled by viruses infesting bacteria and causing cell lysis.
The biogeochemical cycle of inorganic nitrogen (mainly nitrate and ammonia) consists of a complex array of processes which are mediated primarily by bacteria. Organic nitrogen is mineral-ized to ammonia (ammonifi cation), which in turn is oxidized to nitrate (nitrifi cation) and, depending on oxygen conditions, nitrate may be denitrifi ed to nitrogen gas. These processes mainly take place in sediments.
Under anoxic conditions, some species of bacteria use sulfate as an electron acceptor to utilize organic compounds. The product of this respiration is the highly soluble and toxic hydro-gen sulfi de (H2S). Sulfate reduction occurs widely in anaerobic sediments in the Baltic. Various aerobic or anaerobic autotrophic bacteria can in turn utilize H2S as an energy source and under oxic conditions H2S is oxidized to sulfate. These bacteria-mediated processes are to a large extent controlled by the availability of oxygen, which in turn is determined by the balance between oxygen demand and the physical transport proc-esses (e.g., major Baltic saltwater infl ows) and vertical mixing that deliver oxygen to the bottom water.
Oxygen demand below the pycnocline (layer of rapid change in water density with depth), including in the sediments, is regulated by the magnitude of sedimentation of organic particles that originate from primary production. Hence, changes in pelagic primary production, e.g., owing to variations in light or nutrient availability, invariably will result in changes in the sedimenta-tion rate and, thus, oxygen demand below the pycnocline.
In terms of the potential impact of climate change, an increase in temperature stimulates the meta-bolic processes of bacteria, provided that other factors such as substrate or oxygen are not limit-ing. As bacteria play prominent roles in aquatic ecosystems, small changes in temperature can have disproportionately larger implications in the functioning of marine systems, and ultimately also global consequences for the carbon cycle. Stud-ies have shown that the activity of pelagic bacteria
is stimulated more than phytoplankton primary production under temperature increases, owing to the differences in the temperature-dependence of respiration and photosynthesis. A greater activity of bacteria would increase recycling and minerali-zation in surface waters, so that the sedimentation of organic matter may decrease. However, given the potential impacts of other climate-related fac-tors such as changes in nutrient runoff and verti-cal mixing, it is not possible at this stage to predict the overall effects on the activity of bacteria in the Baltic Sea.
6.2.2 Phytoplankton
Phytoplankton constitute the base of the pelagic food web and also serve as food for benthic organisms. Changes in phytoplankton composi-tion and biomass are, therefore, of decisive importance for the whole ecosystem. The detection of these changes is not simple because phytoplankton are subject to high natural variabil-ity in time and space. Changes in phytoplankton biomass and species composition not only refl ect the effects of eutrophication but also of climatic change and these effects cannot easily be sepa-rated. The most important physical and chemical factors, infl uenced by climatic change and affect-ing phytoplankton growth, are discussed below.
Nutrient availability is one of the most important factors for phytoplankton growth. The nutrient conditions are, however, not only dependent on anthropogenic inputs but also on climatic infl u-ences, i.e., rainfall and river runoff. Internal proc-esses such as remineralization also infl uence the availability of nutrients for phytoplankton growth. Under the typical anoxic conditions in the bottom water of the deep basins, phosphorus is liberated from the sediment. Silicate is also released, whereas nitrate is largely denitrifi ed in anoxic sediments. Convective and diffusive processes transport the nutrients into the upper water layers where they promote phytoplankton growth. Spo-radic infl ows of saline North Sea water replenish the oxygen in the deep water layers of the Baltic Sea, leading to sequestration of phosphorus in the sediment and thus counteracting eutrophication.
Light is decisive for photosynthesis. Low light intensities limit algal growth, for example, during the night, during winter, and at greater water depths. Temperature has only little direct effect on algal growth. Phytoplankton grow to high bio-masses at temperatures a little above the water melting point, but are inhibited if the temperature
38
exceeds the natural range. However, individual species have typical temperature preferences; for example, cyanobacteria form strong blooms only in water above 16°C. Therefore, signifi cant global warming may change the species composition.
The indirect effect of temperature via its infl uence on the water stratifi cation is also important. Some algae grow better under stable stratifi cation and others in a mixed water column. Deep convective mixing in autumn and spring is of decisive impor-tance for nutrient circulation. It is only possible if the water temperature falls below the temperature of its greatest density, which occurs during cold winters. In mild winters, a complete convective circulation does not occur and the warming of the water in spring leads immediately to a stratifi ca-tion without a spring turnover. This is detrimental to species that experience better growth in turbulent water.
Recent trends in phytoplankton have shown that the large spring blooms of diatoms, which occurred regularly until 1988/1989, have failed to appear since then, except for the cold winter of 1996. This may be due to the lack of convective mixing after mild winters, preventing resuspension of diatom spores. In contrast, the proportion of dinofl agellates, which prefer stable water col-umns, has increased since 1989.
The most impressive bloom phenomena in the Baltic Proper are the buoyant surface blooms of diazotrophic cyanobacteria (Nodularia spumigena, Aphanizomenon sp., Anabaena spp.). They are of special interest because some of them are poten-tially toxic and their ability to fi x nitrogen increases the total input of nitrogen and thus enhances eutrophication. Climatic factors may have a greater impact on cyanobacteria bloom variability than eutrophication. Strong blooms have been found to form only if water temperatures exceeded 16°C, provided that there was bright sunshine and low wind speed. Wind conditions may also have high relevance for the ratio of Nodularia (toxic) to Aphanizomenon (non-toxic) in the blooms, as storms may terminate Nodularia blooms whereas Aphanizomenon is less affected.
Projected climate change would have a major impact on phytoplankton biomass and species composition. Warming would directly inhibit cold-water species (mostly spring-blooming diatoms) but enhance warm-water species, such as the bloom-forming toxic cyanobacterium Nodularia spumigena. New species originating from warmer
seas may become established and displace native species. Reduced ice cover and earlier stabiliza-tion of the water column in spring would cause the spring bloom to begin earlier, infl uencing food supply for zooplankton and, thus, the entire food web. Stronger vertical stratifi cation of the water column would reduce vertical transport processes (e.g., exchange of nutrients and dissolved gases, upward transport of cysts/spores, sedimentation, and vertical migration of plankton). Cyanobacteria may benefi t from this situation.
Stronger freshwater infl ow into the northern Baltic and reduced salt water infl ow from the North Sea could displace the permanent halocline to greater depths. This could result in a larger area of oxic sediments (at 70–100 m depths in the central Baltic basins), expanding not only the colonization area for macrofauna but also the area of the vital seedbeds for phytoplankton. Full circulation of the water column in winter would be possible not only in coastal areas and the Gulf of Riga, but also at the slopes of the basins. Phosphorus and silicate would be bound in these oxic sediments, whereas nitrogen would largely be liberated as nitrate. This internal eutrophication may lead to increased nitrogen:silicate and nitrogen:phosphate ratios, which would diminish diatoms and nitrogen-fi xing cyanobacteria.
The possible reduction in salinity projected in some of the simulations would also have a direct infl uence on the species composition. Distribu-tions of both freshwater and marine species are likely to follow changes in the salinity, although it is not possible at present to provide detailed projections of future salinity ranges.
As phytoplankton biomass and species composi-tion are infl uenced by different mechanisms, their reaction will depend on the overwhelming climatic impact factor. This can be temporally and spatially different. Changes in the timing of the blooms and in species composition would also disturb the existing food web, inducing changes at the higher trophic levels.
6.2.3 Zooplankton
In the Baltic Sea, salinity, eutrophication, tempera-ture, and planktivory by pelagic fi sh are consid-ered to have an infl uence on long-term changes in zooplankton abundance. The zooplankton com-munity may be divided into two arbitrary groups: cladocerans, smaller copepods, and rotifers – the “surface community”– representing the “microbial
39
Clim
ate
Cha
nge
in th
e B
altic
Sea
Are
a –
HE
LCO
M T
hem
atic
Ass
essm
ent i
n 20
07
loop”, which is often considered as a functional alternative to the “grazing chain”, represented by the large marine copepods in the Baltic Sea, which live in deeper waters in this area owing to the salin-ity gradient. The difference in function is that the microbial loop rapidly regenerates nutrients in the stratifi ed surface layer, with cyanobacteria impor-tant as primary producers, and the food chains end with, e.g., jellyfi sh, while in the grazing chain the copepods bring nutrients from the primary producers, diatoms, in a non-stratifi ed environment toward pelagic fi sh and other top predators.
The effect of climate through salinity is straightfor-ward, but the relative importance of this and other contributing factors is complicated by the various adaptations of different species of zooplankton. In the Baltic Sea, salinity controls biodiversity and species composition. For example, the distribution of marine copepod species towards the north in the Baltic Sea is clearly related to the salinity. A southward retreat of the marine species distribution is expected as a consequence of the projected decrease in Baltic Sea salinity under climate change. Furthermore, owing to a decrease in salinity, the distribution of mesozooplankton will change not only horizontally, but also vertically, with marine species exhibiting brackish-water submergence following the increase of salinity with depth. Vertical differences between species and developmental stages will modify the effects of salinity and temperature, and will be highly spe-cies-dependent.
Climate-mediated temperature changes are expected to affect the growth and reproduction of zooplankton, with the expected effects of increased temperature likely to be seen in both wintertime survival and summertime growth and reproduction of zooplankton. Temperature is of greater importance to the “surface community” of smaller crustaceans, rotifers, and cladocerans than to the marine, deeper-living copepods such as Pseudocalanus acuspes that are more affected by salinity. Thus, it can be projected that increased warm periods with high surface water stability and low salinity during summer will increase the importance of smaller mesozooplankton such as cladocerans, rotifers, and Acartia spp. copepods in the pelagic food web. In winter, the higher temperature will affect the survival of overwintering copepods, as cladocerans and rotifers overwinter as resting stages in the sediment.
Recent studies have shown an infl uence of climatic factors on zooplankton in the Baltic Sea. For
example, time-series studies of zooplankton in the Gulf of Finland have shown a close association between zooplankton abundance and herring growth in relation to changes in salinity and fresh-water runoff. Alterations of climatic periods are refl ected, via changes in the basic environmental conditions, in the whole pelagic food chain and ecosystem in the Gulf of Finland. A model has also been prepared of a chain of events from the North Atlantic Oscillation (NAO) to changes in freshwater runoff and salinity, and eventually to several species of mesozooplankton in the whole Baltic Proper, demonstrating a clear cause-and-effect relationship between climatic factors, changes in the Baltic Sea hydrography, and ultimately a biological outcome in the mesozooplankton.
The role of biological regulation in the long-term variation of the Baltic Sea plankton-based food chain has been considered both in terms of “bottom-up” factors affecting productivity and through “top-down” selective predation. As a bottom-up factor, the increased primary production could hypothetically be expected to enhance the production of zooplankton, and some evidence for this has been found for certain mesozooplankton species in some areas of the Baltic Sea. As a top-down factor, the extensive changes in the number of pelagic predatory fi sh in the Baltic Sea could also contribute to changes in zooplankton composition. In the Baltic Sea, the planktivorous fi sh herring and sprat could theoretically be expected to have an effect on the abundance of their favoured prey species, particularly Pseudoca-lanus and Temora, respectively, for which they are selective predators. The impact of salinity-induced fl uctuations on crustacean mesozooplankton spe-cies composition and especially species of marine copepods such as Pseudocalanus and Temora lies in their importance as food for fi sh. Marine copepods are not only the most preferred food of Baltic herring and sprat, but also contain the most energy. Thus, shifts in the abundances of these copepod species, driven by salinity changes, are the most important factors affecting the growth and condition of the most important commercial fi sh stocks in the Baltic. Indeed, the quality of avail-able food, i.e., crustacean mesozooplankton, has consistently been shown to be the most important factor in clupeid (herring and sprat) growth and condition in the Baltic Sea.
6.2.4 Benthos
Salinity has a strong impact on species distribution and, therefore, on the structure and composition
40
of benthic communities in the Baltic Sea. Many marine species reach their limit of distribution along the salinity gradient on the way from the entrance to the Baltic Sea towards its inner less-saline parts. In addition, due to strong stratifi cation of the water column and changes with depth in dissolved oxygen concentrations, there is also a pronounced vertical benthic zonation in the Baltic Sea. The shallow part of the sea with well-oxygen-ated water is comparatively rich in macrofauna, while the deeper anoxic part below the halocline represents a “benthic desert”. In the upper, well-ventilated benthic zones above the halocline, there has been a large increase in the macrofauna biomass in relation to the fi rst quarter of the 20th century. On the other hand, the deep basins of the Baltic Sea are frequently exposed to hypoxia (low-oxygen conditions) and anoxia (lack of oxygen) that result in periodic extinction of the bottom fauna.
In the inner parts of the Baltic Sea, benthic func-tional groups are often represented by a single species. The disappearance of such a key spe-cies would result in the loss of a functional group which, in turn, may change the biogeochemical cycling of the system, affecting the release of nutrients, microbial life, and the bioturbation activity of macrofauna. One example is the previously very abundant species, the polychaete worm Scoloplos armiger, which vanished at lower depths from the central and northern areas of the Baltic Proper during the 1970s and 1980s owing to the gradual decline in salinity, oxygen depletion, and enlargement of zones of hydrogen sulfi de. In recent decades, S. armiger was the only infaunal species in the large hypoxic areas below the halocline in the central and northern parts of the Baltic Proper that was able to perform bioturba-tion of the sediments; the disappearance of this species has resulted in the formation of laminated sediments in these areas.
Climate change-mediated alterations in hydro-graphic conditions, e.g., warmer temperatures and decreases in salinity, will have a direct impact on the distribution pattern of many native species of benthos and, thus, on their functional role. Such hydrographic changes may also facili-tate a successful settlement of non-native, more thermotolerant species that can adapt to the lower salinities in various parts of the Baltic Sea, potentially affecting ecosystem functioning.
6.2.5 Fish
In the Baltic Sea, the fi sh community has much fewer species than other marine areas primarily owing to the low salinity, which imposes a physi-ological stress both on marine species as well as on freshwater species inhabiting coastal areas. This small number of species is refl ected in the commercial fi sheries catches, which are domi-nated by sprat, herring, and cod, although smaller catches are obtained of fl ounder, plaice, salmon, and eel, as well as of nearshore species such as whitefi sh, pikeperch, and smelt.
Fishing represents the most direct human impact on the ecosystem of the Baltic Sea; fi shing is the dominant source of mortality for adults of the most abundant species and causes a number of direct and indirect effects on the target populations, as well as impacting their predators and prey. Biomass levels of many Baltic cod and salmon populations have fallen to levels that may not be sustainable owing to high fi shing mortalities over many years. If the Eastern Baltic cod population were to collapse, recovery would be very slow or possibly impossible as this population is geneti-cally distinct from other cod populations in the Atlantic and physiologically adapted for reproduc-tion in the low-salinity easterly areas of the Baltic Sea. Cod immigrating to the Eastern Baltic from more saline areas (e.g., the Belt Sea or Kattegat) are not adapted to reproduce in these brackish conditions.
Although climate change has been shown to affect various Baltic fi sh populations, including fl atfi sh, migratory and coastal fi sh species, and glacial relict species, this discussion will concen-trate on the effect of climate variability on recruit-ment of Eastern Baltic cod and sprat and the growth of herring and sprat. Climate variability can affect animals both directly through physiology and indirectly through changes in their biological environment.
During the past two decades, the cod stock has declined from a historic high (in the early 1980s) to its lowest levels on record (at the beginning of the 1990s), while the sprat stock increased to historic levels during the 1990s (Figure 17). This development resulted from: 1) a high fi shing pres-sure on cod and a relatively low fi shing pressure on sprat; 2) the released predation pressure on sprat after the decline of the predatory cod stock; and 3) poor reproductive success of cod, with good reproductive success of sprat. Both cod
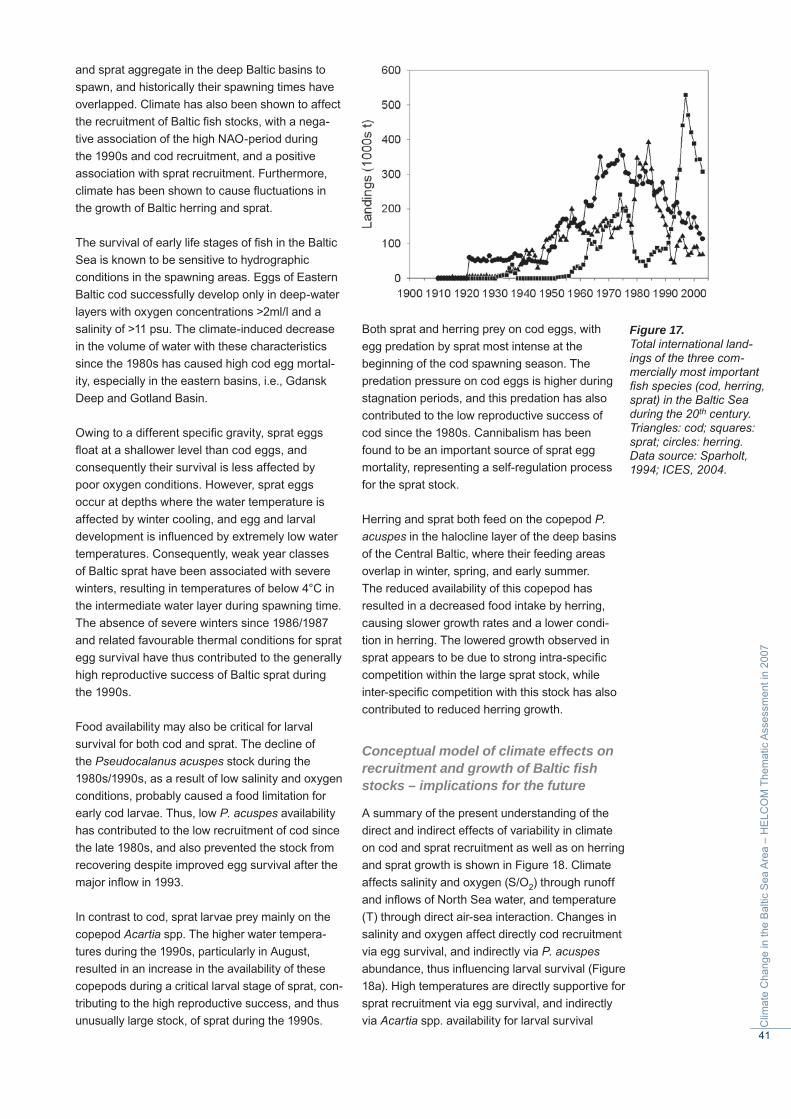
41
Clim
ate
Cha
nge
in th
e B
altic
Sea
Are
a –
HE
LCO
M T
hem
atic
Ass
essm
ent i
n 20
07
and sprat aggregate in the deep Baltic basins to spawn, and historically their spawning times have overlapped. Climate has also been shown to affect the recruitment of Baltic fi sh stocks, with a nega-tive association of the high NAO-period during the 1990s and cod recruitment, and a positive association with sprat recruitment. Furthermore, climate has been shown to cause fl uctuations in the growth of Baltic herring and sprat.
The survival of early life stages of fi sh in the Baltic Sea is known to be sensitive to hydrographic conditions in the spawning areas. Eggs of Eastern Baltic cod successfully develop only in deep-water layers with oxygen concentrations >2ml/l and a salinity of >11 psu. The climate-induced decrease in the volume of water with these characteristics since the 1980s has caused high cod egg mortal-ity, especially in the eastern basins, i.e., Gdansk Deep and Gotland Basin.
Owing to a different specifi c gravity, sprat eggs fl oat at a shallower level than cod eggs, and consequently their survival is less affected by poor oxygen conditions. However, sprat eggs occur at depths where the water temperature is affected by winter cooling, and egg and larval development is infl uenced by extremely low water temperatures. Consequently, weak year classes of Baltic sprat have been associated with severe winters, resulting in temperatures of below 4°C in the intermediate water layer during spawning time. The absence of severe winters since 1986/1987 and related favourable thermal conditions for sprat egg survival have thus contributed to the generally high reproductive success of Baltic sprat during the 1990s.
Food availability may also be critical for larval survival for both cod and sprat. The decline of the Pseudocalanus acuspes stock during the 1980s/1990s, as a result of low salinity and oxygen conditions, probably caused a food limitation for early cod larvae. Thus, low P. acuspes availability has contributed to the low recruitment of cod since the late 1980s, and also prevented the stock from recovering despite improved egg survival after the major infl ow in 1993.
In contrast to cod, sprat larvae prey mainly on the copepod Acartia spp. The higher water tempera-tures during the 1990s, particularly in August, resulted in an increase in the availability of these copepods during a critical larval stage of sprat, con-tributing to the high reproductive success, and thus unusually large stock, of sprat during the 1990s.
Both sprat and herring prey on cod eggs, with egg predation by sprat most intense at the beginning of the cod spawning season. The predation pressure on cod eggs is higher during stagnation periods, and this predation has also contributed to the low reproductive success of cod since the 1980s. Cannibalism has been found to be an important source of sprat egg mortality, representing a self-regulation process for the sprat stock.
Herring and sprat both feed on the copepod P. acuspes in the halocline layer of the deep basins of the Central Baltic, where their feeding areas overlap in winter, spring, and early summer. The reduced availability of this copepod has resulted in a decreased food intake by herring, causing slower growth rates and a lower condi-tion in herring. The lowered growth observed in sprat appears to be due to strong intra-specifi c competition within the large sprat stock, while inter-specifi c competition with this stock has also contributed to reduced herring growth.
Conceptual model of climate effects on recruitment and growth of Baltic fi sh stocks – implications for the future
A summary of the present understanding of the direct and indirect effects of variability in climate on cod and sprat recruitment as well as on herring and sprat growth is shown in Figure 18. Climate affects salinity and oxygen (S/O2) through runoff and infl ows of North Sea water, and temperature (T) through direct air-sea interaction. Changes in salinity and oxygen affect directly cod recruitment via egg survival, and indirectly via P. acuspes abundance, thus infl uencing larval survival (Figure 18a). High temperatures are directly supportive for sprat recruitment via egg survival, and indirectly via Acartia spp. availability for larval survival
Figure 17. Total international land-ings of the three com-mercially most important fi sh species (cod, herring, sprat) in the Baltic Sea during the 20th century. Triangles: cod; squares: sprat; circles: herring. Data source: Sparholt, 1994; ICES, 2004.
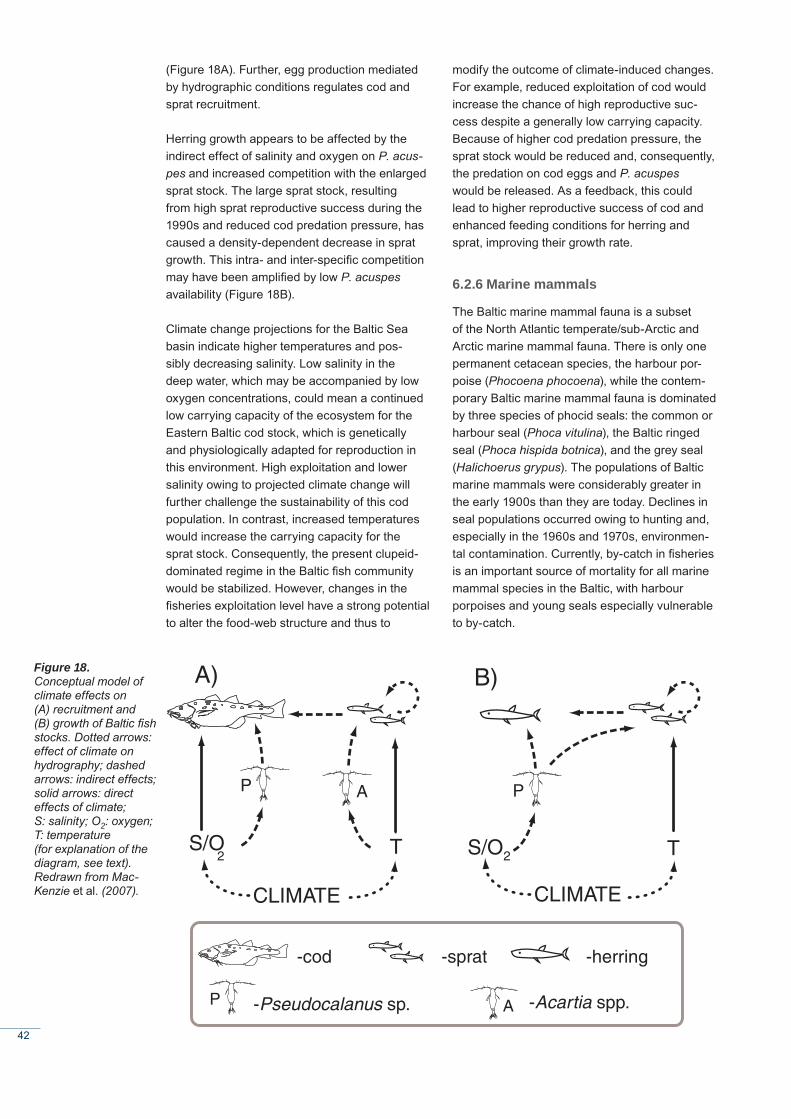
42
(Figure 18A). Further, egg production mediated by hydrographic conditions regulates cod and sprat recruitment.
Herring growth appears to be affected by the indirect effect of salinity and oxygen on P. acus-pes and increased competition with the enlarged sprat stock. The large sprat stock, resulting from high sprat reproductive success during the 1990s and reduced cod predation pressure, has caused a density-dependent decrease in sprat growth. This intra- and inter-specifi c competition may have been amplifi ed by low P. acuspes availability (Figure 18B).
Climate change projections for the Baltic Sea basin indicate higher temperatures and pos-sibly decreasing salinity. Low salinity in the deep water, which may be accompanied by low oxygen concentrations, could mean a continued low carrying capacity of the ecosystem for the Eastern Baltic cod stock, which is genetically and physiologically adapted for reproduction in this environment. High exploitation and lower salinity owing to projected climate change will further challenge the sustainability of this cod population. In contrast, increased temperatures would increase the carrying capacity for the sprat stock. Consequently, the present clupeid-dominated regime in the Baltic fi sh community would be stabilized. However, changes in the fi sheries exploitation level have a strong potential to alter the food-web structure and thus to
modify the outcome of climate-induced changes. For example, reduced exploitation of cod would increase the chance of high reproductive suc-cess despite a generally low carrying capacity. Because of higher cod predation pressure, the sprat stock would be reduced and, consequently, the predation on cod eggs and P. acuspes would be released. As a feedback, this could lead to higher reproductive success of cod and enhanced feeding conditions for herring and sprat, improving their growth rate.
6.2.6 Marine mammals
The Baltic marine mammal fauna is a subset of the North Atlantic temperate/sub-Arctic and Arctic marine mammal fauna. There is only one permanent cetacean species, the harbour por-poise (Phocoena phocoena), while the contem-porary Baltic marine mammal fauna is dominated by three species of phocid seals: the common or harbour seal (Phoca vitulina), the Baltic ringed seal (Phoca hispida botnica), and the grey seal (Halichoerus grypus). The populations of Baltic marine mammals were considerably greater in the early 1900s than they are today. Declines in seal populations occurred owing to hunting and, especially in the 1960s and 1970s, environmen-tal contamination. Currently, by-catch in fi sheries is an important source of mortality for all marine mammal species in the Baltic, with harbour porpoises and young seals especially vulnerable to by-catch.
S/O2
CLIMATE
T
P A
S/O2
CLIMATE
T
P
A) B)
-cod
P A
-sprat -herring
-Pseudocalanus sp. -Acartia spp.
Figure 18. Conceptual model of climate effects on (A) recruitment and (B) growth of Baltic fi sh stocks. Dotted arrows: effect of climate on hydrography; dashed arrows: indirect effects; solid arrows: direct effects of climate; S: salinity; O2: oxygen; T: temperature (for explanation of the diagram, see text). Redrawn from Mac-Kenzie et al. (2007).
43
Clim
ate
Cha
nge
in th
e B
altic
Sea
Are
a –
HE
LCO
M T
hem
atic
Ass
essm
ent i
n 20
07
The study of climatic effects on marine mammal populations is complicated, as the response of populations to climate is in part determined by the food web structure and, thus, effects can be conveyed, e.g., via food shortages. In addition, the possibility to project impacts is limited by inadequate knowledge of seal and porpoise population structures and the minimum ice requirements of ringed seals in the Baltic.
The current estimate of the Baltic ringed seal hauled-out population is 5500 animals. Ringed seals occur mainly in the northern and eastern parts of the Baltic Sea, where they have three distinct breeding sub-populations: one each in the Gulf of Finland, the Gulf of Riga, and the Bothnian Bay, as well as a probable small breed-ing population in the Archipelago Sea. Ringed seals are able to live in fast-ice areas; for pupping they require ridged or consolidated pack ice, and it is important that snow accumulates to allow them to construct lairs under the snow on top of the ice. The lair serves to hide adults and pups from predators and provides thermal protection for the pups. If there is not enough snow for lair formation, pups are born openly on the ice, which potentially affects their survival. In the Baltic Sea, pups are born in February and March, and they are suckled for 5–7 weeks.
In terms of the possible consequence of climate change for ringed seal breeding habitat in the Baltic Sea, the most important parameter is the length of the ice season. Models of the duration of the ice cover in the four ringed seal breeding areas have been developed using two global models and two IPCC scenarios. The results show that the ice cover is expected to be drasti-cally reduced in the breeding areas, with a future (2071–2100) scenario ensemble mean of only 18–48 ice days for the southern breeding areas. In the northernmost part of the Bothnian Bay, the mean number of scenario ice-days would be 123 or about four months and, therefore, would still exceed the present ice cover duration of the southern breeding areas. Thus, the extent of occurrence and area of occupancy of the ringed seal is likely to decline and to shift northwards, with the possible eradication of the ringed seal breeding populations of the Gulf of Finland, the Gulf of Riga, and the Archipelago Sea. The pro-jected changes in distribution are so large that the Baltic sub-species of ringed seal may meet the IUCN criteria of threatened species.
The grey seal is currently the most abundant seal species in the Baltic Sea, with a hauled-out popu-lation of about 21 000. Baltic grey seals seem to form an isolated population, and their distribution is concentrated in the middle and northern parts of the sea, with most of the population north of 58 °N. The preferred ice-breeding habitat of the grey seal is drift ice in the eastern, central, and northern Baltic, but they also breed on land, par-ticularly on islets and skerries in the northern part of the Gulf of Riga, the Stockholm Archipelago, and southwestern Finland. Nonetheless, land seems to be a sub-optimal breeding habitat for Baltic grey seals. Pup mortality is considerably higher for land-breeding than for ice-breeding seals, and pups born on land show a signifi cantly lower mean weight at weaning, which is associ-ated with lower fi rst-year survival.
Regarding possible consequences of climate change, although the Baltic population of grey seals has a clear potential for a shift to land breeding, it is not possible to know how this may affect the abundance and distribution of the species. There are indications of increased pup morality for land-breeding grey seals, and possi-bly the locally limited number of suitable breeding skerries might induce density-dependent pup mortality. On the other hand, climate change may potentially result in a substantial increase in the winter foraging distribution of grey seals, as they may be able to forage in coastal and other areas now covered with fast ice in the current climate.
Harbour seals have a southern distribution in the Baltic Sea. The northernmost population is currently situated in Kalmar Sound, between the island of Öland and mainland Sweden. Harbour seals breed on land. While grey and ringed seals have their pups in the winter, harbour seal pups are born during the summer half of the year. Suf-fi ciently high water temperatures are important for harbour seal pups, and may be one of the most important factors affecting pupping time, and pup growth and survival.
The projected increases in sea level and wind waves might have an impact on the haul-out and breeding distribution of grey seals and harbour seals in the southern and middle parts of the Baltic, where sea level rise is not compensated by isostatic rebound. Even quite small changes in sea level might render many of the haul-out and breeding sites unsuitable as they are typically very low skerries and reefs.
44
Harbour porpoises are relatively common in the Kattegat and Danish Straits, but the population in the inner Baltic may be as low as 600 animals or less. Harbour porpoise young are born in the summer half of the year. The cause of the decline in the Baltic harbour porpoise population is not known, but if it is due to severe ice winters, then the projected changes in the annual ice extent due to climate warming could be favourable for this species.
In summary, potential impacts on Baltic seals of long-term trends linked to climate change in the Baltic Sea region are most likely largely associ-ated with the projected decline of sea-ice extent and the reduced length of the ice season, which will particularly affect ringed and grey seals. On the other hand, the projected increase in surface water temperature might have relevance for harbour seals and harbour porpoises. The inner Baltic populations of harbour seals and harbour porpoises are very small and their range has declined over the course of the past century. The projected reduction of ice cover and elevated water temperatures may potentially be favourable for these species, but it is not possible to know whether they are likely to extend their range as factors other than climate are of governing impor-tance for these threatened populations.
6.2.7 Seabirds
Anthropogenic climate changes may infl uence Baltic bird populations by introducing changes in: • Distribution ranges during the breeding and
non-breeding seasons;• Abundances during the breeding and non-
breeding seasons;• Traits;• Migratory routes and stopover sites;• Timing of spring and autumn migration;• Migratory tendency within species and popula-
tions.
Direct infl uences of climate variability on Baltic bird populations vary among terrestrial birds, water birds, and seabirds as well as between breeding and wintering bird fauna. Direct infl u-ences on breeding bird populations are generally of limited signifi cance compared to indirect infl u-ences. The direct infl uences of climate variability on breeding bird populations include reduced availability of food supplies as well as abnormal development of embryos or increased mortality of chicks owing to changes in temperature. The fi rst of these infl uences impacts on the survival
rate, while the remaining infl uences impact on the birds’ breeding success.
Global warming processes are likely to directly affect migrating and wintering birds in the Baltic. Extreme winter temperatures have long been documented to infl uence waterbird mortality in the Baltic Sea, and winter conditions in the Baltic Sea basin are known to determine the range of terrestrial birds as well as of waterbirds. Although the migratory and wintering bird fauna of the Baltic Sea represents a wide range of groups and eco-types, the large populations (more than 10 million) of wintering waterbirds are probably the most susceptible component of the Baltic bird fauna to changes in winter conditions. Documented trends in the winter distribution of wintering waterbirds suggest a close relationship between waterbird winter populations and winter climate. Trends in the number of wintering birds among coastal species such as mute swan (Cygnus olor), tufted duck (Aythya fuligula), goldeneye (Bucephala clangula), and goosander (Mergus merganser) between 1987 and 2002 show a large-scale shift in the distribution of the core population of these waterbird species from south to north.
This translocation of the core of the winter distri-bution of the approximately 10 million waterbirds - most of which are benthic herbivores and carnivores - in the Baltic currently occurring would affect the stocks of their prime food resources. This shift to a more northerly waterbird distribution may have already altered the stocks of benthic vegetation in the coastal zone as well as the bivalve stocks in coastal and offshore areas of the northern Baltic Sea. On the other hand, owing to decreases in salinity, bivalve stocks may shift southward, affecting food resources for these waterbirds. Under climate change, this southward shift of bivalves could be enhanced by warmer water temperatures.
Although alterations in the populations of seabirds as a direct result of winter climate variability have been suggested, seabirds are less likely to be affected by variations in the temperature regime of the Baltic Sea due to their wide thermoneutral zone. This wide thermoneutral zone enables seabirds such as auks (Alcidae) to be able to make deep dives into cold waters to exploit food resources there. In addition, by remaining in contact with seawater, seabirds may avoid the effects of extremes of very hot or very cold air temperatures.
45
Clim
ate
Cha
nge
in th
e B
altic
Sea
Are
a –
HE
LCO
M T
hem
atic
Ass
essm
ent i
n 20
07
Indirect infl uences on bird population sizes may be of signifi cance both for the breeding and non-breeding components of the Baltic terrestrial and marine bird fauna. Indirect effects work through the food chain, where even subtle changes in food supply or available habitat may cause food limitation for birds. Accordingly, even if current climate changes may not affect breeding bird population sizes directly at the level of biogeo-graphical populations, they may still be able to alter both the breeding success and survival rates signifi cantly via effects on the birds’ prey. Effects on breeding success are mainly related to the same climatic factors as the timing of breeding, which is associated with prevailing tem-perature. Prey alterations as a result of climatic variability constitute a well-known factor control-ling the breeding success of seabirds; this link has been documented in several areas outside the Baltic Sea area. The same prey alterations that affect breeding success also may affect the survival rate of adult fi sh-eating birds, as shown in several areas in the North Atlantic.
Many pelagic seabirds show a great affi nity to areas of strong stratifi cation and stable frontal processes. Changes in the stability of foraging areas for seabirds in the Baltic as a result of increased precipitation and runoff may alter the possibilities for diving seabirds to fi nd prey. The impact of changes in stratifi cation and water
column structure in the Baltic Sea, which may be induced by global warming, on feeding conditions for seabirds could be both positive (enhanced sta-bility) and negative (deepening of the pycnocline).
Since 1990, the spring migration of birds has begun earlier in areas where winter/spring climates have become warmer, but there is a large variability between and within species. The breeding times of birds have also shifted earlier in many, but not all, cases. Although the implications of these shifts are not clear, they are species-dependent and may be of greater benefi t to short-distance migrants than to long-distance migrants.
In terms of the overall impact of future climate change on bird populations in the Baltic Sea, a comparison with bird species in pre-historical warm periods of the Baltic indicates that nearly all of the species currently breeding in the Baltic were already there 9000–5000 years before present. Thus, no major species turnover may be expected, but the population sizes, regional distribution patterns, and community structures are likely to change. These characteristics are also affected by many other factors, particularly anthropogenic, and there is currently a lack of appropriate data to be able to thoroughly evaluate the relative changes that are likely as a result of climate change.
46
7. Concluding Remarks
The climate of the Baltic Sea basin is characterized by large seasonal contrasts, owing to its geographi-cal location, variable topography, and land-sea contrasts. The climate is infl uenced by major air pressure systems, particularly the North Atlantic Oscillation during wintertime, which affect the atmospheric circulation and precipitation in the Baltic Sea basin. In addition to the natural variability in climate, global warming has been observed during the past century, with the largest contribution to this global warming arising from increased greenhouse gas concentrations. This is especially the case for the past few decades when the increase in green-house gas concentrations has been the most rapid.
The warming trend for the entire globe was about 0.05°C/decade from 1861–2000, while the trend for the Baltic Sea basin has been somewhat larger, 0.08°C/decade. This warming trend has been refl ected in a decrease in the number of very cold days during winter as well as a decrease in the duration of the ice cover and its thickness in many rivers and lakes, particularly in the eastern and southeastern Baltic Sea basin. In the Baltic Sea, there has also been a general tendency toward milder sea-ice conditions during the past century. In addition, an increasing length of the growing season in the Baltic Sea basin has been observed during this period.
The projections for future climate change in the Baltic Sea basin described in this report, with all of their caveats and uncertainties, indicate that atmos-pheric temperatures will continue to warm during the course of the 21st century. In association with this warming there would be changes in precipita-tion patterns, both geographically and seasonally, which would affect the runoff into the Baltic Sea. In some of the regional scenario simulations, the average salinity of the Baltic Sea is projected to decrease. The mean sea surface temperature is projected to increase, resulting in a marked decrease of ice extent in the sea during winter.
The projected increase in the temperature of the upper water layer of the Baltic Sea could result in a decrease in spring convective mixing, thus affect-ing the circulation and distribution of nutrients in the photic zone. A change in runoff could result in a change in the input of nutrients from the catchment
area. These changes can have an infl uence on phytoplankton species composition and primary production, which are of great importance for the Baltic ecosystem. The increase in water tempera-ture may also increase bacterial activity, which can affect nutrient recycling and mineralization in surface waters.
The potential decrease in salinity projected in some of the simulations would have a clear infl uence on the composition and distribution of species in the Baltic Sea, particularly for plankton and zoobenthos. The zooplankton species com-position, in turn, has an infl uence on their preda-tors, planktivorous fi sh such as herring and sprat, affecting their growth and condition. A potential decrease in salinity could also increase the area of oxic sediments and thus increase the area available for zoobenthos colonization.
These changes, particularly increasing water tem-perature, could also be expected to result in the invasion of new species from other regions of the world, including exotic species from warmer sea areas. Some of these species may cause large changes in invaded ecosystems.
The anticipated impact of warming on marine mammals in the Baltic Sea is mainly expected in the large decrease of ice cover, impacting the seal species that breed on ice, primarily ringed seals but also grey seals. On the other hand, increased temperatures may be advantageous for harbour seals and harbour porpoises. Potential effects on birds indicate that migrating and wintering birds in the Baltic may be most affected by warming processes, with birds wintering farther north in the Baltic Sea basin than previously.
Thus, although the impacts of climate change during the 21st century are diffi cult to predict with certainty, it is clear that the projected increase in temperature, taken together with changes in other conditions associated with atmospheric circulation and precipitation, including a decrease in the average salinity of the Baltic, would have a major infl uence on the conditions for biota in the Baltic Sea basin. This will affect species composition, distributions, and interactions in ways that are only roughly understood at the present time.
47
Clim
ate
Cha
nge
in th
e B
altic
Sea
Are
a –
HE
LCO
M T
hem
atic
Ass
essm
ent i
n 20
07
References
The BACC Author Group. 2007. Assessment of Climate Change for the Baltic Sea Basin. Springer (in preparation).
The BACC Lead Author Group. 2006. Assessment of Climate Change for the Baltic Sea Basin – The BACC Project. International BALTEX Secretariat Publication, No. 35. ISSN 1681-6471. 26 pp.
Bärring, L., and von Storch, H. 2004. Scandinavian storminess since about 1800. Geophysical Research Letters, 31, L20202, doi:10.1029/2004GL020441.
Beck, C., Grieser, J., and Rudolf, B. 2005. A New Monthly Precipitation Climatology for the Global Land Areas for the Period 1951 to 2000 (published in Climate Status Report 2004, pp. 181–190, German Weather Service, Offenbach, Germany).
Cubasch, U., Meehl, G.A., Boer, G.J., Stouffer, R.J., Dix, M., Noda, A., Senior, C.A., Raper, S., and Yap, K.S. 2001. Projections of future climate change. In: IPCC, Climate Change 2001. Cambridge University Press, pp. 525–582.
Fischer, H., and W. Matthäus, 1996. The importance of the Drogden Sill in the Sound for major Baltic infl ows. Journal of Marine Systems, 9: 137–157.
Graham, L.P., 1999. Modeling runoff to the Baltic Sea. Ambio 28, 328–334.
Hanssen-Bauer, I. 2005. Regional temperature and precipitation series for Norway: Analyses of time-series updated to 2004. met.no Report 15/2005 Climate, Norwegian Meteorological Institute, Oslo, Norway, 34 pp.
ICES. 2004. Report of the Baltic Fisheries Assessment Working Group. ICES CM 2004/ACFM:22.
IPCC. 2001. Climate Change 2001. The Scientifi c Basis: Contribution of Working Group I to the Third Assessment Report of the Intergovernmental Panel on Climate Change. Cambridge University Press, Cambridge, UK, and New York, NY, USA. 881 pp.
MacKenzie, B.R., Gislason, H., Möllmann, C., and Köster, F.W. 2007. Impact of fi shing on fi sh biodiversity and the ecosystem of the Baltic Sea during climate change. Global Change Biology, in press.
Matthäus, W., and Franck, H. 1992. Characteristics of major Baltic infl ows – a statistical analysis. Continental Shelf Research, 12: 1375–1400.
Meier, H.E.M., Döscher, R., and Halkka, A. 2004. Simulated distributions of Baltic sea-ice in warming climate and consequences for the winter habitat of the Baltic ringed seal. Ambio, 33: 249–256.
Pielke, R., jr. 2004. What is climate change? Issues in Science and Technology, Summer 2004: 1–4.
Seinä, A., and Palosuo, E. 1996. The classifi cation of the maximum annual extent of ice cover in the Baltic Sea 1720–1995. Meri, Report Series of the Finnish Institute of Marine Research, 20: 79–91.
Sparholt, H. 1994. Fish species interactions in the Baltic Sea. Dana, 10: 131–162.
48
Special appreciation is expressed to Hans-Jörg Isemer of the BALTEX Secretariat for his enthu-siastic and invaluable coordination of the com-munications between the BACC Group and the preparers of this HELCOM Assessment. The valu-able comments of anonymous reviewers on drafts of this report are also gratefully acknowledged.
In addition to the BACC Lead Authors and addi-tional contributors mentioned on page 2 we would like to thank the following members of the BACC Group for contributing to the original BACC Report.
Contributing AuthorsAnto Aasa, University of Tartu, Institute of
Geography, EstoniaRein Ahas, University of Tartu, Institute of
Geography, EstoniaHans Alexandersson, Swedish Meteorological
and Hydrological Institute, Norrköping, Sweden
Philip Axe, Swedish Meteorological and Hydrological Institute, Oceanographic Services, Västra Frolunda, Sweden
Lars Bärring, Lund University, Department of Physical Geography and Ecosystems Analysis, Sweden
Svante Björck, Lund University, GeoBiosphere Science Centre, Lund, Sweden
Thorsten Blenckner, Uppsala University, Department of Earth Sciences, Sweden
Agrita Briede, University of Latvia, Riga, LatviaTerry Callaghan, KVA Abisko Scientifi c Research
Station, Royal Swedish Academy of Sciences, Abisco, Sweden
John Cappelen, Danish Meteorological Institute, Climate Research Div., Copenhagen, Denmark
Deliang Chen, Göteborg University, Earth Sciences Center – Oceanography, Göteborg, Sweden
Ole Bøssing Christensen, Danish Meteorological Institute, Climate Research Div., Copenhagen, Denmark
Gerhard Dahlmann, Bundesamt für Schifffahrt und Hydrographie, Hamburg, Germany
Darius Daunys, University of Klaipeda, Coastal Research and Planning Institute, Klaipeda, Lithuania
Jacqueline de Chazal, Université catholique de Louvain, Département de Géographie, Louvain-la-Neuve, Belgium
Jüri Elken, Tallinn University of Technology, Marine Systems Institute, Tallinn, Estonia
Malgorzata Falarz, University of Silesia, Dept. of Climatology, Sosnowiec, Poland
Juha Flinkman, Finnish Institute of Marine Research, Oceanographic Data Base, Helsinki, Finland
Eirik Førland, Norwegian Meteorological Institute, Oslo, Norway
Jari Haapala, University of Helsinki, Department of Geophysics, Helsinki, Finland
Eberhard Hagen, Baltic Sea Research Institute, Rostock-Warnemünde, Germany
Lars Håkanson, Uppsala University, Department of Hydrology, Uppsala, Sweden
Antti Halkka, Finnish Association for Nature Conservation, Helsinki, Finland
Marianne Holmer, University of Southern Denmark, Institute of Biology, Odense, Denmark
Christoph Humborg, Stockholm University, Dept.of Applied Environmental Science, Stockholm, Sweden
Jaak Jaagus, University of Tartu, Institute of Geography, Estonia
Anna-Maria Jönsson, Lund University, Ecology Dept., Sweden
Seppo Kellomäki, Nordic Network for Carbon Dynamics in Managed Terrestrial Ecosystems, Faculty of Forestry, Joensuu, Finland
Lev Kitaev, Russian Academy of Science, Institute of Geography, Moscow, Russia
Erik Kjellström, Swedish Meteorological and Hydrological Institute, Rossby Centre, Norrköping, Sweden
Friedrich Köster, Danish Institute for Fisheries Research, Dept. of Marine Ecology and Aquaculture, Charlottenlund, Denmark
Are Kont, University of Tartu, Estonian Institute of Ecology, Estonia
Valentina Krysanova, Potsdam Institute for Climate Impact Research, Dept of Global Change and Natural Systems, Potsdam, Germany
Ain Kull, University of Tartu, Institute of Geography, Tartu, Estonia
Acknowledgements
49
Clim
ate
Cha
nge
in th
e B
altic
Sea
Are
a –
HE
LCO
M T
hem
atic
Ass
essm
ent i
n 20
07
Esko Kuusisto, Finnish Environment Agency, Helsinki, Finland
Esa Lehikoinen, University of Turku, Dept. of Biology, Turku, Finland
Maiju Lehtiniemi, Finnish Institute of Marine Research, Oceanographic Data Base, Helsinki, Finland
Göran Lindström, Swedish Meteorological and Hydrological Institute, Research and Development, Norrköping, Sweden
Brian MacKenzie, Danish Institute for Fisheries Research, Afd. for Havøkologi og Akvakultur (HØK), Charlottenlund, Denmark
Ülo Mander, University of Tartu, Institute of Geography, Tartu, Estonia
Wolfgang Matthäus, Baltic Sea Research Institute, Rostock-Warnemünde, Germany
Miroslaw Mietus, Institute of Meteorology and Water Management - Maritime Branch, Gdynia, Poland
Anders Moberg, Stockholm University, Department of Meteorology, Arrhenius Laboratory, Sweden
Flemming Møhlenberg, DHI Water & Environment, Vand Og Miljø, Hørsholm, Denmark
Christian Möllmann, Institute for Hydrobiology and Fisheries Science, University of Hamburg, Germany
Kai Myrberg, Finnish Institute of Marine Research, Helsinki, Finland
Tadeusz Niedzwiedz, University of Silesia, Branch of Kraków Dept. of Climatology, Sosnowiec, Poland
Peeter Nõges, EC Joint Research Centre, Inland and Marine Waters Unit, Institute for Environment and Sustainability, Ispra, Italy
Tiina Nõges, Estonian Agricultural University, Institute of Zoology and Botany, Tartu, Estonia
Øyvind Nordli, Norwegian Meteorological Institute, Oslo, Norway
Sergej Olenin, Klaipeda University, Coastal Research and Planning Institute, Klaipeda, Lithuania
Kaarel Orviku, Merin Ltd., Tallinn, EstoniaZbigniew Pruszak, Polish Academy of Sciences,
Institute of Hydroengieneering IBW PAN, Gdansk, Poland
Maciej Radziejewski, Polish Academy of Sciences, Research Centre of Agr. and Forest Envir., Poznan, Poland
Egidijus Rimkus, Vilnius University, Department of Hydrology and Climatology, Lithuania
Burkhardt Rockel, GKSS Research Centre, Institute of Coastal Research, Geesthacht, Germany
Mark Rounsevell, Université catholique de Louvain, Département de Géographie, Belgium
Kimmo Ruosteenoja, Finnish Meteorological Institute, Helsinki, Finland
Viivi Russak, Tartu Observatory, Atmospheric Physics, Estonia
Ralf Scheibe, University of Greifswald, Geographoical Institute, Germany
Doris Schiedek, Baltic Sea Research Institute, Rostock-Warnemünde, Germany
Corinna Schrum, Institute of Oceanography at the University of Hamburg, Germany
Klaus Schwarzer, University of Kiel, Institute of Sedimentology, Germany
Hendrik Skov, DHI Water & Environment, Horsholm, Denmark
Mikhail Sofi ev, Finnish Meteorological Institute, Air Quality, Helsinki, Finland
Wilhelm Steingrube, University of Greifswald, Geographical Institute, Germany
Ülo Suursaar, University of Tartu, Estonian Marine Institute, Estonia
Piotr Tryjanowski, Adam Mickiewicz University, Department of Avian Biology and Ecology, Poznan, Poland
Timo Vihma, Finnish Meteorological Institute, Helsinki, Finland
Norbert Wasmund, Baltic Sea Research Institute, Rostock-Warnemünde, Germany
Joana Wibig, University of Lodz, Dept. of Meteorology and Climatology, Lodz, Poland
Annett Wolf, Lund University, Centre for Geobiosphere Science, Sweden
BACC Science Steering GroupJens Hesselbjerg Christensen, Danish
Meteorological Institute, Copenhagen, Denmark
Eigil Kaas, Danish Meteorological Institute, Copenhagen, Denmark
Z.W.Kundzewicz, Polish Academy of Sciences, Research Centre of Agr. and Forest Envir., Poznan, Poland
Jouni Räisänen, University of Helsinki, Div.of Atmospheric Sciences, Helsinki, Finland
Markku Rummukainen, Swedish Meteorological and Hydrological Institute, Norrköping, Sweden
Morten Sondergaard, University of Copenhagen, Freshwater Biological Laboratory, Hillerod, Denmark
Bodo von Bodungen, Baltic Sea Research Institute, Rostock-Warnemünde, Germany


www.helcom.fi