Embed Size (px)
Citation preview
199
Chapter 13 Solomon Islands
The contributions of David Hiriasia and Lloyd Tahani from the Solomon Islands Meteorological Service are gratefully acknowledged
Village, Central Province

200 Climate Change in the Pacific: Scientific Assessment and New Research | Volume 2: Country Reports
This chapter provides a brief description of the Solomon Islands, its past and present climate as well as projections for the future. The climate observation network and the availability of atmospheric and oceanic data records are outlined. The annual mean climate, seasonal cycles and the influences of large-scale climate features such as the West Pacific Monsoon and patterns of climate variability (e.g. the El Niño-Southern
Oscillation) are analysed and discussed. Observed trends and analysis of air temperature, rainfall, extreme events (including tropical cyclones), sea-surface temperature, ocean acidification, mean and extreme sea levels are presented. Projections for air and sea-surface temperature, rainfall, sea level, ocean acidification and extreme events for the 21st century are provided.
Introduction
13.1.1 Current Climate• Air temperatures in the Solomon
Islands show very little seasonal variation, and are closely linked to sea-surface temperatures.
• In the west there is a marked wet season from November to April, while rainfall is more constant year-round in the east. Rainfall in the Solomon Islands is affected by the West Pacific Monsoon, the South Pacific Convergence Zone and the Intertropical Convergence Zone.
• Rainfall in the Solomon Islands varies greatly from year-to-year, due mainly to the influence of the El Niño-Southern Oscillation.
• Warming trends are evident in both annual and seasonal mean air temperatures at Honiara for the period 1951–2009.
• Annual and seasonal rainfall trends for Honiara for the period 1950--2009 are not statistically significant.
• The sea-level rise near Solomon Islands measured by satellite altimeters since 1993 is mostly over 8 mm per year.
• On average, Honiara experiences 13 tropical cyclones per decade, with most occurring between November and April. The high variability in tropical cyclone numbers makes it difficult to identify any long-term trends in frequency.
13.1.2 Future ClimateOver the course of the 21st century:
• Surface air temperature and sea-surface temperature are projected to continue to increase (very high confidence).
• Annual and seasonal mean rainfall is projected to increase (high confidence).
• The intensity and frequency of days of extreme heat are projected to increase (very high confidence).
13.1 Climate Summary
These projections are presented along with confidence levels based on expert judgement by Pacific Climate Change Science Program (PCCSP) scientists. The chapter concludes with a summary table of projections (Table 13.4). Important background information, including an explanation of methods and models, is provided in Chapter 1. For definitions of other terms refer to the Glossary.
• The intensity and frequency of days of extreme rainfall are projected to increase (high confidence).
• The incidence of drought is projected to decrease (moderate confidence).
• Tropical cyclone numbers are projected to decline in the south-west Pacific Ocean basin (0–40ºS, 130ºE–170ºE) (moderate confidence).
• Ocean acidification is projected to continue (very high confidence).
• Mean sea-level rise is projected to continue (very high confidence).

201Chapter 13: Solomon Islands
The Solomon Islands consist of two chains of volcanic islands that lie between 5ºS–13ºS and 155ºE–169ºE. There are 992 islands with a total land area of 28 785 km2. The islands range from small low-lying atolls to large, volcanic islands with high peaks (Solomon Islands Country Profile, SOPAC, 2000).
13.2 Country Description
Most of the population, which was estimated at 549 574 in 2010, live in small rural communities dispersed over the nine largest islands (Solomon Islands Country Statistics, SOPAC, 2010). The capital, Honiara, is located on the island Guadalcanal.
Timber has long been a mainstay of the Solomon Islands economy
Figure 13.1: Solomon Islands
and gold deposits may provide an additional source of revenue for the country. Local agriculture consists of both subsistence and commercial components. Key agricultural exports include cocoa, palm oil and coconut products (Solomon Islands First National Communication under the UNFCCC, 2001).

202 Climate Change in the Pacific: Scientific Assessment and New Research | Volume 2: Country Reports
There are currently six operational meteorological stations in the Solomon Islands. Multiple observations within a 24-hour period are taken at Taro, Munda, Auki, Honiara, Henderson and Santa Cruz (also known as Lata). A single rainfall observation per day is taken at Kirakira (previously multiple observations). More than 60 volunteer single observation rainfall-only stations have closed in recent years. The primary climate station is located in Honiara on the northern side of Guadalcanal Island (Figure 13.1). Several stations, including Auki and Kirakira, have rainfall data from late the 1910s. Honiara has air temperature data from the early 1950s.
Climate records for a Henderson-Honiara composite (1950– 2009) and Santa Cruz (1970–2009) have been used. The Henderson-Honiara and Santa Cruz records are homogeneous and more than 95% and 85% complete respectively.
Monthly-averaged sea-level data are available from 1974 at Honiara (1974–1994 and 1994–present). A global positioning system instrument to estimate vertical land motion was deployed in the Solomon Islands in 2008 and will provide valuable direct estimates of local vertical land motion in future years. Both satellite
13.3 Data Availability
Climate data management training, Solomon Islands Meteorological Service
(from 1993) and in situ sea-level data (1950–2009; termed reconstructed sea level; Volume 1, Section 2.2.2.2) are available on a global 1° x 1° grid.
Long-term locally-monitored sea-surface temperature data are unavailable for the Solomon Islands, so large-scale gridded sea-surface temperature datasets have been used (HadISST, HadSST2, ERSST and Kaplan Extended SST V2; Volume 1, Table 2.3).

203Chapter 13: Solomon Islands
The climate in the Solomon Islands is tropical with two seasons: the wet season from November to April and the dry season from May to October. The local names for these seasons, Komburu and Ara, are based on the prevailing direction of the trade winds.
Air temperatures in the Solomon Islands are fairly constant throughout the year with very weak seasonal variations (Figure 13.2). The most significant variation is from July to August when cooler air blows in from the south. In Honiara a slight decrease in temperature is also
evident in January, February and March due to increased cloud cover during the wet season. Monthly air temperatures at both sites are closely linked to sea-surface temperatures in the region.
Many climate features influence rainfall in the Solomon Islands. Honiara has a very marked wet season from November to April (Figure 13.2) when on average almost 70% of the yearly total rain falls. In the dry season (May-October) on average about 600 mm falls compared with upwards of 1800 mm in the wet season. Most
13.4 Seasonal Cycles
rain falls from January to March when the West Pacific Monsoon (WPM) is most active in the region. This feeds moisture into the South Pacific Convergence Zone (SPCZ), which is most active in the wet season, and Intertropical Convergence Zone (ITCZ), which lies closest to the Solomon Islands in the wet season. Being further to the east, Santa Cruz sits in a region where the SPCZ is active year-round and it receives more constant rainfall during the year, averaging between 280 mm and 420 mm per month.
Figure 13.2: Mean annual cycle of rainfall (grey bars) and daily maximum, minimum and mean air temperatures at Honiara (left) and at Santa Cruz (right), and local sea-surface temperatures derived from the HadISST dataset (Volume 1, Table 2.3).
204 Climate Change in the Pacific: Scientific Assessment and New Research | Volume 2: Country Reports
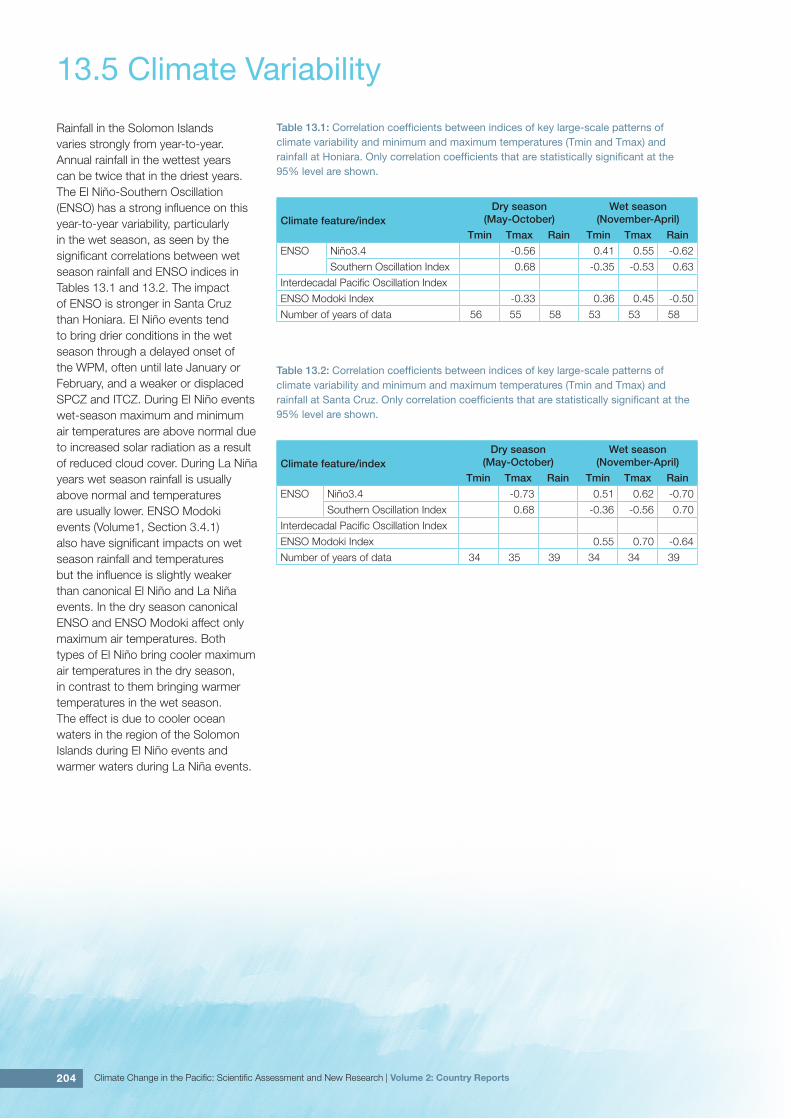
Rainfall in the Solomon Islands varies strongly from year-to-year. Annual rainfall in the wettest years can be twice that in the driest years. The El Niño-Southern Oscillation (ENSO) has a strong influence on this year-to-year variability, particularly in the wet season, as seen by the significant correlations between wet season rainfall and ENSO indices in Tables 13.1 and 13.2. The impact of ENSO is stronger in Santa Cruz than Honiara. El Niño events tend to bring drier conditions in the wet season through a delayed onset of the WPM, often until late January or February, and a weaker or displaced SPCZ and ITCZ. During El Niño events wet-season maximum and minimum air temperatures are above normal due to increased solar radiation as a result of reduced cloud cover. During La Niña years wet season rainfall is usually above normal and temperatures are usually lower. ENSO Modoki events (Volume1, Section 3.4.1) also have significant impacts on wet season rainfall and temperatures but the influence is slightly weaker than canonical El Niño and La Niña events. In the dry season canonical ENSO and ENSO Modoki affect only maximum air temperatures. Both types of El Niño bring cooler maximum air temperatures in the dry season, in contrast to them bringing warmer temperatures in the wet season. The effect is due to cooler ocean waters in the region of the Solomon Islands during El Niño events and warmer waters during La Niña events.
Table 13.1: Correlation coefficients between indices of key large-scale patterns of climate variability and minimum and maximum temperatures (Tmin and Tmax) and rainfall at Honiara. Only correlation coefficients that are statistically significant at the 95% level are shown.
Climate feature/indexDry season
(May-October)Wet season
(November-April)
Tmin Tmax Rain Tmin Tmax Rain
ENSO Niño3.4 -0.56 0.41 0.55 -0.62
Southern Oscillation Index 0.68 -0.35 -0.53 0.63
Interdecadal Pacific Oscillation Index
ENSO Modoki Index -0.33 0.36 0.45 -0.50
Number of years of data 56 55 58 53 53 58
Table 13.2: Correlation coefficients between indices of key large-scale patterns of climate variability and minimum and maximum temperatures (Tmin and Tmax) and rainfall at Santa Cruz. Only correlation coefficients that are statistically significant at the 95% level are shown.
Climate feature/indexDry season
(May-October)Wet season
(November-April)
Tmin Tmax Rain Tmin Tmax Rain
ENSO Niño3.4 -0.73 0.51 0.62 -0.70
Southern Oscillation Index 0.68 -0.36 -0.56 0.70
Interdecadal Pacific Oscillation Index
ENSO Modoki Index 0.55 0.70 -0.64
Number of years of data 34 35 39 34 34 39
13.5 Climate Variability

205Chapter 13: Solomon Islands
13.6.1 Air TemperatureWarming trends are evident in both annual and seasonal mean air temperatures at Honiara for the period 1951–2009 (Figure 13.3). Annual and seasonal maximum air temperature trends are comparable to those for minimum air temperatures (Table 13.3).
13.6 Observed Trends
Figure 13.3: Annual mean air temperature for Honiara. Light blue, dark blue and grey bars denote El Niño, La Niña and neutral years respectively.
Table 13.3: Annual and seasonal trends in maximum, minimum and mean air temperature (Tmax, Tmin and Tmean; 1951–2009) and rainfall (1950–2009) at Honiara. Asterisks indicate significance at the 95% level. Persistence is taken into account in the assessment of significance as in Power and Kociuba (in press). The statistical significance of the air temperature trends is not assessed.
Honiara Tmax
(°C per 10 yrs)
Honiara Tmin
(°C per 10 yrs)
Honiara Tmean
(°C per 10 yrs)
Honiara Rain
(mm per 10 yrs)
Annual +0.16 +0.18 +0.17 -40
Wet season +0.19 +0.18 +0.18 -32
Dry season +0.15 +0.18 +0.17 -5
13.6.2 RainfallAnnual and seasonal rainfall trends for Honiara for the period 1950–2009 are not statistically significant (Table 13.3; Figure 13.4).
Figure 13.4: Annual rainfall at Honiara. Light blue, dark blue and grey bars denote El Niño, La Niña and neutral years respectively.
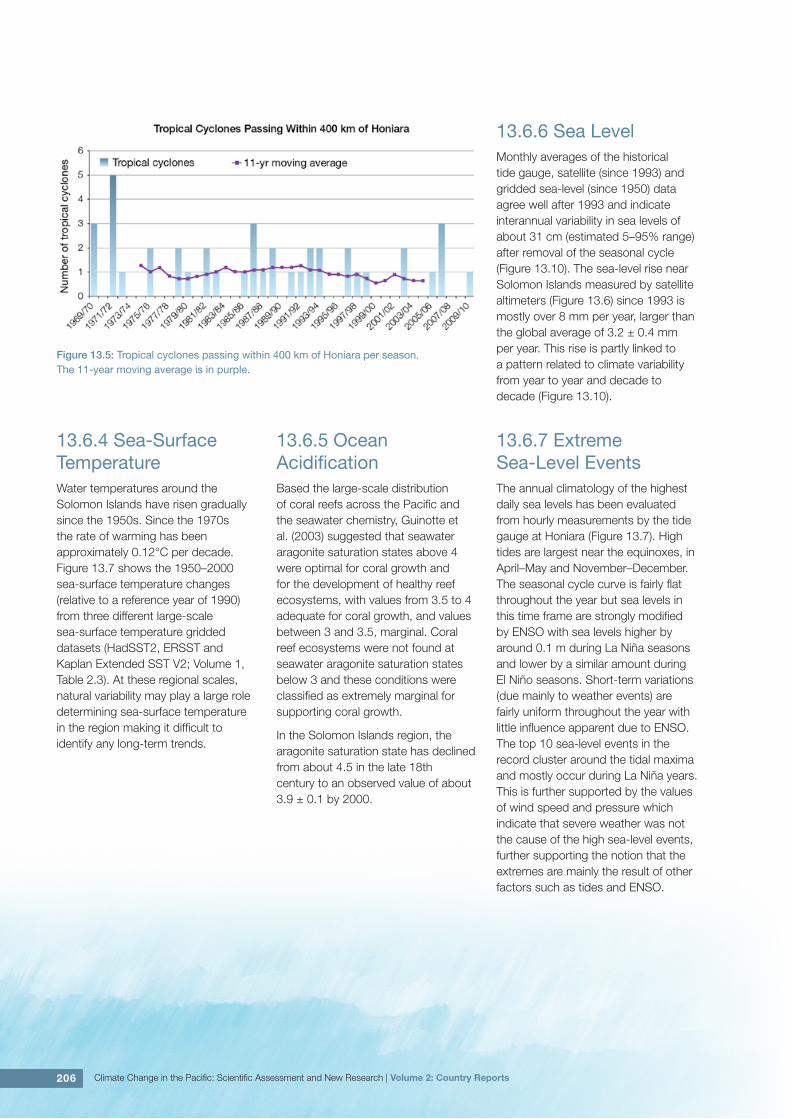
13.6.3 Extreme EventsThe tropical cyclone season in the Solomon Islands is between November and April. Occurrences outside this period are rare. The tropical cyclone archive for the Southern Hemisphere indicates that between the 1969/70 and 2009/10 cyclone seasons, the centre of 41 tropical cyclones passed within approximately 400 km of Honiara. This represents an average of 10 cyclones per decade. Tropical cyclones were most frequent in El Niño years (13 cyclones per decade) and least frequent in La Niña years (six cyclones per decade). The ENSO-neutral average is nine cyclones per decade. The interannual variability in the number of tropical cyclones in the vicinity of Honiara is large, ranging from zero in some seasons to five in the 1971/72 season (Figure 13.5). This high variability makes it difficult to identify any long-term trends in frequency.
Tropical cyclones result in flooding and wind damage in the Solomon Islands. There have been severe floods on Guadalcanal, Malaita, Makira and Santa Isabel in recent years with a number of lives lost, and severe damage to agriculture and infrastructure.
206 Climate Change in the Pacific: Scientific Assessment and New Research | Volume 2: Country Reports
13.6.4 Sea-Surface TemperatureWater temperatures around the Solomon Islands have risen gradually since the 1950s. Since the 1970s the rate of warming has been approximately 0.12°C per decade. Figure 13.7 shows the 1950–2000 sea-surface temperature changes (relative to a reference year of 1990) from three different large-scale sea-surface temperature gridded datasets (HadSST2, ERSST and Kaplan Extended SST V2; Volume 1, Table 2.3). At these regional scales, natural variability may play a large role determining sea-surface temperature in the region making it difficult to identify any long-term trends.
13.6.5 Ocean AcidificationBased the large-scale distribution of coral reefs across the Pacific and the seawater chemistry, Guinotte et al. (2003) suggested that seawater aragonite saturation states above 4 were optimal for coral growth and for the development of healthy reef ecosystems, with values from 3.5 to 4 adequate for coral growth, and values between 3 and 3.5, marginal. Coral reef ecosystems were not found at seawater aragonite saturation states below 3 and these conditions were classified as extremely marginal for supporting coral growth.
In the Solomon Islands region, the aragonite saturation state has declined from about 4.5 in the late 18th century to an observed value of about 3.9 ± 0.1 by 2000.
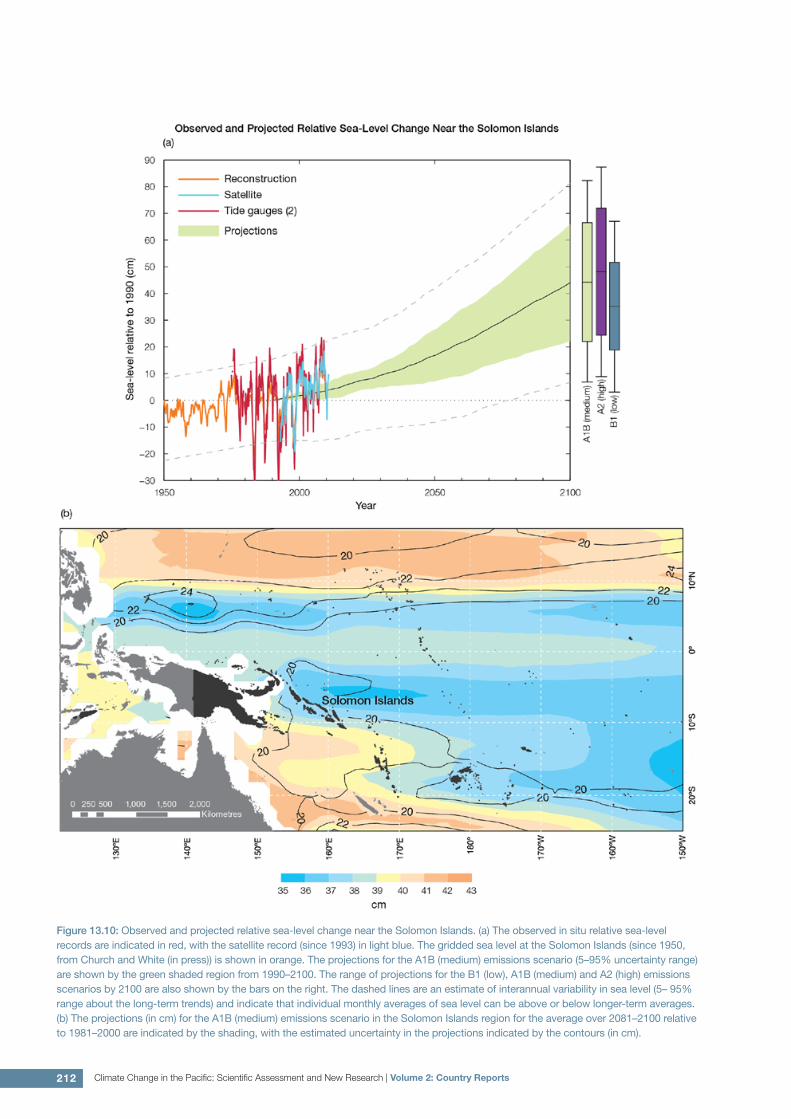
13.6.6 Sea LevelMonthly averages of the historical tide gauge, satellite (since 1993) and gridded sea-level (since 1950) data agree well after 1993 and indicate interannual variability in sea levels of about 31 cm (estimated 5–95% range) after removal of the seasonal cycle (Figure 13.10). The sea-level rise near Solomon Islands measured by satellite altimeters (Figure 13.6) since 1993 is mostly over 8 mm per year, larger than the global average of 3.2 ± 0.4 mm per year. This rise is partly linked to a pattern related to climate variability from year to year and decade to decade (Figure 13.10).
Figure 13.5: Tropical cyclones passing within 400 km of Honiara per season. The 11-year moving average is in purple.
13.6.7 Extreme Sea-Level EventsThe annual climatology of the highest daily sea levels has been evaluated from hourly measurements by the tide gauge at Honiara (Figure 13.7). High tides are largest near the equinoxes, in April–May and November–December. The seasonal cycle curve is fairly flat throughout the year but sea levels in this time frame are strongly modified by ENSO with sea levels higher by around 0.1 m during La Niña seasons and lower by a similar amount during El Niño seasons. Short-term variations (due mainly to weather events) are fairly uniform throughout the year with little influence apparent due to ENSO. The top 10 sea-level events in the record cluster around the tidal maxima and mostly occur during La Niña years. This is further supported by the values of wind speed and pressure which indicate that severe weather was not the cause of the high sea-level events, further supporting the notion that the extremes are mainly the result of other factors such as tides and ENSO.

207Chapter 13: Solomon Islands
Figure 13.6: The regional distribution of the rate of sea-level rise measured by satellite altimeters from January 1993 to December 2010, with the location of Solomon Islands indicated. Further detail about regional distribution of sea-level rise is provided in Volume 1, Section 3.6.3.2.
Figure 13.7: The annual cycle of high waters relative to Mean Higher High Water (MHHW) due to tides, short-term fluctuations (most likely associated with storms) and seasonal variations for Honiara. The tides and short-term fluctuations are respectively the 95% exceedence levels of the astronomical high tides relative to MHHW and short-term sea level fluctuations. Components computed only for El Niño and La Niña months are shown by dotted and dashed lines, and grey lines are the sum of the tide, short-term and seasonal components. The 10 highest sea level events in the record relative to MHHW are shown and coded to indicate the phase of ENSO at the time of the extreme event.

208 Climate Change in the Pacific: Scientific Assessment and New Research | Volume 2: Country Reports
than 2.5°C are simulated by almost all models (Table 13.4). Given the close relationship between surface air temperature and sea-surface temperature, a similar (or slightly weaker) rate of warming is projected for the surface ocean (Figure 13.8). There is high confidence in this range and distribution of possible futures because:
• There is generally close agreement between modelled and observed temperature trends over the past 50 years in the vicinity of the Solomon Islands, although observational records are limited (Figure 13.8).
The 8 km CCAM simulations suggest that projected changes in the average
daily maximum air temperature over land can be up to 0.5°C greater than over the surrounding ocean. This suggests that the CMIP3 models may slightly underestimate future increases in daily maximum air temperature.
Interannual variability in surface air temperature and sea-surface temperature over the Solomon Islands is strongly influenced by ENSO in the current climate (Section 13.5). As there is no consistency in projections of future ENSO activity (Volume 1, Section 6.4.1) it is not possible to determine whether interannual variability in temperature will change in the future. However, ENSO is expected to continue to be an important source of variability for the region.
13.7 Climate Projections
Climate projections have been derived from up to 18 global climate models from the CMIP3 database, for up to three emissions scenarios (B1 (low), A1B (medium) and A2 (high)) and three 20-year periods (centred on 2030, 2055 and 2090, relative to 1990). These models were selected based on their ability to reproduce important features of the current climate (Volume 1, Section 5.2.3), so projections from each of the models are plausible representations of the future climate. This means there is not one single projected future for the Solomon Islands, but rather a range of possible futures. The full range of these futures is discussed in the following sections.
These projections do not represent a value specific to any actual location, such as a town or city in the Solomon Islands. Instead, they refer to an average change over the broad geographic region encompassing the Solomon Islands and the surrounding ocean (Figure 1.1 shows the regional boundaries). Some information regarding dynamical downscaling simulations from the CCAM model (Section 1.7.2) is also provided, in order to indicate how changes in the climate on an individual island-scale may differ from the broad-scale average.
Section 1.7 provides important information about understanding climate model projections.
13.7.1 TemperatureSurface air temperature and sea-surface temperature are projected to continue to increase over the course of the 21st century. There is very high confidence in this direction of change because:
• Warming is physically consistent with rising greenhouse gas concentrations.
• All CMIP3 models agree on this direction of change.
The majority of CMIP3 models simulate a slight increase (<1°C) in annual and seasonal mean temperature by 2030, however by 2090 under the A2 (high) emissions scenario temperature increases of greater
Figure 13.8: Historical climate (from 1950 onwards) and simulated historical and future climate for annual mean sea-surface temperature (SST) in the region surrounding Solomon Islands, for the CMIP3 models. Shading represents approximately 95% of the range of model projections (twice the inter-model standard deviation), while the solid lines represent the smoothed (20-year running average) multi-model mean temperature. Projections are calculated relative to the 1980–1999 period (which is why there is a decline in the inter-model standard deviation around 1990). Observational estimates in the main figure (red lines) are derived from the HadSST2, ERSST and Kaplan Extended SST V2 datasets (Volume 1, Section 2.2.2). Annual average (black) and 20-year running average (red) HadSST2 data is also shown inset.

209Chapter 13: Solomon Islands
13.7.2 RainfallWet season (November-April), dry season (May-October) and annual average rainfall are projected to increase over the course of the 21st century. There is high confidence in this direction of change because:
• Physical arguments indicate that rainfall will increase in the equatorial Pacific in a warmer climate (IPCC, 2007; Volume 1, Section 6.4.3).
• Almost all of the CMIP3 models agree on this direction of change by 2090.
The majority of CMIP3 models simulate little change (-5% to 5%) in annual and seasonal rainfall by 2030, however by 2090 under the higher emissions scenarios (i.e. A2 (high) and A1B (medium)) the majority simulate an increase (>5%), with very few models simulating a decrease (<-5%) (Table 13.4). There is moderate confidence in this range and distribution of possible futures because:
• In simulations of the current climate, the CMIP3 models broadly capture the influence of the West Pacific Monsoon, Intertropical Convergence Zone and South Pacific Convergence Zone on the rainfall of the Solomon Islands (Volume 1, Section 5.2.3), although most models produce monsoon westerly winds that do not extend far enough east into the Pacific basin
• The CMIP3 models are unable to resolve many of the physical processes involved in producing rainfall. As a consequence, they do not simulate rainfall as well as other variables such as temperature (Volume 1, Chapter 5).
The inconsistency between the projected increase in annual rainfall and the recent declining trend observed for Honiara (Section 13.6.2) may be related to local factors not captured by the models (e.g. topography), or the fact that the projections presented here represent an average over a very large geographic region (Sections 1.7.1 and 1.7.2).
Interannual variability in rainfall over the Solomon Islands is strongly influenced by ENSO in the current climate (Section 13.5). As there is no consistency in projections of future ENSO activity (Volume 1, Section 6.4.1) it is not possible to determine whether interannual variability in rainfall will change in the future.
13.7.3 Extremes
Temperature
The intensity and frequency of days of extreme heat are projected to increase over the course of the 21st century. There is very high confidence in this direction of change because:
• An increase in the intensity and frequency of days of extreme heat is physically consistent with rising greenhouse gas concentrations.
• All CMIP3 models agree on the direction of change for both intensity and frequency.
The majority of CMIP3 models simulate an increase of approximately 1oC in the temperature experienced on the 1-in-20-year hot day by 2055 under the B1 (low) emissions scenario, with an increase of over 2.5°C simulated by the majority of models by 2090 under the A2 (high) emissions scenario (Table 13.4). There is low confidence in this range and distribution of possible futures because:
• In simulations of the current climate, the CMIP3 models tend to underestimate the intensity and frequency of days of extreme heat (Volume 1, Section 5.2.4).
• Smaller increases in the frequency of days of extreme heat are projected by the CCAM 60 km simulations.
Rainfall
The intensity and frequency of days of extreme rainfall are projected to increase over the course of the 21st century. There is high confidence in this direction of change because:
• An increase in the frequency and intensity of extreme rainfall is consistent with larger-scale
projections, based on the physical argument that the atmosphere is able to hold more water vapour in a warmer climate (Allen and Ingram, 2002; IPCC, 2007). It is also consistent with physical arguments that rainfall will increase in the deep tropical Pacific in a warmer climate (IPCC, 2007; Volume 1, Section 6.4.3).
• Almost all of the CMIP3 models agree on this direction of change for both intensity and frequency.
The majority of CMIP3 models simulate an increase of at least 15 mm in the amount of rain received on the 1-in-20-year wet day by 2055 under the B1 (low) emissions scenario, with an increase of at least 30 mm simulated by 2090 under the A2 (high) emissions scenario. The majority of models project that the current 1-in-20-year extreme rainfall event will occur, on average, three to four times per 20-year period by 2055 under the B1 (low) emissions scenario and five times per 20-year period by 2090 under the A2 (high) emissions scenario. There is low confidence in this range and distribution of possible futures because:
• In simulations of the current climate, the CMIP3 models tend to underestimate the intensity and frequency of extreme rainfall (Volume 1, Section 5.2.4).
• The CMIP3 models are unable to resolve many of the physical processes involved in producing extreme rainfall.
Drought
The incidence of drought is projected to decrease over the course of the 21st century. There is moderate confidence in this direction of change because:
• A decrease in drought is consistent with projections of increased rainfall (Section 13.7.2).
• The majority of models agree on this direction of change for most drought categories.
The majority of CMIP3 models project that mild drought will occur approximately seven to eight times
210 Climate Change in the Pacific: Scientific Assessment and New Research | Volume 2: Country Reports
every 20 years in 2030 under all emissions scenarios, decreasing to six to seven times by 2090. The frequency of moderate and severe drought is projected to remain approximately stable, at once to twice and once every 20 years, respectively. There is low confidence in this range and distribution of possible futures because:
• There is only moderate confidence in the range of rainfall projections (Section 13.7.2), which directly influences projections of future drought conditions.
Tropical Cyclones
Tropical cyclone numbers are projected to decline in the south-west Pacific Ocean basin (0–40ºS, 130ºE– 170ºE) over the course of the 21st century. There is moderate confidence in this direction of change because:
• Many studies suggest a decline in tropical cyclone frequency globally (Knutson et al., 2010).
• Tropical cyclone numbers decline in the south-west Pacific Ocean in the majority assessment techniques.
Based on the direct detection methodologies (Curvature Vorticity Parameter (CVP) and the CSIRO Direct Detection Scheme (CDD) described
in Volume 1, Section 4.8.2), 55% of projections show no change or a decrease in tropical cyclone formation when applied to the CMIP3 climate models for which suitable output is available. When these techniques are applied to CCAM, 100% of projections show a decrease in tropical cyclone formation. In addition, the Genesis Potential Index (GPI) empirical technique suggests that conditions for tropical cyclone formation will become less favourable in the south-west Pacific Ocean basin, for the majority (80%) of analysed CMIP3 models. There is moderate confidence in this range and distribution of possible futures because in simulations of the current climate, the CVP, CDD and GPI methods capture the frequency of tropical cyclone activity reasonably well (Volume 1, Section 5.4).
Despite this projected reduction in total cyclone numbers, five of the six CCAM 60 km simulations show an increase in the proportion of the most severe cyclones. Most models also indicate a reduction in tropical cyclone wind hazard north of 20ºS latitude and regions of increased hazard south of 20ºS latitude. This increase in wind hazard coincides with a poleward shift in the latitude at which tropical cyclones are most intense.
13.7.4 Ocean AcidificationThe acidification of the ocean will continue to increase over the course of the 21st century. There is very high confidence in this projection as the rate of ocean acidification is driven primarily by the increasing oceanic uptake of carbon dioxide, in response to rising atmospheric carbon dioxide concentrations.
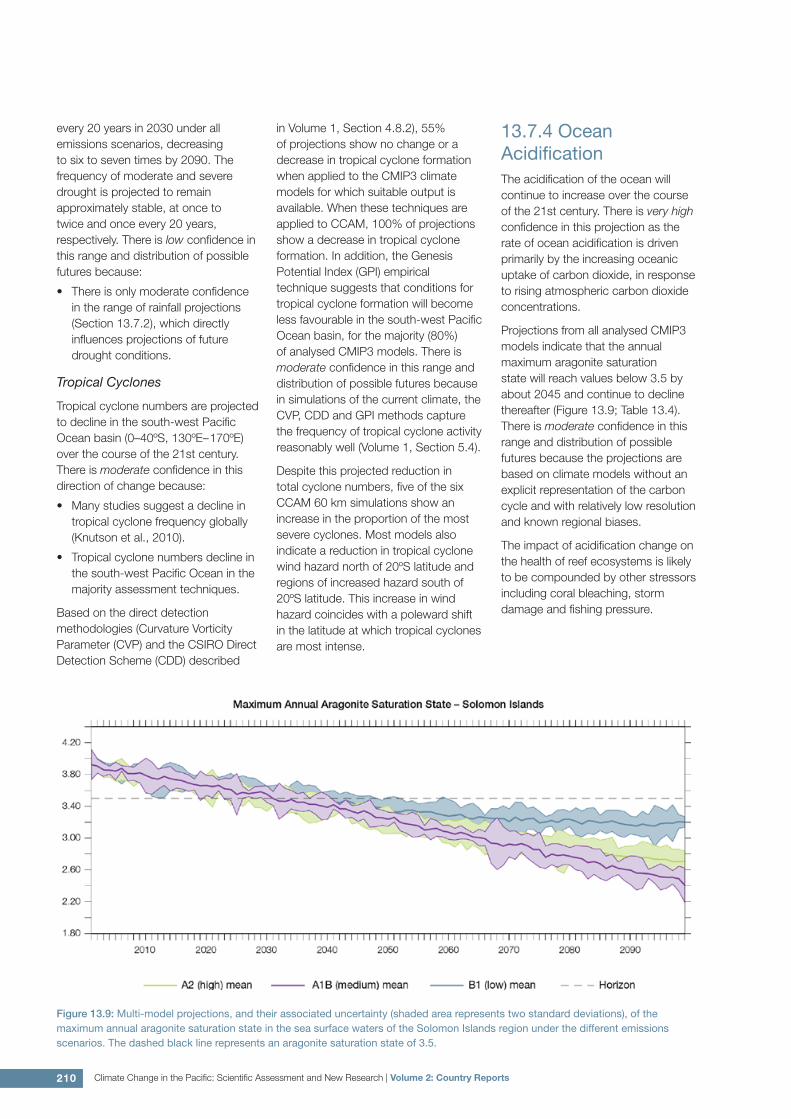
Projections from all analysed CMIP3 models indicate that the annual maximum aragonite saturation state will reach values below 3.5 by about 2045 and continue to decline thereafter (Figure 13.9; Table 13.4). There is moderate confidence in this range and distribution of possible futures because the projections are based on climate models without an explicit representation of the carbon cycle and with relatively low resolution and known regional biases.
The impact of acidification change on the health of reef ecosystems is likely to be compounded by other stressors including coral bleaching, storm damage and fishing pressure.
Figure 13.9: Multi-model projections, and their associated uncertainty (shaded area represents two standard deviations), of the maximum annual aragonite saturation state in the sea surface waters of the Solomon Islands region under the different emissions scenarios. The dashed black line represents an aragonite saturation state of 3.5.
211Chapter 13: Solomon Islands
13.7.5 Sea LevelMean sea level is projected to continue to rise over the course of the 21st century. There is very high confidence in this direction of change because:
• Sea-level rise is a physically consistent response to increasing ocean and atmospheric temperatures, due to thermal expansion of the water and the melting of glaciers and ice caps.
• Projections arising from all CMIP3 models agree on this direction of change.
The CMIP3 models simulate a rise of between approximately 5–15 cm by 2030, with increases of 20–60 cm indicated by 2090 under the higher emissions scenarios (i.e. A2 (high) and A1B (medium); Figure 13.10; Table 13.4). There is moderate confidence in this range and distribution of possible futures because:
• There is significant uncertainty surrounding ice-sheet contributions to sea-level rise and a rise larger than projected above cannot be excluded (Meehl et al., 2007b). However, understanding of the processes is currently too limited to provide a best estimate or an upper bound (IPCC, 2007).
• Globally, since the early 1990s, sea level has been rising near the upper end of the above projections. During the 21st century, some studies (using semi-empirical models) project faster rates of sea-level rise.
Interannual variability of sea level will lead to periods of lower and higher regional sea levels. In the past, this interannual variability has been about 31 cm (5–95% range, after removal of the seasonal signal; dashed lines in Figure 13.10 (a)) and it is likely that a similar range will continue through the 21st century. In addition, winds and waves associated with weather phenomena will continue to lead to extreme sea-level events.
In addition to the regional variations in sea level associated with ocean and mass changes, there are ongoing changes in relative sea level associated with changes in surface loading over the last glacial cycle (glacial isostatic adjustment) and local tectonic motions. The glacial isostatic motions are relatively small for the PCCSP region.
212 Climate Change in the Pacific: Scientific Assessment and New Research | Volume 2: Country Reports
Figure 13.10: Observed and projected relative sea-level change near the Solomon Islands. (a) The observed in situ relative sea-level records are indicated in red, with the satellite record (since 1993) in light blue. The gridded sea level at the Solomon Islands (since 1950, from Church and White (in press)) is shown in orange. The projections for the A1B (medium) emissions scenario (5–95% uncertainty range) are shown by the green shaded region from 1990–2100. The range of projections for the B1 (low), A1B (medium) and A2 (high) emissions scenarios by 2100 are also shown by the bars on the right. The dashed lines are an estimate of interannual variability in sea level (5– 95% range about the long-term trends) and indicate that individual monthly averages of sea level can be above or below longer-term averages. (b) The projections (in cm) for the A1B (medium) emissions scenario in the Solomon Islands region for the average over 2081–2100 relative to 1981–2000 are indicated by the shading, with the estimated uncertainty in the projections indicated by the contours (in cm).
213Chapter 13: Solomon Islands
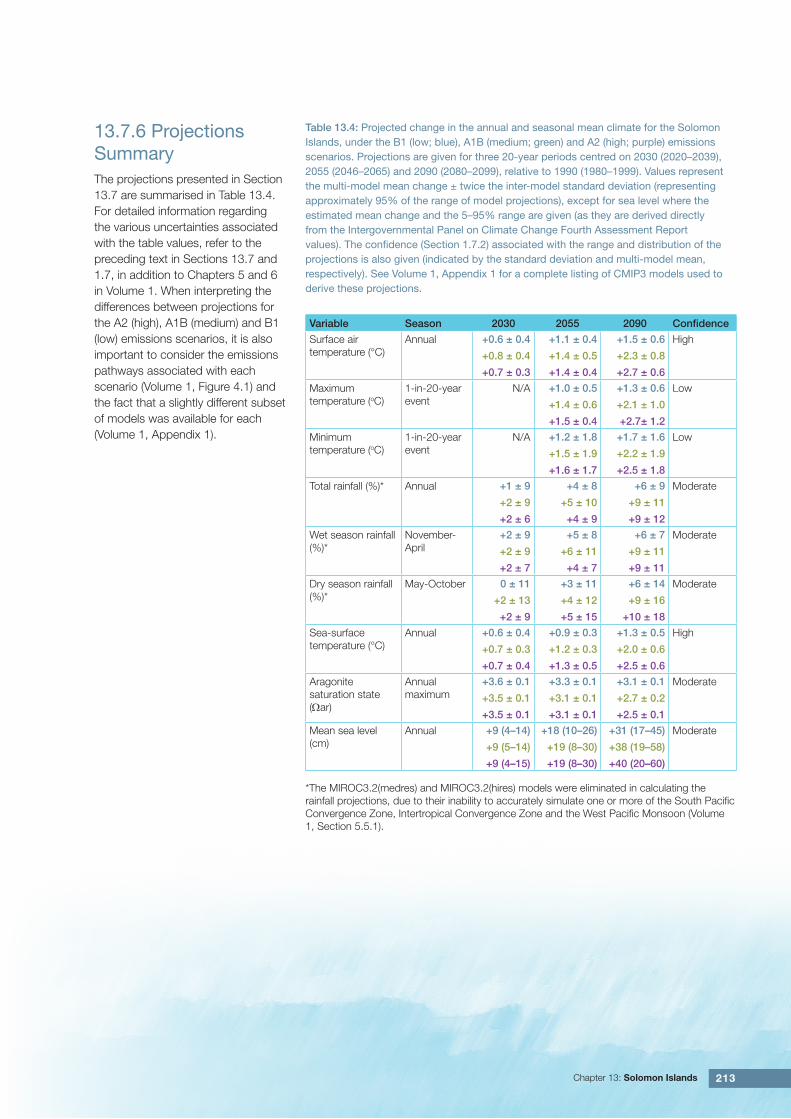
13.7.6 Projections SummaryThe projections presented in Section 13.7 are summarised in Table 13.4. For detailed information regarding the various uncertainties associated with the table values, refer to the preceding text in Sections 13.7 and 1.7, in addition to Chapters 5 and 6 in Volume 1. When interpreting the differences between projections for the A2 (high), A1B (medium) and B1 (low) emissions scenarios, it is also important to consider the emissions pathways associated with each scenario (Volume 1, Figure 4.1) and the fact that a slightly different subset of models was available for each (Volume 1, Appendix 1).
Table 13.4: Projected change in the annual and seasonal mean climate for the Solomon Islands, under the B1 (low; blue), A1B (medium; green) and A2 (high; purple) emissions scenarios. Projections are given for three 20-year periods centred on 2030 (2020–2039), 2055 (2046–2065) and 2090 (2080–2099), relative to 1990 (1980–1999). Values represent the multi-model mean change ± twice the inter-model standard deviation (representing approximately 95% of the range of model projections), except for sea level where the estimated mean change and the 5–95% range are given (as they are derived directly from the Intergovernmental Panel on Climate Change Fourth Assessment Report values). The confidence (Section 1.7.2) associated with the range and distribution of the projections is also given (indicated by the standard deviation and multi-model mean, respectively). See Volume 1, Appendix 1 for a complete listing of CMIP3 models used to derive these projections.
Variable Season 2030 2055 2090 Confidence
Surface air temperature (°C)
Annual +0.6 ± 0.4
+0.8 ± 0.4
+0.7 ± 0.3
+1.1 ± 0.4
+1.4 ± 0.5
+1.4 ± 0.4
+1.5 ± 0.6
+2.3 ± 0.8
+2.7 ± 0.6
High
Maximum temperature (oC)
1-in-20-year event
N/A +1.0 ± 0.5
+1.4 ± 0.6
+1.5 ± 0.4
+1.3 ± 0.6
+2.1 ± 1.0
+2.7± 1.2
Low
Minimum temperature (oC)
1-in-20-year event
N/A +1.2 ± 1.8
+1.5 ± 1.9
+1.6 ± 1.7
+1.7 ± 1.6
+2.2 ± 1.9
+2.5 ± 1.8
Low
Total rainfall (%)* Annual +1 ± 9
+2 ± 9
+2 ± 6
+4 ± 8
+5 ± 10
+4 ± 9
+6 ± 9
+9 ± 11
+9 ± 12
Moderate
Wet season rainfall (%)*
November-April
+2 ± 9
+2 ± 9
+2 ± 7
+5 ± 8
+6 ± 11
+4 ± 7
+6 ± 7
+9 ± 11
+9 ± 11
Moderate
Dry season rainfall (%)*
May-October 0 ± 11
+2 ± 13
+2 ± 9
+3 ± 11
+4 ± 12
+5 ± 15
+6 ± 14
+9 ± 16
+10 ± 18
Moderate
Sea-surface temperature (°C)
Annual +0.6 ± 0.4
+0.7 ± 0.3
+0.7 ± 0.4
+0.9 ± 0.3
+1.2 ± 0.3
+1.3 ± 0.5
+1.3 ± 0.5
+2.0 ± 0.6
+2.5 ± 0.6
High
Aragonite saturation state (Ωar)
Annual maximum
+3.6 ± 0.1
+3.5 ± 0.1
+3.5 ± 0.1
+3.3 ± 0.1
+3.1 ± 0.1
+3.1 ± 0.1
+3.1 ± 0.1
+2.7 ± 0.2
+2.5 ± 0.1
Moderate
Mean sea level (cm)
Annual +9 (4–14)
+9 (5–14)
+9 (4–15)
+18 (10–26)
+19 (8–30)
+19 (8–30)
+31 (17–45)
+38 (19–58)
+40 (20–60)
Moderate
*The MIROC3.2(medres) and MIROC3.2(hires) models were eliminated in calculating the rainfall projections, due to their inability to accurately simulate one or more of the South Pacific Convergence Zone, Intertropical Convergence Zone and the West Pacific Monsoon (Volume 1, Section 5.5.1).