Embed Size (px)
Citation preview

Climate change in the Townsville-Thuringowa Region
This regional summary describes the projected climate change for the Townsville-Thuringowa (TT) region.
Projected average temperature, rainfall and evaporation for 2030, 2050 and 2070 under low, medium and high greenhouse gas emissions scenarios are compared with historical climate records.
Rainfall DataTemperature Data
TT_FIGURE 1
New South Wales
Charters TowersRegional Council
TownsvilleCity
Council
HinchinbrookShire
Council
BurdekinShire
Council
TownsvilleAero
Charters TowersAirport
KalamiaEstate
MacknadeSugar Mill
Phot
o: T
ouris
m Q
ueen
slan
d

ClimateQ: toward a greener QueenslandTT2
Key findingsTemperature
Average annual temperature in the TT region has increased • by 0.2 °C over the last decade (from 23.3 °C to 23.5 °C).
Projections indicate an increase of up to 4.2 °C by 2070, leading • to annual temperatures well beyond those experienced over the last 50 years.
By 2070, Townsville may have ten times the number of hot days • over 35 °C (increasing from an average of four per year to an average of 40 per year by 2070) and Charters Towers may have more than double (increasing from an average of 50 per year to an average of 136 per year by 2070).
RainfallAverage annual rainfall in the last decade fell more than four • per cent compared with the previous 30 years. This is generally consistent with natural variability experienced over the last 110 years, which makes it difficult to detect any influence of climate change at this stage.
Models have projected a range of rainfall impacts from an • annual increase of 19 per cent to a decrease of 32 per cent by 2070. A decrease in rainfall is projected by the majority of models under all emissions scenarios.
EvaporationProjections indicate annual potential evaporation could increase • 7–15 per cent by 2070.
Extreme eventsThe 1-in-100-year storm tide event is projected to increase by 34 cm • in Townsville if certain conditions eventuate. These conditions are a 30 cm sea-level rise, a 10 per cent increase in cyclone intensity and frequency, as well as a 130 km shift southwards in cyclone tracks.
A regional profile
Climate and landscapeThe region’s tropical climate is characterised by relatively high temperatures throughout the year and pronounced wet and dry seasons and high intensity tropical storms.
High summer temperatures generally peak in January and are usually accompanied by high humidity levels. Rainfall occurs predominantly between November and April mainly in the form of short duration, high intensity tropical storms which can cause flooding.
The region is occasionally affected by cyclones, flooding, storm surges and wind damage, all of which need to be considered in planning for the region.
Diversity of landforms and natural environments dominate and include three strongly differentiated regions, the Brigalow Belt in the south, the Einasleigh Uplands in the west and the Wet Tropics in the north.
A third of the region is composed of mountainous and hilly areas. The entire length of the region is bounded by the coast line, which comprises beaches, beach ridges, mangrove estuaries, saltpans and coastal swamps.
Demographics In 2007, the region’s population was 214 618 and is projected to increase beyond 302 000 by 2026.
The region has been inhabited by the Australian Indigenous people for at least 40 000 years.
(OESR, 2007; DIP, 2008)
Phot
o: T
ouris
m Q
ueen
slan
d
ClimateQ: toward a greener Queensland TT3
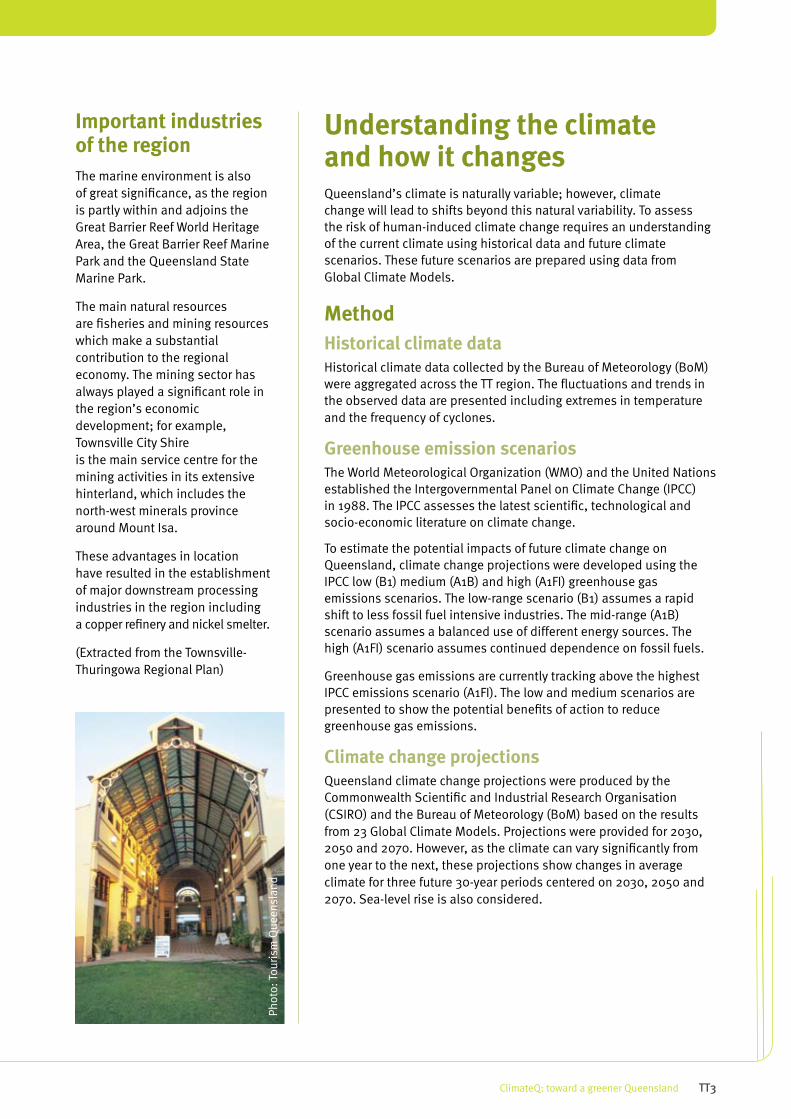
Important industries of the regionThe marine environment is also of great significance, as the region is partly within and adjoins the Great Barrier Reef World Heritage Area, the Great Barrier Reef Marine Park and the Queensland State Marine Park.
The main natural resources are fisheries and mining resources which make a substantial contribution to the regional economy. The mining sector has always played a significant role in the region’s economic development; for example, Townsville City Shire is the main service centre for the mining activities in its extensive hinterland, which includes the north-west minerals province around Mount Isa.
These advantages in location have resulted in the establishment of major downstream processing industries in the region including a copper refinery and nickel smelter.
(Extracted from the Townsville-Thuringowa Regional Plan)
Understanding the climate and how it changesQueensland’s climate is naturally variable; however, climate change will lead to shifts beyond this natural variability. To assess the risk of human-induced climate change requires an understanding of the current climate using historical data and future climate scenarios. These future scenarios are prepared using data from Global Climate Models.
MethodHistorical climate dataHistorical climate data collected by the Bureau of Meteorology (BoM) were aggregated across the TT region. The fluctuations and trends in the observed data are presented including extremes in temperature and the frequency of cyclones.
Greenhouse emission scenariosThe World Meteorological Organization (WMO) and the United Nations established the Intergovernmental Panel on Climate Change (IPCC) in 1988. The IPCC assesses the latest scientific, technological and socio-economic literature on climate change.
To estimate the potential impacts of future climate change on Queensland, climate change projections were developed using the IPCC low (B1) medium (A1B) and high (A1FI) greenhouse gas emissions scenarios. The low-range scenario (B1) assumes a rapid shift to less fossil fuel intensive industries. The mid-range (A1B) scenario assumes a balanced use of different energy sources. The high (A1FI) scenario assumes continued dependence on fossil fuels.
Greenhouse gas emissions are currently tracking above the highest IPCC emissions scenario (A1FI). The low and medium scenarios are presented to show the potential benefits of action to reduce greenhouse gas emissions.
Climate change projectionsQueensland climate change projections were produced by the Commonwealth Scientific and Industrial Research Organisation (CSIRO) and the Bureau of Meteorology (BoM) based on the results from 23 Global Climate Models. Projections were provided for 2030, 2050 and 2070. However, as the climate can vary significantly from one year to the next, these projections show changes in average climate for three future 30-year periods centered on 2030, 2050 and 2070. Sea-level rise is also considered.
Phot
o: T
ouris
m Q
ueen
slan
d

ClimateQ: toward a greener QueenslandTT4
The increase in annual maximum temperature is presented in Figure 1. The trend over time is represented by the black line in each graph. The change in maximum temperatures is much greater in the autumn, with the average over the last decade increasing by 0.9 °C, compared to the 1961–1990 average.
Temperature extremes (BoM, 2008)Extremes in temperature (such as a number of days exceeding 35 °C) are single events that usually do not extend past a couple of days. Due to the influence of regional topography, proximity to the ocean and prevailing winds, location-specific data are required when considering changes in these extreme events over time.
While there is no observable increase in the number of days where the maximum temperature exceeds 35 °C for Charters Towers (Figure 2), the historical records indicate a slight increase in the number of hot days for Townsville since the 1970s (Figure 3). Due to its inland location, Charters Towers currently experiences more extreme temperature days than coastal Townsville.
FIGURE RS_TT_2
Num
ber o
f day
s >
35 °
C
Year
0
10
20
30
40
50
60
70
1960 1970 1980 1990 2000
Figure 2: Number of days where the temperature exceeded 35 ˚C for Charters Towers
Blank spaces are those years where the maximum temperature did not exceed 35 °C. ‘X’ denotes the year for which the full data set is not available (i.e. the actual values may in fact be greater than what is shown).
Data source: BoM, 2008, 2008
There is no observable increase in the number of days over 35 °C for Charters Towers
Current climate
Temperature (BoM, 2008)Historical temperature records indicate the average temperature in the TT region has risen, with this increase accelerating over the last decade (1998–2007). The average annual temperature was 23.3 °C in the 30-year period from 1971–2000, which is a 0.1 °C increase on the 1961–1990 average. However, over the last decade it has risen by a further 0.2 °C, suggesting an accelerated rise in temperature.
FIGURE RS_TT_1
2829303132
3132333435
2728293031
2324252627
2930313233
29.229.6
32.732.9
28.729.6
24.324.8
30.831.2
Max
imum
Tem
pera
ture
(°C)
Year
1950 1960 1970 1980 1990 2000
Annual
Summer
Autumn
Winter
Spring
Figure 1: Historical maximum, temperature for the Townsville-Thuringowa region for the period 1950–2007, compared to the base period 1961–1990
The black line is a five-year running average. The mean for both the baseline 1961–1990 and the last decade 1998–2007 are shown by the green lines and indicated numerically at the right of the graph. Note: vertical scales may differ between graphs.
Data source: BoM, 2008
Average maximum temperature has risen in Townsville-Thuringowa region

ClimateQ: toward a greener Queensland TT5
Rainfall (BoM, 2008)Annual and seasonal average rainfall is strongly influenced by natural variability, local factors such as topography and vegetation, and broader scale weather patterns, for example El Niño-Southern Oscillation (ENSO) events. To understand how this natural temporal variation changes rainfall patterns, long-term rainfall records are required. The BoM has been collecting rainfall data for the Townsville-Thuringowa region since 1897.
The variability in annual and seasonal rainfall is outlined in Figure 4. The series of wet years in the 1950s and 1970s contrast with the dry period experienced in the 1960s. Over the last two decades, a pattern of 3–4 dry years followed by 2–3 wet years has been repeated.
Figure 4 shows the dominant summer rainfall pattern with a 1961–1990 average rainfall around 415 mm, compared to an autumn average (the next most dominant rainfall period) of around 215 mm.
Over the most recent decade, there has been a 26 per cent decline in autumn rainfall, compared to the 1961–1990 average.
FIGURE RS_TT_3
Num
ber o
f day
s >
35 °
C
Year
0
2
4
6
8
10
12
14
16
1940 1950 1960 1970 1980 1990 2000
Figure 3: Number of days where the temperature exceeded 35 ˚C for Townsville
Blank spaces are those years where the maximum temperature did not exceed 35 °C. ‘X’ denotes year for which the full data set is not available (i.e. the actual values may in fact be greater than what is shown).
Data source: BoM, 2008
The number of days over 35 ˚C has risen in Townsville
FIGURE RS_TT_4
Annual
Summer
Autumn
Winter
Spring
Tota
l rai
nfal
l (m
m)
1900 1920 1940 1960 1980 2000
Year
500
1000
1500
200400600800
10001200
0
200
400
600
0
100
200
0
100
200
300
778774(0.5%)
439415(5.8%)
215159(−25.7%)
6750(33.8%)
11993(28.1%)
Figure 4: Historical annual and seasonal total rainfall for the Townsville-Thuringowa region for the period 1897–2007
The black line is a five-year running average. The mean for both the baseline 1961–1990 and the last decade 1998–2007 are shown by the green lines and indicated numerically at the right of the graph. The difference in rainfall between the baseline and last decade is shown in per cent. Note: vertical scales may differ between graphs.
Data source: BoM, 2008
Historical rainfall shows high variability
Phot
o: T
ouris
m Q
ueen
slan
d

ClimateQ: toward a greener QueenslandTT6
EvaporationPotential evaporation is a measure of the evaporative (or drying) power of the atmosphere. The potential evaporation rate assumes that there is an unlimited supply of water to evaporate (either from the soil or from water bodies). Although potential evaporation can differ from actual evaporation, a change in potential evaporation gives a good indication of the change in the evaporative power of the atmosphere.
Networks to measure potential evaporation are not as well developed as those that measure temperature and rainfall and there are insufficient data available to indicate the changes over time.
Averaged over the Townsville-Thuringowa region, the annual mean potential evaporation over the period 1971–2000 (2025 mm) is over twice the annual mean rainfall over the same period (813 mm), which contributes to the depletion of soil moisture.
Cyclones Strong winds, intense rainfall and ocean effects such as extreme waves combine to make the total cyclone hazard. This hazard is greatest in Queensland between January and March, but tropical cyclones in Queensland can occur anytime over the period from November to April.
The TT region is often exposed to the risk of cyclones with at least one cyclone a decade being detected in the region since the early 1900s (Figure 5).
In some areas of Queensland, there is a relationship between the impact of cyclones on eastern Australia and the El Niño-Southern Oscillation (ENSO) phenomenon. However, this pattern is not evident for the TT region (Figure 5).
Projected climate change in Townsville-ThuringowaGlobal Climate Models simulate the earth’s climate system using a complex set of mathematical rules that describe the physical processes of the atmosphere, ocean, land and ice. They are currently considered to be the best tools for projecting climate change. CSIRO has recently released climate change projections for Australia (CSIRO & BoM, 2007) based on the results from 23 Global Climate Models. Projections for the TT region have been extracted from this dataset for the Queensland Climate Change Centre of Excellence (QCCCE). The projections presented here are relative to the base period of 1980–1999.
The Global Climate Models show little difference under the low, medium and high emissions scenarios to 2030. Therefore, the 2030 climate change projections for Townsville-Thuringowa have been presented on a mid-range emissions scenario.
However, the projections diverge at 2050 under different emissions scenarios. Therefore, the 2050 and 2070 projections are based on low and high emissions scenarios.
The full range of projected changes for temperature, rainfall and potential evaporation for Townsville-Thuringowa in 2030, 2050 and 2070 are described in Table 2. The numbers shown in brackets indicate the range of the results from the Global Climate Models.
Overview of climate projectionsIn summary, the changes to temperature and rainfall under the three emissions scenarios are:
2030 (medium emissions scenario)Annual and seasonal temperature• : annual mean temperature (average of all daily temperatures within a given year) is projected to increase by 0.9 °C. There is little variation in projections across the seasons.
Annual and seasonal rainfall• : annual rainfall ( the total rainfall received within a given year) is projected to decrease by two per cent (-16 mm). The largest seasonal decrease of seven per cent (-8 mm) is projected for spring.
FIGURE RS_TT_5
Num
ber o
f cyc
lone
s
Decade
0
2
4
6
8
10
12
1997–20061987–1996
1977–19861967–1976
1957–19661947–1956
1937–19461927–1936
More La Niña events More El Niño events
Overland Total
1917–19261907–1916
Figure 5: Total and overland number of tropical cyclones for the Townsville-Thuringowa Region for the period 1907– 2006Adapted from BoM, 2008
El Niño and La Niña weather patterns across the Townsville-Thuringowa region

ClimateQ: toward a greener Queensland TT7
Annual and seasonal potential evaporation• : across all seasons the annual ‘best estimate’ increase is projected to be around 3–4 per cent (61–81 mm), with some models projecting up to a six per cent increase in winter (21 mm) and autumn (27 mm).
2050 (low and high emissions scenarios)Annual and seasonal temperature• : annual temperature is projected to increase by 1.1 °C and 1.9 °C under the low and high emissions scenarios respectively. There is little variation in projections across the seasons.
Annual and seasonal rainfall• : annual rainfall is projected to decrease by three per cent (-24 mm) and five per cent (-41 mm) under the low and high emissions scenarios respectively. The largest seasonal decrease of 13 per cent (-14 mm) under the high emissions scenario is projected for spring.
Annual and seasonal potential evaporation• : under a high emissions scenario an increase in annual potential evaporation of up to nine per cent (182 mm) is projected with the best estimate being seven per cent (142 mm). Autumn, winter and summer are projected to have the greatest increases of up to 11 per cent (50 mm, 38 mm and 67 mm respectively).
2070 (low and high emissions scenarios)Annual and seasonal temperature• : annual temperature is projected to increase by 1.6 °C and 3.0 °C under the low and high emissions scenarios respectively. There is little variation in projections across the seasons.
Annual and seasonal rainfall• : annual rainfall is projected to decrease by four per cent (-33 mm) and seven per cent (-57 mm) under the low and high emissions scenarios respectively. The largest seasonal decrease under a high emissions scenario of 20 per cent (-22 mm) is projected for spring.
Annual and seasonal potential evaporation• : under a high emissions scenario, annual evaporation is projected to increase by as much as 15 per cent (304 mm). Autumn and winter are projected to be the seasons most impacted with increases up to 18 per cent (81 mm and 63 mm respectively) in some models.
Temperature extremesGlobal Climate Models indicate that increasing greenhouse gas concentrations in the atmosphere will increase the likelihood of a record high temperature in a given region. The Global Climate Models project a rise in extreme temperatures (CSIRO & BoM, 2007). Table 1 shows the projected number of days above 35 °C for two observing stations in the Townsville-Thuringowa region with good historical records.
Under a high emissions scenario in 2070 for Charters Towers the number of hot days above 35 °C are projected to more than double from 50 days to 136 days. Under the same scenario for Townsville, the number of hot days would increase ten-fold, from four days to 40 days.
TABLE 1.
401216874(19–91)(7–21)(9–31)(6–13)(6–9)
Townsville
1368998797450(104–169)(77–109)(81–124)(68–91)(65–84)
Charters Towers
Station Name Current 2030Mid
2050Low
2050High
2070Low
2070High
Table 1: Number of hot days per year above 35 °C projected for 2030 (mid emissions scenario) and 2050 and 2070 (low and high emissions scenarios)Current number of days calculated using a base period of 1971–2000.
Phot
o: T
ouris
m Q
ueen
slan
d

ClimateQ: toward a greener QueenslandTT8
Cyclones and sea-level riseExtreme weather events, such as cyclones, have a complex link to ocean surface temperatures, characteristics of a region and global climate patterns such as the ENSO, making it difficult to predict their frequency of occurrence. This results in discrepancies in cyclone frequencies between different climate models.
Recent studies have projected a slight decrease (nine per cent) in tropical cyclone frequency off the east coast of Australia by 2070 (Abbs et al, 2006). However, they also simulate an increase in the number of long-lived and severe (Category 3–5) eastern Australian tropical cyclones. Under three different studies the number of severe tropical cyclones is projected to increase by 56 per cent by 2050 (Walsh et al, 2004), 22 per cent by 2050 (Leslie et al, 2007) and 140 per cent by 2070 (Abbs et al, 2006).
Projected southward shifts in the primary regions of cyclone development through the coming century (Abbs et al, 2006, Leslie et al, 2007) could result in a greater cyclone impact in the TT Region. With changes
in the intensity of future cyclones and projected rise in mean sea levels (CSIRO & BoM, 2007), storm surges will be able to penetrate further inland greatly contributing to damage to natural ecosystems (e.g. Great Barrier Reef) and infrastructure and the risk of erosion in low-lying coastal regions.
The 1-in-100-year storm tide event is projected to increase by 34 cm in Townsville if certain conditions eventuate. These conditions are a 30 cm sea-level rise, a 10 per cent increase in cyclone intensity and frequency, as well as a 130 km shift southwards in cyclone tracks (Hardy et al, 2004).
According to the IPCC, global sea-level is projected to rise by 18 to 59 cm by 2100, with a possible additional contribution from melting ice sheets of 10 to 20 cm (IPCC, 2007).
These rises in sea levels will have serious implications for the coastal communities and ecological assets of the Townsville-Thuringowa region, ranging from contaminated fresh water aquifers through to regular inundation of critical infrastructure.
Phot
o: T
ouris
m Q
ueen
slan
d

ClimateQ: toward a greener Queensland TT9
Variable Season
(1971–2000)2030† 2050† 2070†
Emissions Scenarios
Current historical
mean*
medium low high low high
Projected Changes#
Temperature
°C
Annual 23.3 °C +0.9 [+0.6 to +1.3]
+1.1 [+0.8 to +1.6]
+1.9 [+1.3 to +2.6]
+1.6 [+1.1 to +2.2]
+3.0 [+2.1 to +4.2]
Summer 27.3 °C +0.9 [+0.6 to +1.4]
+1.2 [+0.8 to +1.7]
+1.9 [+1.2 to +2.7]
+1.6 [+1.0 to +2.3]
+3.0 [+2.0 to +4.4]
Autumn 23.5 °C +0.9 [+0.6 to +1.3]
+1.1 [+0.8 to +1.6]
+1.8 [+1.2 to +2.7]
+1.5 [+1.0 to +2.2]
+3.0 [+2.0 to +4.3]
Winter 18.1 °C +0.9 [+0.6 to+1.3]
+1.1 [+0.8 to +1.6]
+1.9 [+1.3 to +2.6]
+1.5 [+1.0 to +2.2]
+3.0 [+2.0 to +4.3]
Spring 24.4 °C +0.9 [+0.6 to 1.3]
+1.1 [+0.8 to +1.6]
+1.9 [+1.3 to +2.6]
+1.6 [+1.1 to +2.2]
+3.0 [+2.1 to +4.2]
Rainfall
%
Annual 813 mm -2 [-12 to +6]
-3 [-13 to +7]
-5 [-21 to +12]
-4 [-18 to +10]
-7 [-32 to +19]
Summer 441 mm -2 [-12 to +8]
-2 [-13 to +10]
-3 [-21 to +16]
-3 [-18 to +13]
-5 [-32 to +25]
Autumn 209 mm -3 [-17 to +12]
-3 [-19 to +14]
-5 [-31 to +23]
-4 [-26 to +19]
-8 [-44 to +37]
Winter 51 mm -2 [-17 to +12]
-3 [-19 to +15]
-4 [-31 to +24]
-4 [-27 to +20]
-7 [-45 to +39]
Spring 109 mm -7 [-21 to +6]
-8 [-23 to +7]
-13 [-37 to +12]
-11 [-32 to +10]
-20 [-52 to +19]
Potential
evaporation
%
Annual 2025 mm +3 [+2 to +5]
+4 [+2 to +5]
+7 [+4 to +9]
+5 [+4 to +8]
+11 [+7 to +15]
Summer 608 mm +3 [+2 to +5]
+3 [+2 to +4]
+6 [+3 to +11]
+5 [+3 to +9]
+10 [+5 to +17]
Autumn 450 mm +4 [+2 to +6]
+4 [+2 to +6]
+7 [+4 to +11]
+6 [+4 to +9]
+12 [+7 to +18]
Winter 348 mm +4 [+2 to +6]
+5 [+3 to +7]
+7 [+4 to +11]
+6 [+4 to +9]
+12 [+7 to +18]
Spring 617 mm +3 [+2 to +4]
+4 [+2 to +5]
+6 [+4 to +9]
+5 [+3 to +7]
+9 [+6 to +14]
Table 2. Summary of projections for the Townsville-Thuringowa region** To enable the projections for each of the regions to be referenced against historical climate, observational means have been calculated using a 30-year base period of 1971–2000. # Projections represent the change in temperature, relative change in rainfall and potential evaporation relative to the model base period of 1980–1999. The numbers in brackets are the 10th and 90th percentiles and depict the range of uncertainty; the number outside the brackets is the 50th percentile (i.e. the best estimate). The changes are the average change over the region.
† These projections show changes in average climate for three future 30-year periods centred on 2030, 2050 and 2070. Data source: CSIRO & BoM 2007. Regional summaries prepared by QCCCE.)

ClimateQ: toward a greener QueenslandTT10
Heatwaves characterised by extreme • temperatures—high 30s or even 40s—persisting for a number of days, can result in significant health impacts such as heat exhaustion and increased mortality among vulnerable sectors of the community such as the very young or old. It may be more difficult for locations that have not typically experienced these extremes on a regular basis to adapt to these conditions.
Tropical diseases such as the Ross River virus are • also expected to increase under climate change. Changes in rainfall, high tides and maximum temperatures have all been shown to be key determinants of Ross River virus transmission (Tong et al, 2004). For another example, the number of cases of dengue fever in Australia is projected to increase from 310 000 in 2000, to 540 000 by 2030 under the high global emissions mitigation scenario.
Higher temperatures are likely to exacerbate • existing problems of poor pasture quality. In addition, increased thermal stress of animals is very likely, particularly away from the coastline, and can reduce animal production, reproductive performance and enhance mortality.
Tropical weeds may increase in abundance • and distribution. Less rainfall and increasing evaporation will also deplete soil moisture, ground cover and stock carrying capacity. Overall it is likely that pastures may decline in quality, causing lower animal production.
The Townsville City Council has recently responded to the potential climate change risks by commissioning the CSIRO to prepare a report (CSIRO, 2008) on climate change projections for Townsville, addressing a range of climate variables. The report identified that in addition to extreme events such as cyclones and sea-level rise, droughts are likely to be more frequent and affect larger areas, and the frequency of extreme fire-weather conditions is likely to increase.
Impacts of climate change on the Townsville-Thuringowa regionProjections for the TT region include a decline in rainfall with increasing temperature and evaporation, in conjunction with more extreme climate events, such as cyclonic weather and a rise in sea levels. The temperature projections for inaction on climate change suggest a temperature increase well outside the range of temperatures ever experienced over the last 50 years. The projections for temperature and hot days are all in the same direction—increasing.
Climate change is likely to pose challenges for the TT region, particularly in relation to the management of the region’s agricultural, horticulture and tourism activities:
Increased temperatures are likely to cause more • regular coral bleaching in the Great Barrier Reef. These bleaching events are very likely to become more severe as temperatures increase and such events could occur annually by 2050. As a consequence of this, the Great Barrier Reef is very unlikely to survive in its present form. The degradation of the reef will not only be a loss of great intrinsic value, it will also come at a great cost to the tourism industry (NRM, 2004).
In addition, the increasing concentration of carbon • dioxide is causing increased acidification of sea water which, in turn, impacts the coral formation (De’ath et al, 2009). This adds a further dimension to the Great Barrier Reef’s vulnerability to climate change.
Higher mean sea levels will enable inundation • and waves resulting from storm surges to penetrate further inland, increasing flooding, erosion and damage to infrastructure and natural ecosystems.
People will also be affected, as the rate of heat-• related health problems increases and increased exposure to catastrophic events, such as cyclones and flooding endanger lives and property.
Phot
o: T
ouris
m Q
ueen
slan
d

ClimateQ: toward a greener Queensland TT11
References
Abbs D, Aryal S, Campbell E, McGregor J, Nguyen K, Palmer M, Rafter A, Watterson I and Bates B 2006, Projections of Extreme Rainfall and Cyclones: Final Report to the Australian Greenhouse Office, CSIRO Marine and Atmospheric Research, Canberra, <www.cmar.csiro.au/e-print/open/abbsdj_2006b.pdf>
Bureau of Meteorology (BoM) 2008, Bureau of Meteorology, Canberra, <www.bom.gov.au/silo/products/cli_chg>
Commonwealth Scientific and Industrial Research Organisation (CSIRO) and BoM 2007, Climate Change in Australia: Technical Report 2007, CSIRO, Melbourne, <www.climatechangeinaustralia.gov.au>
CSIRO 2008, Climate change projections for the Townsville region. Report prepared for the Townsville City Council, Commonwealth Scientific and Industrial Research Organisation, Canberra, <http://www.seao2.com/climatechangeintownsville/report.html>
Department of Infrastructure and Planning (DIP) 2000, Townsville-Thuringowa Regional Plan, Department of Infrastructure and Planning, Brisbane, <http://www.dip.qld.gov.au/regional-planning/townsville-thuringowa.html>
DIP 2008, Queensland Future Populations: Appendix C (based on reformed Local Government Areas), Department of Infrastructure and Planning, Brisbane, <www.dip.qld.gov.au/resources/report/future-population/appendix-c.xls>
Department of Natural Resources and Mines 2004, Climate Change: the Challenge for Natural Resource Management, Department of Natural Resources and Mines, Brisbane, <http://www.longpaddock.qld.gov.au/AboutUs/Publications/ByType/Reports/ClimateChange/ChallengeForNaturalResourceManagement/Booklet_HighQuality.pdf>
De’ath G, Lough JM and Fabricius KE 2009, Declining Coral Calcification on the Great Barrier Reef, Science, 323:5910, <http://www.sciencemag.org/cgi/content/abstract/sci;323/5910/116>
Hardy T, Mason L, Astorquia A and Harper BA 2004, Queensland Climate Change and Community Vulnerability to Tropical Cyclones: Ocean Hazards Assessment Stage 3. Report to the Queensland Department of Natural Resources and Mines, Brisbane, <www.longpaddock.qld.gov.au/AboutUs/Publications/ByType/Reports/ClimateChange/VulnerabilityToTropicalCyclones/Stage3/FullReportHighRes.pdf>
Intergovernmental Panel on Climate Change (IPCC) 2007, Climate Change 2007: Synthesis Report. Contribution of Working Groups I, II and III to the Fourth Assessment Report of the Intergovernmental Panel on Climate Change [Core Writing Team, Pachauri, RK and Reisinger, A (eds.)]. IPCC, Geneva, Switzerland,<http://www.ipcc.ch/pdf/assessment-report/ar4/syr/ar4_syr.pdf>
Leslie LM, Karoly DJ, Leplastrier M and Buckley BW 2007, Variability of Tropical Cyclones over the Southwest Pacific Ocean using High Resolution Climate Model, Meteorology and Physics 97 (Special Issue on Tropical Cyclones), <ftp.gfdl.noaa.gov/pub/rt/Leslieetal97.pdf>
Office of Economic and Statistical Research 2007, Queensland Regional Profiles, (based on reformed Local Government Areas), Office of Economic and Statistical Research, Brisbane, <statistics.oesr.qld.gov.au/qld-regional-profiles>
Tong S, Hu W and McMichael AJ 2004, Climate variability and Ross River virus transmission in Townsville region, Australia 1985 to 1996, Tropical Medicine and International Health 9:2, <http://eprints.qut.edu.au/8888/1/8888.pdf>
Walsh KJE, Nguyen KC and McGregor JL 2004, Finer resolution regional climate model simulations of the impact of climate change on tropical cyclones near Australia, Climate Dynamics, 22:1, <www.springerlink.com/content/brmpmturdqvxh3vv>
Phot
o: T
ouris
m Q
ueen
slan
d