Embed Size (px)
Citation preview

Federal Highway Administration Climate Change Mitigation Peer Exchanges: Comprehensive Report The Role of State Departments of Transportation (DOTs) and Metropolitan Planning Organizations (MPOs) in Climate Change Mitigation Summary of three peer exchanges held 2011 – 2012.
DTFH61-11-F-00003 August 20, 2012
Prepared for Federal Highway Administration Prepared by ICF International 1725 Eye Street NW, Suite 1000 Washington, DC 20006
1
1. Introduction and Background Between June 2011 and April 2012, the Federal Highway Administration (FHWA) convened three peer exchanges for transportation agencies to share information related to climate change mitigation activities. The first of the peer exchanges brought together staff from State departments of transportation (DOTs) and the following two brought together staff from metropolitan planning organizations (MPOs). The peer exchanges were held at the following dates and locations:
• The Role of State DOTs in Climate Change Mitigation: Baltimore, MD, June 14 – 15, 2011. Hosted by tThe FHWA Resource Center.
• The Role of MPOs in Climate Change Mitigation: St. Louis, MO, November 4 – 5, 2011. Hosted by the East-West Gateway Council of Governments.
• The Role of MPOs in Climate Change Mitigation: Chicago, IL, April 12 – 13, 2012. Hosted by the Chicago Metropolitan Agency for Planning.
The purpose of the exchanges was to provide a venue for staff to learn about successful strategies from their peers and discuss challenges they face and ways to overcome these challenges. Each exchange brought together 12 – 15 representatives of State DOTs or MPOs with a range of levels of experience in activities related to climate change mitigation and greenhouse gas (GHG) emissions analysis.
The peer exchanges were facilitated to allow participants to provide an overview of their experiences and activities related to climate change mitigation and to encourage discussion and interaction among participants in an informal atmosphere.
This report summarizes the key themes and lessons from the peer exchanges, and highlights examples of effective practices presented by participants. It includes the following sections:
• Section 2 – Cross-cutting Issues Facing Transportation Agencies summarizes some of the overarching issues that face many participants and that provide context for their approaches to climate change mitigation.
• Section 3 – GHG Analysis and Incorporating GHGs into the Planning Process provides an overview of the approaches and tools being used for GHG analysis, challenges associated with these methods, and effective practices for integrating GHG considerations in planning.
• Section 4 – Implementing GHG Mitigation Strategies describes approaches to GHG mitigation being used, findings about their effectiveness, and motivations for using these strategies.
• Section 5 – Participant Recommendations and Future Needs presents resource and policy needs that participants identified during the exchanges.
Reports covering each exchange individually are available on the FHWA website.
2. Cross-cutting Issues Facing Transportation Agencies Presentations and discussions at the three exchanges demonstrated that political, regulatory, geographic, and economic context significantly affect how a region or Sstate approaches climate change mitigation. Some of the most salient factors and their impacts on mitigation are outlined below.
Political and Regulatory Themes Uncertainty regarding Federal transportation and climate policy leaves States and regions unsure of how to proceed. The three peer exchanges took place before the passage of the surface transportation reauthorization, 'Moving Ahead for Progress in the 21st Century Act' (MAP-21), and peer exchange participants expressed concerns about uncertainties regarding reauthorization and requirements related to transportation programs, greenhouse gas analysis, and climate change strategies. Similarly, participants expressed concerns that Federal action on climate change – whether through national legislation or

2
regulatory action – such as possible cap-and-trade legislation, vehicle carbon dioxide emissions standards, or other policies, could change their preferred strategies.
Attainment status under the Clean Air Act affects existing modeling capabilities and funding availability for emissions reduction strategies. Regions in nonattainment or maintenance status of the National Ambient Air Quality Standards (NAAQS) for criteria pollutants (carbon monoxide, nitrous oxides, ozone, and particulate matter) have experience with conducting regional emissions analysis for conformity. As a result, they are generally better prepared to perform emissions analysis related to GHG emissions, since they often have staff dedicated to this analysis and experience with emissions modeling. Meanwhile, States and MPOs without air quality issues often find it challenging to address GHG emissions. For example, while Vermont has political support for reducing GHG emissions, it has been in attainment for many years and has less of the expertise required to analyze its GHG emissions and strategies. Similarly, areas such as the Miami region, which are in attainment of Federal air quality standards and do not receive Federal money from the Congestion Mitigation and Air Quality Improvement (CMAQ) Program do not have a dedicated source of funding for emissions reduction projects. While CMAQ helps to fund programs that reduce emissions of criteria air pollutants, these programs typically also reduce GHGs.
Level of public interest and belief in climate change affects what is feasible and how it is described and marketed. The degree to which climate change is viewed as a threat and as an appropriate policy priority varies across the country. Some areas recognize it as a critical issue and support MPO or DOT activity to reduce transportation energy intensity, while others are dominated by vocal opponents who do not believe that climate change is occurring or do not believe that it is caused by human activity. Other areas may recognize climate change as a concern, but place a higher emphasis on economic growth or other issues. It is important for transportation agencies to understand the political context related to climate change, and to develop strategies and communicate about them in ways that emphasize benefits of interest to the public and decisionmakers, such as positive economic impacts, saving money, or improving regional air quality.
Economic and Demographic Factors Population growth affects emissions reduction potential. Many of the metropolitan regions represented at the exchanges are growing rapidly, including Atlanta, Houston, San Diego, and Los Angeles. On the one hand, increasing development, if managed well, can help to make transit more viable and support transit-oriented development, which reduces per capita emissions. On the other hand, an increasing population will typically increase total emissions and can expand the metro area’s GHG footprint. A lesson is that it is important to account for population growth if establishing GHG reduction targets, and to use appropriate metrics for communicating the benefits of long-range transportation plan alternatives.
Presence of manufacturing or ports can generate significant freight emissions, which are challenging for States and MPOs to address. While many transportation mitigation strategies focus on passenger travel, freight is a major contributor to GHG emissions that typically falls outside of measures that DOTs and MPOs control, and some participants felt that freight emissions are more appropriately addressed at the national level. Freight traffic is determined by the presence of freight facilities and national or even global economic forces. Furthermore, ports along each coast compete against one another and so are not inclined to take actions that might reduce their competitiveness. Areas with ports or truck freight terminals must accommodate a large amount of truck traffic and idling as trucks wait to load or unload, as materials are transported from trucks to ships, and while ships sit in the harbor. While this activity is positive for the region and Nnation’s economy, States and regions are often challenged in taking actions to reduce freight GHG emissions. Freight-related travel and emissions are also more difficult to predict.

3
3. GHG Analysis and Incorporating GHGs into the Planning Process MPOs and State DOTs have begun to incorporate GHG analysis into their planning efforts. These analyses typically include development of GHG inventories, forecasts, or analyses of the impacts of particular transportation strategies or investments. This section highlights some of the primary themes observed across the three exchanges with regard to how State DOTs and MPOs are approaching GHG analysis and integrating GHG considerations into long-range planning.
State DOTs and MPOs have diverse approaches to GHG analysis Because of differences in their planning processes and roles in the transportation system, State DOTs and MPOs tend to have different levels of experience and expertise in analyzing GHG emissions. In 2010, EPA released the Motor Vehicle Emissions Simulator (MOVES) model, which relies on VMT estimates to generate emissions estimates at the Sstate or county level and incorporates emissions rates based on vehicle type, year, speed, and other factors, allowing it to be more sensitive to changes in these variables. Many MPOs are transitioning from use of the MOBILE model to MOVES for conformity. However, while defaults are available, MOVES requires a large number of inputs, and generating MOVES inputs can be challenging, particularly for Sstates and regions without experience with conformity. In particular, many Sstates do not have statewide travel demand models and have limited modeling capacity to analyze GHG reduction strategies. While most MPOs have regional travel demand models, those in attainment often do not have staff experienced in air quality analysis.
GHG analysis at Sstate DOT and MPO levels has typically occurred during different types of planning processes as described below.
State DOTs: Development of Climate Action Plans
A number of Sstates have developed GHG inventories in order to determine their primary emissions sources as part of their development of a comprehensive climate action plan (CAP) covering all economic sectors. In many Sstates, the State’s environment department led the CAP development process, and the level of DOT engagement has varied. Most of these inventories have quantified on-road GHG emissions based on fuel sales within the Sstate, and these inventories do not always match up well with estimates developed using travel data. Consequently, a number of State DOTs are looking at methodologies to more accurately estimate and forecast GHG emissions within their Sstates. For example:
• Vermont’s GHG inventory in its CAP was developed using S state fuel sales data and the EPA’s State Inventory Tool. Transportation makes up 47 percent of the State’s emissions (significantly above the nationwide average of about 30 percent), and so the Vermont Agency for Transportation (VTrans) subsequently prepared its own agency CAP to address transportation emissions statewide in greater detail.
• Maryland DOT developed an emissions inventory based on fuel sales data as part of a CAP process. However, Maryland DOT found that using fuel sales was unlikely to be accurate in representing emissions from vehicles on the road given high levels of through traffic in Maryland. Consequently, the Sstate used a combination of HPMS data with the MOVES mode and a post-processor software to generate its baseline and forecast. Maryland DOT is now working to develop GHG reduction strategies, with the most recent implementation plan describing actions to reduce emissions statewide released in March 2012.
MPOs: Analysis for the Long Range Planning Process
A number of MPOs have conducted GHG analyses as part of their long range transportation planning process, through development of GHG inventories and/or forecasting of GHG emissions over the time horizon of the plan under multiple scenarios. In some cases, MPOs also have conducted analyses of the potential impacts of
4
strategies or initiatives such as investments in transit or support for biking or walking that are undertaken for the purpose of reducing emissions.
Of the MPOs participating in the peer exchanges, a significant proportion were experienced in both travel and emissions modeling, skills that transfer well to GHG analysis and that have allowed them to use EPA’s MOVES model or other techniques for estimating GHG emissions based on regional VMT. Some lessons learned include the following:
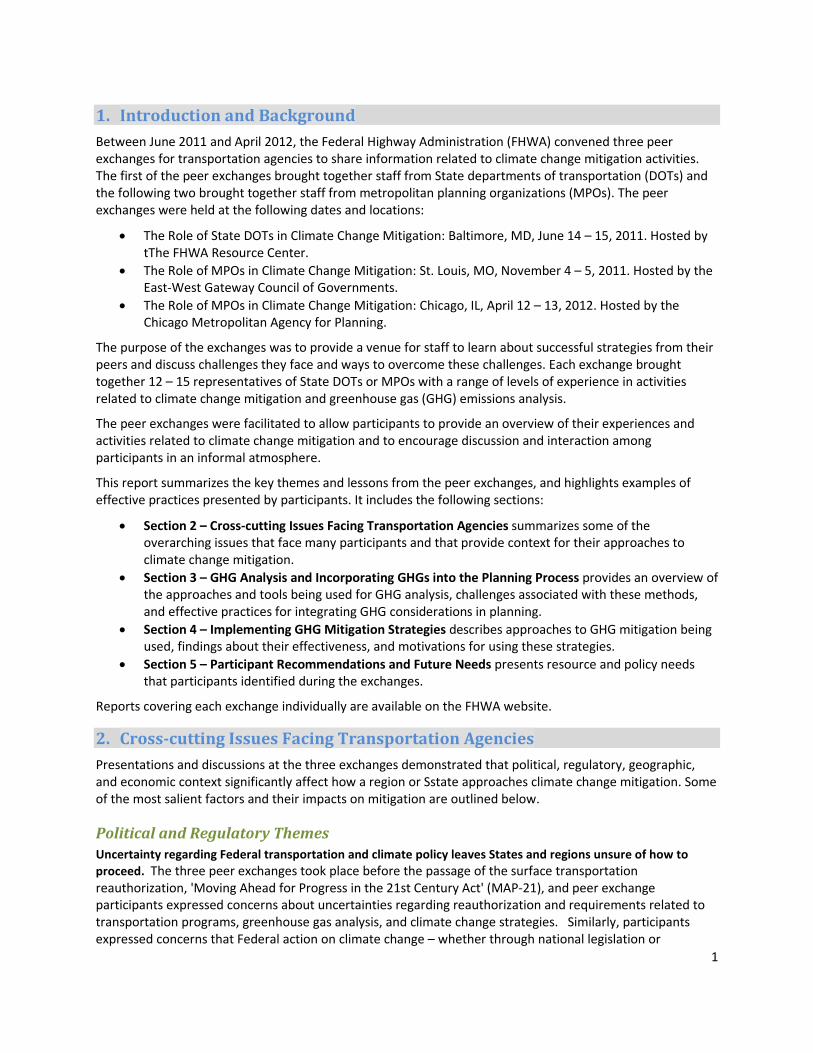
A GHG inventory can be presented in different ways, either assigned to the road network within a region or assigned to the locations that generate emissions. Regional emissions analysis conducted for criteria pollutants as part of the conformity process focuses on estimating the total emissions on the roadway network within a region. However, since GHG emissions are a global problem, not a localized air pollutant, there are different ways to look at transportation GHG emissions sources. Rather than simply calculate emissions in relation to vehicles on the road, some areas have attempted to attribute emissions to generators within the region. For example, in 2009, Delaware Valley Regional Planning Commission (DVRPC), which covers Philadelphia, completed an inventory for the calendar year 2005 using MOBILE6 (the precursor to MOVES). Because of the large number of municipalities in DVRPC’s planning area, DVRPC has been working on allocating emissions and VMT to its various local governments as part of its inventory. Its methodology for this has been to allocate half of a trip’s VMT to the origin and half to the destination but none to any pass-through area. This has allowed DVRPC to demonstrate the different amounts of VMT and GHG per capita associated with different types of land use and land use densities (See Figure 1).
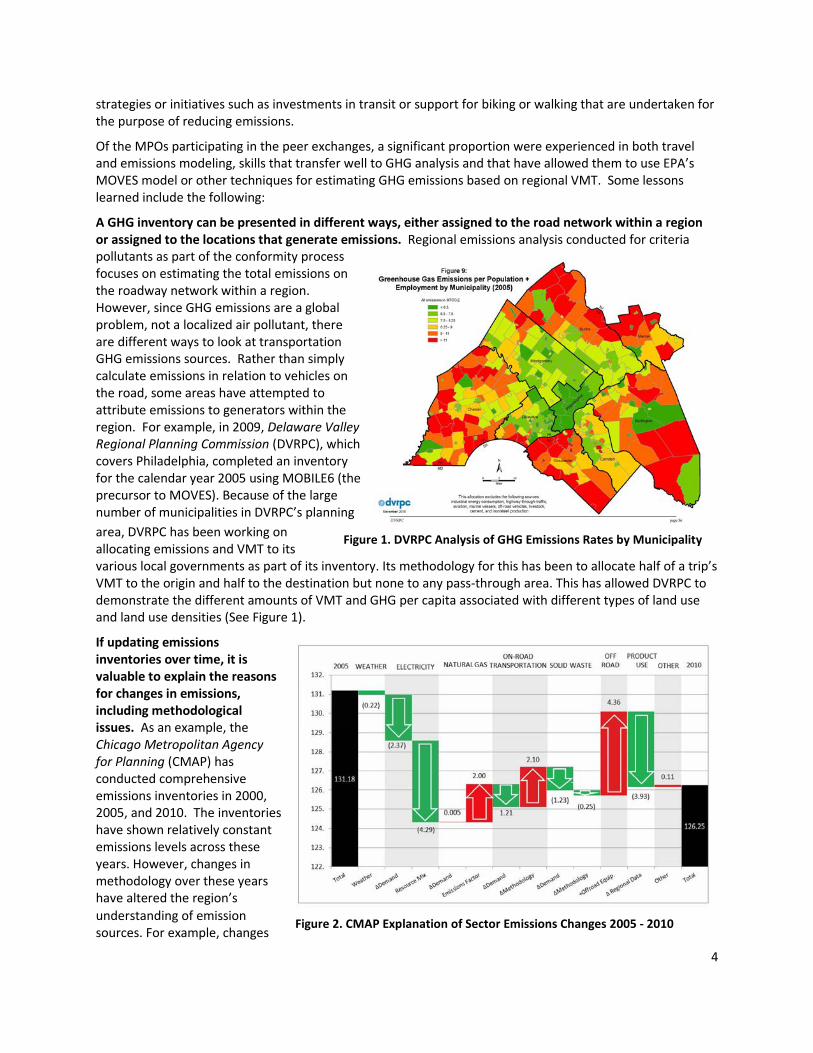
If updating emissions inventories over time, it is valuable to explain the reasons for changes in emissions, including methodological issues. As an example, the Chicago Metropolitan Agency for Planning (CMAP) has conducted comprehensive emissions inventories in 2000, 2005, and 2010. The inventories have shown relatively constant emissions levels across these years. However, changes in methodology over these years have altered the region’s understanding of emission sources. For example, changes
Figure 2. CMAP Explanation of Sector Emissions Changes 2005 - 2010
Figure 1. DVRPC Analysis of GHG Emissions Rates by Municipality

5
in demand for on-road transportation between 2005 and 2010 accounted for a decline in on-road transportation emissions, but this was overwhelmed by the increase in emissions found due to changes in methodology (See Figure 2). It is very valuable to help explain to the public and decisionmakers why emissions estimates have changed: because of actual changes in sources, or due to methodological changes.
In addition to completing inventories, a number of MPOs have analyzed the impact of various transportation emission reduction strategies or scenarios to see what ways might be most effective at reducing emissions. These analyses tend to incorporate a number of different methodologies including MOVES and off-model approaches. For example:
• Metropolitan Washington Council of Governments (MWCOG) analyzed what would be required in order for the region to reduce transportation emissions by 34 percent – the MPO board’s established target. The analysis showed the importance of CAFE standards, variation in CO2 emissions by speed, the future importance of freight in regional emissions, and that many of the region’s trips are short – i.e., candidates for conversion to walking or biking.
• The Atlanta Regional Commission (ARC) examined several scenarios using MOBILE6 (they have since switched to using MOVES), its activity-based travel demand model, and a land use model. The analysis showed that total emissions will likely increase due to population growth, even while per capita emissions are likely to decline in future years.
• Denver Regional Council of Governments has specific emissions and VMT reduction targets set by its board, and so the MPO estimates the potential emissions impacts of projects and incorporates these estimates as it scores projects for inclusion in the Transportation Improvement Program. Boston MPO also incorporated emissions analysis as part of its latest project selection process.
New tools are helping to overcome data and methodology challenges, though issues of uncertainty, compatibility, and comparability between methods remain. Analyzing GHGs for transportation requires large amounts of data and often complex approaches – whether through models or “off-model” analysis. A number of new tools have been or are currently being developed to help States and MPOs consider both current emissions levels, opportunities to improve sustainability, and the impact of investment and policy choices. For example:
• The Energy and Emissions Reduction Policy Analysis Tool (EERPAT) can help with state-level strategy analysis in situations where Sstates would like to examine a large number of emissions reduction options quickly. It does not replace more robust models like EPA’s MOVES model and so can be used rather as a screening tool for MOVES. The tool was adapted from GreenSTEP, which was originally developed by the Oregon DOT. [Available at: http://www.planning.dot.gov/FHWA_tool/default.asp]
• The Infrastructure Voluntary Evaluation Sustainability Tool (INVEST), which has been piloted and tested by several State DOTs and MPOs, helps agencies identify characteristics of sustainable highways and provide information and techniques to assist them with integrating sustainability best practices into highway projects and programs. [Available at: http://www.sustainablehighways.org/]
• A number of MPOs have developed their own complex off-model analyses that are adapted to their region in order to test scenarios. Although spreadsheet based, developing these off-model analyses requires a high level of expertise and can be time intensive for MPOs.
While new tools offer new possibilities for analysis, participants noted that rapid progress in the area of GHG accounting and modeling has meant that older analyses may no longer apply, causing a disconnect between previous understandings of a region’s emissions profile and the current one. For example, while a number of States have performed emissions analysis based on fuel use, many MPOs have created VMT-based

6
inventories. However, the results from these inventories performed using different methodologies often do not match, presenting a challenge for decisionmakers at both the State and MPO levels.
The data challenges illustrate that while improvements in modeling and inventory methodologies are helpful, there is still a high degree of uncertainty as models change and are updated.
4. Implementing GHG Mitigation Strategies MPOs and State DOTs participating in the peer exchanges have been pursuing a range of GHG reduction strategies. This section describes some of the key themes and lessons learned regarding mitigation strategies.
Travel efficiency (e.g., demand management, transit, land use) strategies are a key focus of State DOTs and MPOs. VMT reduction strategies include transit, bicycle and pedestrian infrastructure, and transportation demand management (TDM) to reduce single occupancy vehicle trips, and integrated transportation and land use planning to bring origins and destinations closer together. MPOs present at the exchanges were particularly active in this area.
MPOs expressed significant interest in land use planning and transit investments. Integrated land use and transportation planning emerged as crosscutting theme across the peer exchanges, with MPOs particularly active in encouraging transit-oriented development (TOD). For example:
• The Southern California Association of Government’s most recent regional plan will focus half of its planned growth on three percent of the region’s land area (areas designated as “high quality transit areas” that are within a half-mile of a major transit corridor).
• Central Lane MPO in Eugene, Oregon has an urban growth boundary that helps to concentrate development while preserving areas outside the boundary as natural or agricultural areas.
• The Metropolitan Council in the Twin Cities has developed a tool for developers to assess potential GHG and criteria pollutant impacts of proposed developments and compare different development options.
• The Missoula MPO selected a preferred “Focus Inward” scenario for its most recent regional plan, and altered its transit routes and service to support a new emphasis on increasing downtown density and concentrating growth in urban service areas.
States and MPOs see benefits in less costly investments in non-SOV infrastructure (e.g., complete streets) and demand management. These types of investments do not require as expensive or extensive investments and yield co-benefits associated with public health and livability. For example:
• Chattanooga-Hamilton County Regional Planning Agency has focused on pedestrian improvements, adding bike lanes, launching a bicycle transit system, and will soon launch a GreenTrips incentive program.
• Tri-County Regional Planning Commission in Lansing, Michigan has implemented road diets, roundabouts, signal timing optimization, and installed bike lanes. Between 1988 and 2010, 15 miles of area roads were slimmed from four to three lanes to allow for bicycling.
• Maryland, Pennsylvania, North Carolina, and Vermont all have complete streets policies that require consideration of all users when upgrading or constructing new roads.
7
Vehicle/system operations strategies also can provide important GHG benefits. Vehicle and system operations strategies can improve traffic flow, which reduces transportation emissions by reducing the number of stops and starts a vehicle has to make, and encouraging traffic to move at speeds that optimize vehicle fuel-efficiency. These strategies can include eco-driving, anti-idling, signal timing, high occupancy vehicle (HOV) lanes, or congestion pricing.
While these types of strategies can reduce emissions, implementing some vehicle operations strategies (e.g., eco-driving and anti-idling) requires either significant resources for enforcement or widespread behavioral change. Managed lanes can be complicated to establish particularly when introducing new user fees, revenue sharing arrangements, and other associated coordination challenges between regional organizations. Nevertheless, some examples of vehicle system/operations strategies include:
• Through the U.S. DOT’s Urban Partnership Agreement program, Miami, the Twin Cities, and Seattle have all implemented managed lane systems that allow for improved transit travel time and reliability and have helped to reduce congestion.
• Puget Sound Regional Council included road pricing in all plan alternatives as it created its 2040 long range plan. The plan calls for a phasing in pricing strategies including lane pricing and possibly a VMT-based fee.
• Based on its strategy analysis showing emissions reduction potential, MWCOG launched an eco-driving campaign modeled after the Drive Green Save Green campaign used by North Carolina. MWCOG’s analysis showed that eco-driving was among the most cost-effective strategies to reduce emissions.
• North Central Texas Council of Governments in Dallas encourages local municipalities to pass anti-idling ordinances, which, although created to target criteria air pollutants, also help to reduce GHG emissions as a co-benefit.
State DOTs are particularly interested in implementing construction, maintenance, and facility operations strategies. While MPOs may focus on land use and VMT-reduction strategies within their particular regions, the mitigation options available to State DOTs are somewhat different. For example, few Sstate DOTs plan for or operate transit or engage directly in land use planning in the way that MPOs do. Among peer exchange participants, a number of Sstate DOTs noted their internal efforts at reducing emissions from DOT operations and at DOT facilities. Examples of internal DOT emissions reduction strategies include:
• Maryland DOT has installed LED traffic signals and is implementing a one-million tree initiative to plant trees on the State’s right-of-way.
• Utah DOT was considering a zero-idling policy for construction vehicles and exploring using agency-owned right-of-way for renewable energy generation.
• VTrans uses biofuels in its fleet and has examined installing solar panels on agency-owned facilities.
• Kentucky Transportation Cabinet switched to using LED lighting on roadways.
DOTs mentioned their interest in tools to quantify the emissions reduced from these strategies. Those who were currently engaged in these activities noted that often tracking energy saved or emissions reductions was more complicated than it initially appeared.

8
Fuels and vehicle technology strategies are important for reducing GHG emissions, but State DOTs and MPOs are limited in their ability to address these factors. These strategies include use of alternative fuels, more efficient vehicles, or vehicles powered by electricity. While State DOTs and MPOs tend to be interested in these types of strategies, market forces or national-level regulations surpass their ability to influence technology change or technology development, particularly at the MPO level.
Vehicle efficiency standards (i.e., CAFE standards) are one of the most effective means of reducing transportation emissions, but are set at the Federal level. Multiple MPOs and Sstates noted the importance of nationwide gains in fuel efficiency and vehicle technologies in reducing transportation emissions. All MPOs conducting emissions forecasts showed the vast majority of emissions reductions for future years coming from these sources, with other strategies accounting for important but much smaller reductions. This limits the impact that State DOTs and MPOs can have on transportation emissions.
Some States and MPOs have programs to encourage use of alternative fuel or more efficient vehicles, particularly for fleets. Though often implemented to reduce criteria air pollutant emissions, a number of programs help fleet managers to increase the fuel efficiency of delivery trucks or other large vehicles with large diesel engines. For example, Houston-Galveston Area Council has a loan program to help drayage truck owners upgrade to more efficient engines, and its Clean Cities Coalition helps to form public private partnerships to promote use of alternative fuels, hybrid technologies, and fuel-efficient vehicles.
Both DOTs and MPOs are interested in supporting and planning for electric vehicles (EVs) through infrastructure provision. However, predicting EV penetration is very difficult, since it depends on a number of forces outside of DOT control – the success of the technology, its market penetration, electricity prices, and prices for competing technologies to name a few. Nevertheless, a number of Sstates and regions are beginning to plan for and deploy EV infrastructure, including Philadelphia, San Francisco, Kansas City, and the State of Vermont. Mid-America Regional Council in Kansas City is able to partner with local manufacturers of EV batteries to work on planning for deployment.
Lessons learned regarding implementing and communicating about DOT and MPO strategies. MPOs and DOTs discussed challenges associated with communicating strategies to the public and decisionmakers and shared their successes as well. Some of the themes from these discussions were:
Climate change strategies often have multiple co-benefits. Many of the transportation GHG reduction strategies available to MPOs and State DOTs have multiple benefits for society. For instance, vehicle efficiency strategies (e.g., land use strategies, increasing walking and bicycling) often help to increase physical activity, reduce household transportation budgets, and reduce congestion and air pollution, and operations strategies often reduce traffic congestion and delay, and improve system reliability. DOT efforts to reduce energy use in construction, maintenance, and facility operation also can save money out of tight budgets. In many areas, these issues are more salient than climate change mitigation, and so transportation agencies may either be taking action primarily for those benefits (i.e., working to reduce congestion and viewing GHG emissions reduction as a secondary benefit) or may choose to emphasize co-benefits in presenting their activities to the public.
Even in locations where climate change mitigation is not a priority, transportation agencies can focus on win-win, no regrets solutions. Given the many co-benefits of GHG reduction strategies, even in locations where climate change is not a priority, there are opportunities to develop GHG strategies that decision-makers can advance for multiple reasons. For example, East-West Gateway Council of Governments in St. Louis participates actively in the Department of Energy Clean Cities Program and is promoting TOD around its

9
transit stations, despite not having an active climate change program. Instead these activities are aimed at economic development and improved air quality.
Transportation agencies should communicate with messages that resonate with the public and elected officials, and appropriately tailor messages to speak to regional priorities.
• Some areas have strong political support for climate change- or environment-related initiatives. For these areas, MPOs promote their activities in terms of their GHG emissions benefits. For instance, the Metropolitan Transportation Commission in San Francisco has a Climate Initiatives program that actively presents its activities to the public and raises awareness of steps they can take to reduce GHG emissions.
• Other MPOs represented spoke of communicating about climate change in the context of regionally important issues. For instance, constituents of the Baltimore Metropolitan Council and the State of Maryland place a high value on the health and welfare of the Chesapeake Bay. Therefore, highlighting the benefits of strategies (e.g., such as those focused on reducing VMT and sprawl) to help preserve or clean up the Bay can be met with more enthusiasm.
• Communicating the climate change benefits of transportation investments can be a particular challenge. San Diego Association of Governments has found that it is critical to demonstrate the importance of these investments clearly to the public as early as possible.
• Other areas are currently facing challenges that are perceived as more pressing, particularly given the current economic climate. These areas focus on cost savings or economic growth potential from emissions reduction strategies. These can include household savings from reduced fuel use, economic benefits of transit-oriented development, or agency budget savings from changing light bulbs. MPOs and State DOTs may also find that more tangible environmental concerns resonate well with constituents, such as visible air pollution (i.e., smog).
Planning processes themselves can help to achieve buy-in. A strategic planning process that incorporates interests from a wide variety of stakeholders and the public lends legitimacy to subsequent initiatives under that plan. Making sure that plans adequately address the concerns of others can save time later as decisionmakers feel more comfortable and receive less push-back when implementing projects or programs. For example:
• When developing its land use plan for its current long range plan, Southern California Association of Governments reached out to its many municipalities. The MPO asked for each municipality’s land use and growth predictions and worked with them to show how they could shift the growth toward transit and existing corridors. This approach both respected local jurisdictions and allows the region to move forward with transit-oriented growth.
• In 2000, Tri-County Regional Planning Commission conducted a visioning process that engaged communities in its three-county area in generating, vetting, and approving priorities and
Figure 3. Tri-County RPC's Regional Growth Vision

10
actions to achieve a regional vision that included reducing congestion, increasing non-SOV options, and preserving agricultural land. The process to achieve buy-in has continued to help the MPO as it works to implement projects from the vision.
These examples illustrate the importance of communication strategies, whether communicating with decisionmakers and governing bodies or with the general public.
5. Future Needs and Participant Recommendations MPOs and DOTs expressed a number of needs from and recommendations for FHWA, including tools that would help them to both quantify and analyze their emissions and national policy or guidance to help MPOs and DOTs anticipate future Federal requirements.
MPOs and State DOTs are interested in tools and best practices for communicating with the public about climate change and transportation. At all three peer exchanges, participants mentioned challenges they faced in communicating effectively with the public. Participants were interested in seeing examples of materials that peer organizations had prepared in order to develop their own messaging, although they also recognized the importance of tailoring these messages to their specific contexts. An online clearinghouse of communications materials that allowed users to sort by message or program type could be particularly helpful.
MPOs and State DOTs are interested in tools to help improve strategy analysis and selection. MPOs and State DOTs are interested in assessing the impacts of their activities and plans, and some also expressed concern at the wide variety of techniques currently used to analyze emissions impacts and the extent to which these can (or cannot) be compared. Specific interests among participants included:
• State DOTs are interested in tools that enable them to evaluate the GHG reductions from DOT construction and maintenance activities and statewide policies.
• MPOs would like to see examples of best practices in GHG analysis and performance measurement.
• Participants would also like help in applying existing modeling and analysis tools, such as through the FHWA Resource Center, and guidance for collecting the data needed for emissions analysis.
• Participants would like to see an update to FHWA’s publication on the multi-pollutant emissions benefits of transportation strategies, addressing the GHG emissions benefits of these strategies and effects on other pollutants, based on the MOVES model.
MPOs and State DOTs would like greater leadership and direction on policy issues such as freight and how best to incorporate climate change in regional plans. Peer exchange participants mentioned several areas where a more coordinated national policy or a clearer understanding of national funding priorities would be helpful as they plan for the future.
• MPOs see a need for national coordination of freight policy, since the current competitive nature of ports and freight hubs makes planning for freight traffic and accommodating it particularly difficult. [Note: Since the time of the peer exchanges, Federal legislation has called for a national freight policy and recommended creation of State freight advisory boards and State freight plans.]
• State DOTs and MPOs who receive CMAQ funding are interested in how these funds are dispensed across the country and would be interested in a report presenting the funded items broken down by project category.

11
• At the time of the peer exchanges, the lack of a Federal transportation legislation concerned DOTs and MPOs, whose programs and funding levels seemed tenuous. MPOs and DOTs expressed interest in guidance and an improved understanding of potential requirements for GHG analysis and incorporation of climate change in their plans.

Appendix A: Participant List

Appendix A
FHWA Climate Change Mitigation Peer Exchange
Complete Participant Lists
The Role of State DOTs in Climate Change Mitigation
Baltimore, Maryland
June 14-15, 2011
Name Affiliation Email
Participants
Terry Arellano North Carolina DOT [email protected]
Kevin Burgess FHWA - West Virginia Division [email protected]
Gina Campoli Vermont Agency of Transportation [email protected]
Chris Cole Vermont Agency of Transportation [email protected]
Gary Fawver Pennsylvania DOT [email protected]
Elizabeth Habic Maryland State Highway Authority [email protected]
Dan Johnson FHWA Resource Center [email protected]
Perry Keller West Virginia DOT [email protected]
Jesse Mayes Kentucky Transportation Cabinet [email protected]
Perry McCutcheon West Virginia DOT [email protected]
Matthew Perlik Ohio DOT [email protected]
Laura Rinehart West Virginia DOT [email protected]
Tim Sedosky West Virginia DOT [email protected]
Brandon Weston Utah DOT [email protected]
Presenters and Event Organizers
Diane Turchetta FHWA – Main Office [email protected]
Caroline Paulsen AASHTO [email protected]
Michael Grant ICF International [email protected]
Sonya Suter ICF International [email protected]
Appendix A
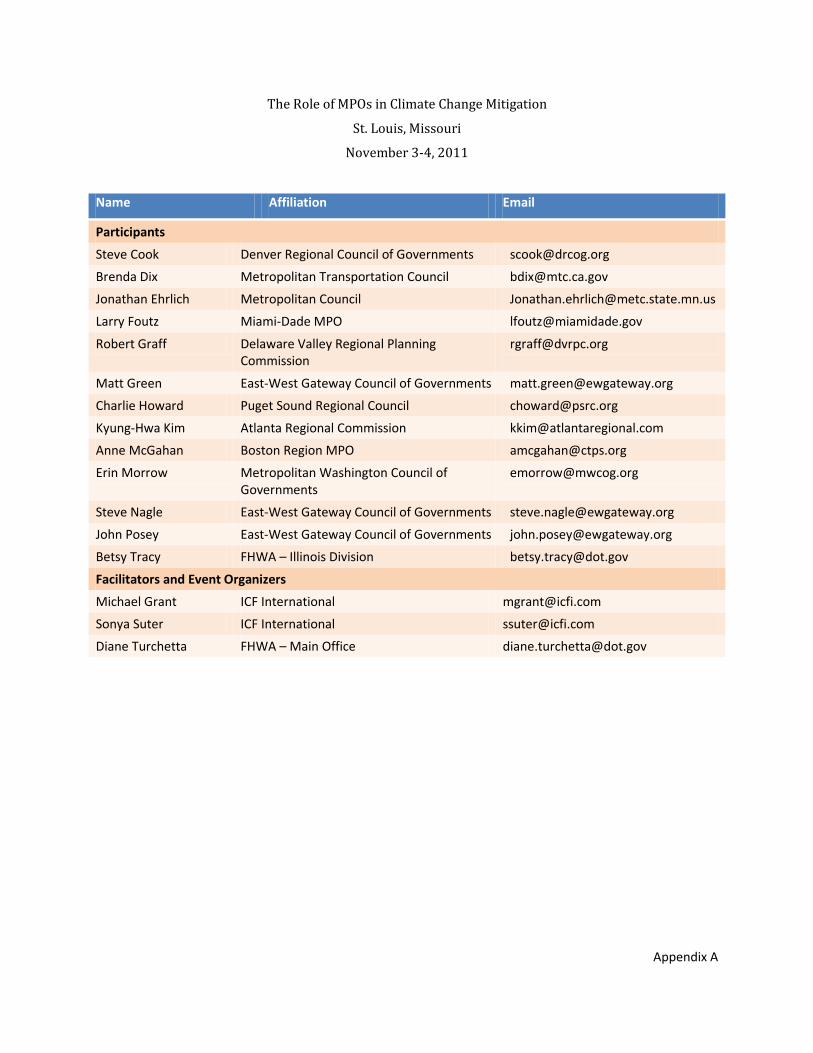
The Role of MPOs in Climate Change Mitigation
St. Louis, Missouri
November 3-4, 2011
Name Affiliation Email
Participants
Steve Cook Denver Regional Council of Governments [email protected]
Brenda Dix Metropolitan Transportation Council [email protected]
Jonathan Ehrlich Metropolitan Council [email protected]
Larry Foutz Miami-Dade MPO [email protected]
Robert Graff Delaware Valley Regional Planning Commission
Matt Green East-West Gateway Council of Governments [email protected]
Charlie Howard Puget Sound Regional Council [email protected]
Kyung-Hwa Kim Atlanta Regional Commission [email protected]
Anne McGahan Boston Region MPO [email protected]
Erin Morrow Metropolitan Washington Council of Governments
Steve Nagle East-West Gateway Council of Governments [email protected]
John Posey East-West Gateway Council of Governments [email protected]
Betsy Tracy FHWA – Illinois Division [email protected]
Facilitators and Event Organizers
Michael Grant ICF International [email protected]
Sonya Suter ICF International [email protected]
Diane Turchetta FHWA – Main Office [email protected]
Appendix A
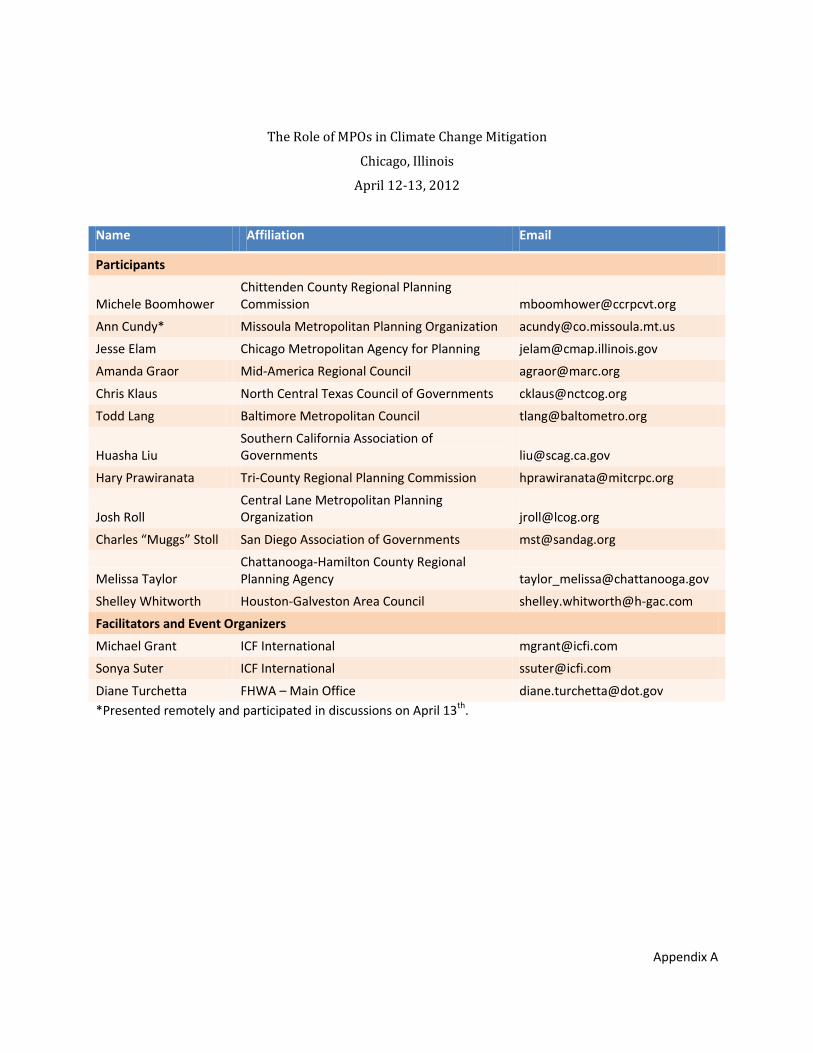
The Role of MPOs in Climate Change Mitigation
Chicago, Illinois
April 12-13, 2012
Name Affiliation Email
Participants
Michele Boomhower Chittenden County Regional Planning Commission [email protected]
Ann Cundy* Missoula Metropolitan Planning Organization [email protected]
Jesse Elam Chicago Metropolitan Agency for Planning [email protected]
Amanda Graor Mid-America Regional Council [email protected]
Chris Klaus North Central Texas Council of Governments [email protected]
Todd Lang Baltimore Metropolitan Council [email protected]
Huasha Liu Southern California Association of Governments [email protected]
Hary Prawiranata Tri-County Regional Planning Commission [email protected]
Josh Roll Central Lane Metropolitan Planning Organization [email protected]
Charles “Muggs” Stoll San Diego Association of Governments [email protected]
Melissa Taylor Chattanooga-Hamilton County Regional Planning Agency [email protected]
Shelley Whitworth Houston-Galveston Area Council [email protected]
Facilitators and Event Organizers
Michael Grant ICF International [email protected]
Sonya Suter ICF International [email protected]
Diane Turchetta FHWA – Main Office [email protected] *Presented remotely and participated in discussions on April 13th.

Appendix B: Sample Agenda

Appendix B
FHWA Climate Change Mitigation Peer Exchange
Sample Agenda
Day 1
9:00 AM Welcome and Purpose • Introductions • Presentation of Current FHWA Initiatives (Diane Turchetta)
9:45 AM Current Efforts to Integrate GHG Emissions into Transportation Planning - National context (Michael Grant) - Highlights of MPO/State DOT experiences
10:45 AM Break
11:00 AM Challenges and Opportunities for Addressing Climate Change in the Planning Process – Roundtable Discussion
11:45 AM Lunch Break
12:45 PM GHG Analysis in Planning (Inventories, Forecasts, and Methodologies) - Brief Overview (Michael Grant) - Highlights of MPO/State DOT experiences and discussion
2:30 PM Break
2:45 PM Greenhouse Gas Emissions Reduction Strategies, and Incorporation into the Planning Process - Brief Overview of Strategies (Michael Grant) - Highlights of MPO/State DOT experiences and discussion
3:45 PM Break
4:00 PM Wrap-up Discussion – Key Issues, Other Topics
4:30 PM Adjourn

Appendix B
Day 2
8:00 AM Brief Recap from Day 1
8:20 AM Co-benefits of climate change mitigation strategies and communicating about climate change. - Overview by Michael Grant - Highlights of MPO/State DOT experiences and discussion
9:45 AM Break
10:00 AM GHG Mitigation Strategies – additional discussion. - Roundtable discussion of new or emerging mitigation strategies (e.g., electric vehicle infrastructure, sequestration etc.).
11:00 AM MPO Needs – What do you need from FHWA?
11:45 AM Adjourn

Appendix C: Resources
Appendix C
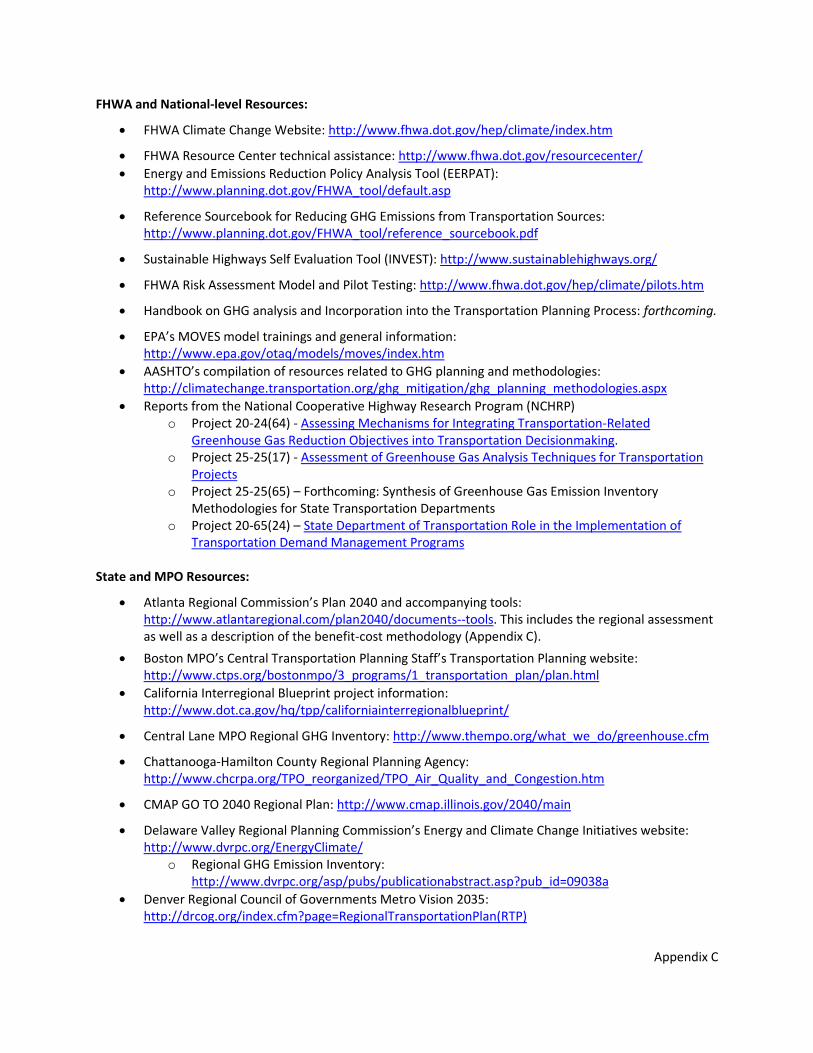
FHWA and National-level Resources:
• FHWA Climate Change Website: http://www.fhwa.dot.gov/hep/climate/index.htm
• FHWA Resource Center technical assistance: http://www.fhwa.dot.gov/resourcecenter/ • Energy and Emissions Reduction Policy Analysis Tool (EERPAT):
http://www.planning.dot.gov/FHWA_tool/default.asp
• Reference Sourcebook for Reducing GHG Emissions from Transportation Sources: http://www.planning.dot.gov/FHWA_tool/reference_sourcebook.pdf
• Sustainable Highways Self Evaluation Tool (INVEST): http://www.sustainablehighways.org/
• FHWA Risk Assessment Model and Pilot Testing: http://www.fhwa.dot.gov/hep/climate/pilots.htm
• Handbook on GHG analysis and Incorporation into the Transportation Planning Process: forthcoming.
• EPA’s MOVES model trainings and general information: http://www.epa.gov/otaq/models/moves/index.htm
• AASHTO’s compilation of resources related to GHG planning and methodologies: http://climatechange.transportation.org/ghg_mitigation/ghg_planning_methodologies.aspx
• Reports from the National Cooperative Highway Research Program (NCHRP) o Project 20-24(64) - Assessing Mechanisms for Integrating Transportation-Related
Greenhouse Gas Reduction Objectives into Transportation Decisionmaking. o Project 25-25(17) - Assessment of Greenhouse Gas Analysis Techniques for Transportation
Projects o Project 25-25(65) – Forthcoming: Synthesis of Greenhouse Gas Emission Inventory
Methodologies for State Transportation Departments o Project 20-65(24) – State Department of Transportation Role in the Implementation of
Transportation Demand Management Programs
State and MPO Resources:
• Atlanta Regional Commission’s Plan 2040 and accompanying tools: http://www.atlantaregional.com/plan2040/documents--tools. This includes the regional assessment as well as a description of the benefit-cost methodology (Appendix C).
• Boston MPO’s Central Transportation Planning Staff’s Transportation Planning website: http://www.ctps.org/bostonmpo/3_programs/1_transportation_plan/plan.html
• California Interregional Blueprint project information: http://www.dot.ca.gov/hq/tpp/californiainterregionalblueprint/
• Central Lane MPO Regional GHG Inventory: http://www.thempo.org/what_we_do/greenhouse.cfm
• Chattanooga-Hamilton County Regional Planning Agency: http://www.chcrpa.org/TPO_reorganized/TPO_Air_Quality_and_Congestion.htm
• CMAP GO TO 2040 Regional Plan: http://www.cmap.illinois.gov/2040/main
• Delaware Valley Regional Planning Commission’s Energy and Climate Change Initiatives website: http://www.dvrpc.org/EnergyClimate/
o Regional GHG Emission Inventory: http://www.dvrpc.org/asp/pubs/publicationabstract.asp?pub_id=09038a
• Denver Regional Council of Governments Metro Vision 2035: http://drcog.org/index.cfm?page=RegionalTransportationPlan(RTP)
Appendix C
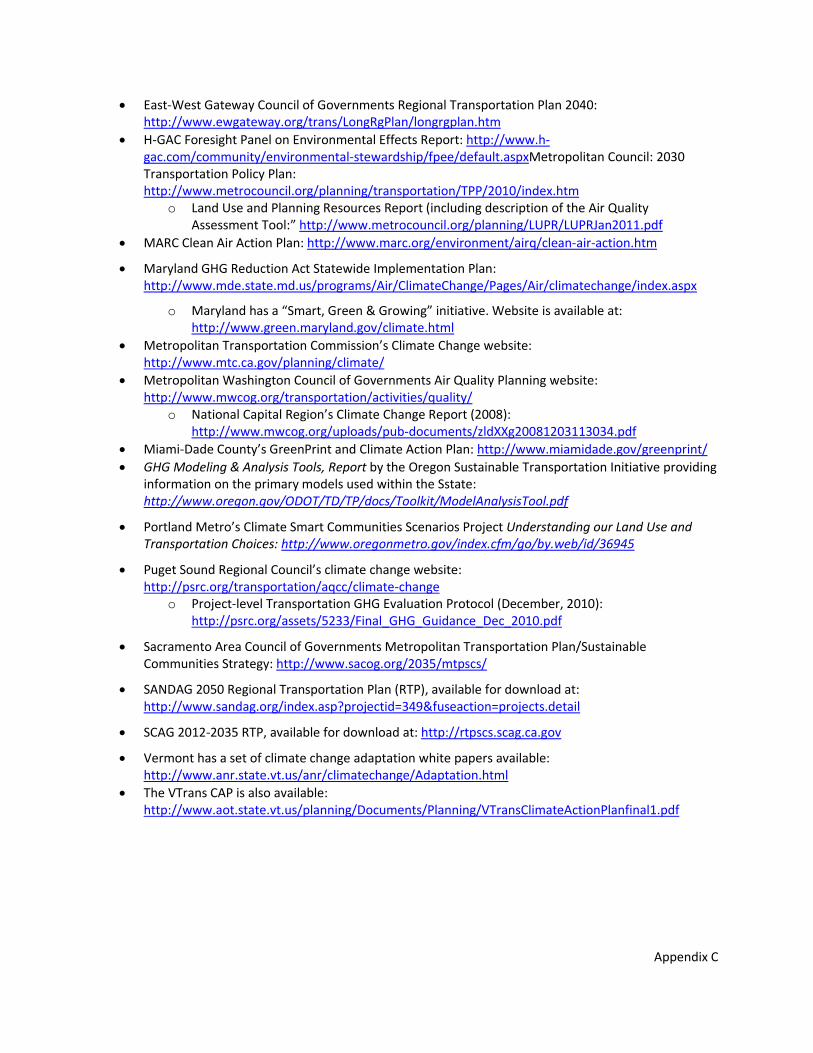
• East-West Gateway Council of Governments Regional Transportation Plan 2040: http://www.ewgateway.org/trans/LongRgPlan/longrgplan.htm
• H-GAC Foresight Panel on Environmental Effects Report: http://www.h-gac.com/community/environmental-stewardship/fpee/default.aspxMetropolitan Council: 2030 Transportation Policy Plan: http://www.metrocouncil.org/planning/transportation/TPP/2010/index.htm
o Land Use and Planning Resources Report (including description of the Air Quality Assessment Tool:” http://www.metrocouncil.org/planning/LUPR/LUPRJan2011.pdf
• MARC Clean Air Action Plan: http://www.marc.org/environment/airq/clean-air-action.htm
• Maryland GHG Reduction Act Statewide Implementation Plan: http://www.mde.state.md.us/programs/Air/ClimateChange/Pages/Air/climatechange/index.aspx
o Maryland has a “Smart, Green & Growing” initiative. Website is available at: http://www.green.maryland.gov/climate.html
• Metropolitan Transportation Commission’s Climate Change website: http://www.mtc.ca.gov/planning/climate/
• Metropolitan Washington Council of Governments Air Quality Planning website: http://www.mwcog.org/transportation/activities/quality/
o National Capital Region’s Climate Change Report (2008): http://www.mwcog.org/uploads/pub-documents/zldXXg20081203113034.pdf
• Miami-Dade County’s GreenPrint and Climate Action Plan: http://www.miamidade.gov/greenprint/ • GHG Modeling & Analysis Tools, Report by the Oregon Sustainable Transportation Initiative providing
information on the primary models used within the Sstate: http://www.oregon.gov/ODOT/TD/TP/docs/Toolkit/ModelAnalysisTool.pdf
• Portland Metro’s Climate Smart Communities Scenarios Project Understanding our Land Use and Transportation Choices: http://www.oregonmetro.gov/index.cfm/go/by.web/id/36945
• Puget Sound Regional Council’s climate change website: http://psrc.org/transportation/aqcc/climate-change
o Project-level Transportation GHG Evaluation Protocol (December, 2010): http://psrc.org/assets/5233/Final_GHG_Guidance_Dec_2010.pdf
• Sacramento Area Council of Governments Metropolitan Transportation Plan/Sustainable Communities Strategy: http://www.sacog.org/2035/mtpscs/
• SANDAG 2050 Regional Transportation Plan (RTP), available for download at: http://www.sandag.org/index.asp?projectid=349&fuseaction=projects.detail
• SCAG 2012-2035 RTP, available for download at: http://rtpscs.scag.ca.gov
• Vermont has a set of climate change adaptation white papers available: http://www.anr.state.vt.us/anr/climatechange/Adaptation.html
• The VTrans CAP is also available: http://www.aot.state.vt.us/planning/Documents/Planning/VTransClimateActionPlanfinal1.pdf